Thaps_bicluster_0160 Residual: 0.28
Thalassiosira pseudonana
| Title | Residual | Model version | Organism |
|---|---|---|---|
| Thaps_bicluster_0160 | 0.28 | Thalassiosira pseudonana |
" class="views-fluidgrid-wrapper clear-block">
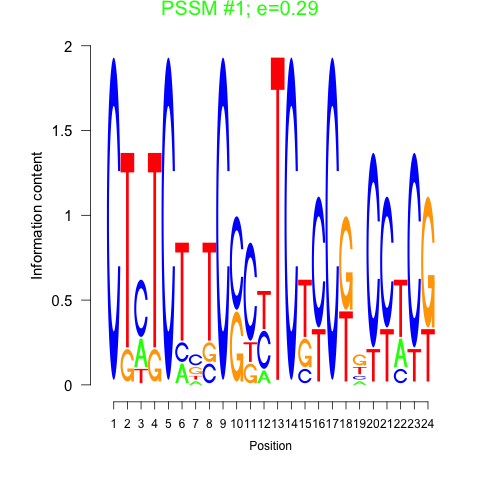
Motif 1 
Motif 2 

Displaying 1 - 18 of 18
" class="views-fluidgrid-wrapper clear-block">
14192 PLN02449
22863 COG1026
24887 CysH
25933 tpt
261422 (MAP4) MetAP1
263427 PLN02372
264007 NAD_binding_10
269777 (LTA4) leuko_A4_hydro
270338 hypothetical protein
31006 RaiA
31829 CBS_like
32261 DUF2237
34551 60KD_IMP
35409 plant_peroxidase_like superfamily
35684 dak_ATP
40193 NA
4700 hypothetical protein
574 PRK05444
| GO ID | Go Term | p-value | q-value | Cluster |
|---|---|---|---|---|
| GO:0006071 | glycerol metabolism | 0.00578093 | 1 | Thaps_bicluster_0160 |
| GO:0006535 | cysteine biosynthesis from serine | 0.0115308 | 1 | Thaps_bicluster_0160 |
| GO:0016114 | terpenoid biosynthesis | 0.0115308 | 1 | Thaps_bicluster_0160 |
| GO:0051205 | protein insertion into membrane | 0.0115308 | 1 | Thaps_bicluster_0160 |
| GO:0006783 | heme biosynthesis | 0.0115308 | 1 | Thaps_bicluster_0160 |
| GO:0006508 | proteolysis and peptidolysis | 0.0466195 | 1 | Thaps_bicluster_0160 |
| GO:0006979 | response to oxidative stress | 0.0673557 | 1 | Thaps_bicluster_0160 |
| GO:0008152 | metabolism | 0.107438 | 1 | Thaps_bicluster_0160 |
| GO:0006810 | transport | 0.419404 | 1 | Thaps_bicluster_0160 |
| GO:0006118 | electron transport | 0.547503 | 1 | Thaps_bicluster_0160 |
Comments