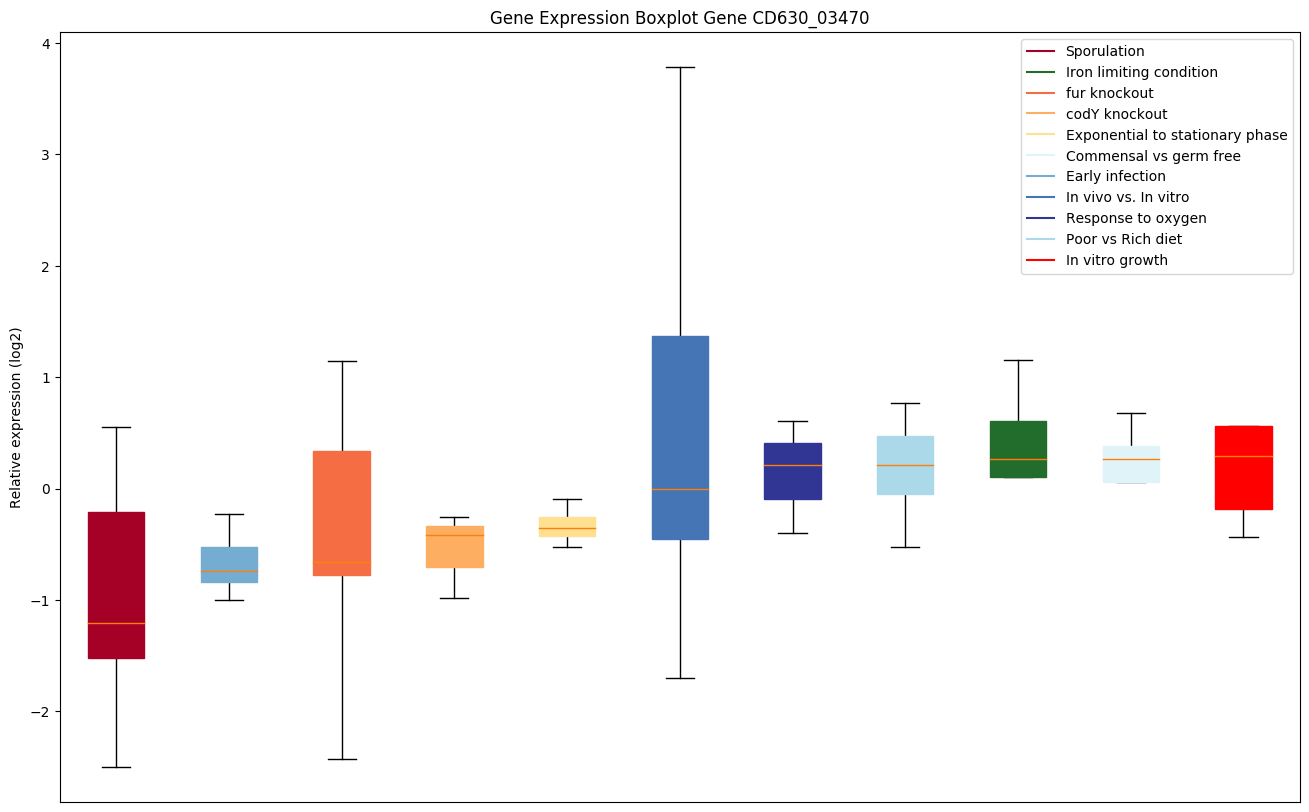
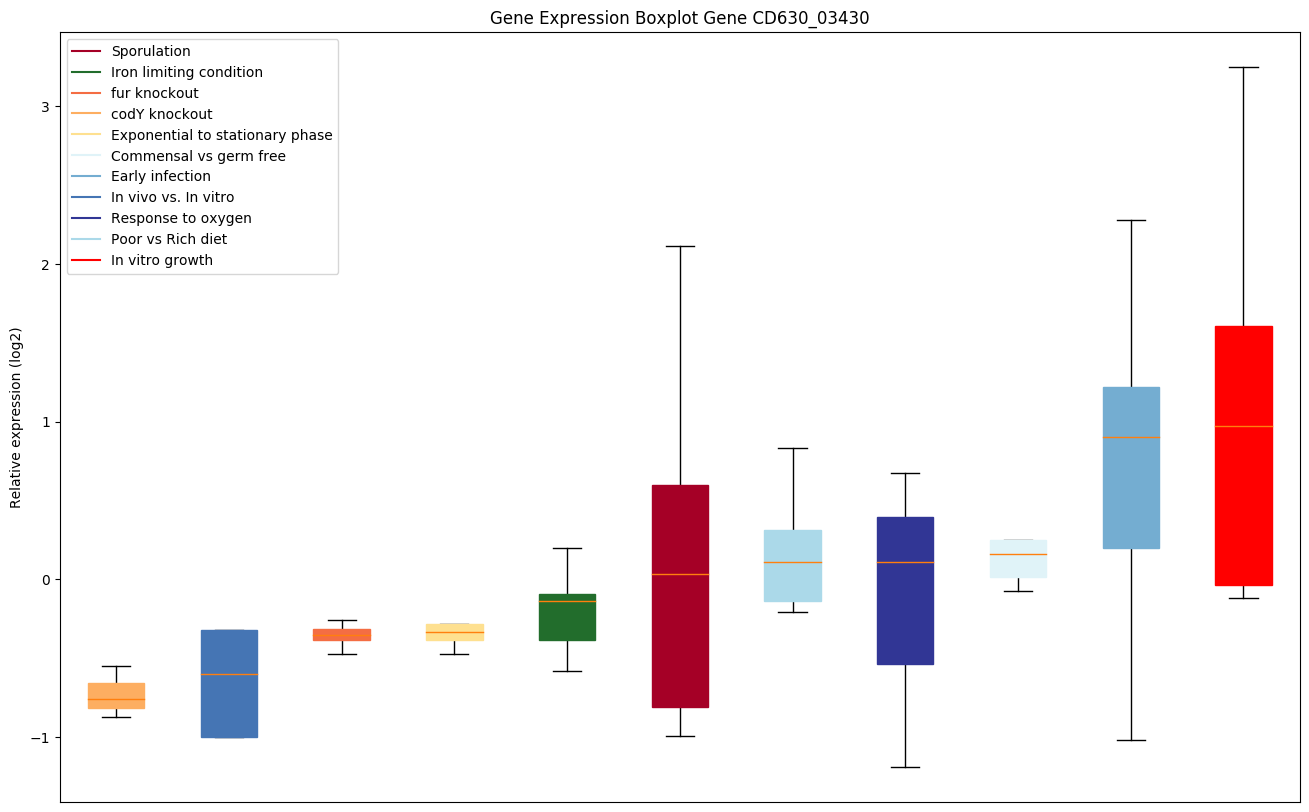
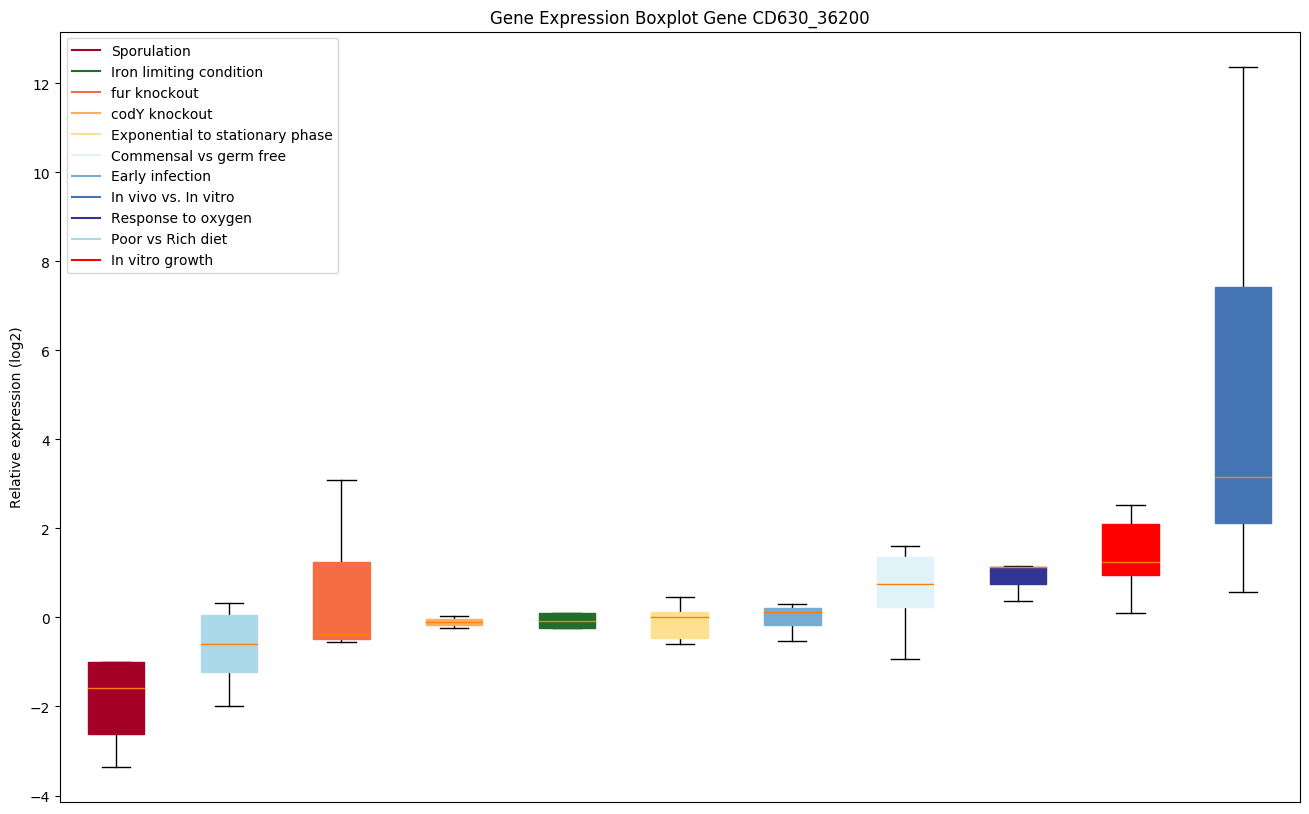
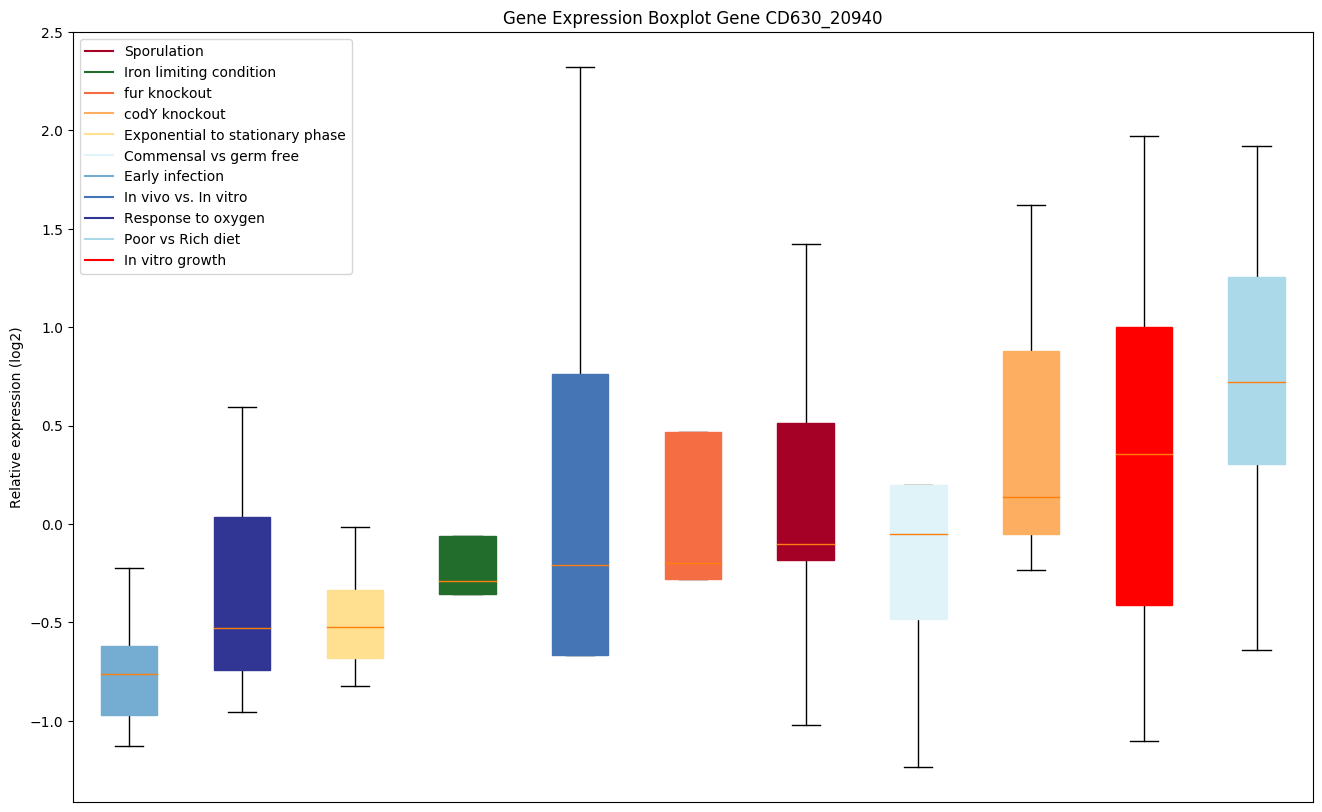
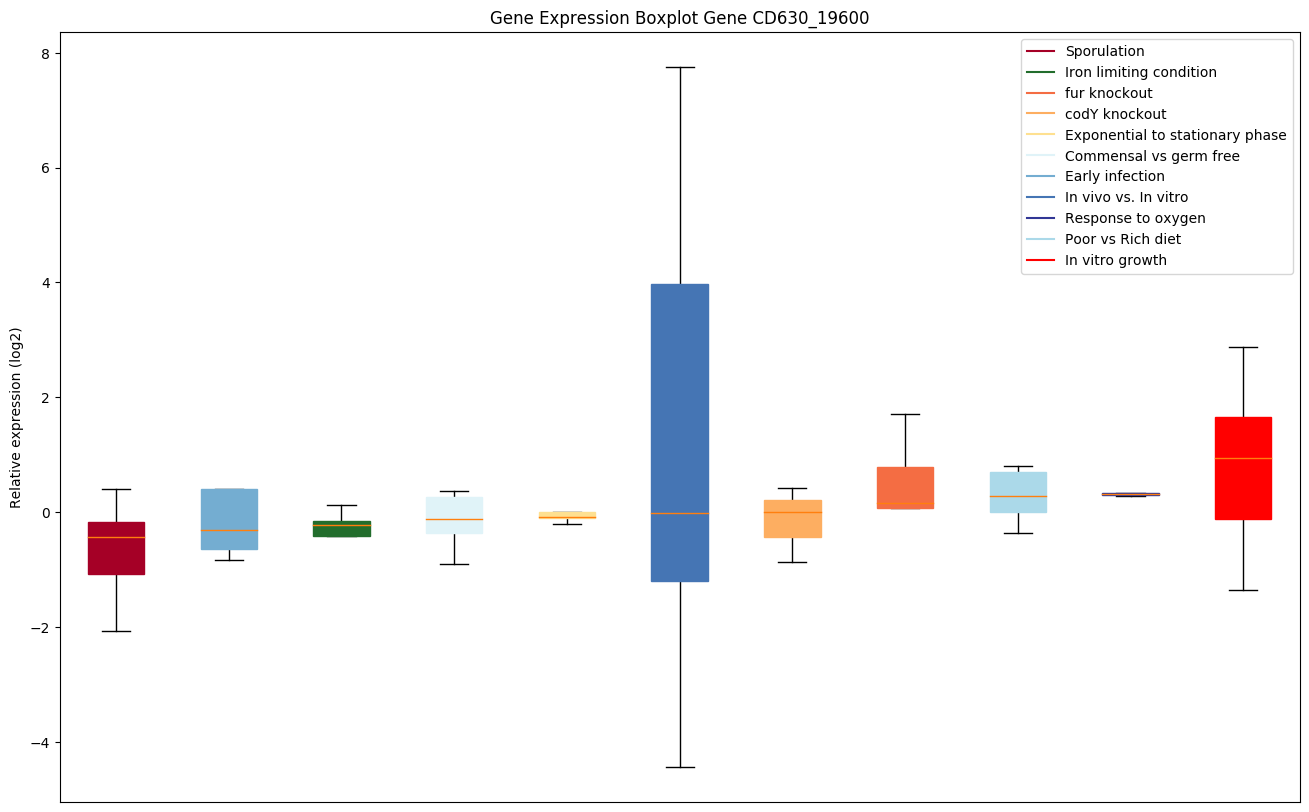
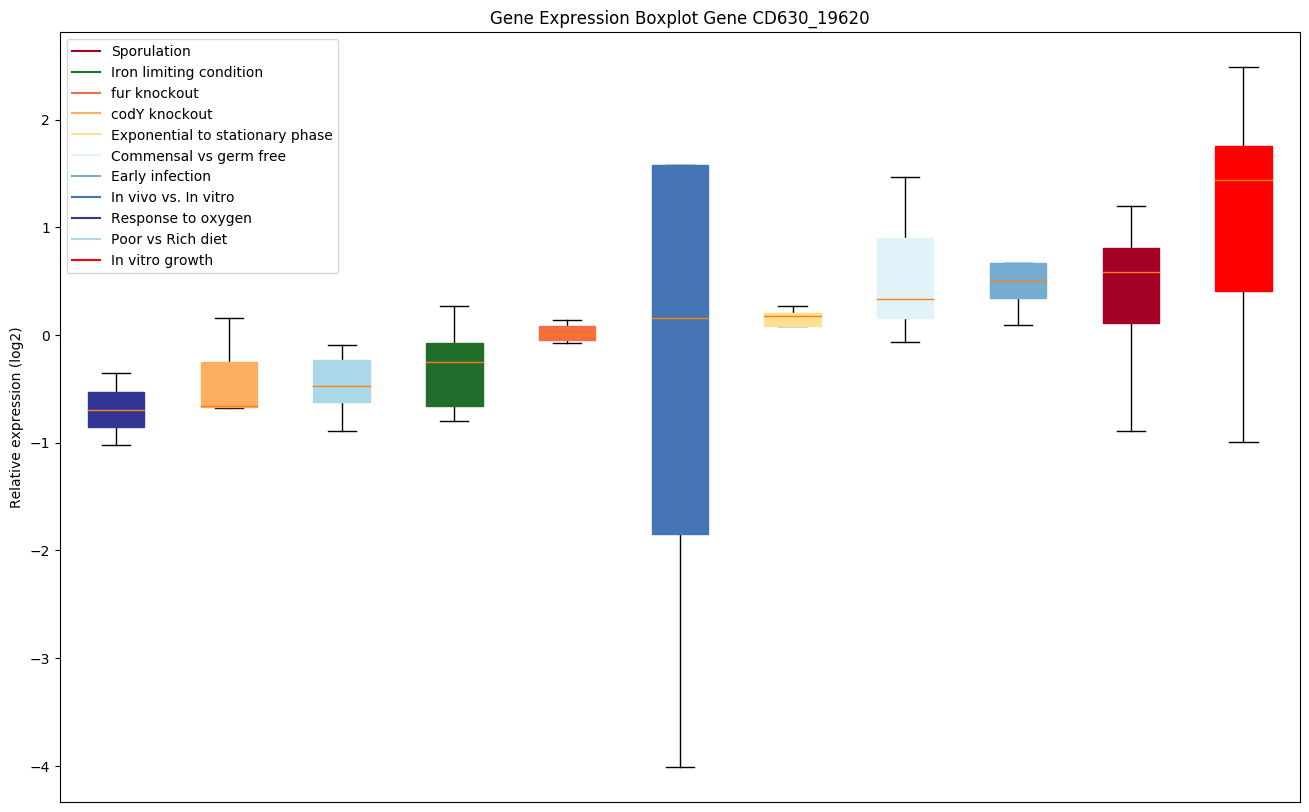
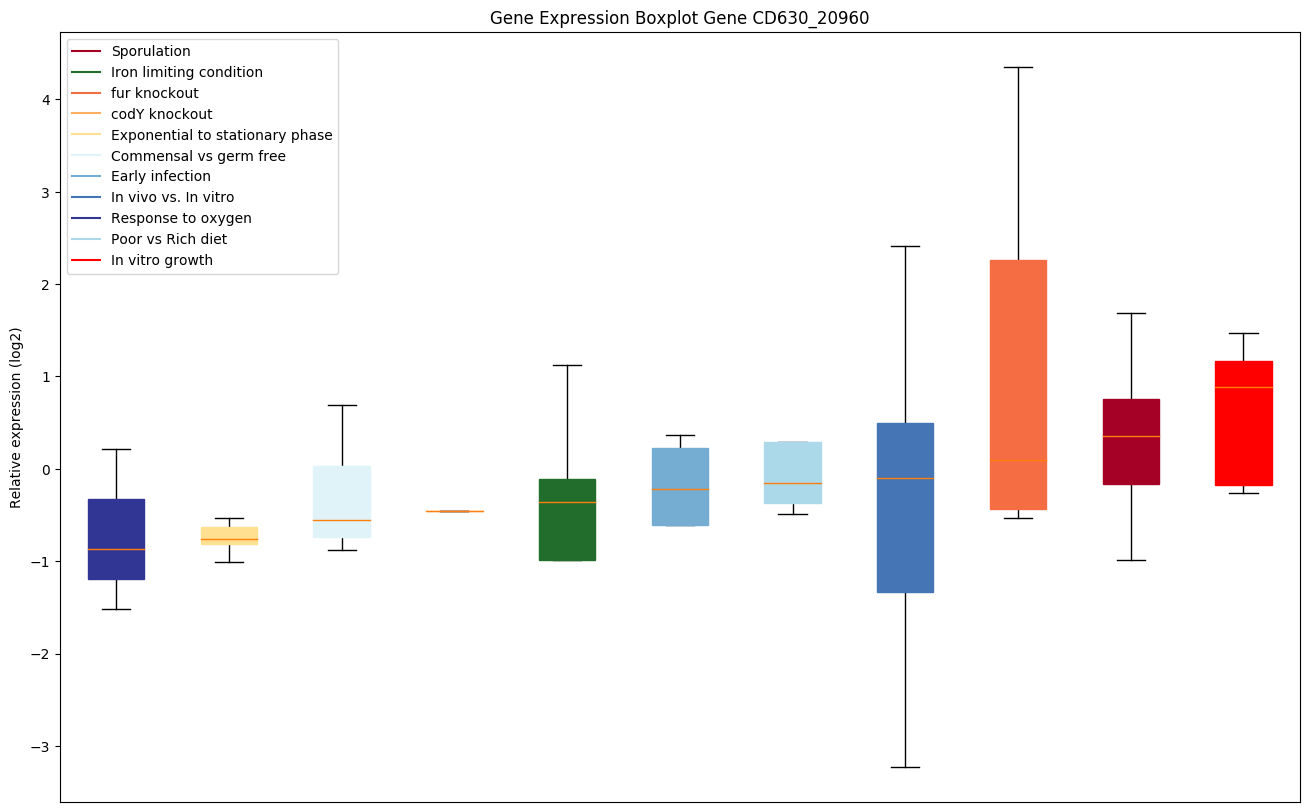
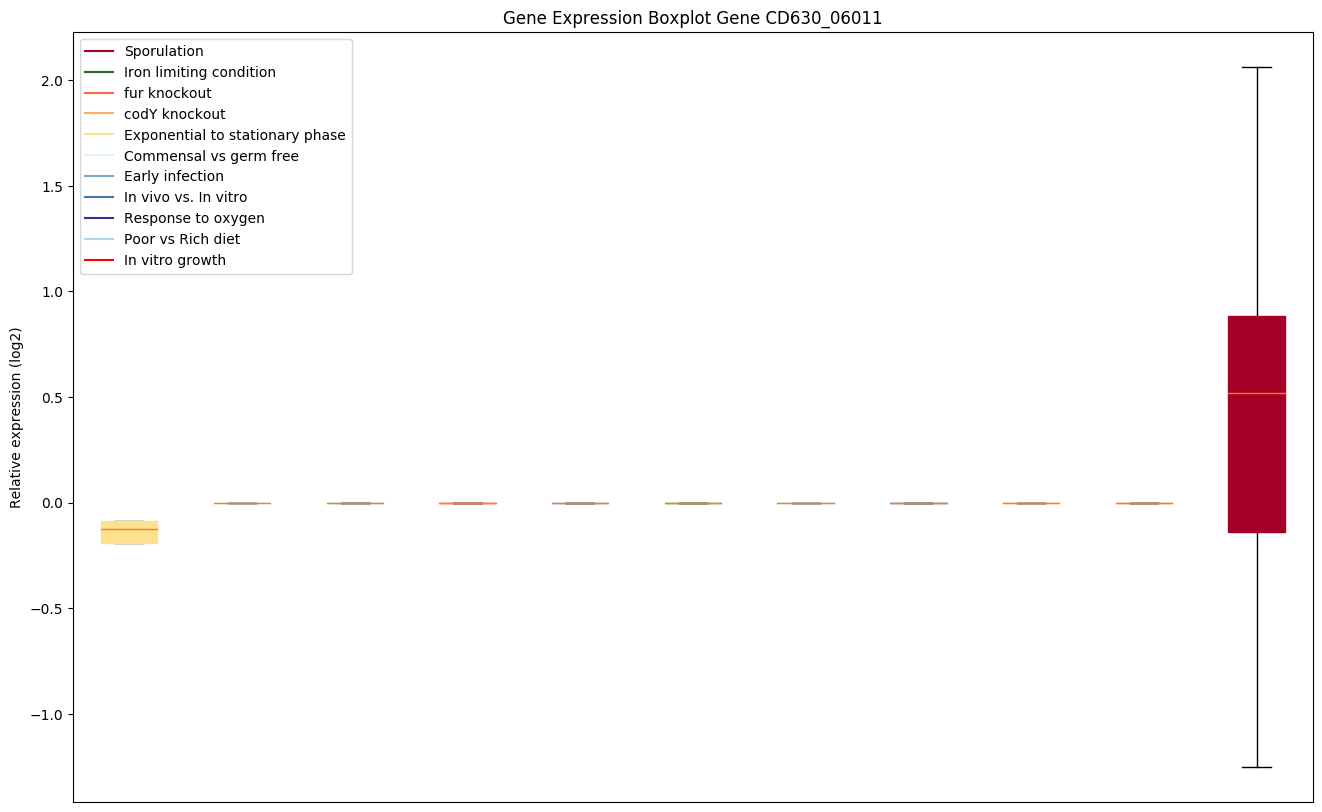
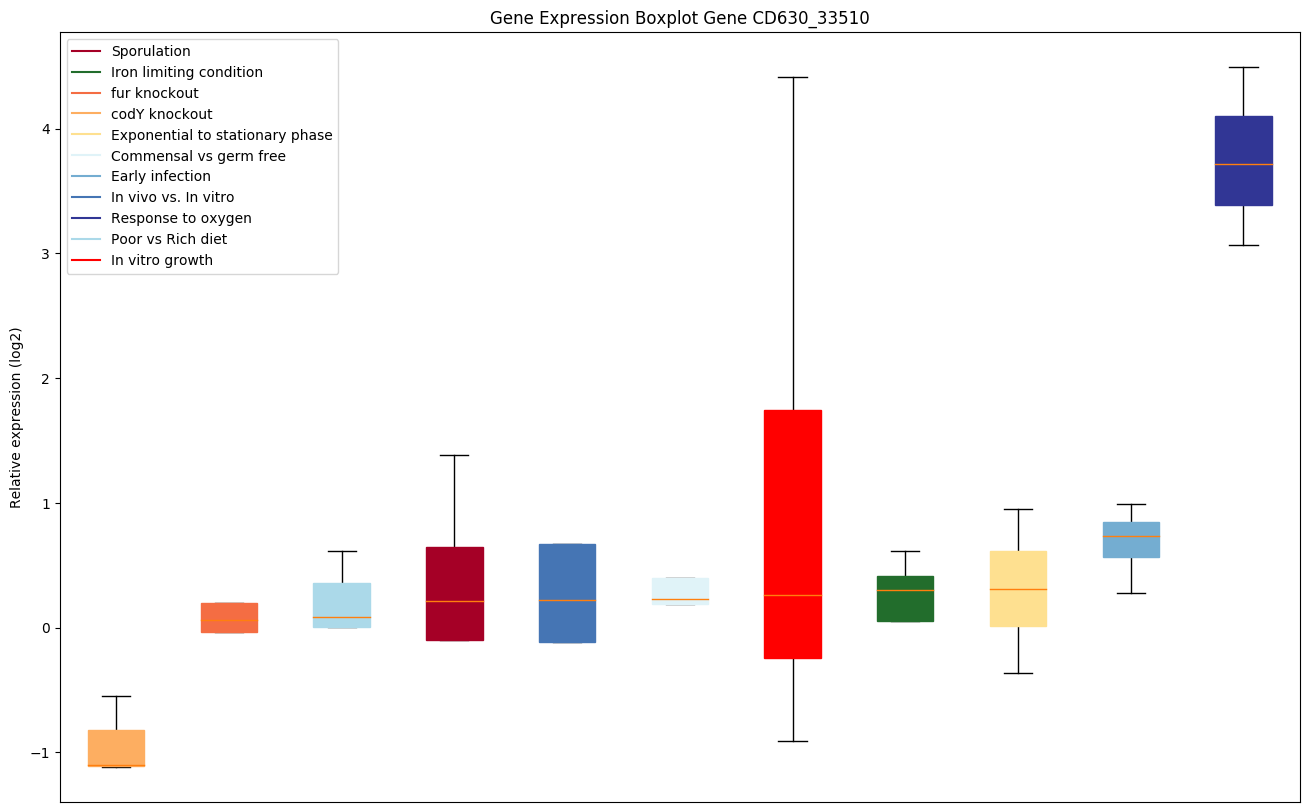
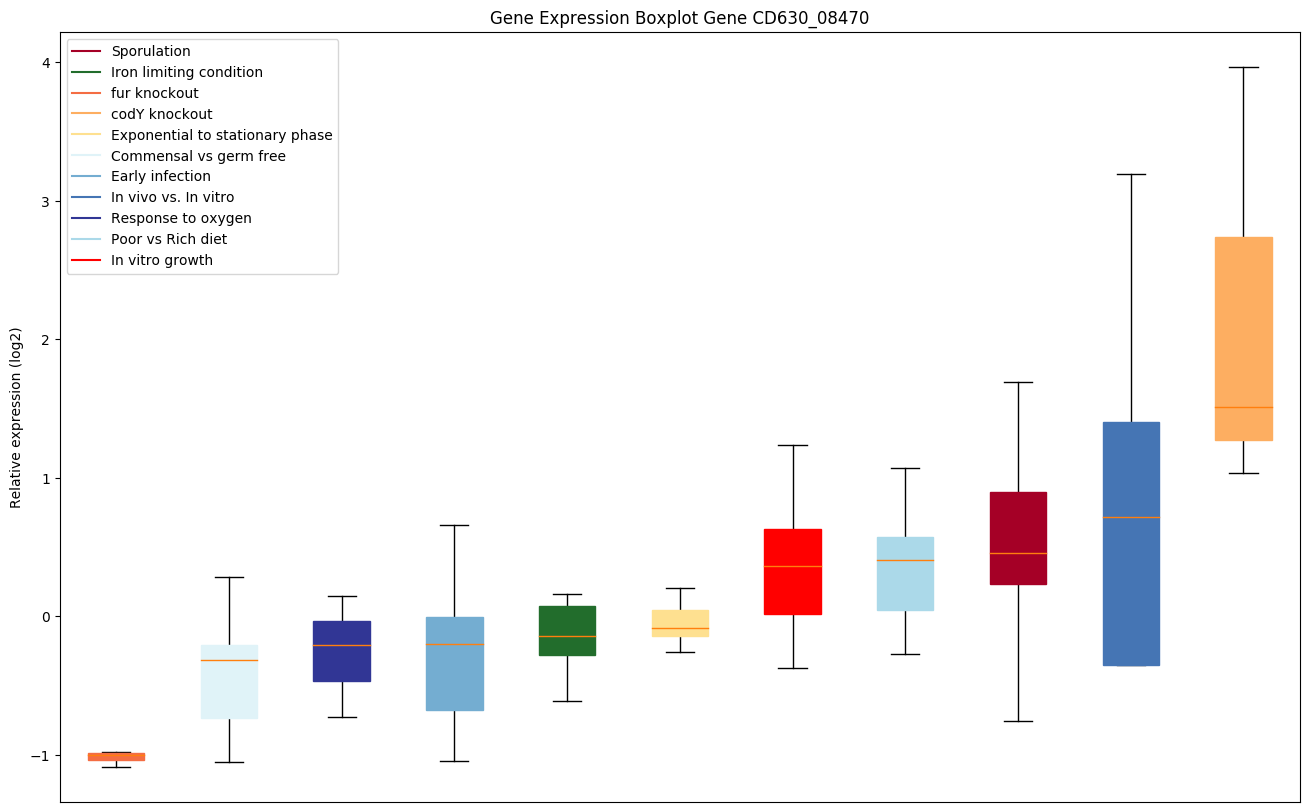
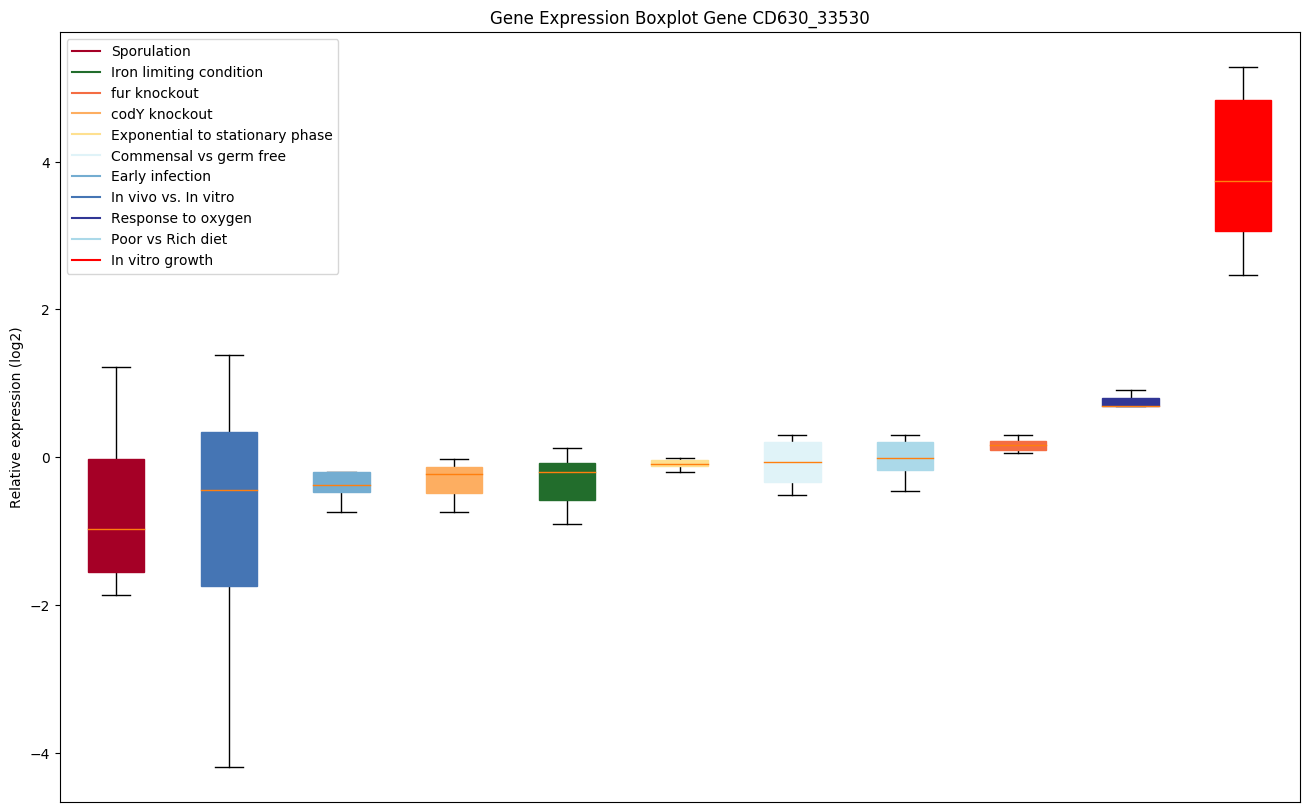
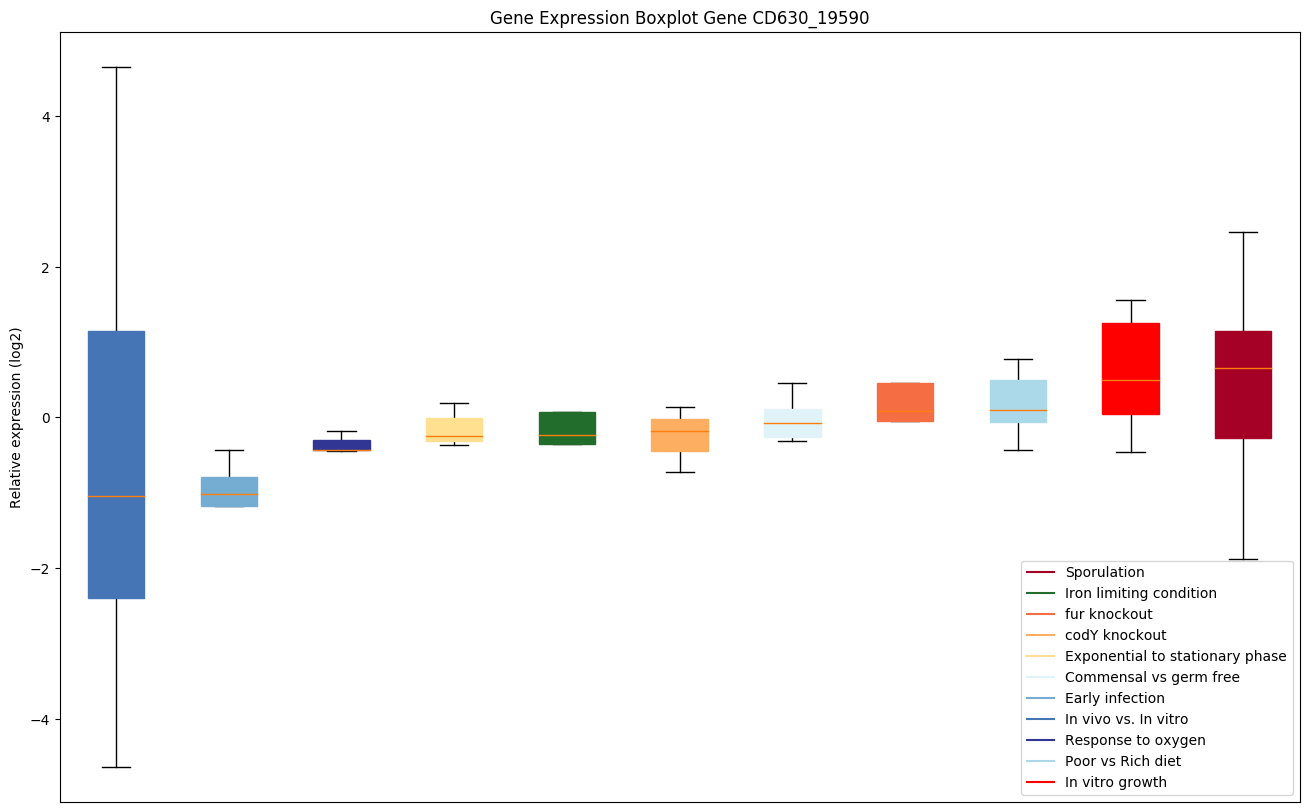
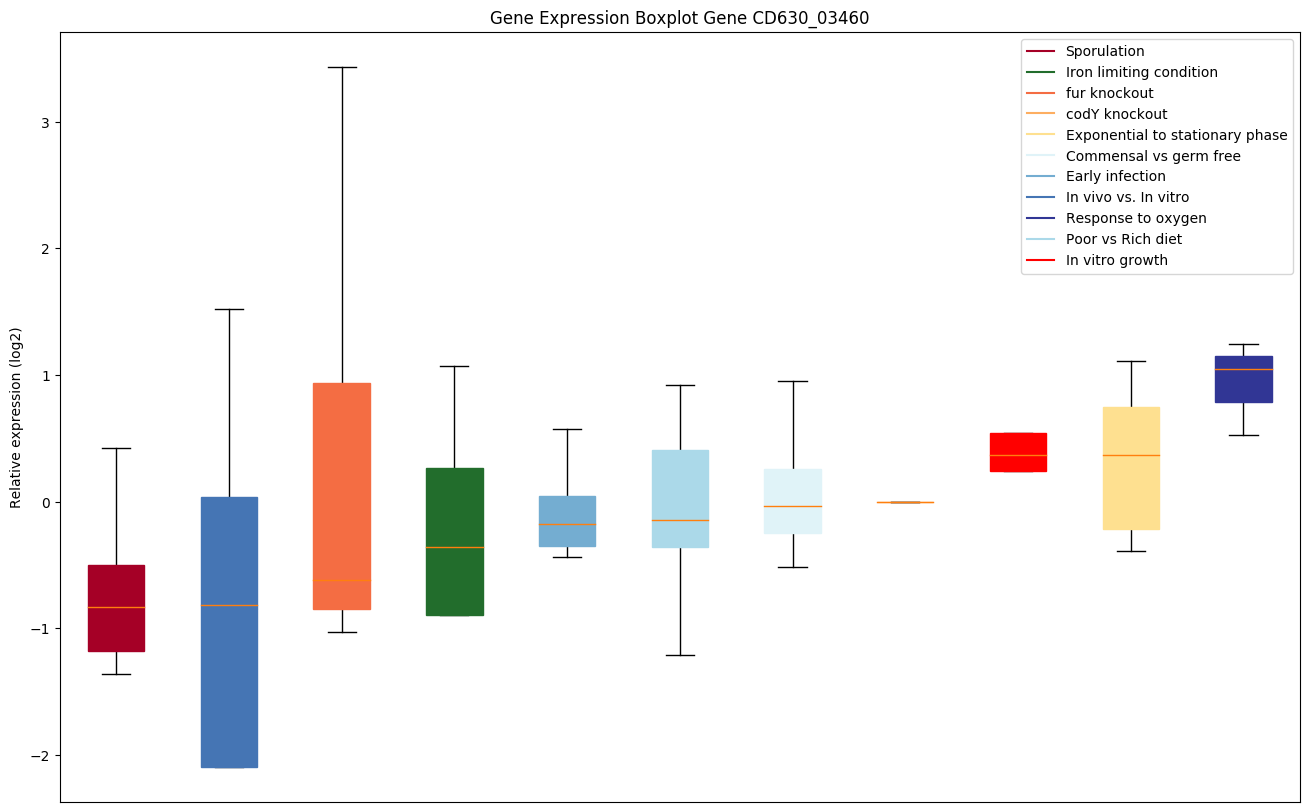
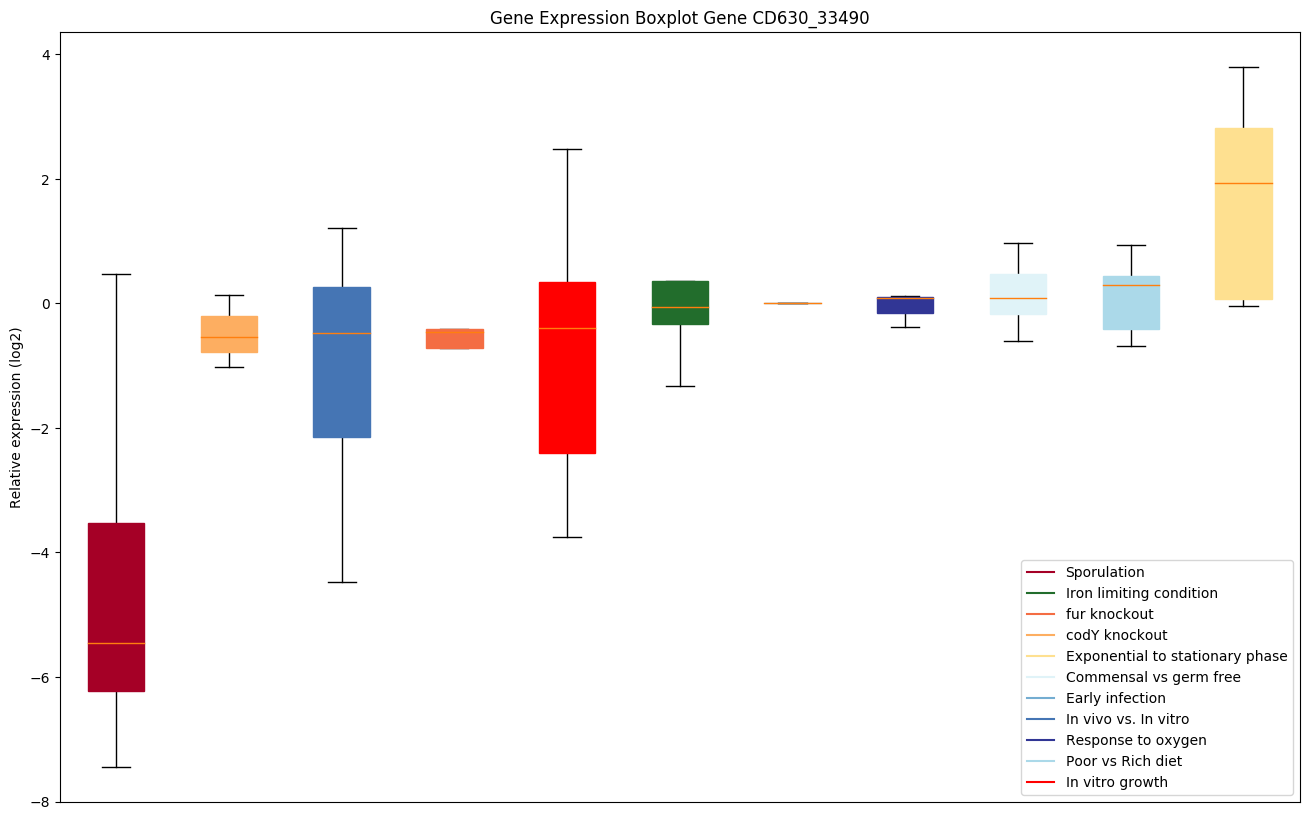
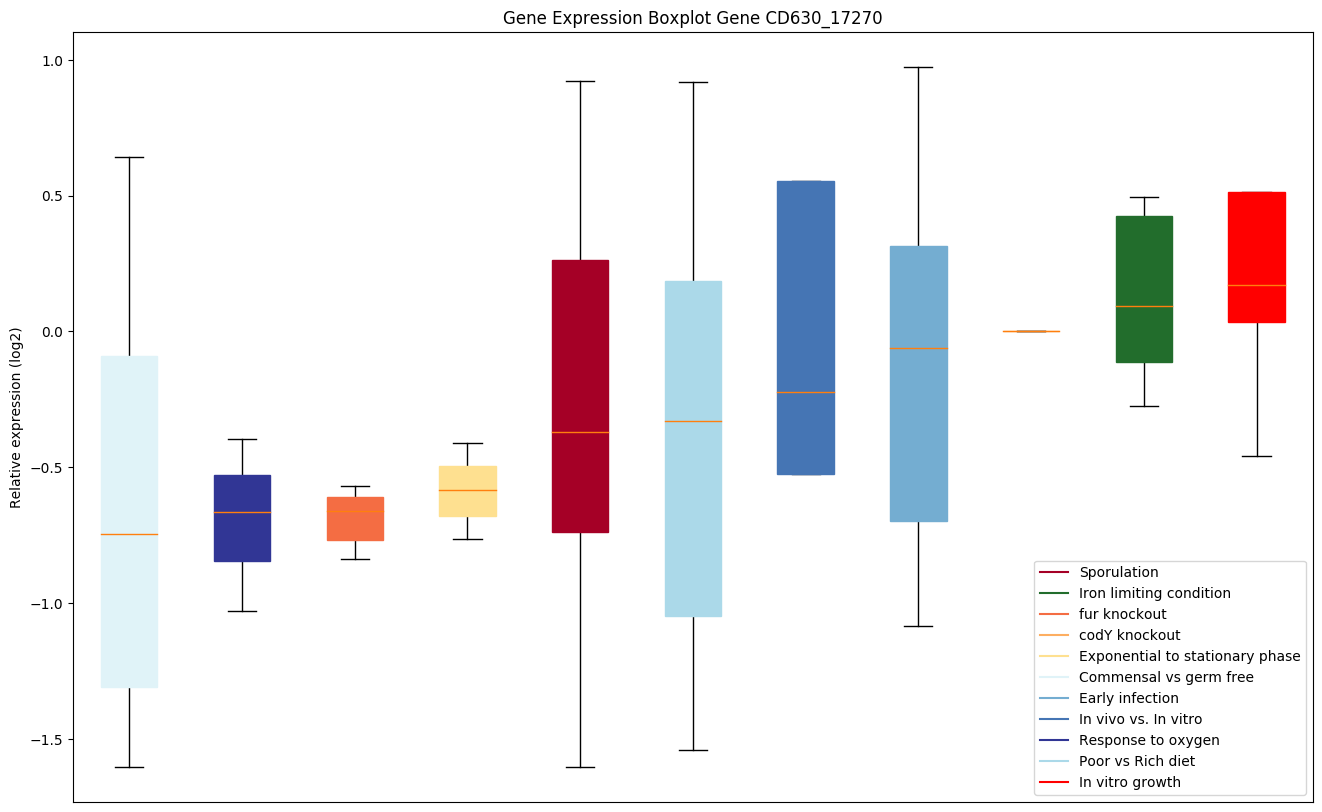
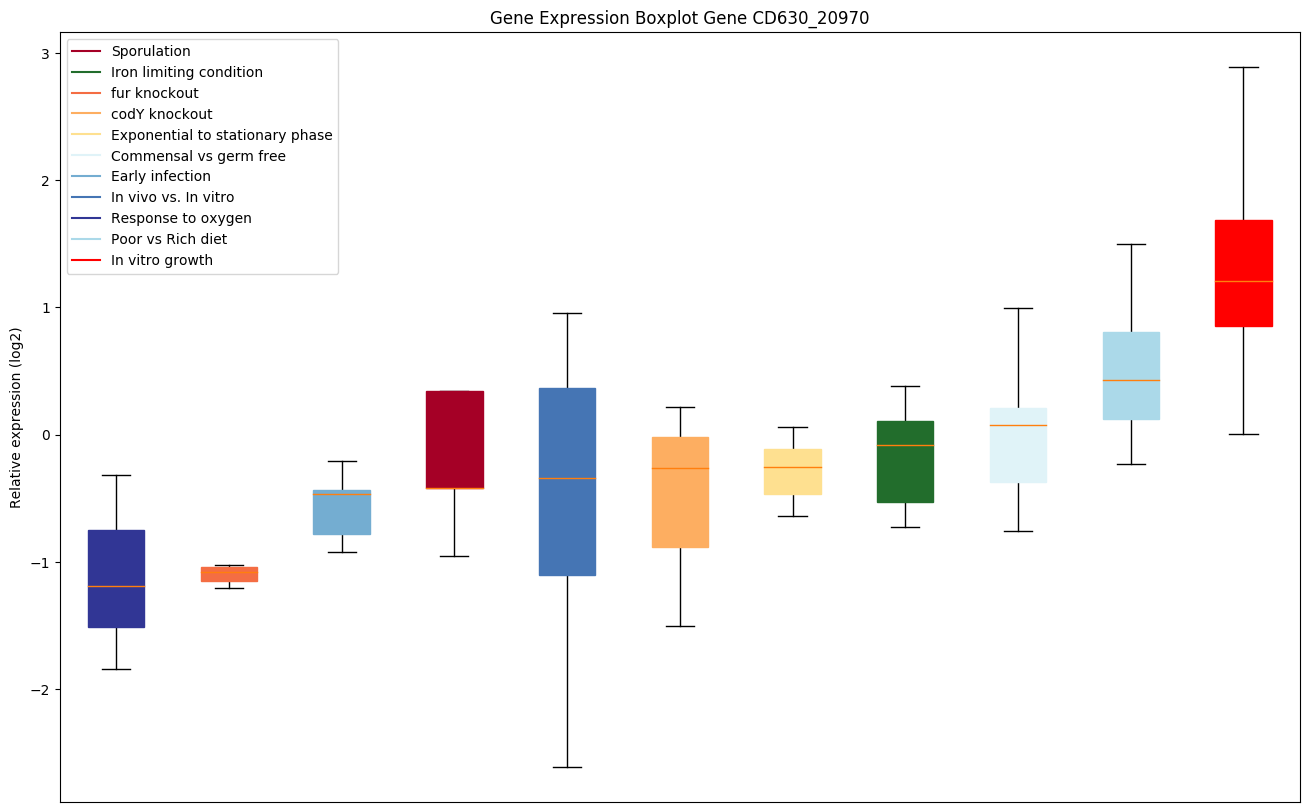
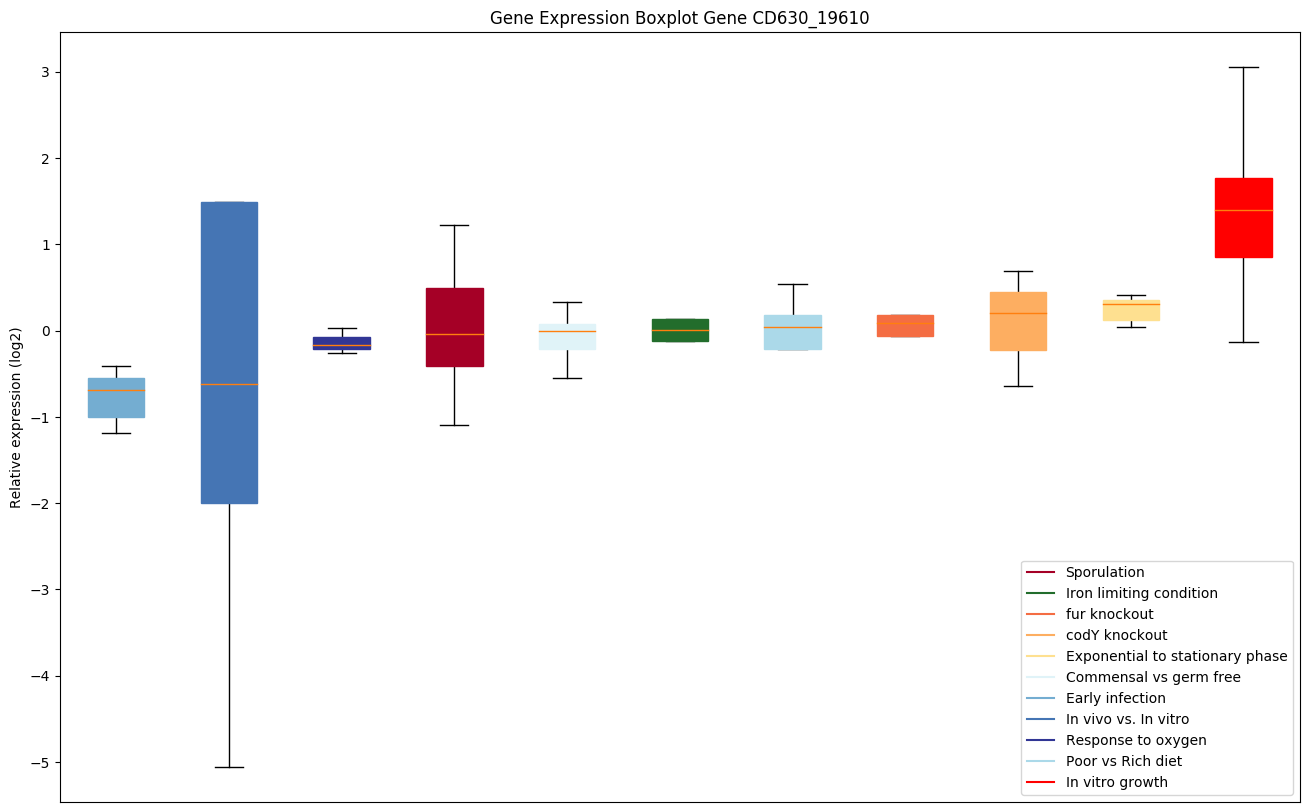
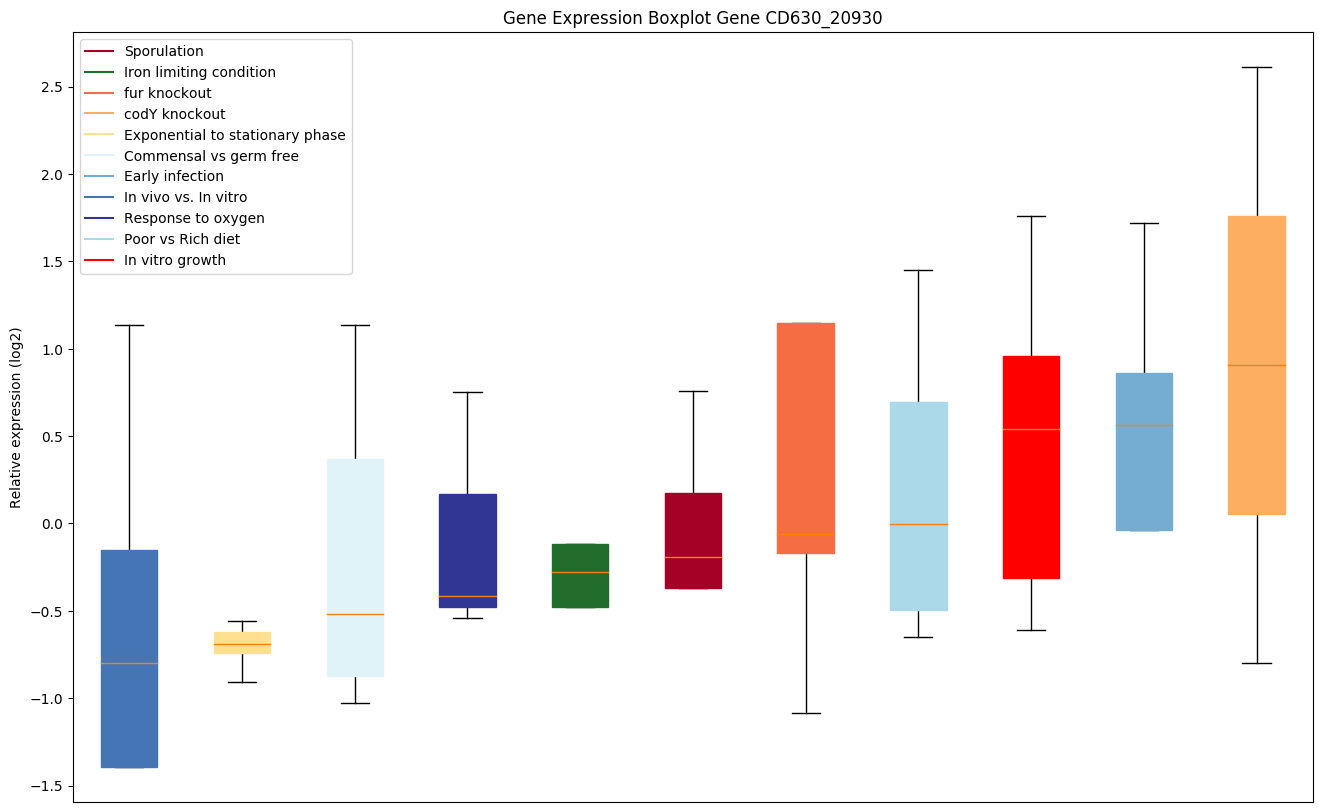
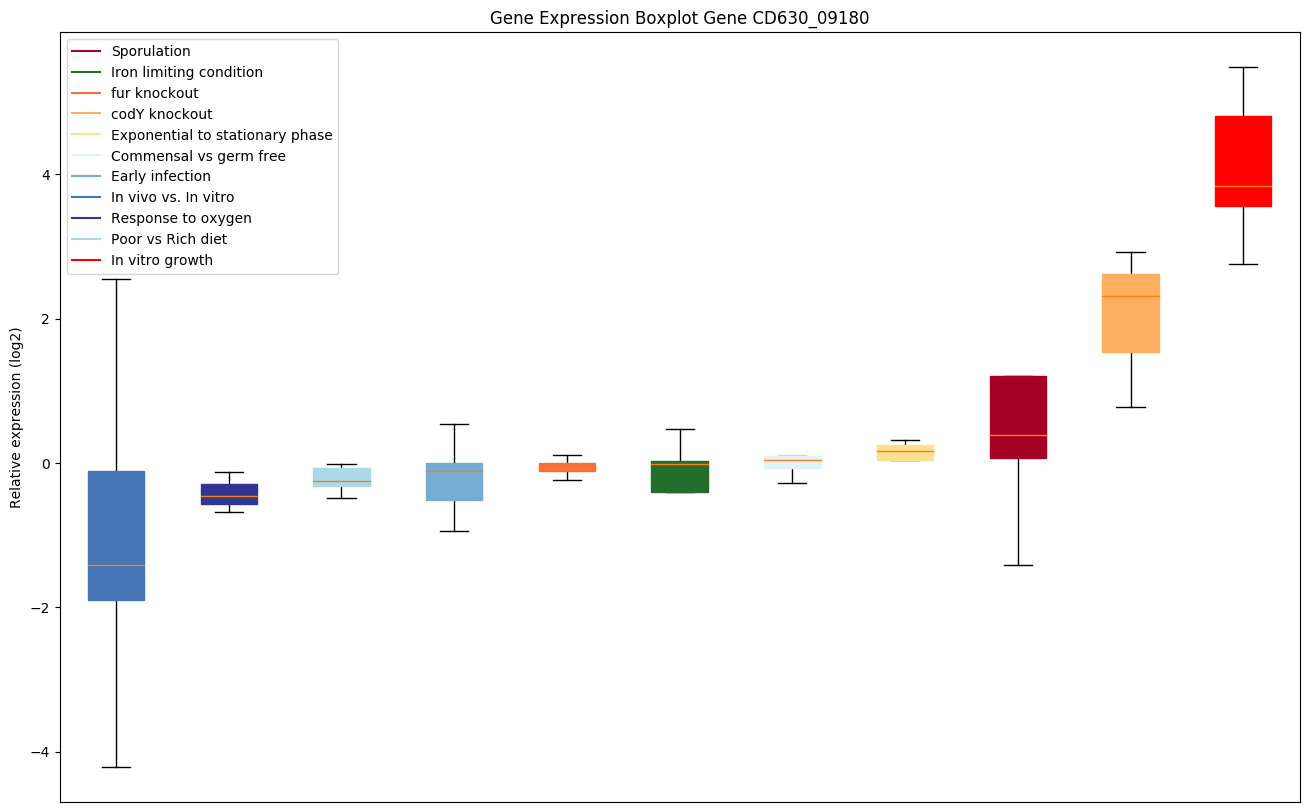
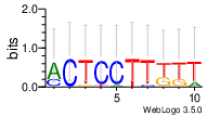
codY knockout
codY knockout
Integration of metabolism and virulence by Clostridium difficile CodY
Series:
GSE23192 |
Pubmed ID: 20709897 |
Type: Expression profiling by array
Summary:CodY, a global regulatory protein that monitors the nutrient sufficiency of the environment by responding to the intracellular levels of GTP and the branched-chain amino acids, was previously shown to be a potent repressor of toxin gene expression in Clostridium difficile during growth in rich medium. In the intestinal tract, such derepression of toxin synthesis may lead to destruction of epithelial cells and the liberation of potential nutrients for the bacterium. CodY is likely to play an important role in regulating overall cellular physiology as well. In this study, DNA microarray analysis and affinity purification of CodY-DNA complexes were used to identify and distinguish the direct and indirect effects of CodY on global gene transcription. A codY null mutation resulted in >4-fold overexpression of 146 genes (organized in 82 apparent transcription units) and underexpression of 19 genes. In addition to the toxin genes, genes for amino acid biosynthesis, nutrient transport, fermentation pathways, membrane components and surface proteins were overexpressed in the codY mutant. Genome-wide analysis identified more than 350 CodY binding regions, many of which are likely to correspond to sites of direct CodY-mediated regulation. About 60% of the CodY-repressed transcription units were associated with binding regions. Several of these genes were confirmed to be direct targets of CodY by gel mobility shift and DNase I footprinting assays.
Overall Design:The experiment was designed to compare gene expression in codY+ and codY mutant strains grown to mid-exponential phase. Three two-color arrays, representing three biological replicates. Each array compares two strains: JIR8094 (pSD21) and JIR9084::pSD21.
Samples: GSM570801, GSM570802, GSM570803
|
In vivo vs. In vitro
In vivo vs. In vitro
Comparison of the expression profiles of the 630E strain after 8h, 14h and 38h of infection in mouse
Series:
GSE43303,GSE43305 |
Pubmed ID: 23897605 |
Type: Expression profiling by array
Summary:The virulence factors of Clostridium difficile have been studied for many years, but the main in vivo pathogenesis processes of this bacterium has to be investigated. Especially, data on the early mechanisms of C. difficile adaptation to the host is not yet available. The objective of our study was to improve the understanding of the pathogenesis of C. difficile by the analysis of the genome-wide temporal expression of C. difficile genes during the first hours of infection. Three groups of 4 axenic mice each were challenged by vegetative cells of the 630 C. difficile strain, and sacrified at 8, 14, and 38 hours post-infection. Pure prokaryotic RNA was obtained from caecal bacteria. Comparative hybridizations on strain 630 microarrays were done using cDNA issued from an 8-hours in vitro culture as control, with a dye-swap protocol for each sample. Normalisation and statistical analysis of all data were done with different functions of the limma package. The pathogenesis of C. difficile could be seen as a result of the successful metabolic adaptation of the bacteria to its host, contributing to its persistence and multiplication, and the coordinate expression of virulence factors. Analysis of our data enlightened some of these aspects. The results support strongly a two-step infection model, since there is, during the course of infection, a significant increase in the toxins expression contrasting with a decreased expression of most of the putative colonization factors. Several paralogs of the HMW S-layer protein are also down-regulated, some of them could be strong candidates as colonisation factors. Bacterial adaptation to the microenvironment of the host is assessed by the regulation of numerous metabolic pathways, i.e., the upregulation of the ethanolamine catabolic operon or the modulation of several PTS systems. Inactivation of some putative virulence factors identified by this methodology will complete this analysis.
Overall Design:Transcriptional profiling of the C. difficile 630E strain after 8h, 14h or 38h of infection in mouse.; Three-condition experiments: 630E strain 8h, 14h or 38h of infection in mouse vs. 630E strain 8h in culture. 4 biological replicates for each condition in dye swap.
Samples: GSM1060320, GSM1060321, GSM1060322, GSM1060323, GSM1060324, GSM1060325, GSM1060326, GSM1060327, GSM1060328, GSM1060329, GSM1060330, GSM1060331, GSM1060332, GSM1060333, GSM1060334, GSM1060335, GSM1060336, GSM1060337, GSM1060338, GSM1060339, GSM1060340, GSM1060341, GSM1060342, GSM1060343, GSM1060344, GSM1060345, GSM1060346, GSM1060347, GSM1060348, GSM1060349, GSM1060350, GSM1060351
|
Early infection
Early infection
Transcription profiling of Caco-2 cells and Clostridium difficile during infection
Series:
GSE18407 |
Pubmed ID: 20521945 |
Type: Expression profiling by array
Summary:Clostridium difficile is an anaerobic spore-forming rod-shaped gram-positive bacterium that can infect both humans and animals. Most studies on the pathogenesis of C. difficile have focused on its toxins and their effect on the host cells. Recently, we utilized microarrays to identify conserved and divergent genes associated with virulence in C. difficile isolates from humans and animals. Our data provided the first clue toward a complex mechanism underlying host adaptation and pathogenesis. Microarray technology offers an efficient high-throughput tool to study the transcriptional profiles of pathogens and infected host cells. Transcriptomes of C. difficile after exposure to environmental and antibiotic stresses and those of human epithelial colorectal Caco-2 cells upon TcdA treatment have been analyzed. To our knowledge, there are still no reports on the transcriptomic study of host-pathogen interactions for C. difficile infection (CDI). In vitro analyses of interplay between host and pathogen are essential to unravel the mechanisms of infection and to investigate the host response to infection. We therefore employed microarrays to study both bacterial and human cellular transcriptome kinetics during CDI to Caco-2 cells. Here we present a large-scale analysis of transcriptional profiles to reveal molecular determinants playing a role in C. difficile pathogenesis and the host response. We found that there were 254 and 224 differentially-expressed genes after CDI in C. difficile and Caco-2 cells, respectively. These genes are clustered according to their functional categories and their potential roles in pathogenesis and host response are discussed. Our results will not only increase our understanding on the host-pathogen interaction, but may also provide targets for drug development.
Overall Design:Clostridium difficile: Control vs Infection (time course); mRNA with genomic DNA of tested and reference strains; ; Caco-2 cells: Control vs Infected with Clostridium difficile; Time-course experiments of Caco-2 cells infected with C. difficile for 30, 60 and 120 min
Samples: GSM458943, GSM458942, GSM458941, GSM458940, GSM458939, GSM458938, GSM458937, GSM458936, GSM458935, GSM458934, GSM458933, GSM458932
|
Rich vs poor diet
Rich vs poor diet
The in vivo responses elicited by Clostridium difficile in response to the gut commensal B. thetaiotaomicron and diet
Series:
GSE60751 |
Pubmed ID: |
Type: Expression profiling by array
Summary:Analysis of Clostridium difficile (Cd) from the cecal contents of germ-free mice or Bacteroides thetaiotaomicron (Bt)-monocolonized mice on a standard, polysaccharide rich diet or polysaccharide deficient diet 5 days after infection. Results identify genes that are involved in the Cd response to diet, in vivo colonization and in interactions with Bt.
Overall Design:In vitro transcriptional profiles of Clostridium difficile obtained from cecal contents of germ-free or Bt-monocolonized mice on a standard, polysaccharide rich or polysaccharide deficient diet. 4 samples/group. 2 control genomic DNA samples for Clostridium difficile and 2 reference genomic DNA samples for Bacteroides thetaiotaomicron; ; Please note that 4 control samples (genomic DNA) were used to determine whether the genomic DNA correctly bound to the probes and thus, were not included in data processing (i.e no processed/normalized data).
Samples: GSM1487085, GSM1487086, GSM1487087, GSM1487088, GSM1487089, GSM1487090, GSM1487092, GSM1487091
|
fur knockout
fur knockout
Expression analysis of Clostridium difficile wild type and fur (ferric uptake regulator) mutant in high iron.
Series:
GSE69218 |
Pubmed ID: |
Type: Expression profiling by array
Summary:Investigation of whole genome gene expression level changes in a Clostridium difficile fur (ferric uptake regulator) mutant, compared to the wild type strain 630 erm.; The fur mutant analyzed in this study is further described in Ho and Ellermeier (2015) J. Bacteriology
Overall Design:A microarray study using total RNA recovered from three separate wild type cultures of Clostridium difficile 630 erm strain and three separate cultures of a fur mutant strain (ltrA::ermR) were grown in Tryptone-Yeast Extract medium containing 0.25 mM ferric chloride . Each chip measures the expression level of 3,786 of the 3,787 open reading frames of the C. difficile 630 genome with 18 probes (60 oligomers each) for each gene.
Samples: GSM1695516, GSM1695517, GSM1695518, GSM1695519, GSM1695520, GSM1695521, fur.high.11, fur.high.1.1, fur.high.21, fur.high2.1, fur.high.31, fur.high3.1, fur.low.1, fur.low.2, fur.low2, fur.low.3, fur.low3
|
Commensal vs germ free
Commensal vs germ free
The in vivo responses elicited by Clostridium difficile in response to the gut commensal B. thetaiotaomicron and diet
Series:
GSE60751 |
Pubmed ID: |
Type: Expression profiling by array
Summary:Analysis of Clostridium difficile (Cd) from the cecal contents of germ-free mice or Bacteroides thetaiotaomicron (Bt)-monocolonized mice on a standard, polysaccharide rich diet or polysaccharide deficient diet 5 days after infection. Results identify genes that are involved in the Cd response to diet, in vivo colonization and in interactions with Bt.
Overall Design:In vitro transcriptional profiles of Clostridium difficile obtained from cecal contents of germ-free or Bt-monocolonized mice on a standard, polysaccharide rich or polysaccharide deficient diet. 4 samples/group. 2 control genomic DNA samples for Clostridium difficile and 2 reference genomic DNA samples for Bacteroides thetaiotaomicron; ; Please note that 4 control samples (genomic DNA) were used to determine whether the genomic DNA correctly bound to the probes and thus, were not included in data processing (i.e no processed/normalized data).
Samples: GSM1487081, GSM1487082, GSM1487083, GSM1487084, GSM1487089, GSM1487090, GSM1487091, GSM1487092
|
Response to oxygen
Response to oxygen
Clostridium difficile response to oxygen
Series:
GSE109175 |
Pubmed ID: |
Type: Expression profiling by array
Summary:C. difficile was grown in either anaerobic conditions or 2% oxygen and gene expression was compared
Overall Design:C. difficile was grown in either anaerobic conditions or 2% oxygen and gene expression was compared. Two conditions were tested with three replicates each (6 samples total)
Samples: GSM2934766, GSM2934767, GSM2934768
|
Exponential to stationary phase
Exponential to stationary phase
Metabolic reprogramming with the induction of toxin production of Clostridioides difficile during the stationary phase
Series:
GSE115054 |
Pubmed ID: |
Type: Expression profiling by array
Summary:Systems biology approach of Clostridioides difficile to analyze the temporal changes in the intracellular and extracellular metabolme, transcriptome and proteome along the growth curve in casamino acids medium and the connection to toxin production.
Overall Design:Clostridioides difficile 630∆erm (DSM28645) were grown in a casamino acids medium (CDMM) containing 2 g/L glucose. Samples were taken at five time points along the growth curve (exponential growth: 14.5 h of cultivation, transient phase: 17.25 h, stationary phase 1: 19.25 h, stationary phase 2: 24.25 h, stationary phase 3: 29.25 h). The cultivation was performed with four biological replicates. Reference in transcriptomic acid proteomic measurement was the exponential phase samples.
Samples: GSM3164188, GSM3164189, GSM3164190, GSM3164191, GSM3164192, GSM3164193, GSM3164194, GSM3164195, GSM3164196, GSM3164197, GSM3164198, GSM3164199, GSM3164200, GSM3164201, GSM3164202, GSM3164203
|
Sporulation
Sporulation
NA
Series:
NA |
Pubmed ID: |
Type: NA
Summary:NA
Overall Design:NA
Samples: S01.RD, S02.RD, S03.RD, E1.RD, E2.RD, E3.RD, F1.RD, F2.RD, F3.RD, K1.RD, K2.RD, K3.RD, G1.RD, G2.RD, G3.RD, spoIIID.1_S19.RD, spoIIID.2_S20.RD, spoIIID.3_S21.RD
|
Iron limiting condition
Iron limiting condition
Clostridium difficile response to iron limitation
Series:
GSE109453 |
Pubmed ID: |
Type: Expression profiling by array
Summary:C. difficile was grown in BHIS broth or BHIS broth with 75uM dipridyl and gene expression was compared.
Overall Design:Two conditions were tested at three timepoints with three replicates each (18 samples total).
Samples: GSM2943576, GSM2943577, GSM2943578, GSM2943582, GSM2943583, GSM2943584, GSM2943588, GSM2943589, GSM2943590, WT.high.1, WT.high.2, WT.high.3, fur.high.1, fur.high.2, fur.high2, fur.high.3, fur.high3
|
|
|


