Thaps_hclust_0258 Hierarchical Clustering
Thalassiosira pseudonana
| Cluster Plot | Conditions Plot | Dendrogram |
|---|---|---|
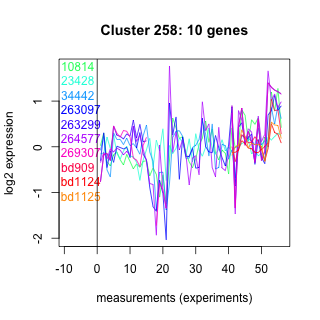 |
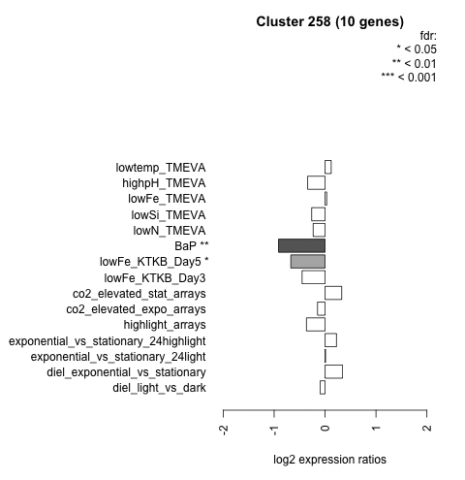 |
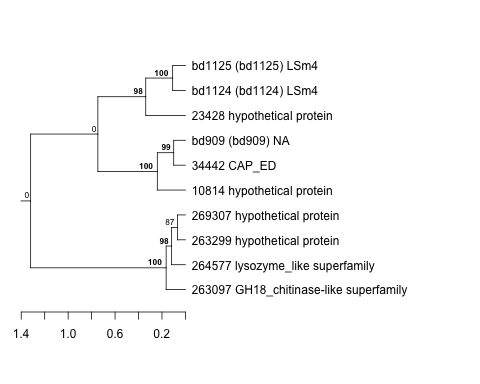 |
| GO ID | Go Term | p-value | q-value | Cluster |
|---|---|---|---|---|
| GO:0006032 | chitin catabolism | 0.00988766 | 1 | Thaps_hclust_0258 |
| GO:0016998 | cell wall catabolism | 0.0111179 | 1 | Thaps_hclust_0258 |
| GO:0009613 | response to pest, pathogen or parasite | 0.0111179 | 1 | Thaps_hclust_0258 |
| GO:0006030 | chitin metabolism | 0.0257813 | 1 | Thaps_hclust_0258 |
| GO:0006468 | protein amino acid phosphorylation | 0.236888 | 1 | Thaps_hclust_0258 |
| GO:0008152 | metabolism | 0.410014 | 1 | Thaps_hclust_0258 |
| Condition | Condition | Difference | FDR |
|---|---|---|---|
| diel_light_vs_dark | diel_light_vs_dark | -0.097 | 0.802 |
| lowFe_KTKB_Day3 | lowFe_KTKB_Day3 | -0.452 | 0.172 |
| lowFe_KTKB_Day5 | lowFe_KTKB_Day5 | -0.672 | 0.0243 |
| BaP | BaP | -0.915 | 0.00273 |
| exponential_vs_stationary_24highlight | exponential_vs_stationary_24highlight | 0.225 | 0.132 |
| co2_elevated_stat_arrays | co2_elevated_stat_arrays | 0.326 | 0.248 |
| lowtemp_TMEVA | lowtemp_TMEVA | 0.120 | 0.746 |
| highpH_TMEVA | highpH_TMEVA | -0.342 | 0.116 |
| co2_elevated_expo_arrays | co2_elevated_expo_arrays | -0.149 | 0.591 |
| lowFe_TMEVA | lowFe_TMEVA | 0.033 | 0.951 |
| exponential_vs_stationary_24light | exponential_vs_stationary_24light | 0.010 | 0.984 |
| lowN_TMEVA | lowN_TMEVA | -0.233 | 0.605 |
| diel_exponential_vs_stationary | diel_exponential_vs_stationary | 0.343 | 0.163 |
| lowSi_TMEVA | lowSi_TMEVA | -0.264 | 0.806 |
| highlight_arrays | highlight_arrays | -0.365 | 0.0945 |