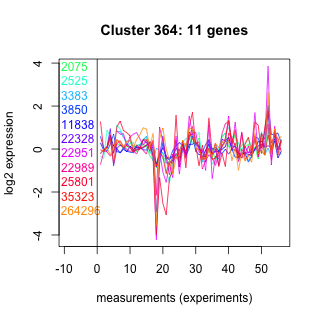
Thaps_hclust_0364 Hierarchical Clustering
Thalassiosira pseudonana
| Cluster Plot | Conditions Plot | Dendrogram |
|---|---|---|
 |
 |
 |
| GO ID | Go Term | p-value | q-value | Cluster |
|---|---|---|---|---|
| GO:0006633 | fatty acid biosynthesis | 0.0194946 | 1 | Thaps_hclust_0364 |
| GO:0006396 | RNA processing | 0.0585575 | 1 | Thaps_hclust_0364 |
| GO:0006412 | protein biosynthesis | 0.160275 | 1 | Thaps_hclust_0364 |
| GO:0006118 | electron transport | 0.24643 | 1 | Thaps_hclust_0364 |
| GO:0008152 | metabolism | 0.355748 | 1 | Thaps_hclust_0364 |
|
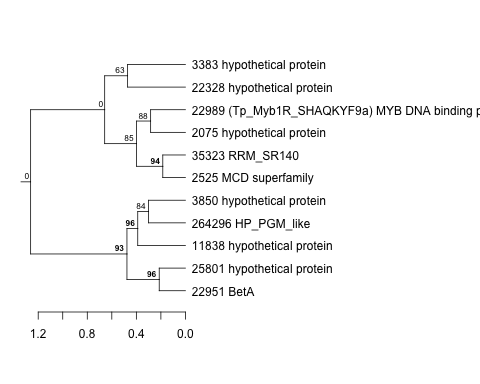
2075 : hypothetical protein |
3850 : hypothetical protein |
22951 : BetA |
35323 : RRM_SR140 |
|
2525 : MCD superfamily |
11838 : hypothetical protein |
22989 : (Tp_Myb1R_SHAQKYF9a) MYB DNA binding protein/ transcription factor-like protein |
264296 : HP_PGM_like |
|
3383 : hypothetical protein |
22328 : hypothetical protein |
25801 : hypothetical protein |
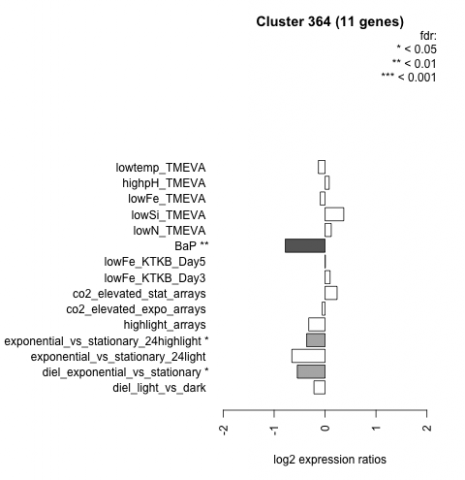
| Condition | Condition | Difference | FDR |
|---|---|---|---|
| diel_light_vs_dark | diel_light_vs_dark | -0.217 | 0.485 |
| lowFe_KTKB_Day3 | lowFe_KTKB_Day3 | 0.098 | 0.795 |
| lowFe_KTKB_Day5 | lowFe_KTKB_Day5 | 0.005 | 0.99 |
| BaP | BaP | -0.782 | 0.00734 |
| exponential_vs_stationary_24highlight | exponential_vs_stationary_24highlight | -0.361 | 0.0122 |
| co2_elevated_stat_arrays | co2_elevated_stat_arrays | 0.236 | 0.406 |
| lowtemp_TMEVA | lowtemp_TMEVA | -0.131 | 0.706 |
| highpH_TMEVA | highpH_TMEVA | 0.080 | 0.749 |
| co2_elevated_expo_arrays | co2_elevated_expo_arrays | -0.056 | 0.911 |
| lowFe_TMEVA | lowFe_TMEVA | -0.094 | 0.826 |
| exponential_vs_stationary_24light | exponential_vs_stationary_24light | -0.651 | 0.102 |
| lowN_TMEVA | lowN_TMEVA | 0.121 | 0.778 |
| diel_exponential_vs_stationary | diel_exponential_vs_stationary | -0.545 | 0.0269 |
| lowSi_TMEVA | lowSi_TMEVA | 0.367 | 0.614 |
| highlight_arrays | highlight_arrays | -0.321 | 0.129 |