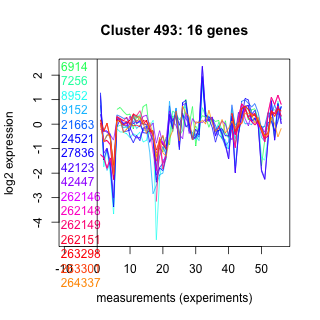
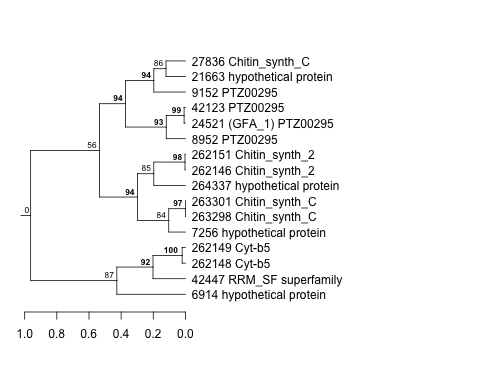
Thaps_hclust_0493 Hierarchical Clustering
Thalassiosira pseudonana
| Cluster Plot | Conditions Plot | Dendrogram |
|---|---|---|
 |
 |
 |
| GO ID | Go Term | p-value | q-value | Cluster |
|---|---|---|---|---|
| GO:0005975 | carbohydrate metabolism | 0.000119875 | 0.433107 | Thaps_hclust_0493 |
| GO:0008152 | metabolism | 0.0160137 | 1 | Thaps_hclust_0493 |
| GO:0006508 | proteolysis and peptidolysis | 0.349482 | 1 | Thaps_hclust_0493 |
|
6914 : hypothetical protein |
21663 : hypothetical protein |
42447 : RRM_SF superfamily |
262151 : Chitin_synth_2 |
|
7256 : hypothetical protein |
24521 : (GFA_1) PTZ00295 |
262146 : Chitin_synth_2 |
263298 : Chitin_synth_C |
|
8952 : PTZ00295 |
27836 : Chitin_synth_C |
262148 : Cyt-b5 |
263301 : Chitin_synth_C |
|
9152 : PTZ00295 |
42123 : PTZ00295 |
262149 : Cyt-b5 |
264337 : hypothetical protein |
| Condition | Condition | Difference | FDR |
|---|---|---|---|
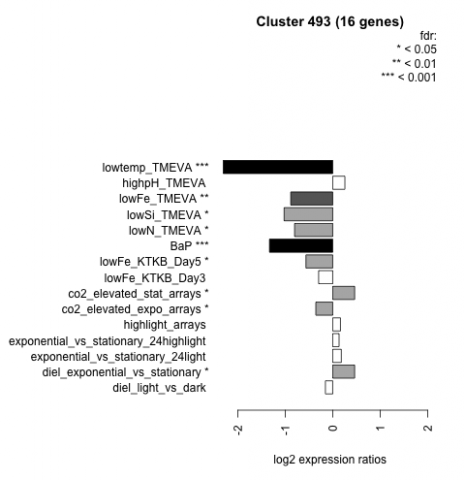
| diel_light_vs_dark | diel_light_vs_dark | -0.154 | 0.572 |
| lowFe_KTKB_Day3 | lowFe_KTKB_Day3 | -0.297 | 0.271 |
| lowFe_KTKB_Day5 | lowFe_KTKB_Day5 | -0.565 | 0.0137 |
| BaP | BaP | -1.330 | 0.00037 |
| exponential_vs_stationary_24highlight | exponential_vs_stationary_24highlight | 0.134 | 0.273 |
| co2_elevated_stat_arrays | co2_elevated_stat_arrays | 0.463 | 0.0451 |
| lowtemp_TMEVA | lowtemp_TMEVA | -2.310 | 0.000735 |
| highpH_TMEVA | highpH_TMEVA | 0.257 | 0.137 |
| co2_elevated_expo_arrays | co2_elevated_expo_arrays | -0.356 | 0.0123 |
| lowFe_TMEVA | lowFe_TMEVA | -0.885 | 0.00104 |
| exponential_vs_stationary_24light | exponential_vs_stationary_24light | 0.181 | 0.659 |
| lowN_TMEVA | lowN_TMEVA | -0.804 | 0.0192 |
| diel_exponential_vs_stationary | diel_exponential_vs_stationary | 0.462 | 0.0203 |
| lowSi_TMEVA | lowSi_TMEVA | -1.020 | 0.0109 |
| highlight_arrays | highlight_arrays | 0.163 | 0.374 |