Hierarchical Clusters
Displaying 1 - 100 of 7500
| Title | Cluster Plot | Dendrogram | e-value | e-value | e-value | Condition | Condition FDR | Condition Difference |
|---|---|---|---|---|---|---|---|---|
| Thaps_hclust_0255 |
 |
 |
1.4e-28 |
0.0000000000000024 |
0.000000029 |
lowtemp_TMEVA | 1.000000 | |
| Thaps_hclust_0255 |
|
|
1.4e-28 |
0.0000000000000024 |
0.000000029 |
highpH_TMEVA | 1.000000 | |
| Thaps_hclust_0255 |
|
|
1.4e-28 |
0.0000000000000024 |
0.000000029 |
lowFe_TMEVA | 1.000000 | |
| Thaps_hclust_0255 |
|
|
1.4e-28 |
0.0000000000000024 |
0.000000029 |
lowN_TMEVA | 1.000000 | |
| Thaps_hclust_0255 |
|
|
1.4e-28 |
0.0000000000000024 |
0.000000029 |
lowSi_TMEVA | 1.000000 | |
| Thaps_hclust_0255 |
|
|
1.4e-28 |
0.0000000000000024 |
0.000000029 |
lowFe_KTKB_Day3 | 1.000000 | |
| Thaps_hclust_0255 |
|
|
1.4e-28 |
0.0000000000000024 |
0.000000029 |
lowFe_KTKB_Day5 | 1.000000 | |
| Thaps_hclust_0255 |
|
|
1.4e-28 |
0.0000000000000024 |
0.000000029 |
BaP | 1.000000 |
| Title | Cluster Plot | Dendrogram | e-value | e-value | e-value | Condition | Condition FDR | Condition Difference |
|---|---|---|---|---|---|---|---|---|
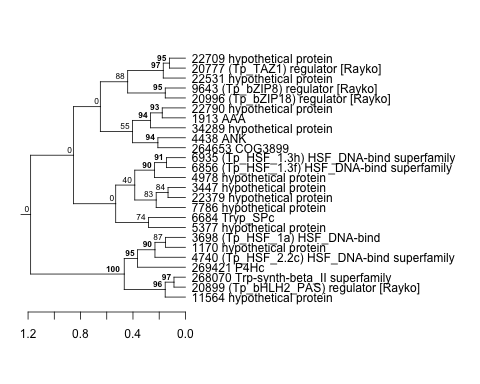
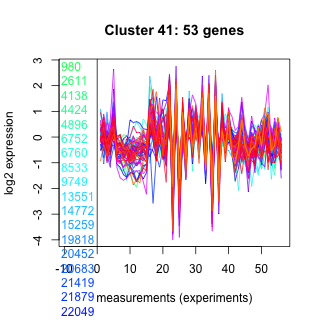
| Thaps_hclust_0040 |
 |
 |
1.8e-29 |
0.000000000042 |
0.00000000063 |
lowSi_TMEVA | 1.000000 | |
| Thaps_hclust_0040 |
|
|
1.8e-29 |
0.000000000042 |
0.00000000063 |
lowFe_KTKB_Day3 | 1.000000 | |
| Thaps_hclust_0040 |
|
|
1.8e-29 |
0.000000000042 |
0.00000000063 |
lowFe_KTKB_Day5 | 1.000000 | |
| Thaps_hclust_0040 |
|
|
1.8e-29 |
0.000000000042 |
0.00000000063 |
BaP | 1.000000 | |
| Thaps_hclust_0040 |
|
|
1.8e-29 |
0.000000000042 |
0.00000000063 |
lowtemp_TMEVA | 1.000000 | |
| Thaps_hclust_0040 |
|
|
1.8e-29 |
0.000000000042 |
0.00000000063 |
highpH_TMEVA | 1.000000 | |
| Thaps_hclust_0040 |
|
|
1.8e-29 |
0.000000000042 |
0.00000000063 |
lowFe_TMEVA | 1.000000 | |
| Thaps_hclust_0040 |
|
|
1.8e-29 |
0.000000000042 |
0.00000000063 |
lowN_TMEVA | 1.000000 | |
| Thaps_hclust_0040 |
|
|
1.8e-29 |
0.000000000042 |
0.00000000063 |
diel_light_vs_dark | 0.000485 | -2.19 |
| Title | Cluster Plot | Dendrogram | e-value | e-value | e-value | Condition | Condition FDR | Condition Difference |
|---|---|---|---|---|---|---|---|---|
| Thaps_hclust_0062 |
 |
 |
0.000000026 |
0.000000021 |
0.000000000021 |
lowFe_KTKB_Day3 | 1.000000 | |
| Thaps_hclust_0062 |
|
|
0.000000026 |
0.000000021 |
0.000000000021 |
lowFe_KTKB_Day5 | 1.000000 | |
| Thaps_hclust_0062 |
|
|
0.000000026 |
0.000000021 |
0.000000000021 |
BaP | 1.000000 | |
| Thaps_hclust_0062 |
|
|
0.000000026 |
0.000000021 |
0.000000000021 |
lowtemp_TMEVA | 1.000000 | |
| Thaps_hclust_0062 |
|
|
0.000000026 |
0.000000021 |
0.000000000021 |
highpH_TMEVA | 1.000000 | |
| Thaps_hclust_0062 |
|
|
0.000000026 |
0.000000021 |
0.000000000021 |
lowFe_TMEVA | 1.000000 | |
| Thaps_hclust_0062 |
|
|
0.000000026 |
0.000000021 |
0.000000000021 |
lowN_TMEVA | 1.000000 | |
| Thaps_hclust_0062 |
|
|
0.000000026 |
0.000000021 |
0.000000000021 |
lowSi_TMEVA | 1.000000 |
| Title | Cluster Plot | Dendrogram | e-value | e-value | e-value | Condition | Condition FDR | Condition Difference |
|---|---|---|---|---|---|---|---|---|
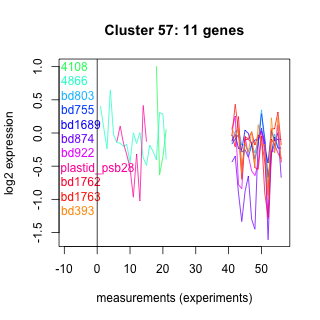
| Thaps_hclust_0057 |
 |
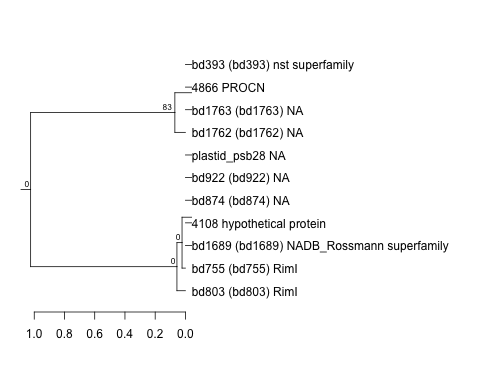 |
1.5 |
1.7 |
12 |
diel_exponential_vs_stationary | 1.000000 | |
| Thaps_hclust_0057 |
|
|
1.5 |
1.7 |
12 |
diel_light_vs_dark | 1.000000 |
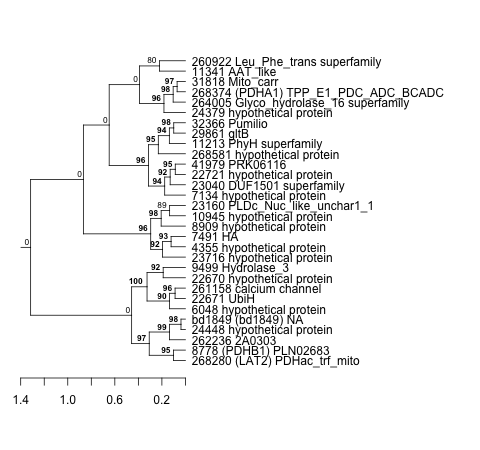
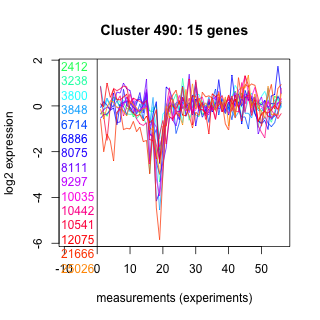
| Title | Cluster Plot | Dendrogram | e-value | e-value | e-value | Condition | Condition FDR | Condition Difference |
|---|---|---|---|---|---|---|---|---|
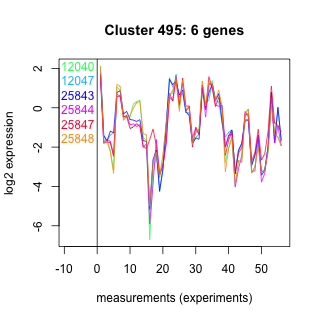
| Thaps_hclust_0495 |
 |
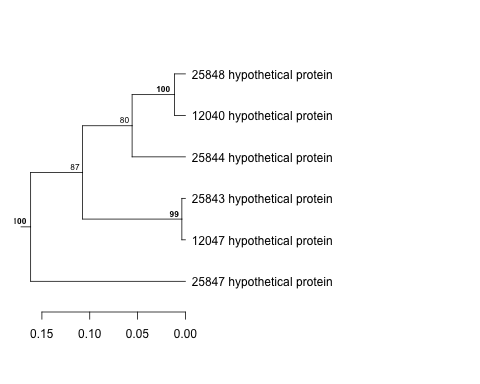 |
0.0000000031 |
0.00000049 |
0.0000038 |
lowFe_KTKB_Day3 | 0.000862 | -4.91 |
| Thaps_hclust_0495 |
|
|
0.0000000031 |
0.00000049 |
0.0000038 |
lowFe_KTKB_Day5 | 0.001320 | -2.74 |
| Thaps_hclust_0495 |
|
|
0.0000000031 |
0.00000049 |
0.0000038 |
BaP | 0.000370 | -2.46 |
| Thaps_hclust_0495 |
|
|
0.0000000031 |
0.00000049 |
0.0000038 |
lowtemp_TMEVA | 0.000735 | -2.32 |
| Thaps_hclust_0495 |
|
|
0.0000000031 |
0.00000049 |
0.0000038 |
lowSi_TMEVA | 0.014200 | -1.75 |
| Thaps_hclust_0495 |
|
|
0.0000000031 |
0.00000049 |
0.0000038 |
co2_elevated_expo_arrays | 0.001390 | -1.69 |
| Thaps_hclust_0495 |
|
|
0.0000000031 |
0.00000049 |
0.0000038 |
lowN_TMEVA | 0.008330 | -1.69 |
| Thaps_hclust_0495 |
|
|
0.0000000031 |
0.00000049 |
0.0000038 |
lowFe_TMEVA | 0.002000 | -1.62 |
| Title | Cluster Plot | Dendrogram | e-value | e-value | e-value | Condition | Condition FDR | Condition Difference |
|---|---|---|---|---|---|---|---|---|
| Thaps_hclust_0022 |
 |
|
1.9e-31 |
2.4e-22 |
6.4e-20 |
lowSi_TMEVA | 0.001350 | -4.7 |
| Thaps_hclust_0022 |
|
|
1.9e-31 |
2.4e-22 |
6.4e-20 |
lowN_TMEVA | 0.001190 | -4.56 |
| Thaps_hclust_0022 |
|
|
1.9e-31 |
2.4e-22 |
6.4e-20 |
lowtemp_TMEVA | 0.000735 | -3.34 |
| Thaps_hclust_0022 |
|
|
1.9e-31 |
2.4e-22 |
6.4e-20 |
lowFe_TMEVA | 0.001040 | -2.14 |
| Title | Cluster Plot | Dendrogram | e-value | e-value | e-value | Condition | Condition FDR | Condition Difference |
|---|---|---|---|---|---|---|---|---|
| Thaps_hclust_0010 |
 |
 |
0.0000000000019 |
0.000000000035 |
0.013 |
lowSi_TMEVA | 0.001350 | -3.29 |
| Thaps_hclust_0010 |
|
|
0.0000000000019 |
0.000000000035 |
0.013 |
lowN_TMEVA | 0.001190 | -2.76 |
| Thaps_hclust_0010 |
|
|
0.0000000000019 |
0.000000000035 |
0.013 |
lowFe_TMEVA | 0.001040 | -2.49 |
| Thaps_hclust_0010 |
|
|
0.0000000000019 |
0.000000000035 |
0.013 |
lowtemp_TMEVA | 0.000735 | -2.01 |
| Title | Cluster Plot | Dendrogram | e-value | e-value | e-value | Condition | Condition FDR | Condition Difference |
|---|---|---|---|---|---|---|---|---|
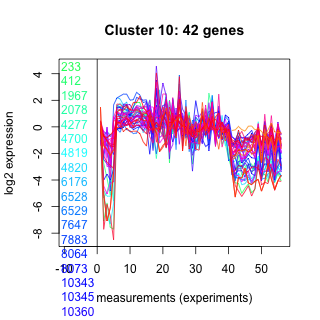
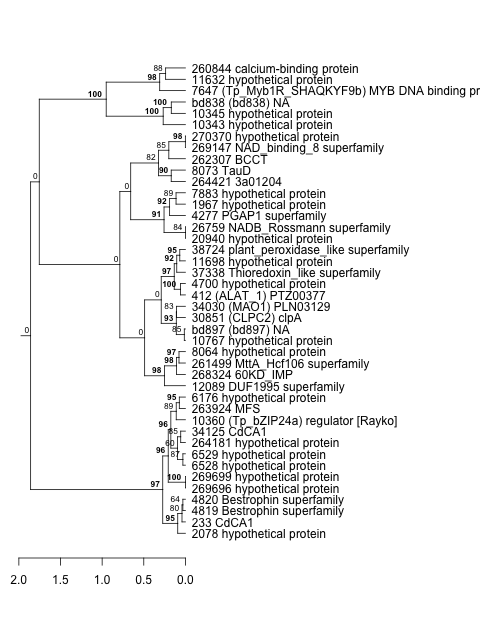
| Thaps_hclust_0105 |
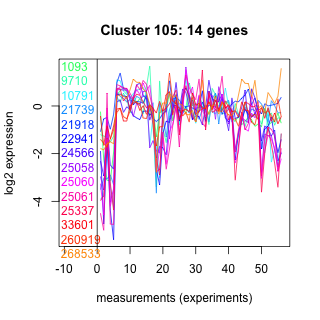 |
 |
49 |
0.074 |
21 |
lowFe_TMEVA | 0.001040 | -2.92 |
| Thaps_hclust_0105 |
|
|
49 |
0.074 |
21 |
lowSi_TMEVA | 0.001350 | -2.82 |
| Thaps_hclust_0105 |
|
|
49 |
0.074 |
21 |
lowtemp_TMEVA | 0.000735 | -2.8 |
| Thaps_hclust_0105 |
|
|
49 |
0.074 |
21 |
highpH_TMEVA | 0.000725 | -2.31 |
| Title | Cluster Plot | Dendrogram | e-value | e-value | e-value | Condition | Condition FDR | Condition Difference |
|---|---|---|---|---|---|---|---|---|
| Thaps_hclust_0015 |
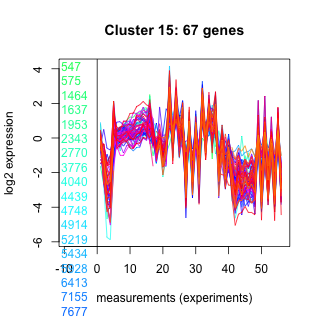 |
|
2.5e-25 |
7.4e-21 |
0.0000000011 |
lowSi_TMEVA | 0.001350 | -2.9 |
| Thaps_hclust_0015 |
|
|
2.5e-25 |
7.4e-21 |
0.0000000011 |
lowN_TMEVA | 0.001190 | -2.83 |
| Thaps_hclust_0015 |
|
|
2.5e-25 |
7.4e-21 |
0.0000000011 |
diel_light_vs_dark | 0.000485 | -1.64 |
| Title | Cluster Plot | Dendrogram | e-value | e-value | e-value | Condition | Condition FDR | Condition Difference |
|---|---|---|---|---|---|---|---|---|
| Thaps_hclust_0496 |
 |
 |
0.00082 |
0.0031 |
0.43 |
lowtemp_TMEVA | 0.000735 | -2.87 |
| Title | Cluster Plot | Dendrogram | e-value | e-value | e-value | Condition | Condition FDR | Condition Difference |
|---|---|---|---|---|---|---|---|---|
| Thaps_hclust_0023 |
 |
 |
0.000000000039 |
0.0000072 |
0.002 |
lowN_TMEVA | 0.001190 | -2.82 |
| Thaps_hclust_0023 |
|
|
0.000000000039 |
0.0000072 |
0.002 |
lowSi_TMEVA | 0.001350 | -2.52 |
| Thaps_hclust_0023 |
|
|
0.000000000039 |
0.0000072 |
0.002 |
lowFe_TMEVA | 0.001040 | -1.68 |
| Title | Cluster Plot | Dendrogram | e-value | e-value | e-value | Condition | Condition FDR | Condition Difference |
|---|---|---|---|---|---|---|---|---|
| Thaps_hclust_0493 |
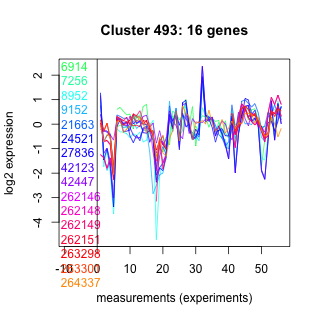 |
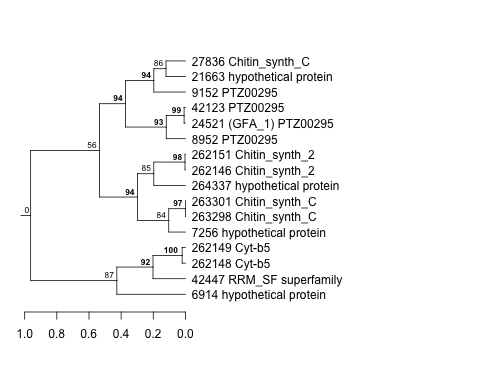 |
0.00000036 |
0.0000009 |
0.000056 |
lowtemp_TMEVA | 0.000735 | -2.31 |
| Title | Cluster Plot | Dendrogram | e-value | e-value | e-value | Condition | Condition FDR | Condition Difference |
|---|---|---|---|---|---|---|---|---|
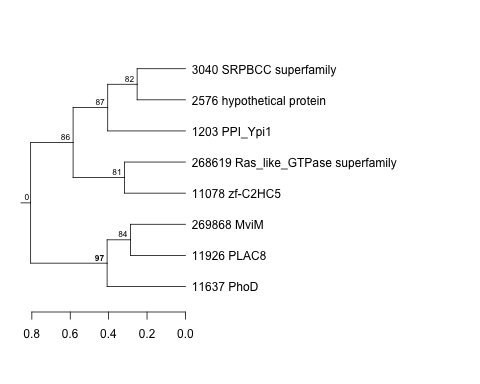
| Thaps_hclust_0359 |
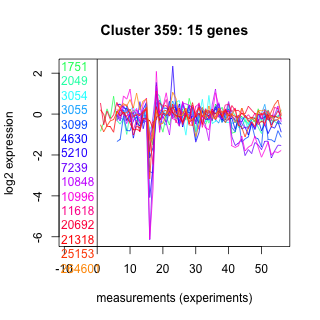 |
 |
0.5 |
11 |
31 |
lowFe_KTKB_Day3 | 0.000862 | -2.28 |
| Title | Cluster Plot | Dendrogram | e-value | e-value | e-value | Condition | Condition FDR | Condition Difference |
|---|---|---|---|---|---|---|---|---|
| Thaps_hclust_0117 |
 |
 |
0.0000000000002 |
0.000000021 |
0.00000045 |
exponential_vs_stationary_24light | 0.000581 | -2.19 |
| Title | Cluster Plot | Dendrogram | e-value | e-value | e-value | Condition | Condition FDR | Condition Difference |
|---|---|---|---|---|---|---|---|---|
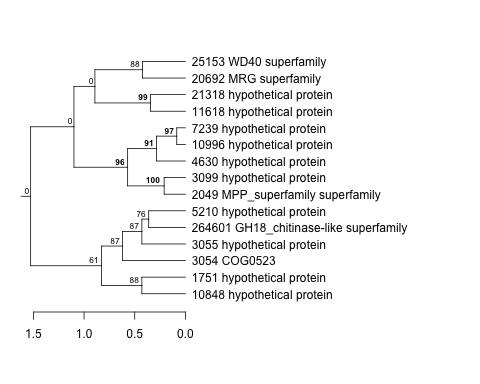
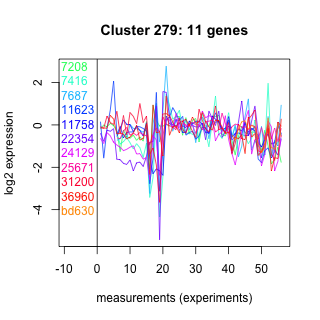
| Thaps_hclust_0279 |
 |
 |
2.7 |
22 |
38 |
lowFe_KTKB_Day3 | 0.000862 | -2.11 |
| Title | Cluster Plot | Dendrogram | e-value | e-value | e-value | Condition | Condition FDR | Condition Difference |
|---|---|---|---|---|---|---|---|---|
| Thaps_hclust_0063 |
 |
 |
9.8e-19 |
5.7e-17 |
8.2e-17 |
lowFe_KTKB_Day3 | 0.000862 | -2.08 |
| Title | Cluster Plot | Dendrogram | e-value | e-value | e-value | Condition | Condition FDR | Condition Difference |
|---|---|---|---|---|---|---|---|---|
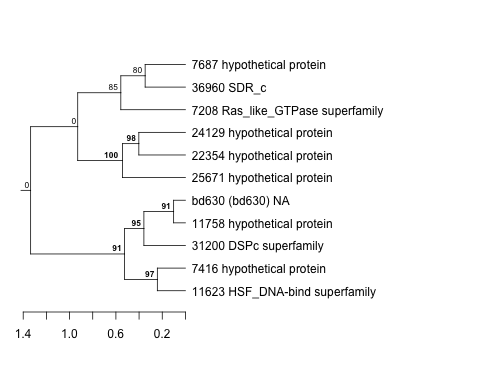
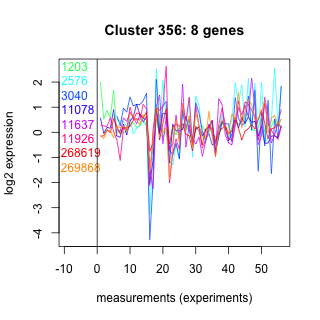
| Thaps_hclust_0356 |
 |
 |
2.1 |
41 |
71 |
lowFe_KTKB_Day3 | 0.000862 | -2.07 |
| Title | Cluster Plot | Dendrogram | e-value | e-value | e-value | Condition | Condition FDR | Condition Difference |
|---|---|---|---|---|---|---|---|---|
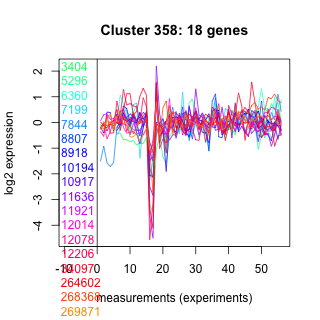
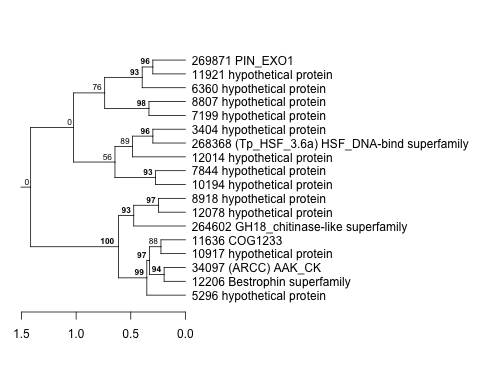
| Thaps_hclust_0358 |
 |
 |
0.18 |
390 |
1700 |
lowFe_KTKB_Day5 | 0.001320 | -2.07 |
| Thaps_hclust_0358 |
|
|
0.18 |
390 |
1700 |
lowFe_KTKB_Day3 | 0.000862 | -1.98 |
| Title | Cluster Plot | Dendrogram | e-value | e-value | e-value | Condition | Condition FDR | Condition Difference |
|---|---|---|---|---|---|---|---|---|
| Thaps_hclust_0024 |
 |
|
2.8e-19 |
1.2e-20 |
0.00000000000043 |
lowSi_TMEVA | 0.001350 | -2.07 |
| Thaps_hclust_0024 |
|
|
2.8e-19 |
1.2e-20 |
0.00000000000043 |
lowN_TMEVA | 0.001190 | -1.66 |
| Title | Cluster Plot | Dendrogram | e-value | e-value | e-value | Condition | Condition FDR | Condition Difference |
|---|---|---|---|---|---|---|---|---|
| Thaps_hclust_0494 |
 |
 |
6.7 |
15 |
60 |
lowtemp_TMEVA | 0.000735 | -2.04 |
| Title | Cluster Plot | Dendrogram | e-value | e-value | e-value | Condition | Condition FDR | Condition Difference |
|---|---|---|---|---|---|---|---|---|
| Thaps_hclust_0014 |
 |
 |
Not available | Not available | Not available | diel_light_vs_dark | 0.000485 | -2.03 |
| Title | Cluster Plot | Dendrogram | e-value | e-value | e-value | Condition | Condition FDR | Condition Difference |
|---|---|---|---|---|---|---|---|---|
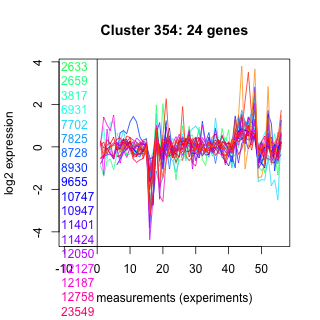
| Thaps_hclust_0354 |
 |
 |
0.027 |
0.032 |
0.78 |
lowFe_KTKB_Day3 | 0.000862 | -2.02 |
| Title | Cluster Plot | Dendrogram | e-value | e-value | e-value | Condition | Condition FDR | Condition Difference |
|---|---|---|---|---|---|---|---|---|
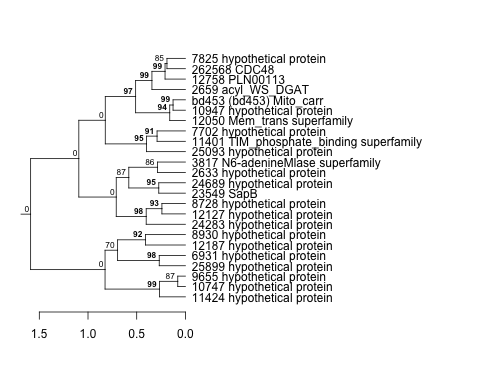
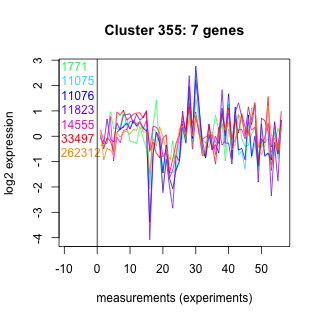
| Thaps_hclust_0355 |
 |
 |
0.49 |
16 |
310 |
lowFe_KTKB_Day3 | 0.000862 | -2.01 |
| Title | Cluster Plot | Dendrogram | e-value | e-value | e-value | Condition | Condition FDR | Condition Difference |
|---|---|---|---|---|---|---|---|---|
| Thaps_hclust_0003 |
 |
 |
0.24 |
16 |
240 |
lowFe_KTKB_Day3 | 0.000862 | -2.01 |
| Thaps_hclust_0003 |
|
|
0.24 |
16 |
240 |
BaP | 0.000370 | -1.68 |
| Title | Cluster Plot | Dendrogram | e-value | e-value | e-value | Condition | Condition FDR | Condition Difference |
|---|---|---|---|---|---|---|---|---|
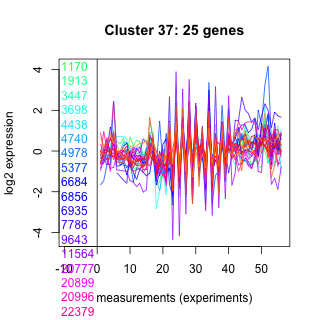
| Thaps_hclust_0037 |
 |
 |
0.23 |
0.79 |
340 |
diel_light_vs_dark | 0.000485 | -2 |
| Title | Cluster Plot | Dendrogram | e-value | e-value | e-value | Condition | Condition FDR | Condition Difference |
|---|---|---|---|---|---|---|---|---|
| Thaps_hclust_0041 |
 |
 |
4.4e-38 |
0.000000011 |
0.0000042 |
diel_light_vs_dark | 0.000485 | -1.94 |
| Title | Cluster Plot | Dendrogram | e-value | e-value | e-value | Condition | Condition FDR | Condition Difference |
|---|---|---|---|---|---|---|---|---|
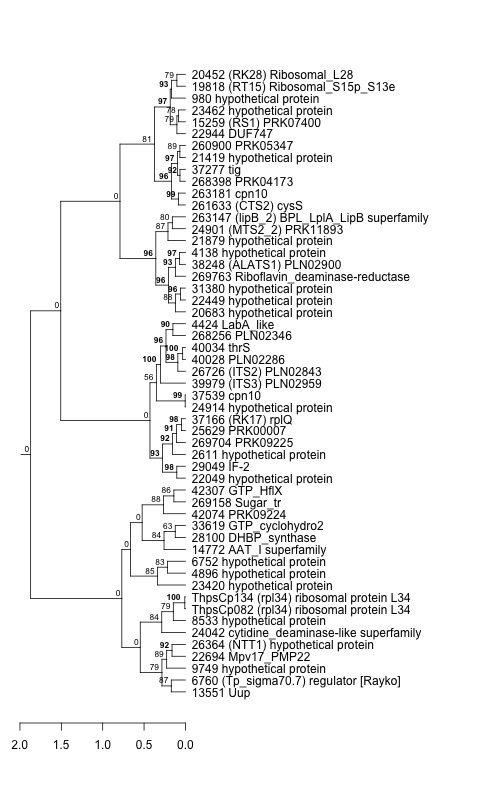
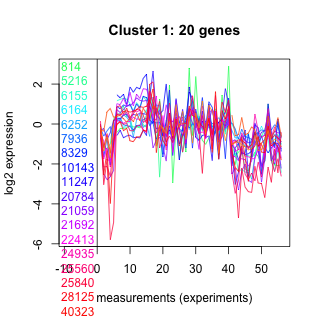
| Thaps_hclust_0001 |
 |
 |
0.0033 |
0.052 |
2 |
lowSi_TMEVA | 0.001350 | -1.92 |
| Title | Cluster Plot | Dendrogram | e-value | e-value | e-value | Condition | Condition FDR | Condition Difference |
|---|---|---|---|---|---|---|---|---|
| Thaps_hclust_0042 |
 |
 |
0.26 |
5.9 |
0.46 |
diel_light_vs_dark | 0.000485 | -1.92 |
| Title | Cluster Plot | Dendrogram | e-value | e-value | e-value | Condition | Condition FDR | Condition Difference |
|---|---|---|---|---|---|---|---|---|
| Thaps_hclust_0039 |
 |
 |
2.2e-16 |
0.000000000000049 |
0.00083 |
diel_light_vs_dark | 0.000485 | -1.91 |
| Title | Cluster Plot | Dendrogram | e-value | e-value | e-value | Condition | Condition FDR | Condition Difference |
|---|---|---|---|---|---|---|---|---|
| Thaps_hclust_0012 |
 |
 |
0.000000000019 |
0.0000000000016 |
0.0000013 |
lowSi_TMEVA | 0.001350 | -1.91 |
| Thaps_hclust_0012 |
|
|
0.000000000019 |
0.0000000000016 |
0.0000013 |
lowN_TMEVA | 0.001190 | -1.82 |
| Thaps_hclust_0012 |
|
|
0.000000000019 |
0.0000000000016 |
0.0000013 |
lowFe_TMEVA | 0.001040 | -1.74 |
| Thaps_hclust_0012 |
|
|
0.000000000019 |
0.0000000000016 |
0.0000013 |
lowtemp_TMEVA | 0.000735 | -1.72 |
| Title | Cluster Plot | Dendrogram | e-value | e-value | e-value | Condition | Condition FDR | Condition Difference |
|---|---|---|---|---|---|---|---|---|
| Thaps_hclust_0417 |
 |
 |
0.0000000018 |
0.00013 |
0.00029 |
exponential_vs_stationary_24light | 0.000581 | -1.9 |
| Thaps_hclust_0417 |
|
|
0.0000000018 |
0.00013 |
0.00029 |
diel_exponential_vs_stationary | 0.000602 | -1.64 |
| Title | Cluster Plot | Dendrogram | e-value | e-value | e-value | Condition | Condition FDR | Condition Difference |
|---|---|---|---|---|---|---|---|---|
| Thaps_hclust_0357 |
 |
 |
0.077 |
0.1 |
0.81 |
lowFe_KTKB_Day5 | 0.001320 | -1.9 |
| Title | Cluster Plot | Dendrogram | e-value | e-value | e-value | Condition | Condition FDR | Condition Difference |
|---|---|---|---|---|---|---|---|---|
| Thaps_hclust_0330 |
 |
 |
0.0000058 |
0.00000085 |
0.000041 |
exponential_vs_stationary_24light | 0.000581 | -1.85 |
| Title | Cluster Plot | Dendrogram | e-value | e-value | e-value | Condition | Condition FDR | Condition Difference |
|---|---|---|---|---|---|---|---|---|
| Thaps_hclust_0418 |
 |
 |
0.00074 |
0.0098 |
0.29 |
exponential_vs_stationary_24light | 0.000581 | -1.81 |
| Title | Cluster Plot | Dendrogram | e-value | e-value | e-value | Condition | Condition FDR | Condition Difference |
|---|---|---|---|---|---|---|---|---|
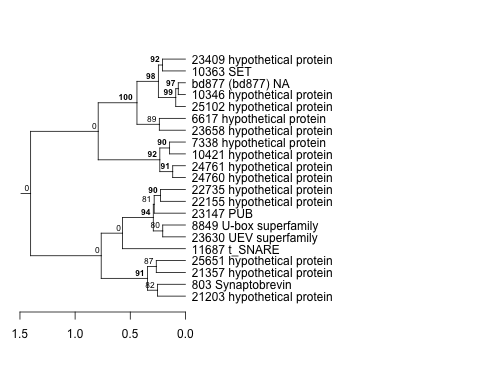
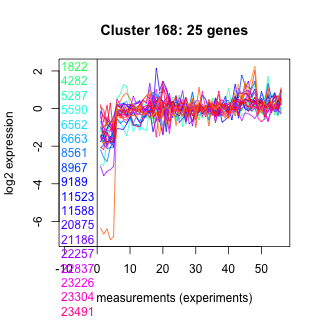
| Thaps_hclust_0168 |
 |
 |
0.00000076 |
0.000000022 |
0.0000028 |
lowFe_TMEVA | 0.001040 | -1.77 |
| Title | Cluster Plot | Dendrogram | e-value | e-value | e-value | Condition | Condition FDR | Condition Difference |
|---|---|---|---|---|---|---|---|---|
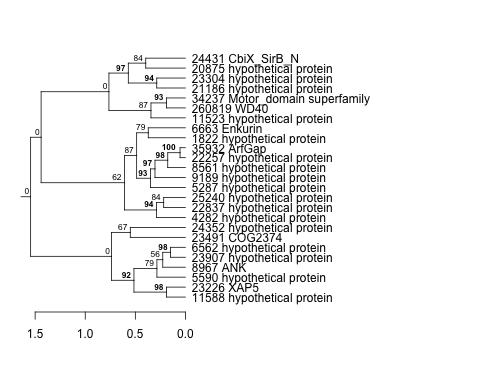
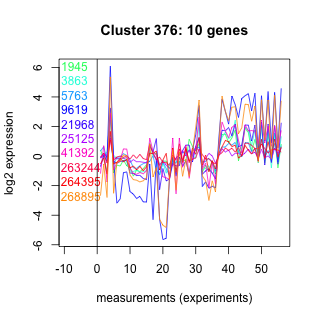
| Thaps_hclust_0376 |
 |
 |
0.42 |
3.3 |
2.4 |
exponential_vs_stationary_24light | 0.000581 | -1.77 |
| Title | Cluster Plot | Dendrogram | e-value | e-value | e-value | Condition | Condition FDR | Condition Difference |
|---|---|---|---|---|---|---|---|---|
| Thaps_hclust_0421 |
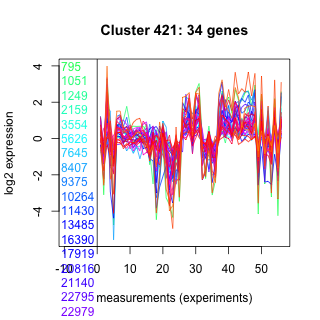 |
 |
0.0000074 |
0.00013 |
0.34 |
exponential_vs_stationary_24light | 0.000581 | -1.77 |
| Thaps_hclust_0421 |
|
|
0.0000074 |
0.00013 |
0.34 |
diel_exponential_vs_stationary | 0.000602 | -1.68 |
| Title | Cluster Plot | Dendrogram | e-value | e-value | e-value | Condition | Condition FDR | Condition Difference |
|---|---|---|---|---|---|---|---|---|
| Thaps_hclust_0416 |
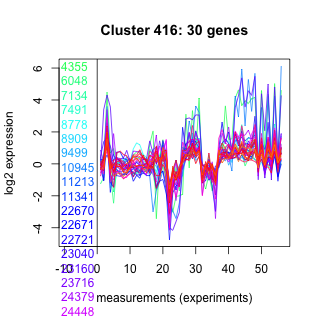 |
 |
0.00000015 |
0.00000035 |
0.7 |
diel_exponential_vs_stationary | 0.000602 | -1.75 |
| Title | Cluster Plot | Dendrogram | e-value | e-value | e-value | Condition | Condition FDR | Condition Difference |
|---|---|---|---|---|---|---|---|---|
| Thaps_hclust_0422 |
 |
 |
1.9 |
15 |
0.0027 |
exponential_vs_stationary_24light | 0.000581 | -1.75 |
| Title | Cluster Plot | Dendrogram | e-value | e-value | e-value | Condition | Condition FDR | Condition Difference |
|---|---|---|---|---|---|---|---|---|
| Thaps_hclust_0360 |
 |
 |
0.0000000013 |
0.0000000052 |
0.0000016 |
exponential_vs_stationary_24light | 0.000581 | -1.73 |
| Thaps_hclust_0360 |
|
|
0.0000000013 |
0.0000000052 |
0.0000016 |
diel_exponential_vs_stationary | 0.000602 | -1.72 |
| Title | Cluster Plot | Dendrogram | e-value | e-value | e-value | Condition | Condition FDR | Condition Difference |
|---|---|---|---|---|---|---|---|---|
| Thaps_hclust_0099 |
 |
 |
0.0000000000000032 |
0.000000000000013 |
0.000000000000025 |
lowSi_TMEVA | 0.021200 | -1.72 |
| Title | Cluster Plot | Dendrogram | e-value | e-value | e-value | Condition | Condition FDR | Condition Difference |
|---|---|---|---|---|---|---|---|---|
| Thaps_hclust_0490 |
 |
 |
0.6 |
9.5 |
74 |
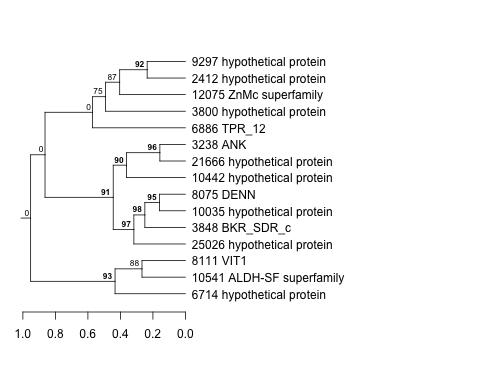
BaP | 0.000370 | -1.71 |
| Title | Cluster Plot | Dendrogram | e-value | e-value | e-value | Condition | Condition FDR | Condition Difference |
|---|---|---|---|---|---|---|---|---|
| Thaps_hclust_0444 |
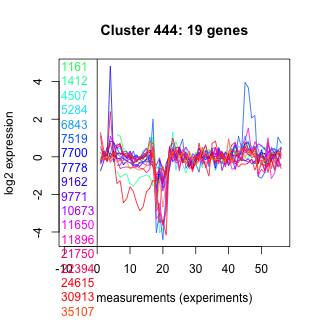 |
 |
14 |
140 |
1.6 |
BaP | 0.000370 | -1.69 |
| Title | Cluster Plot | Dendrogram | e-value | e-value | e-value | Condition | Condition FDR | Condition Difference |
|---|---|---|---|---|---|---|---|---|
| Thaps_hclust_0059 |
 |
 |
0.0000000000000026 |
0.000000000024 |
0.0000014 |
diel_light_vs_dark | 0.000485 | -1.69 |
| Title | Cluster Plot | Dendrogram | e-value | e-value | e-value | Condition | Condition FDR | Condition Difference |
|---|---|---|---|---|---|---|---|---|
| Thaps_hclust_0060 |
 |
 |
0.00000047 |
0.00077 |
0.0075 |
diel_light_vs_dark | 0.000485 | -1.68 |
| Title | Cluster Plot | Dendrogram | e-value | e-value | e-value | Condition | Condition FDR | Condition Difference |
|---|---|---|---|---|---|---|---|---|
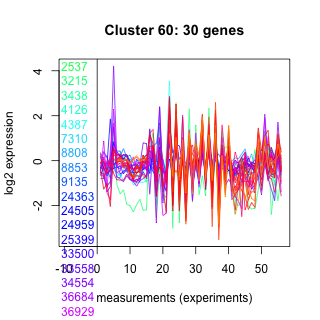
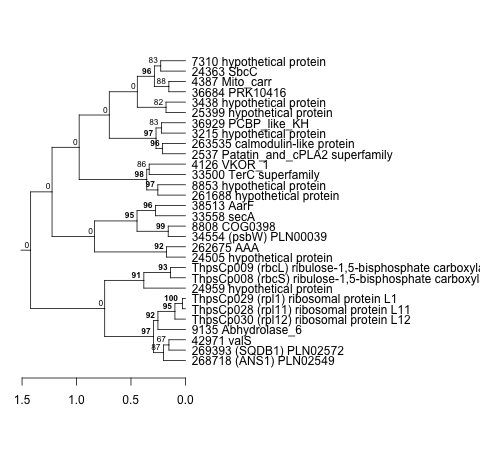
| Thaps_hclust_0385 |
 |
 |
0.000029 |
2.1 |
2.2 |
lowFe_KTKB_Day5 | 0.001320 | -1.65 |
| Title | Cluster Plot | Dendrogram | e-value | e-value | e-value | Condition | Condition FDR | Condition Difference |
|---|---|---|---|---|---|---|---|---|
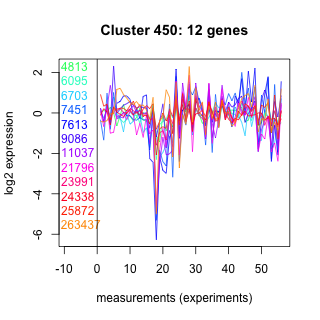
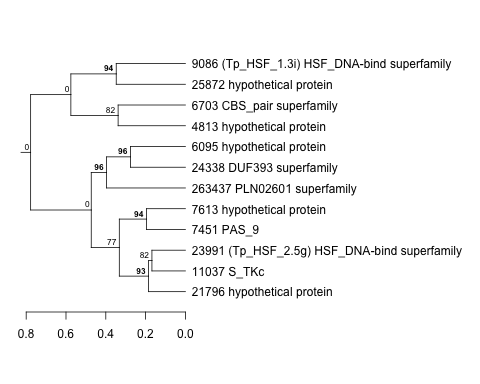
| Thaps_hclust_0450 |
 |
 |
0.00076 |
0.024 |
0.16 |
BaP | 0.000370 | -1.63 |
| Title | Cluster Plot | Dendrogram | e-value | e-value | e-value | Condition | Condition FDR | Condition Difference |
|---|---|---|---|---|---|---|---|---|
| Thaps_hclust_0065 |
 |
 |
1.5e-32 |
2.5e-32 |
9.9e-33 |
highlight_arrays | 0.000442 | -1.63 |