Hierarchical Clusters
Displaying 1001 - 1100 of 7500
| Title | Cluster Plot | Dendrogram | e-value | e-value | e-value | Condition | Condition FDR | Condition Difference |
|---|---|---|---|---|---|---|---|---|
| Thaps_hclust_0208 |
 |
|
1.2e-20 |
0.0000000000000057 |
0.0000000099 |
lowN_TMEVA | 0.001190 | -0.59 |
| Title | Cluster Plot | Dendrogram | e-value | e-value | e-value | Condition | Condition FDR | Condition Difference |
|---|---|---|---|---|---|---|---|---|
| Thaps_hclust_0014 |
 |
 |
Not available | Not available | Not available | lowN_TMEVA | 0.001190 | -1.29 |
| Thaps_hclust_0014 |
|
|
Not available | Not available | Not available | lowFe_KTKB_Day5 | 0.001320 | 0.884 |
| Title | Cluster Plot | Dendrogram | e-value | e-value | e-value | Condition | Condition FDR | Condition Difference |
|---|---|---|---|---|---|---|---|---|
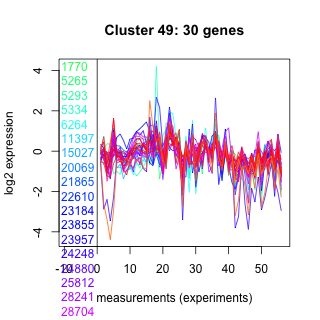
| Thaps_hclust_0049 |
 |
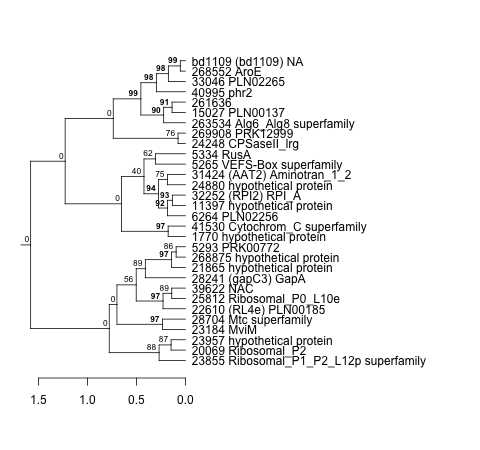 |
0.00054 |
0.0063 |
0.03 |
lowN_TMEVA | 0.001190 | -0.78 |
| Title | Cluster Plot | Dendrogram | e-value | e-value | e-value | Condition | Condition FDR | Condition Difference |
|---|---|---|---|---|---|---|---|---|
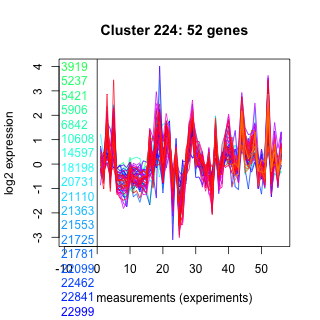
| Thaps_hclust_0224 |
 |
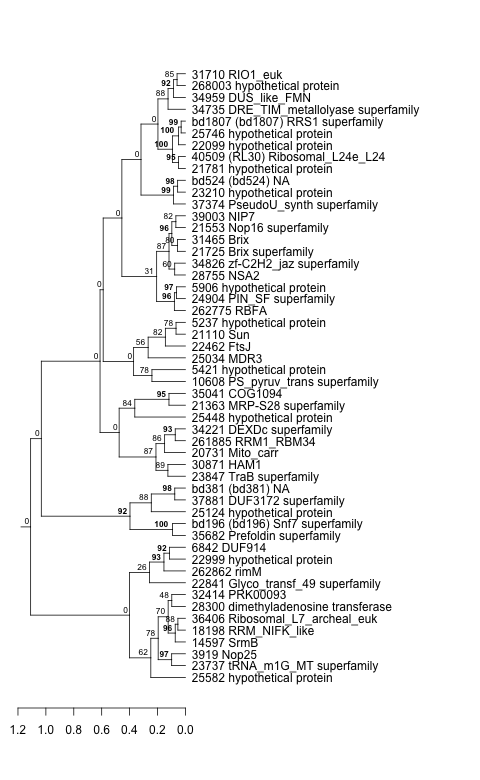 |
9.3e-28 |
1.9e-21 |
0.046 |
lowN_TMEVA | 0.001190 | 1.15 |
| Title | Cluster Plot | Dendrogram | e-value | e-value | e-value | Condition | Condition FDR | Condition Difference |
|---|---|---|---|---|---|---|---|---|
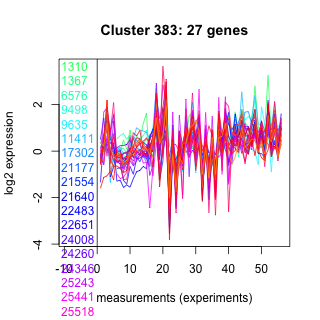
| Thaps_hclust_0383 |
 |
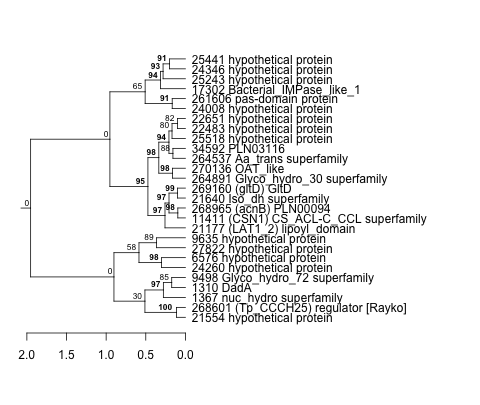 |
0.00049 |
0.088 |
0.58 |
lowN_TMEVA | 0.001190 | 1.05 |
| Title | Cluster Plot | Dendrogram | e-value | e-value | e-value | Condition | Condition FDR | Condition Difference |
|---|---|---|---|---|---|---|---|---|
| Thaps_hclust_0066 |
 |
 |
0.0000000000000019 |
0.00000025 |
0.00000047 |
lowN_TMEVA | 0.001190 | -0.762 |
| Title | Cluster Plot | Dendrogram | e-value | e-value | e-value | Condition | Condition FDR | Condition Difference |
|---|---|---|---|---|---|---|---|---|
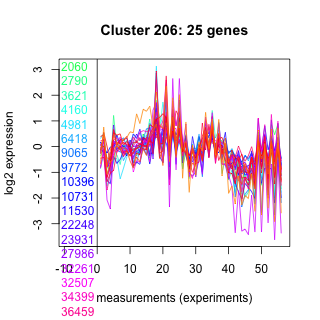
| Thaps_hclust_0206 |
 |
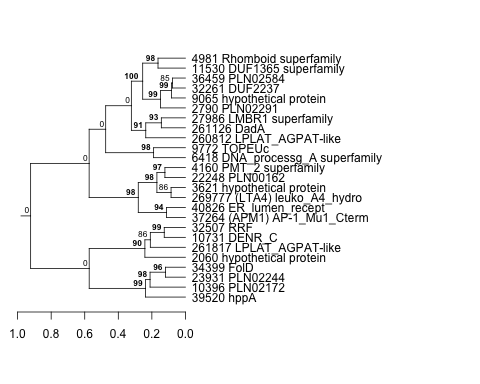 |
0.00000000000075 |
0.0000028 |
3.5 |
lowN_TMEVA | 0.001190 | -0.92 |
| Title | Cluster Plot | Dendrogram | e-value | e-value | e-value | Condition | Condition FDR | Condition Difference |
|---|---|---|---|---|---|---|---|---|
| Thaps_hclust_0117 |
 |
 |
0.0000000000002 |
0.000000021 |
0.00000045 |
lowN_TMEVA | 0.001190 | 1.73 |
| Title | Cluster Plot | Dendrogram | e-value | e-value | e-value | Condition | Condition FDR | Condition Difference |
|---|---|---|---|---|---|---|---|---|
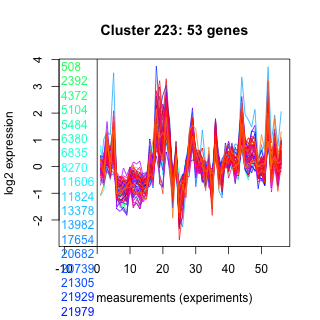
| Thaps_hclust_0223 |
 |
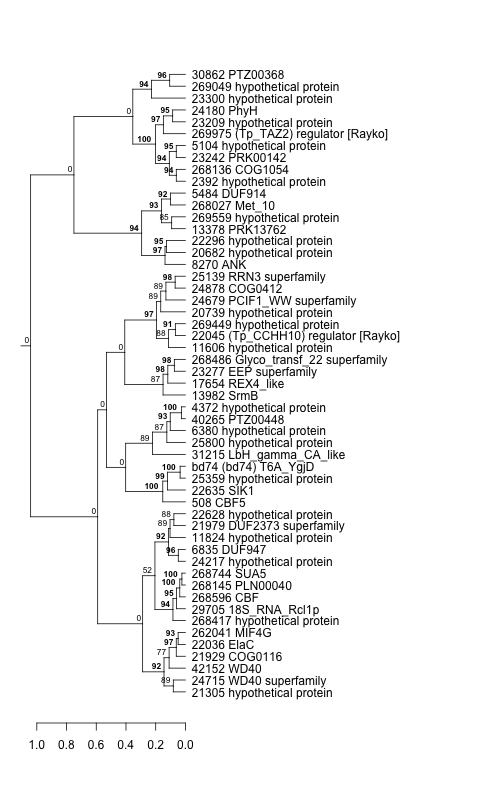 |
1.70006e-41 |
0.000000000000099 |
0.0011 |
lowN_TMEVA | 0.001190 | 0.611 |
| Title | Cluster Plot | Dendrogram | e-value | e-value | e-value | Condition | Condition FDR | Condition Difference |
|---|---|---|---|---|---|---|---|---|
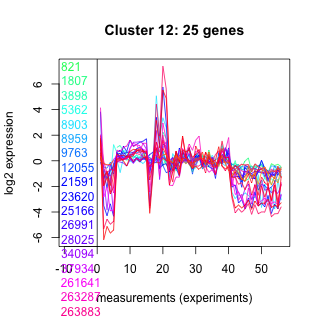
| Thaps_hclust_0012 |
 |
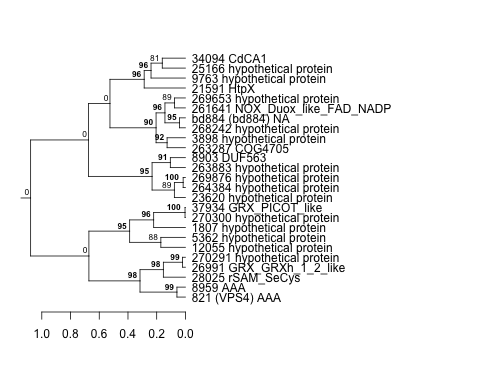 |
0.000000000019 |
0.0000000000016 |
0.0000013 |
lowN_TMEVA | 0.001190 | -1.82 |
| Title | Cluster Plot | Dendrogram | e-value | e-value | e-value | Condition | Condition FDR | Condition Difference |
|---|---|---|---|---|---|---|---|---|
| Thaps_hclust_0029 |
 |
|
9.1e-19 |
4.9e-16 |
0.00000000044 |
lowN_TMEVA | 0.001190 | -1.31 |
| Title | Cluster Plot | Dendrogram | e-value | e-value | e-value | Condition | Condition FDR | Condition Difference |
|---|---|---|---|---|---|---|---|---|
| Thaps_hclust_0082 |
 |
|
8.89825e-43 |
2e-27 |
1.3e-16 |
lowN_TMEVA | 0.001190 | -0.512 |
| Thaps_hclust_0082 |
|
|
8.89825e-43 |
2e-27 |
1.3e-16 |
lowFe_KTKB_Day5 | 0.001320 | 0.728 |
| Title | Cluster Plot | Dendrogram | e-value | e-value | e-value | Condition | Condition FDR | Condition Difference |
|---|---|---|---|---|---|---|---|---|
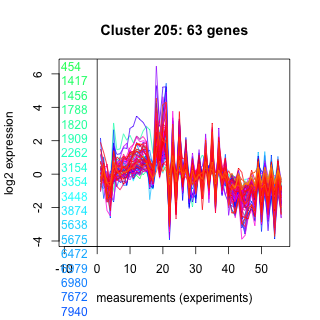
| Thaps_hclust_0205 |
 |
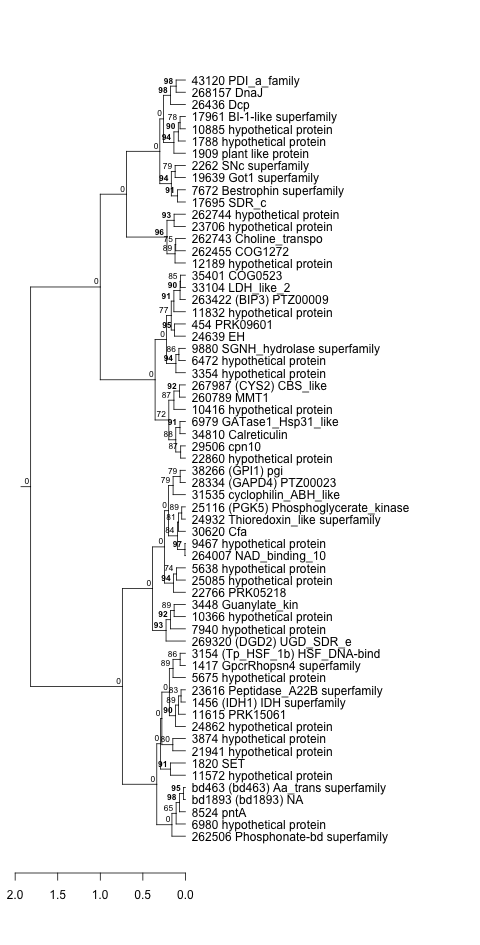 |
2.3e-23 |
7.6e-16 |
0.00000015 |
lowN_TMEVA | 0.001190 | -0.696 |
| Title | Cluster Plot | Dendrogram | e-value | e-value | e-value | Condition | Condition FDR | Condition Difference |
|---|---|---|---|---|---|---|---|---|
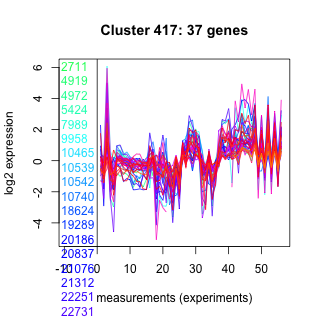
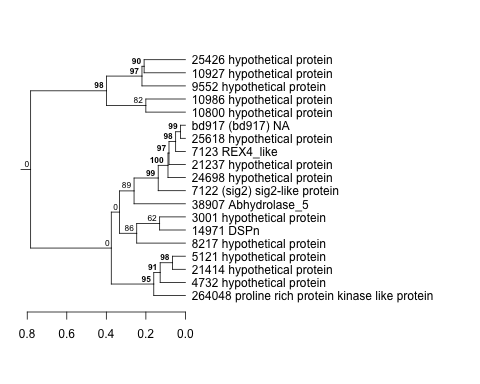
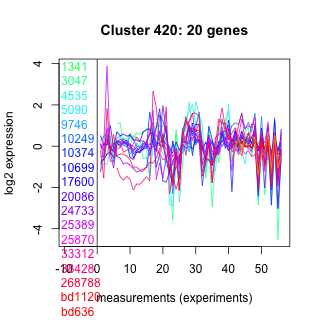
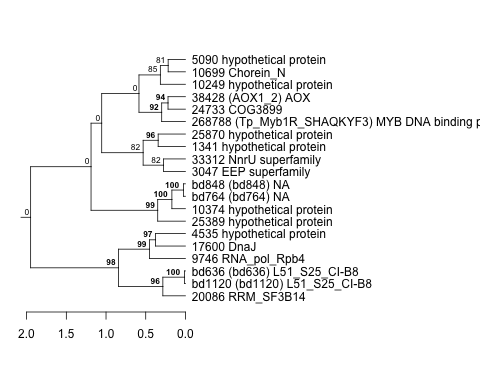
| Thaps_hclust_0417 |
 |
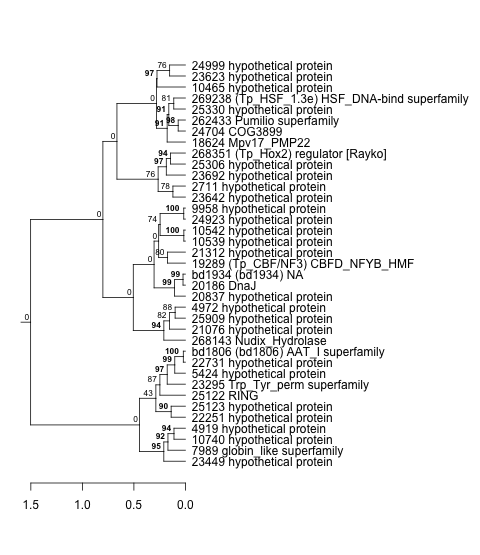 |
0.0000000018 |
0.00013 |
0.00029 |
lowN_TMEVA | 0.001190 | 1.91 |
| Title | Cluster Plot | Dendrogram | e-value | e-value | e-value | Condition | Condition FDR | Condition Difference |
|---|---|---|---|---|---|---|---|---|
| Thaps_hclust_0028 |
 |
|
1.6e-27 |
6.8e-18 |
0.0000000000000078 |
lowN_TMEVA | 0.001190 | -0.933 |
| Title | Cluster Plot | Dendrogram | e-value | e-value | e-value | Condition | Condition FDR | Condition Difference |
|---|---|---|---|---|---|---|---|---|
| Thaps_hclust_0398 |
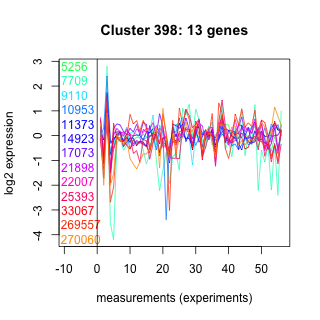 |
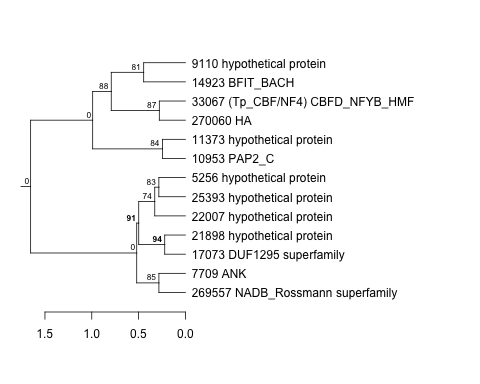 |
0.014 |
0.28 |
1.2 |
lowN_TMEVA | 0.001190 | 1.25 |
| Title | Cluster Plot | Dendrogram | e-value | e-value | e-value | Condition | Condition FDR | Condition Difference |
|---|---|---|---|---|---|---|---|---|
| Thaps_hclust_0416 |
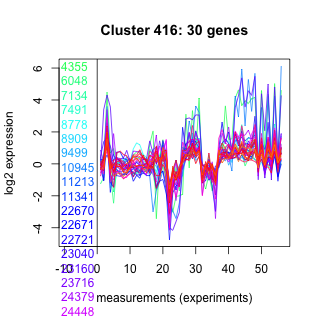 |
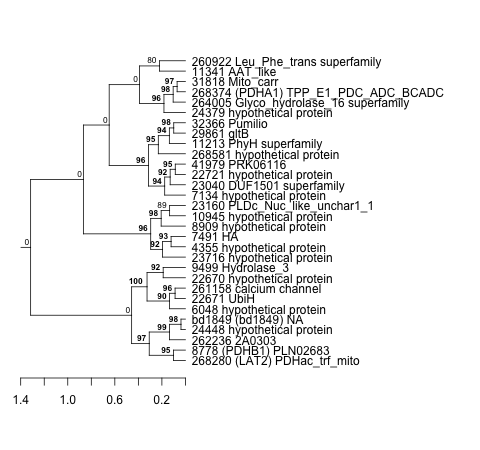 |
0.00000015 |
0.00000035 |
0.7 |
lowN_TMEVA | 0.001190 | 2.13 |
| Title | Cluster Plot | Dendrogram | e-value | e-value | e-value | Condition | Condition FDR | Condition Difference |
|---|---|---|---|---|---|---|---|---|
| Thaps_hclust_0010 |
 |
 |
0.0000000000019 |
0.000000000035 |
0.013 |
lowN_TMEVA | 0.001190 | -2.76 |
| Title | Cluster Plot | Dendrogram | e-value | e-value | e-value | Condition | Condition FDR | Condition Difference |
|---|---|---|---|---|---|---|---|---|
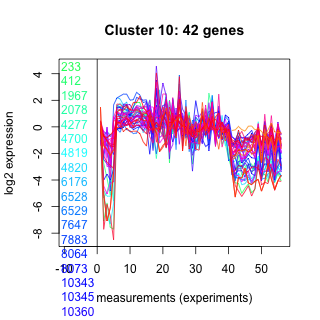
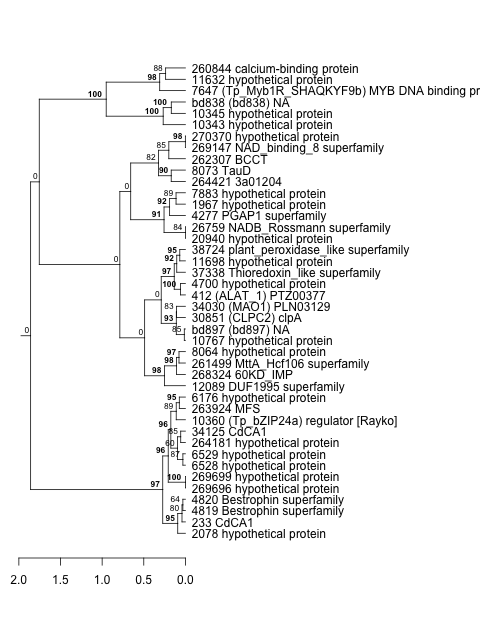
| Thaps_hclust_0328 |
 |
 |
0.00013 |
0.00001 |
0.46 |
lowN_TMEVA | 0.001190 | 1.84 |
| Title | Cluster Plot | Dendrogram | e-value | e-value | e-value | Condition | Condition FDR | Condition Difference |
|---|---|---|---|---|---|---|---|---|
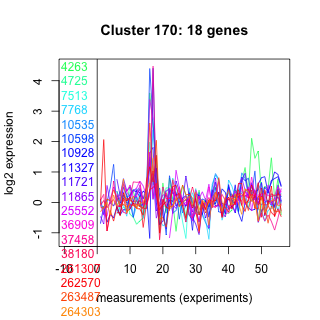
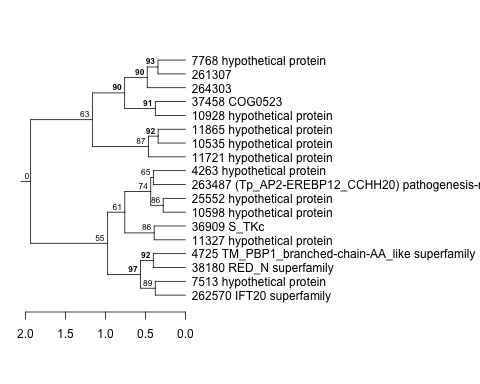
| Thaps_hclust_0168 |
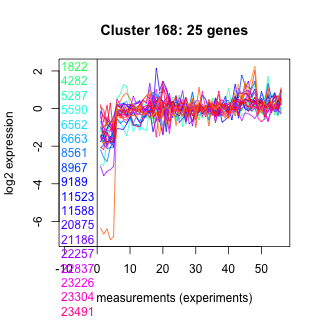 |
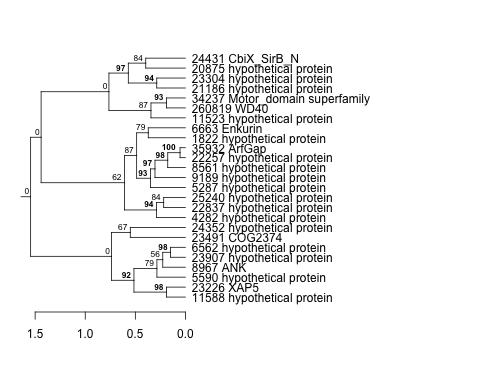 |
0.00000076 |
0.000000022 |
0.0000028 |
lowN_TMEVA | 0.001190 | -1.56 |
| Title | Cluster Plot | Dendrogram | e-value | e-value | e-value | Condition | Condition FDR | Condition Difference |
|---|---|---|---|---|---|---|---|---|
| Thaps_hclust_0221 |
 |
|
|
1e-37 |
0.0000000000012 |
lowN_TMEVA | 0.001190 | 0.702 |
| Title | Cluster Plot | Dendrogram | e-value | e-value | e-value | Condition | Condition FDR | Condition Difference |
|---|---|---|---|---|---|---|---|---|
| Thaps_hclust_0220 |
 |
|
|
2.4e-19 |
3.2e-19 |
lowN_TMEVA | 0.001190 | 0.851 |
| Title | Cluster Plot | Dendrogram | e-value | e-value | e-value | Condition | Condition FDR | Condition Difference |
|---|---|---|---|---|---|---|---|---|
| Thaps_hclust_0141 |
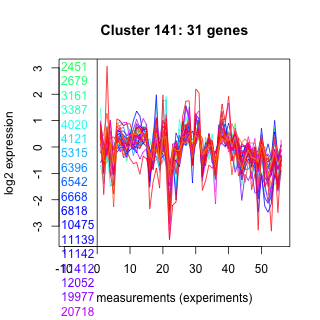 |
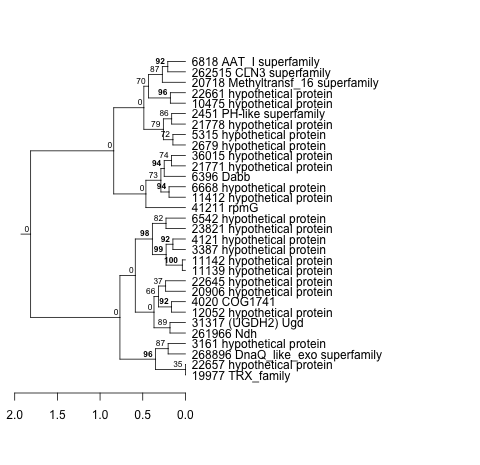 |
0.000021 |
0.0007 |
0.0051 |
co2_elevated_stat_arrays | 0.001190 | -0.549 |
| Title | Cluster Plot | Dendrogram | e-value | e-value | e-value | Condition | Condition FDR | Condition Difference |
|---|---|---|---|---|---|---|---|---|
| Thaps_hclust_0024 |
 |
|
2.8e-19 |
1.2e-20 |
0.00000000000043 |
lowN_TMEVA | 0.001190 | -1.66 |
| Thaps_hclust_0024 |
|
|
2.8e-19 |
1.2e-20 |
0.00000000000043 |
lowSi_TMEVA | 0.001350 | -2.07 |
| Title | Cluster Plot | Dendrogram | e-value | e-value | e-value | Condition | Condition FDR | Condition Difference |
|---|---|---|---|---|---|---|---|---|
| Thaps_hclust_0387 |
 |
 |
0.0023 |
0.003 |
0.38 |
co2_elevated_stat_arrays | 0.001190 | 0.611 |
| Title | Cluster Plot | Dendrogram | e-value | e-value | e-value | Condition | Condition FDR | Condition Difference |
|---|---|---|---|---|---|---|---|---|
| Thaps_hclust_0059 |
 |
 |
0.0000000000000026 |
0.000000000024 |
0.0000014 |
lowN_TMEVA | 0.001190 | -0.856 |
| Title | Cluster Plot | Dendrogram | e-value | e-value | e-value | Condition | Condition FDR | Condition Difference |
|---|---|---|---|---|---|---|---|---|
| Thaps_hclust_0023 |
 |
 |
0.000000000039 |
0.0000072 |
0.002 |
lowN_TMEVA | 0.001190 | -2.82 |
| Thaps_hclust_0023 |
|
|
0.000000000039 |
0.0000072 |
0.002 |
lowFe_KTKB_Day5 | 0.001320 | 0.499 |
| Thaps_hclust_0023 |
|
|
0.000000000039 |
0.0000072 |
0.002 |
lowSi_TMEVA | 0.001350 | -2.52 |
| Title | Cluster Plot | Dendrogram | e-value | e-value | e-value | Condition | Condition FDR | Condition Difference |
|---|---|---|---|---|---|---|---|---|
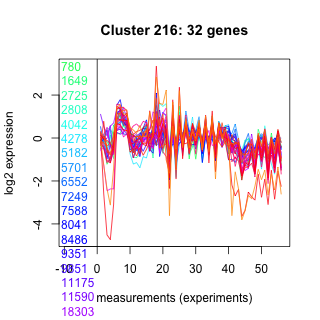
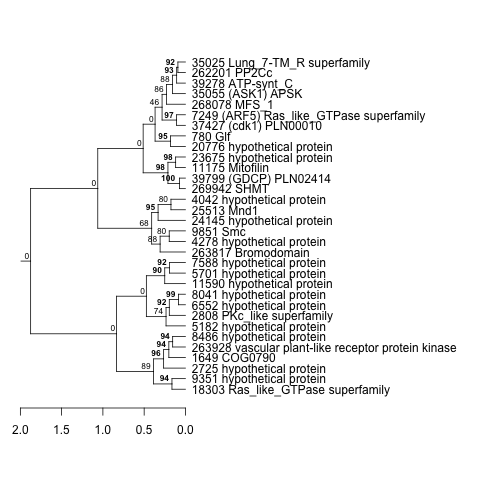
| Thaps_hclust_0216 |
 |
 |
0.0000076 |
0.019 |
0.0036 |
lowN_TMEVA | 0.001190 | -0.784 |
| Thaps_hclust_0216 |
|
|
0.0000076 |
0.019 |
0.0036 |
exponential_vs_stationary_24highlight | 0.001300 | 0.253 |
| Title | Cluster Plot | Dendrogram | e-value | e-value | e-value | Condition | Condition FDR | Condition Difference |
|---|---|---|---|---|---|---|---|---|
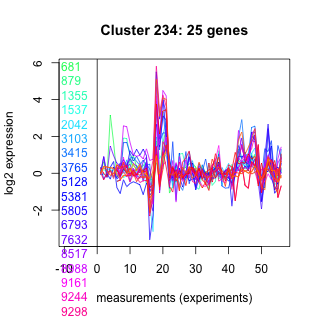
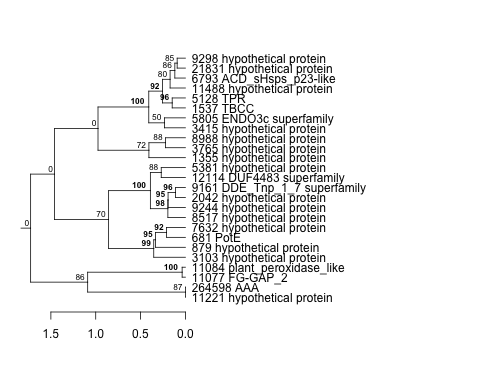
| Thaps_hclust_0234 |
 |
 |
0.036 |
0.063 |
0.24 |
highlight_arrays | 0.001240 | 0.461 |
| Thaps_hclust_0234 |
|
|
0.036 |
0.063 |
0.24 |
lowFe_KTKB_Day5 | 0.001320 | -0.905 |
| Title | Cluster Plot | Dendrogram | e-value | e-value | e-value | Condition | Condition FDR | Condition Difference |
|---|---|---|---|---|---|---|---|---|
| Thaps_hclust_0003 |
 |
 |
0.24 |
16 |
240 |
highlight_arrays | 0.001240 | 0.527 |
| Title | Cluster Plot | Dendrogram | e-value | e-value | e-value | Condition | Condition FDR | Condition Difference |
|---|---|---|---|---|---|---|---|---|
| Thaps_hclust_0016 |
 |
 |
0.000000000083 |
0.00000025 |
0.00000028 |
highlight_arrays | 0.001240 | -0.36 |
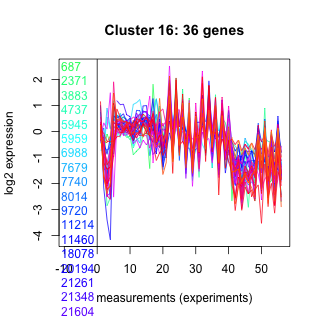
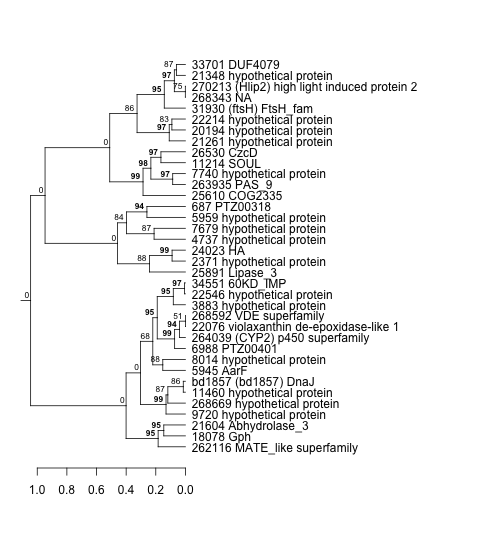
| Title | Cluster Plot | Dendrogram | e-value | e-value | e-value | Condition | Condition FDR | Condition Difference |
|---|---|---|---|---|---|---|---|---|
| Thaps_hclust_0102 |
 |
 |
3.2e-16 |
0.00000000002 |
0.0000006 |
exponential_vs_stationary_24highlight | 0.001300 | 0.245 |
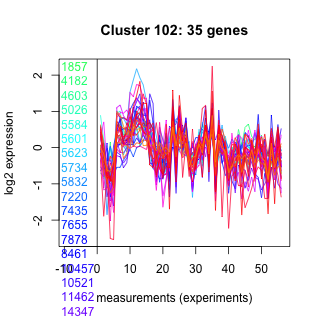
| Title | Cluster Plot | Dendrogram | e-value | e-value | e-value | Condition | Condition FDR | Condition Difference |
|---|---|---|---|---|---|---|---|---|
| Thaps_hclust_0470 |
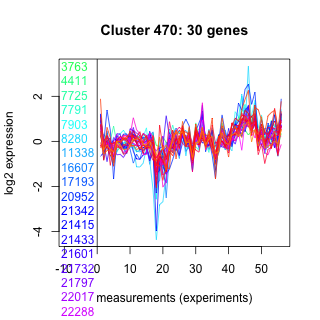 |
 |
0.0000048 |
0.00021 |
0.086 |
exponential_vs_stationary_24highlight | 0.001300 | -0.275 |
| Title | Cluster Plot | Dendrogram | e-value | e-value | e-value | Condition | Condition FDR | Condition Difference |
|---|---|---|---|---|---|---|---|---|
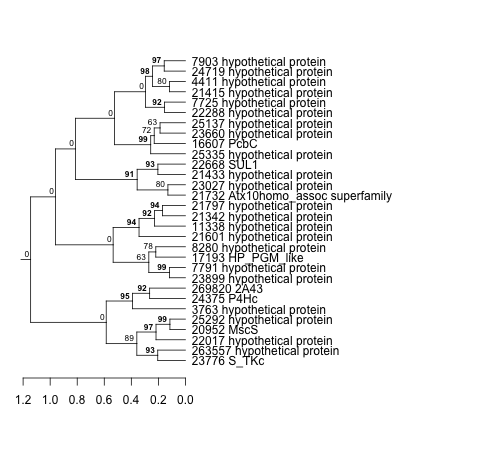
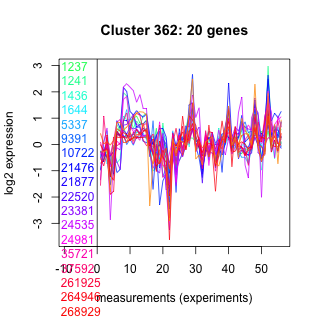
| Thaps_hclust_0362 |
 |
 |
0.00003 |
0.0033 |
0.66 |
exponential_vs_stationary_24highlight | 0.001300 | -0.314 |
| Title | Cluster Plot | Dendrogram | e-value | e-value | e-value | Condition | Condition FDR | Condition Difference |
|---|---|---|---|---|---|---|---|---|
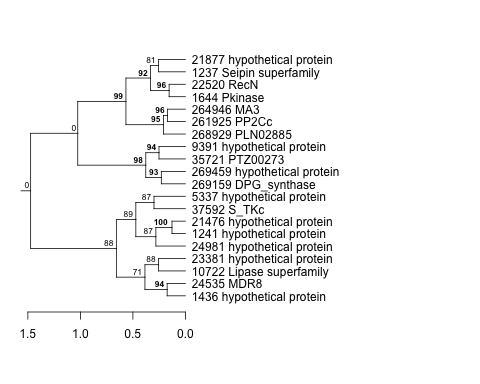
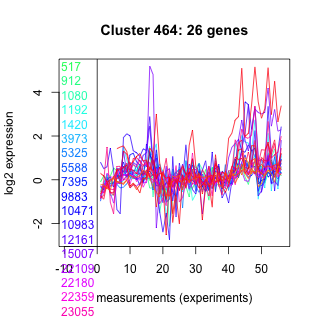
| Thaps_hclust_0464 |
 |
 |
0.0002 |
14 |
31 |
exponential_vs_stationary_24highlight | 0.001300 | -0.277 |
| Title | Cluster Plot | Dendrogram | e-value | e-value | e-value | Condition | Condition FDR | Condition Difference |
|---|---|---|---|---|---|---|---|---|
| Thaps_hclust_0213 |
 |
 |
0.0000045 |
0.075 |
0.54 |
exponential_vs_stationary_24highlight | 0.001300 | 0.21 |
| Title | Cluster Plot | Dendrogram | e-value | e-value | e-value | Condition | Condition FDR | Condition Difference |
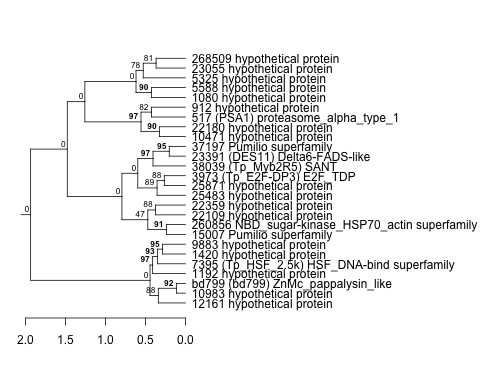
|---|---|---|---|---|---|---|---|---|
| Thaps_hclust_0424 |
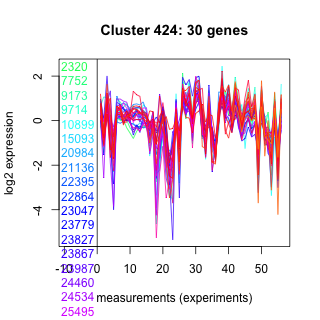 |
 |
0.012 |
0.74 |
0.26 |
exponential_vs_stationary_24highlight | 0.001300 | -0.292 |
| Title | Cluster Plot | Dendrogram | e-value | e-value | e-value | Condition | Condition FDR | Condition Difference |
|---|---|---|---|---|---|---|---|---|
| Thaps_hclust_0152 |
 |
 |
0.00015 |
0.00023 |
0.031 |
lowFe_KTKB_Day5 | 0.001320 | -1.32 |
| Title | Cluster Plot | Dendrogram | e-value | e-value | e-value | Condition | Condition FDR | Condition Difference |
|---|---|---|---|---|---|---|---|---|
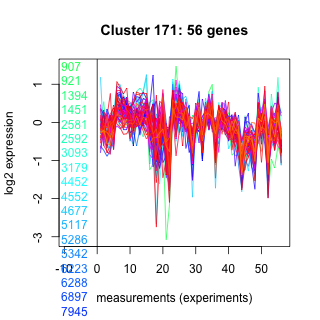
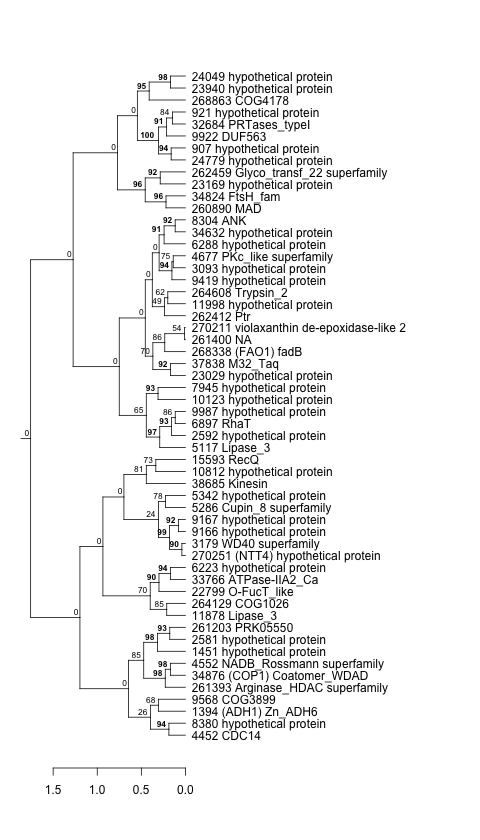
| Thaps_hclust_0170 |
 |
 |
0.028 |
1.8 |
150 |
lowFe_KTKB_Day5 | 0.001320 | 1.61 |
| Title | Cluster Plot | Dendrogram | e-value | e-value | e-value | Condition | Condition FDR | Condition Difference |
|---|---|---|---|---|---|---|---|---|
| Thaps_hclust_0171 |
 |
 |
0.0000000000052 |
0.000000000056 |
0.000000000083 |
BaP | 0.001320 | -0.399 |
| Title | Cluster Plot | Dendrogram | e-value | e-value | e-value | Condition | Condition FDR | Condition Difference |
|---|---|---|---|---|---|---|---|---|
| Thaps_hclust_0046 |
 |
 |
0.00000051 |
0.000067 |
0.29 |
lowFe_KTKB_Day5 | 0.001320 | -0.639 |
| Title | Cluster Plot | Dendrogram | e-value | e-value | e-value | Condition | Condition FDR | Condition Difference |
|---|---|---|---|---|---|---|---|---|
| Thaps_hclust_0468 |
 |
 |
0.0023 |
0.08 |
2.3 |
lowFe_KTKB_Day5 | 0.001320 | -0.628 |
| Title | Cluster Plot | Dendrogram | e-value | e-value | e-value | Condition | Condition FDR | Condition Difference |
|---|---|---|---|---|---|---|---|---|
| Thaps_hclust_0043 |
 |
 |
3.9e-18 |
0.0000000053 |
2 |
lowFe_KTKB_Day5 | 0.001320 | 0.376 |
| Title | Cluster Plot | Dendrogram | e-value | e-value | e-value | Condition | Condition FDR | Condition Difference |
|---|---|---|---|---|---|---|---|---|
| Thaps_hclust_0324 |
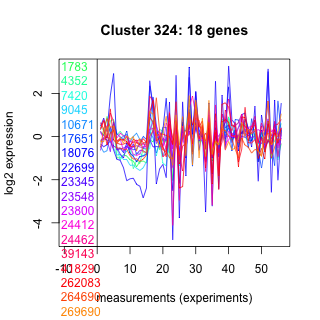 |
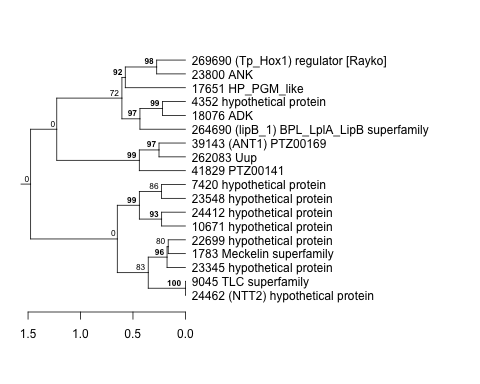 |
0.0023 |
2.4 |
5.1 |
lowFe_KTKB_Day5 | 0.001320 | 0.767 |
| Title | Cluster Plot | Dendrogram | e-value | e-value | e-value | Condition | Condition FDR | Condition Difference |
|---|---|---|---|---|---|---|---|---|
| Thaps_hclust_0326 |
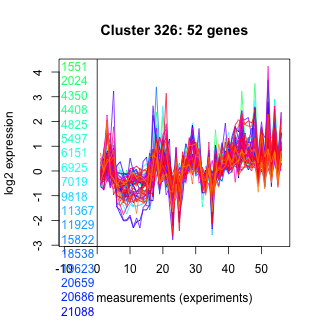 |
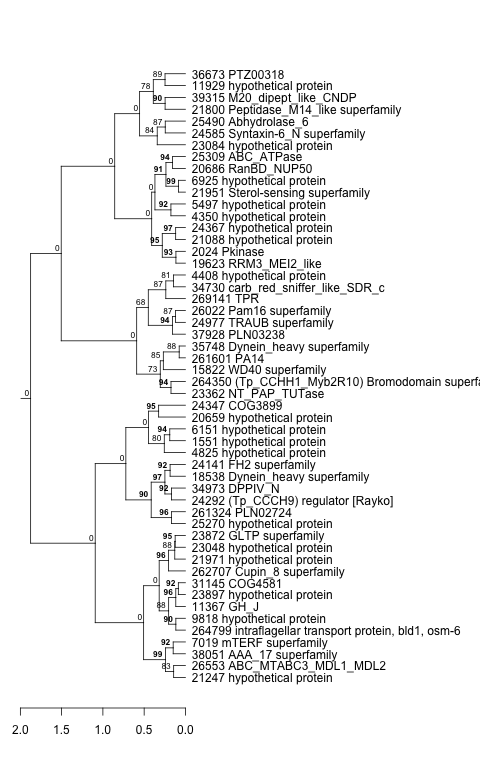 |
0.000000000000042 |
0.00000000011 |
0.00000051 |
BaP | 0.001320 | 0.396 |
| Title | Cluster Plot | Dendrogram | e-value | e-value | e-value | Condition | Condition FDR | Condition Difference |
|---|---|---|---|---|---|---|---|---|
| Thaps_hclust_0360 |
 |
 |
0.0000000013 |
0.0000000052 |
0.0000016 |
lowFe_KTKB_Day5 | 0.001320 | 1.72 |
| Title | Cluster Plot | Dendrogram | e-value | e-value | e-value | Condition | Condition FDR | Condition Difference |
|---|---|---|---|---|---|---|---|---|
| Thaps_hclust_0041 |
 |
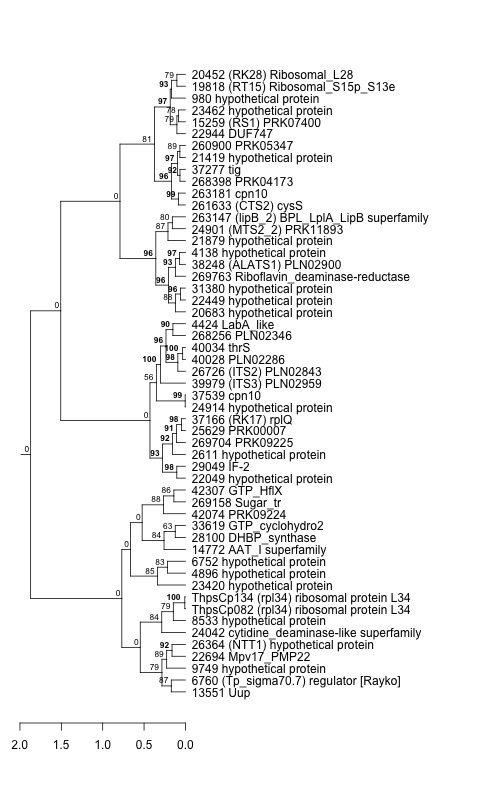 |
4.4e-38 |
0.000000011 |
0.0000042 |
lowFe_KTKB_Day5 | 0.001320 | 0.454 |
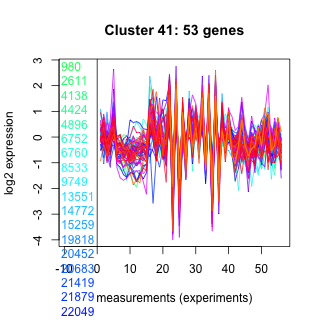
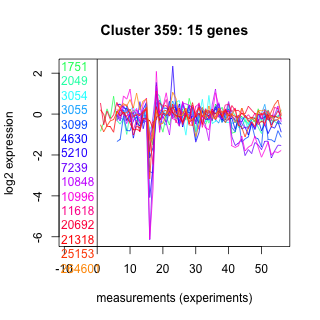
| Title | Cluster Plot | Dendrogram | e-value | e-value | e-value | Condition | Condition FDR | Condition Difference |
|---|---|---|---|---|---|---|---|---|
| Thaps_hclust_0359 |
 |
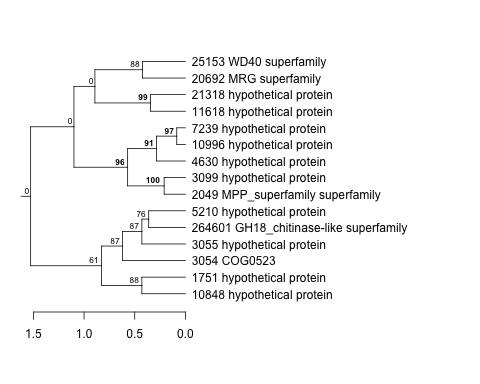 |
0.5 |
11 |
31 |
lowFe_KTKB_Day5 | 0.001320 | -1.51 |
| Title | Cluster Plot | Dendrogram | e-value | e-value | e-value | Condition | Condition FDR | Condition Difference |
|---|---|---|---|---|---|---|---|---|
| Thaps_hclust_0357 |
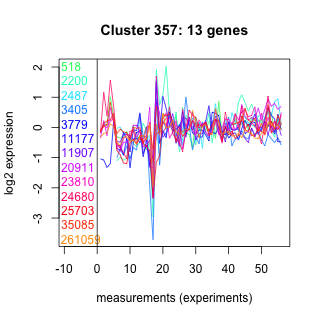 |
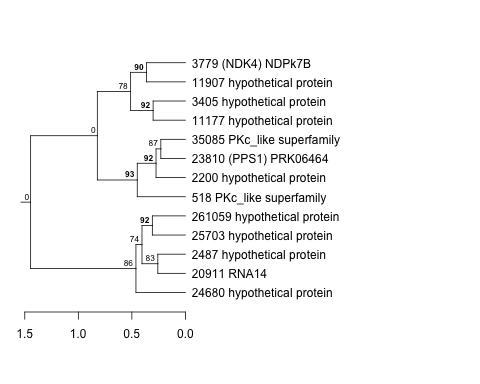 |
0.077 |
0.1 |
0.81 |
lowFe_KTKB_Day5 | 0.001320 | -1.9 |
| Title | Cluster Plot | Dendrogram | e-value | e-value | e-value | Condition | Condition FDR | Condition Difference |
|---|---|---|---|---|---|---|---|---|
| Thaps_hclust_0358 |
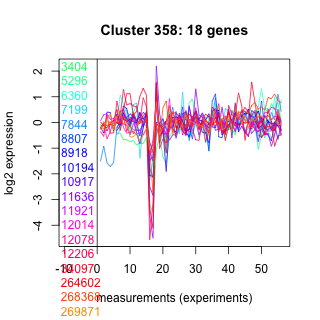 |
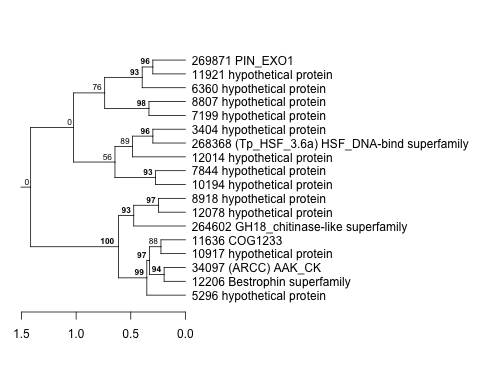 |
0.18 |
390 |
1700 |
lowFe_KTKB_Day5 | 0.001320 | -2.07 |
| Title | Cluster Plot | Dendrogram | e-value | e-value | e-value | Condition | Condition FDR | Condition Difference |
|---|---|---|---|---|---|---|---|---|
| Thaps_hclust_0093 |
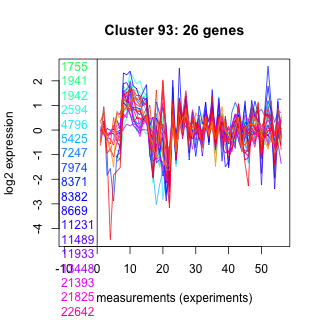 |
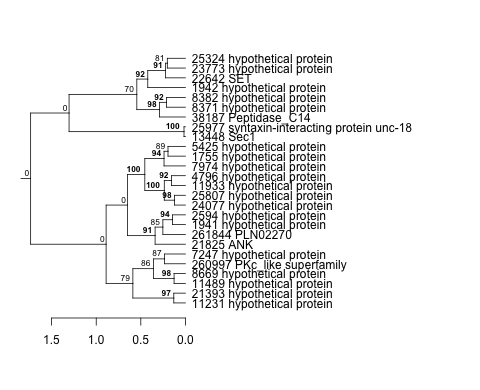 |
0.0000082 |
0.022 |
0.0012 |
lowFe_KTKB_Day5 | 0.001320 | -0.741 |
| Title | Cluster Plot | Dendrogram | e-value | e-value | e-value | Condition | Condition FDR | Condition Difference |
|---|---|---|---|---|---|---|---|---|
| Thaps_hclust_0022 |
 |
|
1.9e-31 |
2.4e-22 |
6.4e-20 |
lowFe_KTKB_Day5 | 0.001320 | -0.682 |
| Thaps_hclust_0022 |
|
|
1.9e-31 |
2.4e-22 |
6.4e-20 |
lowSi_TMEVA | 0.001350 | -4.7 |
| Title | Cluster Plot | Dendrogram | e-value | e-value | e-value | Condition | Condition FDR | Condition Difference |
|---|---|---|---|---|---|---|---|---|
| Thaps_hclust_0340 |
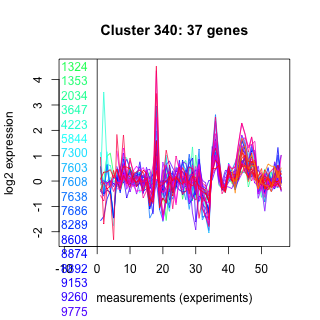 |
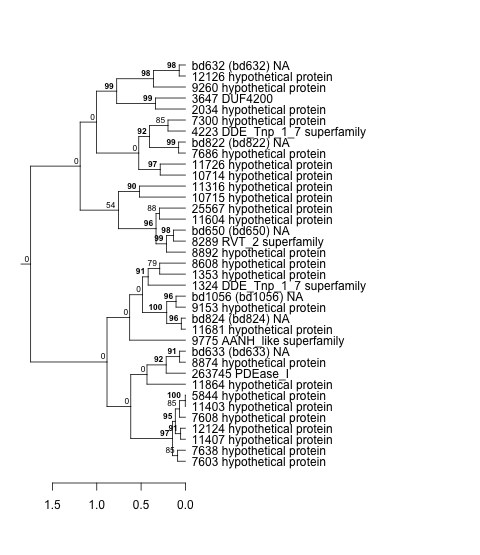 |
0.00000000039 |
0.0000000031 |
0.0000002 |
lowFe_KTKB_Day5 | 0.001320 | -0.398 |
| Title | Cluster Plot | Dendrogram | e-value | e-value | e-value | Condition | Condition FDR | Condition Difference |
|---|---|---|---|---|---|---|---|---|
| Thaps_hclust_0092 |
 |
|
1.3e-37 |
4.2e-20 |
0.0000000000000013 |
lowFe_KTKB_Day5 | 0.001320 | 0.343 |
| Thaps_hclust_0092 |
|
|
1.3e-37 |
4.2e-20 |
0.0000000000000013 |
lowSi_TMEVA | 0.001350 | -1.05 |
| Title | Cluster Plot | Dendrogram | e-value | e-value | e-value | Condition | Condition FDR | Condition Difference |
|---|---|---|---|---|---|---|---|---|
| Thaps_hclust_0321 |
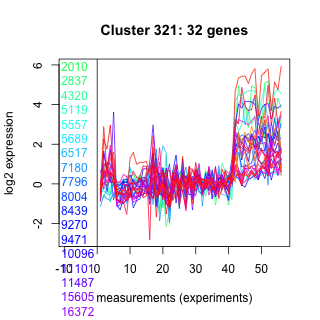 |
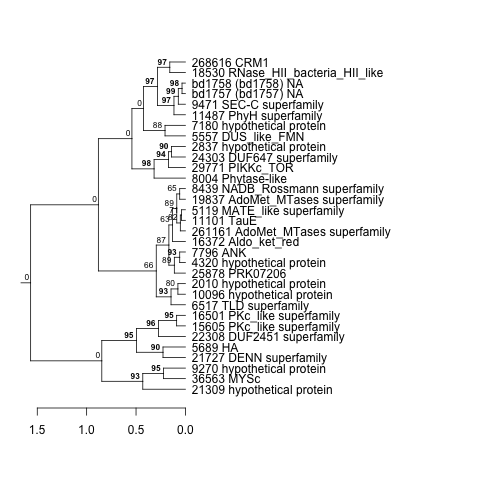 |
0.000000086 |
0.0000000042 |
0.0000028 |
lowFe_KTKB_Day5 | 0.001320 | 0.523 |
| Title | Cluster Plot | Dendrogram | e-value | e-value | e-value | Condition | Condition FDR | Condition Difference |
|---|---|---|---|---|---|---|---|---|
| Thaps_hclust_0004 |
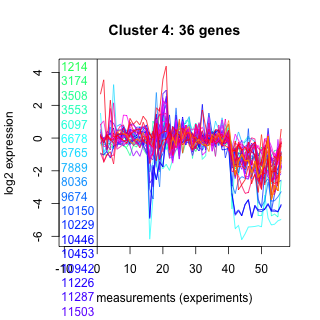 |
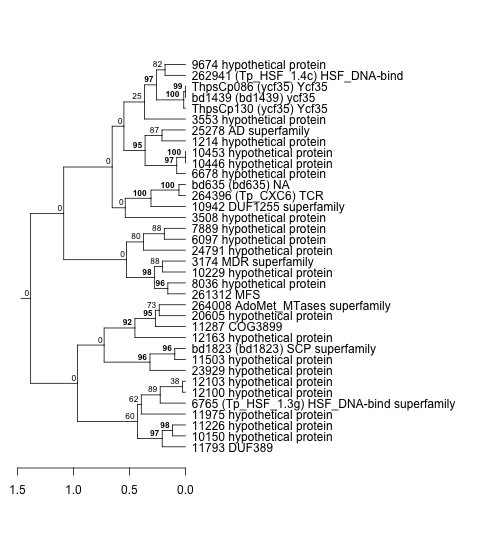 |
0.000000074 |
0.0000031 |
0.0000044 |
lowFe_KTKB_Day5 | 0.001320 | -0.837 |
| Title | Cluster Plot | Dendrogram | e-value | e-value | e-value | Condition | Condition FDR | Condition Difference |
|---|---|---|---|---|---|---|---|---|
| Thaps_hclust_0111 |
 |
 |
0.00032 |
0.0074 |
0.8 |
BaP | 0.001320 | 0.726 |
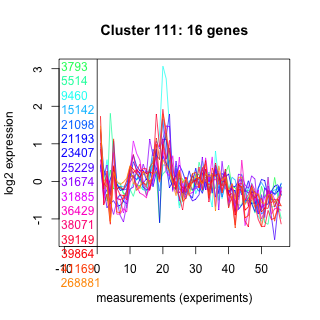
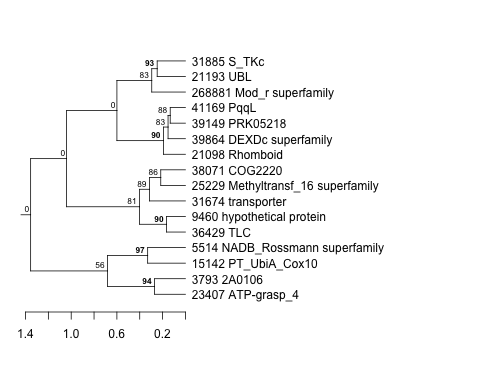
| Title | Cluster Plot | Dendrogram | e-value | e-value | e-value | Condition | Condition FDR | Condition Difference |
|---|---|---|---|---|---|---|---|---|
| Thaps_hclust_0445 |
 |
 |
0.000046 |
6.9 |
33 |
BaP | 0.001320 | -0.696 |
| Title | Cluster Plot | Dendrogram | e-value | e-value | e-value | Condition | Condition FDR | Condition Difference |
|---|---|---|---|---|---|---|---|---|
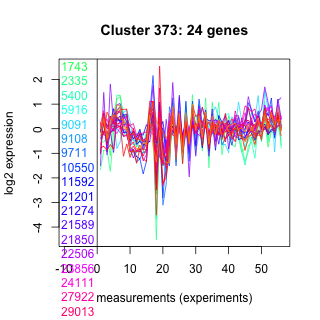
| Thaps_hclust_0373 |
 |
 |
0.00017 |
0.001 |
0.066 |
lowFe_KTKB_Day5 | 0.001320 | 0.536 |
| Title | Cluster Plot | Dendrogram | e-value | e-value | e-value | Condition | Condition FDR | Condition Difference |
|---|---|---|---|---|---|---|---|---|
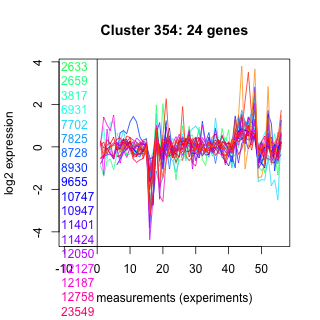
| Thaps_hclust_0354 |
 |
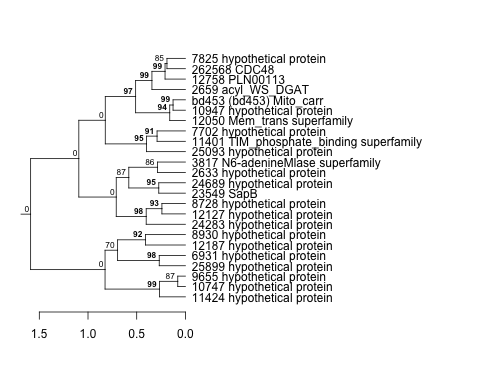 |
0.027 |
0.032 |
0.78 |
lowFe_KTKB_Day5 | 0.001320 | -1.33 |
| Title | Cluster Plot | Dendrogram | e-value | e-value | e-value | Condition | Condition FDR | Condition Difference |
|---|---|---|---|---|---|---|---|---|
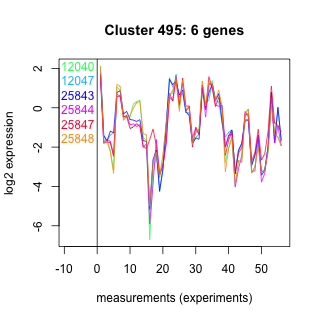
| Thaps_hclust_0495 |
 |
 |
0.0000000031 |
0.00000049 |
0.0000038 |
lowFe_KTKB_Day5 | 0.001320 | -2.74 |
| Title | Cluster Plot | Dendrogram | e-value | e-value | e-value | Condition | Condition FDR | Condition Difference |
|---|---|---|---|---|---|---|---|---|
| Thaps_hclust_0441 |
 |
 |
0.00081 |
0.001 |
0.0015 |
lowFe_KTKB_Day5 | 0.001320 | 3.17 |
| Title | Cluster Plot | Dendrogram | e-value | e-value | e-value | Condition | Condition FDR | Condition Difference |
|---|---|---|---|---|---|---|---|---|
| Thaps_hclust_0001 |
 |
 |
0.0033 |
0.052 |
2 |
lowFe_KTKB_Day5 | 0.001320 | 0.726 |
| Thaps_hclust_0001 |
|
|
0.0033 |
0.052 |
2 |
lowSi_TMEVA | 0.001350 | -1.92 |
| Title | Cluster Plot | Dendrogram | e-value | e-value | e-value | Condition | Condition FDR | Condition Difference |
|---|---|---|---|---|---|---|---|---|
| Thaps_hclust_0459 |
 |
 |
0.00000000015 |
0.0000000056 |
0.000000015 |
lowFe_KTKB_Day5 | 0.001320 | -0.338 |
| Title | Cluster Plot | Dendrogram | e-value | e-value | e-value | Condition | Condition FDR | Condition Difference |
|---|---|---|---|---|---|---|---|---|
| Thaps_hclust_0017 |
 |
 |
4.6e-24 |
0.00000000000046 |
0.000000000000098 |
lowFe_KTKB_Day5 | 0.001320 | 0.772 |
| Thaps_hclust_0017 |
|
|
4.6e-24 |
0.00000000000046 |
0.000000000000098 |
lowSi_TMEVA | 0.001350 | -1.05 |
| Title | Cluster Plot | Dendrogram | e-value | e-value | e-value | Condition | Condition FDR | Condition Difference |
|---|---|---|---|---|---|---|---|---|
| Thaps_hclust_0474 |
 |
 |
0.0078 |
0.000018 |
0.003 |
lowFe_KTKB_Day5 | 0.001320 | 0.396 |
| Title | Cluster Plot | Dendrogram | e-value | e-value | e-value | Condition | Condition FDR | Condition Difference |
|---|---|---|---|---|---|---|---|---|
| Thaps_hclust_0386 |
 |
 |
0.00000064 |
0.00000005 |
0.00054 |
lowFe_KTKB_Day5 | 0.001320 | -1.49 |
| Title | Cluster Plot | Dendrogram | e-value | e-value | e-value | Condition | Condition FDR | Condition Difference |
|---|---|---|---|---|---|---|---|---|
| Thaps_hclust_0316 |
 |
 |
0.14 |
2.2 |
4.4 |
lowFe_KTKB_Day5 | 0.001320 | 1.27 |
| Title | Cluster Plot | Dendrogram | e-value | e-value | e-value | Condition | Condition FDR | Condition Difference |
|---|---|---|---|---|---|---|---|---|
| Thaps_hclust_0385 |
 |
 |
0.000029 |
2.1 |
2.2 |
lowFe_KTKB_Day5 | 0.001320 | -1.65 |
| Title | Cluster Plot | Dendrogram | e-value | e-value | e-value | Condition | Condition FDR | Condition Difference |
|---|---|---|---|---|---|---|---|---|
| Thaps_hclust_0420 |
 |
 |
0.000009 |
0.00077 |
0.53 |
lowFe_KTKB_Day5 | 0.001320 | 0.607 |
| Title | Cluster Plot | Dendrogram | e-value | e-value | e-value | Condition | Condition FDR | Condition Difference |
|---|---|---|---|---|---|---|---|---|
| Thaps_hclust_0384 |
 |
 |
0.0000000074 |
0.000000031 |
0.12 |
lowFe_KTKB_Day5 | 0.001320 | -1.61 |
| Title | Cluster Plot | Dendrogram | e-value | e-value | e-value | Condition | Condition FDR | Condition Difference |
|---|---|---|---|---|---|---|---|---|
| Thaps_hclust_0490 |
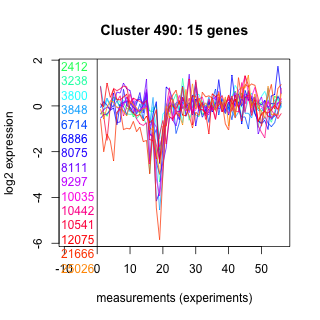 |
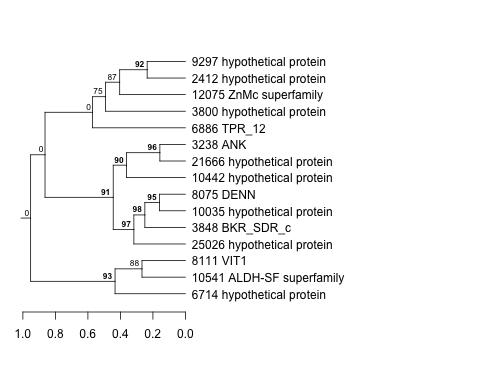 |
0.6 |
9.5 |
74 |
lowFe_KTKB_Day5 | 0.001320 | -0.758 |
| Title | Cluster Plot | Dendrogram | e-value | e-value | e-value | Condition | Condition FDR | Condition Difference |
|---|---|---|---|---|---|---|---|---|
| Thaps_hclust_0314 |
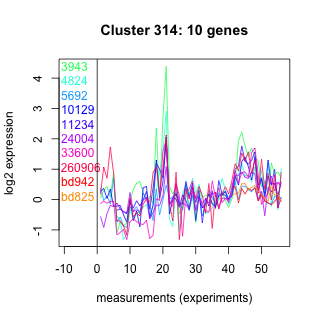 |
 |
0.052 |
1.9 |
8.5 |
BaP | 0.001320 | 1.03 |
| Title | Cluster Plot | Dendrogram | e-value | e-value | e-value | Condition | Condition FDR | Condition Difference |
|---|---|---|---|---|---|---|---|---|
| Thaps_hclust_0048 |
 |
 |
4.8e-17 |
0.000000018 |
0.0000097 |
lowFe_KTKB_Day5 | 0.001320 | 0.84 |
| Title | Cluster Plot | Dendrogram | e-value | e-value | e-value | Condition | Condition FDR | Condition Difference |
|---|---|---|---|---|---|---|---|---|
| Thaps_hclust_0065 |
 |
 |
1.5e-32 |
2.5e-32 |
9.9e-33 |
lowFe_KTKB_Day5 | 0.001320 | -0.51 |
| Title | Cluster Plot | Dendrogram | e-value | e-value | e-value | Condition | Condition FDR | Condition Difference |
|---|---|---|---|---|---|---|---|---|
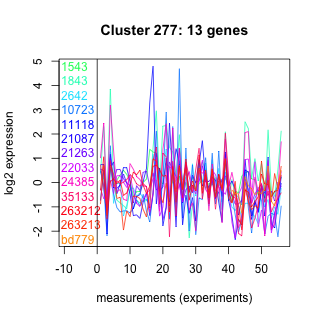
| Thaps_hclust_0277 |
 |
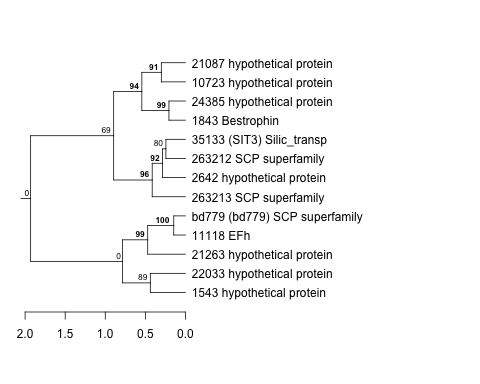 |
0.00036 |
6.6 |
7.6 |
lowFe_KTKB_Day5 | 0.001320 | 0.871 |
| Title | Cluster Plot | Dendrogram | e-value | e-value | e-value | Condition | Condition FDR | Condition Difference |
|---|---|---|---|---|---|---|---|---|
| Thaps_hclust_0006 |
 |
 |
0.0000000000025 |
0.000000092 |
0.000086 |
lowSi_TMEVA | 0.001350 | -1.17 |
| Title | Cluster Plot | Dendrogram | e-value | e-value | e-value | Condition | Condition FDR | Condition Difference |
|---|---|---|---|---|---|---|---|---|
| Thaps_hclust_0376 |
 |
 |
0.42 |
3.3 |
2.4 |
lowSi_TMEVA | 0.001350 | 2.82 |
| Title | Cluster Plot | Dendrogram | e-value | e-value | e-value | Condition | Condition FDR | Condition Difference |
|---|---|---|---|---|---|---|---|---|
| Thaps_hclust_0094 |
 |
 |
0.0000000025 |
0.000014 |
0.0000045 |
lowSi_TMEVA | 0.001350 | -0.996 |
| Title | Cluster Plot | Dendrogram | e-value | e-value | e-value | Condition | Condition FDR | Condition Difference |
|---|---|---|---|---|---|---|---|---|
| Thaps_hclust_0446 |
 |
 |
0.0000045 |
0.018 |
0.021 |
lowSi_TMEVA | 0.001350 | -1.25 |
| Title | Cluster Plot | Dendrogram | e-value | e-value | e-value | Condition | Condition FDR | Condition Difference |
|---|---|---|---|---|---|---|---|---|
| Thaps_hclust_0058 |
 |
 |
0.000000037 |
0.000000014 |
0.00000069 |
lowSi_TMEVA | 0.001350 | -0.989 |
| Title | Cluster Plot | Dendrogram | e-value | e-value | e-value | Condition | Condition FDR | Condition Difference |
|---|---|---|---|---|---|---|---|---|
| Thaps_hclust_0215 |
 |
 |
0.000036 |
0.0000076 |
0.000057 |
lowSi_TMEVA | 0.001350 | -1.45 |
| Title | Cluster Plot | Dendrogram | e-value | e-value | e-value | Condition | Condition FDR | Condition Difference |
|---|---|---|---|---|---|---|---|---|
| Thaps_hclust_0496 |
 |
 |
0.00082 |
0.0031 |
0.43 |
lowSi_TMEVA | 0.001350 | -1.29 |
| Title | Cluster Plot | Dendrogram | e-value | e-value | e-value | Condition | Condition FDR | Condition Difference |
|---|---|---|---|---|---|---|---|---|
| Thaps_hclust_0391 |
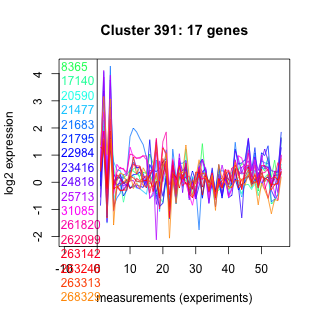 |
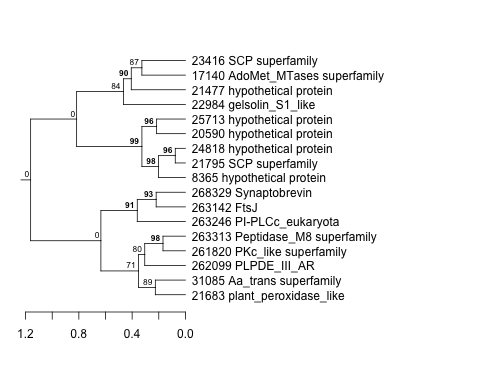 |
1.9 |
34 |
32 |
lowSi_TMEVA | 0.001350 | 2.41 |
| Title | Cluster Plot | Dendrogram | e-value | e-value | e-value | Condition | Condition FDR | Condition Difference |
|---|---|---|---|---|---|---|---|---|
| Thaps_hclust_0302 |
 |
 |
0.000000015 |
0.00000024 |
0.00000000039 |
lowSi_TMEVA | 0.001350 | 2.44 |
| Title | Cluster Plot | Dendrogram | e-value | e-value | e-value | Condition | Condition FDR | Condition Difference |
|---|---|---|---|---|---|---|---|---|
| Thaps_hclust_0301 |
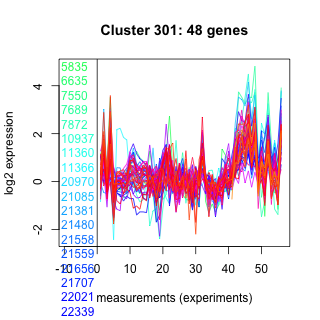 |
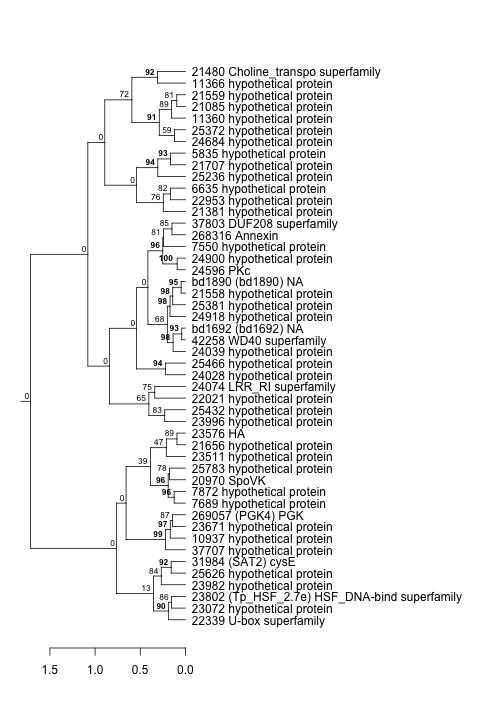 |
0.000000022 |
0.82 |
2.1 |
lowSi_TMEVA | 0.001350 | 1.35 |
| Title | Cluster Plot | Dendrogram | e-value | e-value | e-value | Condition | Condition FDR | Condition Difference |
|---|---|---|---|---|---|---|---|---|
| Thaps_hclust_0107 |
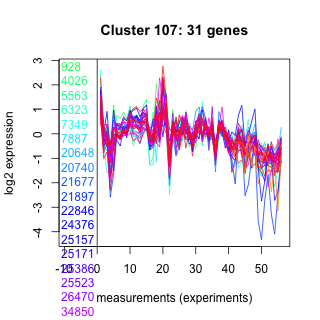 |
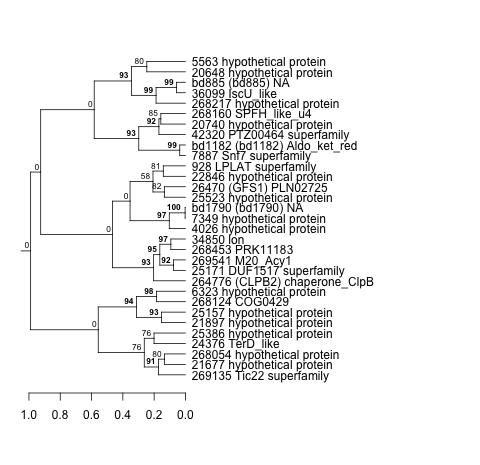 |
0.00000004 |
0.000000023 |
0.0054 |
lowSi_TMEVA | 0.001350 | -1.12 |
| Title | Cluster Plot | Dendrogram | e-value | e-value | e-value | Condition | Condition FDR | Condition Difference |
|---|---|---|---|---|---|---|---|---|
| Thaps_hclust_0300 |
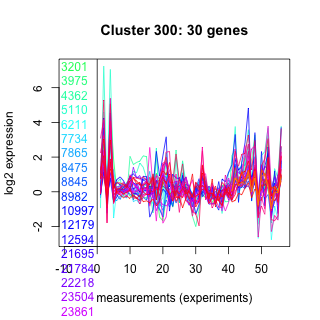 |
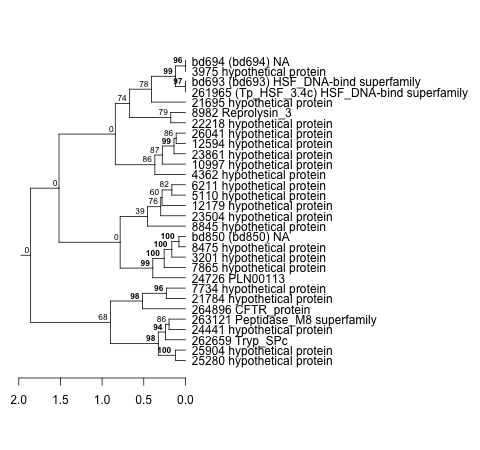 |
0.05 |
11 |
3.8 |
lowSi_TMEVA | 0.001350 | 2.9 |
| Title | Cluster Plot | Dendrogram | e-value | e-value | e-value | Condition | Condition FDR | Condition Difference |
|---|---|---|---|---|---|---|---|---|
| Thaps_hclust_0105 |
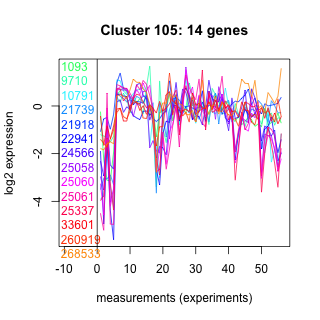 |
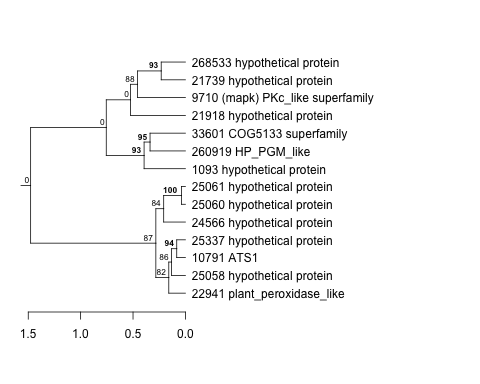 |
49 |
0.074 |
21 |
lowSi_TMEVA | 0.001350 | -2.82 |