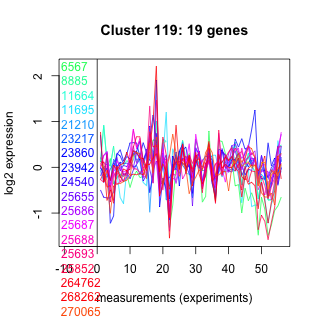
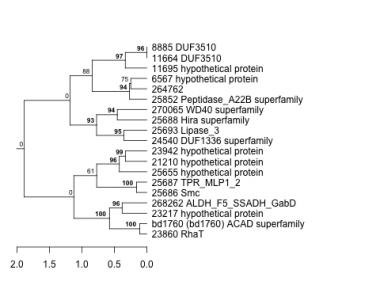
Thaps_hclust_0119 Hierarchical Clustering
Thalassiosira pseudonana
| GO ID | Go Term | p-value | q-value | Cluster |
|---|---|---|---|---|
| GO:0006629 | lipid metabolism | 0.0237743 | 1 | Thaps_hclust_0119 |
| GO:0006810 | transport | 0.143738 | 1 | Thaps_hclust_0119 |
| GO:0006468 | protein amino acid phosphorylation | 0.164893 | 1 | Thaps_hclust_0119 |
| GO:0008152 | metabolism | 0.296505 | 1 | Thaps_hclust_0119 |
|
6567 : hypothetical protein |
23217 : hypothetical protein |
25686 : Smc |
264762 : |
|
8885 : DUF3510 |
23860 : RhaT |
25687 : TPR_MLP1_2 |
268262 : ALDH_F5_SSADH_GabD |
|
11664 : DUF3510 |
23942 : hypothetical protein |
25688 : Hira superfamily |
270065 : WD40 superfamily |
|
11695 : hypothetical protein |
24540 : DUF1336 superfamily |
25693 : Lipase_3 |
bd1760 : (bd1760) ACAD superfamily |
|
21210 : hypothetical protein |
25655 : hypothetical protein |
25852 : Peptidase_A22B superfamily |
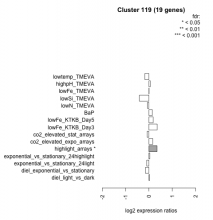
| Condition | Condition | Difference | FDR |
|---|---|---|---|
| diel_light_vs_dark | diel_light_vs_dark | 0.033 | 0.93 |
| lowFe_KTKB_Day3 | lowFe_KTKB_Day3 | 0.354 | 0.141 |
| lowFe_KTKB_Day5 | lowFe_KTKB_Day5 | 0.183 | 0.383 |
| BaP | BaP | 0.145 | 0.562 |
| exponential_vs_stationary_24highlight | exponential_vs_stationary_24highlight | 0.042 | 0.743 |
| co2_elevated_stat_arrays | co2_elevated_stat_arrays | -0.076 | 0.795 |
| lowtemp_TMEVA | lowtemp_TMEVA | -0.177 | 0.506 |
| highpH_TMEVA | highpH_TMEVA | 0.060 | 0.771 |
| co2_elevated_expo_arrays | co2_elevated_expo_arrays | 0.165 | 0.383 |
| lowFe_TMEVA | lowFe_TMEVA | 0.007 | 0.996 |
| exponential_vs_stationary_24light | exponential_vs_stationary_24light | -0.092 | 0.823 |
| lowN_TMEVA | lowN_TMEVA | -0.061 | 0.861 |
| diel_exponential_vs_stationary | diel_exponential_vs_stationary | -0.149 | 0.456 |
| lowSi_TMEVA | lowSi_TMEVA | -0.408 | 0.5 |
| highlight_arrays | highlight_arrays | 0.349 | 0.0268 |


