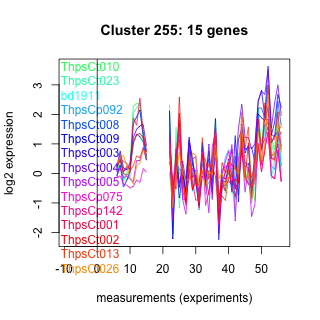
Thaps_hclust_0255 Hierarchical Clustering
Thalassiosira pseudonana
|
ThpsCt010 : (trnD(guc)) |
ThpsCt008 : (trnI(cau)) |
ThpsCt005 : (trnF(gaa)) |
ThpsCt002 : (trnR(ccg)) |
|
ThpsCt023 : (trnQ(uug)) |
ThpsCt009 : (trnS(gcu)) |
ThpsCp075 : (ycf89) hypothetical protein |
ThpsCt013 : (trnG(gcc)) |
|
bd1911 : (bd1911) Ribosomal_L1 |
ThpsCt003 : (trnV(uac)) |
ThpsCp142 : (ycf89') hypothetical protein |
ThpsCt026 : (trnC(gca)) |
|
ThpsCp092 : (psbW) photosystem II protein W |
ThpsCt004 : (trnR(ucu)) |
ThpsCt001 : (trnM(cau)) |
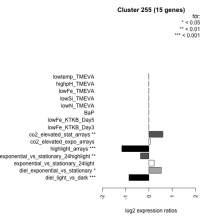
| Condition | Condition | Difference | FDR |
|---|---|---|---|
| diel_light_vs_dark | diel_light_vs_dark | -0.853 | 0.000485 |
| lowFe_KTKB_Day3 | lowFe_KTKB_Day3 | 1 | |
| lowFe_KTKB_Day5 | lowFe_KTKB_Day5 | 1 | |
| BaP | BaP | 1 | |
| exponential_vs_stationary_24highlight | exponential_vs_stationary_24highlight | -0.360 | 0.00287 |
| co2_elevated_stat_arrays | co2_elevated_stat_arrays | 0.600 | 0.00631 |
| lowtemp_TMEVA | lowtemp_TMEVA | 1 | |
| highpH_TMEVA | highpH_TMEVA | 1 | |
| co2_elevated_expo_arrays | co2_elevated_expo_arrays | 0.057 | 0.903 |
| lowFe_TMEVA | lowFe_TMEVA | 1 | |
| exponential_vs_stationary_24light | exponential_vs_stationary_24light | 0.224 | 0.576 |
| lowN_TMEVA | lowN_TMEVA | 1 | |
| diel_exponential_vs_stationary | diel_exponential_vs_stationary | 0.533 | 0.0102 |
| lowSi_TMEVA | lowSi_TMEVA | 1 | |
| highlight_arrays | highlight_arrays | -1.160 | 0.000442 |


