Hierarchical Clusters
Displaying 801 - 900 of 28001
| Title | Cluster Plot | Dendrogram | e-value | e-value | e-value | Condition | Condition FDR | Condition Difference |
|---|---|---|---|---|---|---|---|---|
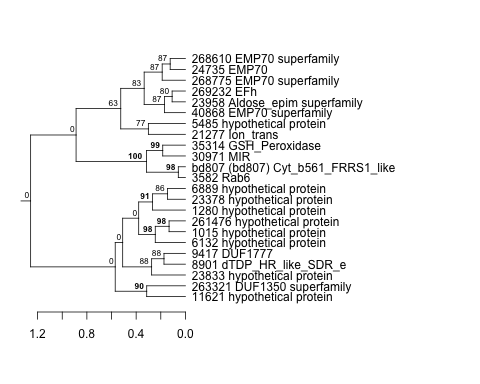
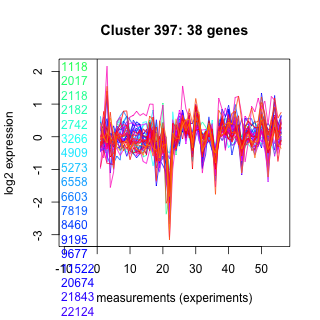
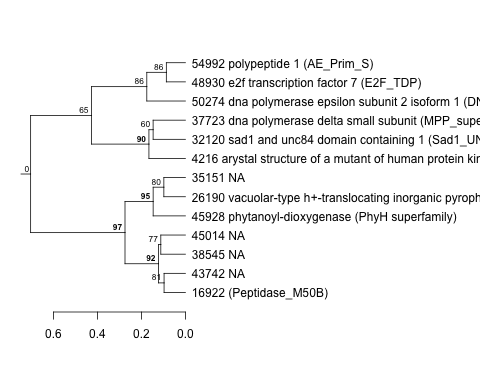
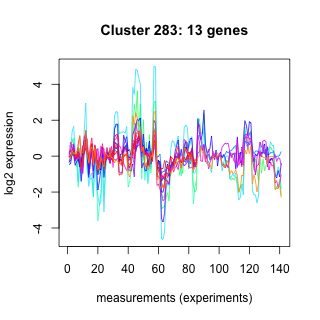
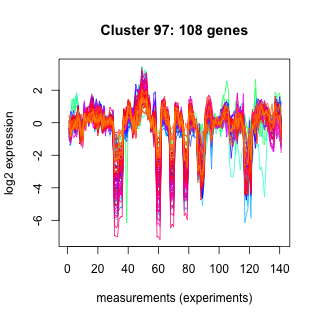
| Phatr_hclust_0397 |
 |
 |
28 |
230 |
1600 |
Blue_vs_Red_6h | 0.985113 | -0.0138312 |
| Title | Cluster Plot | Dendrogram | e-value | e-value | e-value | Condition | Condition FDR | Condition Difference |
|---|---|---|---|---|---|---|---|---|
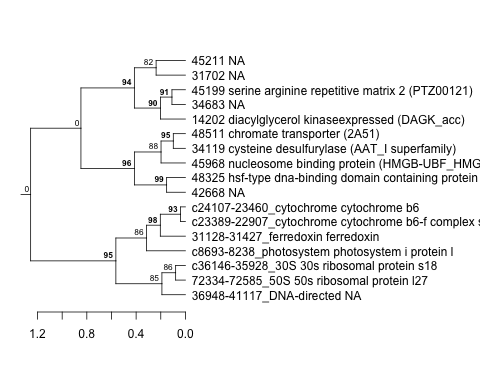
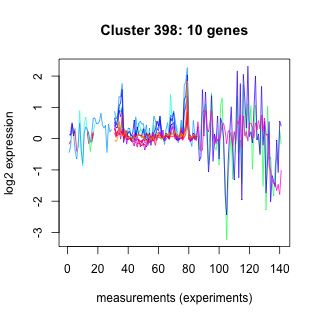
| Phatr_hclust_0398 |
 |
 |
190 |
210 |
180 |
Blue_vs_Red_6h | 0.985113 | -0.0153111 |
| Title | Cluster Plot | Dendrogram | e-value | e-value | e-value | Condition | Condition FDR | Condition Difference |
|---|---|---|---|---|---|---|---|---|
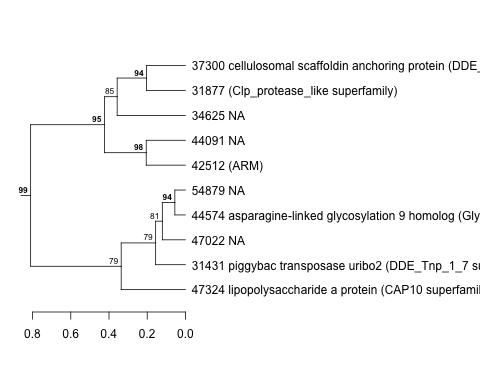
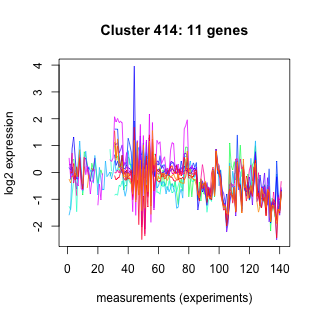
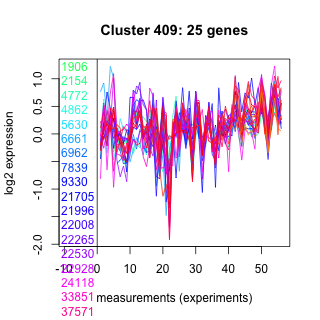
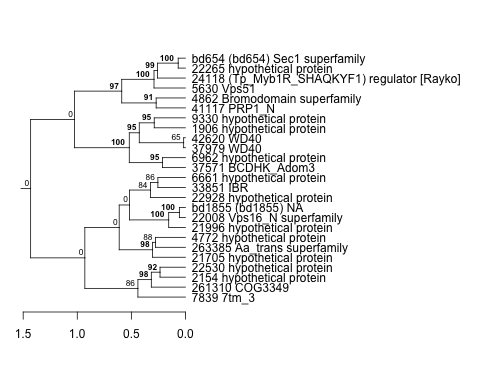
| Phatr_hclust_0414 |
 |
 |
140 |
240 |
310 |
Blue_vs_Red_6h | 0.985113 | 0.00965493 |
| Title | Cluster Plot | Dendrogram | e-value | e-value | e-value | Condition | Condition FDR | Condition Difference |
|---|---|---|---|---|---|---|---|---|
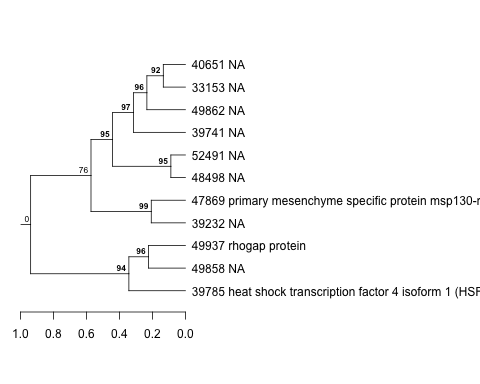
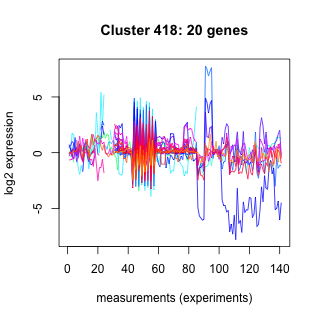
| Phatr_hclust_0418 |
 |
 |
290 |
2400 |
3200 |
Blue_vs_Red_6h | 0.985113 | 0.00776643 |
| Title | Cluster Plot | Dendrogram | e-value | e-value | e-value | Condition | Condition FDR | Condition Difference |
|---|---|---|---|---|---|---|---|---|
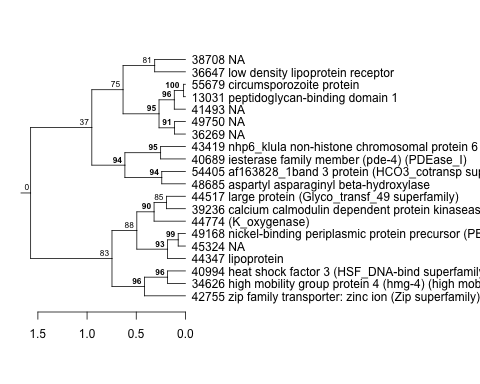
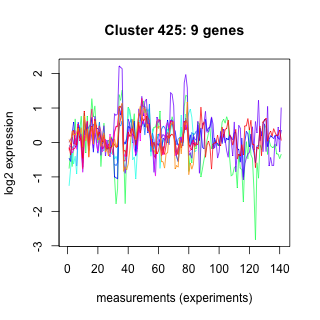
| Phatr_hclust_0425 |
 |
 |
43 |
43 |
170 |
Blue_vs_Red_6h | 0.985113 | -0.0159508 |
| Title | Cluster Plot | Dendrogram | e-value | e-value | e-value | Condition | Condition FDR | Condition Difference |
|---|---|---|---|---|---|---|---|---|
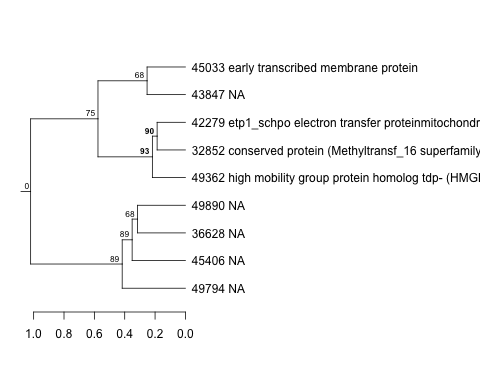
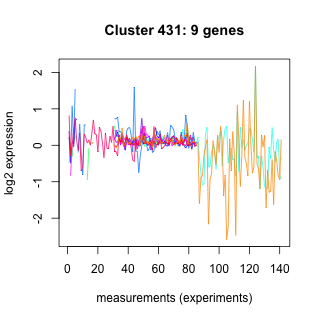
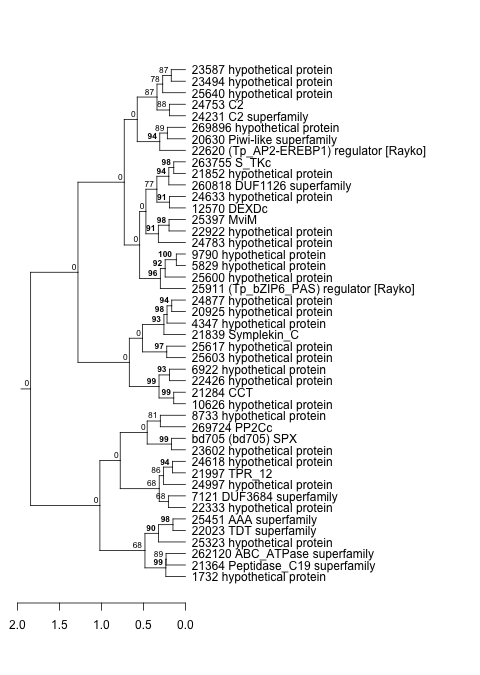
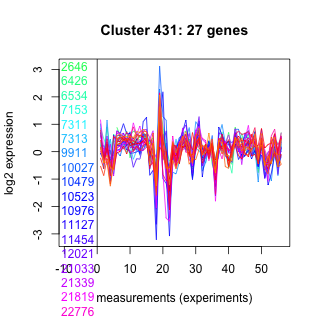
| Phatr_hclust_0431 |
 |
 |
600 |
200 |
1400 |
Blue_vs_Red_6h | 0.985113 | -0.00999682 |
| Title | Cluster Plot | Dendrogram | e-value | e-value | e-value | Condition | Condition FDR | Condition Difference |
|---|---|---|---|---|---|---|---|---|
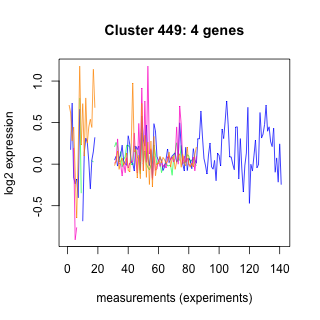
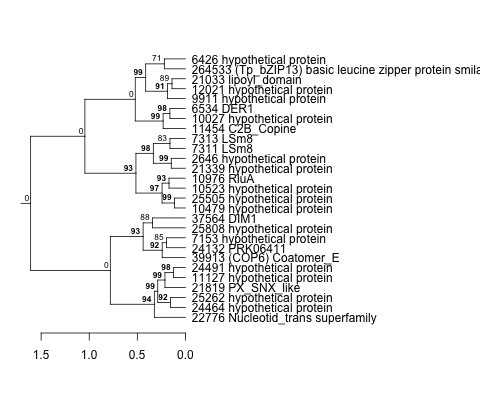
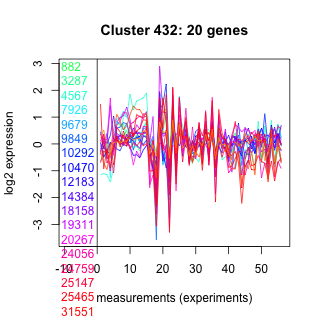
| Phatr_hclust_0449 |
 |
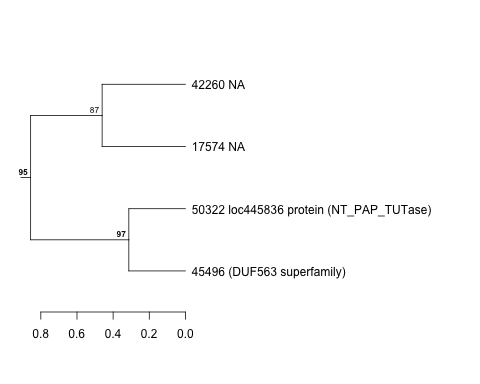 |
330 |
600 |
770 |
Blue_vs_Red_6h | 0.985113 | 0.0191892 |
| Phatr_hclust_0449 |
|
|
330 |
600 |
770 |
Re-illuminated_0.5h | 0.984702 | 0.0382566 |
| Title | Cluster Plot | Dendrogram | e-value | e-value | e-value | Condition | Condition FDR | Condition Difference |
|---|---|---|---|---|---|---|---|---|
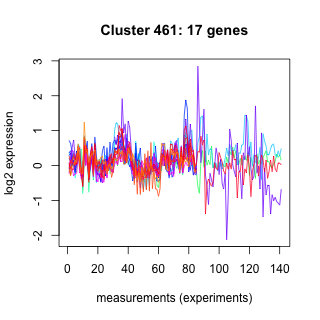
| Phatr_hclust_0461 |
 |
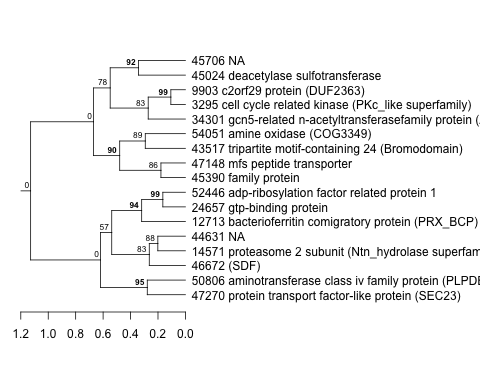 |
0.011 |
59 |
270 |
Blue_vs_Red_6h | 0.985113 | 0.00846935 |
| Title | Cluster Plot | Dendrogram | e-value | e-value | e-value | Condition | Condition FDR | Condition Difference |
|---|---|---|---|---|---|---|---|---|
| Phatr_hclust_0464 |
 |
 |
920 |
1600 |
2300 |
Blue_vs_Red_6h | 0.985113 | -0.0180336 |
| Title | Cluster Plot | Dendrogram | e-value | e-value | e-value | Condition | Condition FDR | Condition Difference |
|---|---|---|---|---|---|---|---|---|
| Phatr_hclust_0466 |
 |
 |
14 |
14 |
26 |
Blue_vs_Red_6h | 0.985113 | 0.016051 |
| Phatr_hclust_0466 |
|
|
14 |
14 |
26 |
highlight_0to6h | 0.984909 | -0.00482814 |
| Title | Cluster Plot | Dendrogram | e-value | e-value | e-value | Condition | Condition FDR | Condition Difference |
|---|---|---|---|---|---|---|---|---|
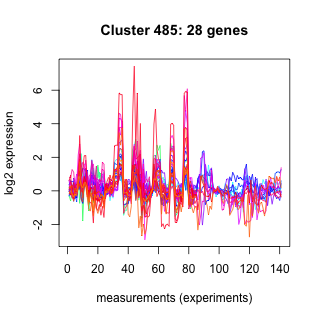
| Phatr_hclust_0485 |
 |
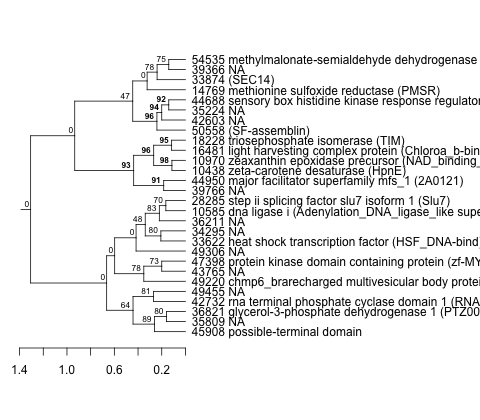 |
0.00015 |
3400 |
92 |
Blue_vs_Red_6h | 0.985113 | -0.00886028 |
| Title | Cluster Plot | Dendrogram | e-value | e-value | e-value | Condition | Condition FDR | Condition Difference |
|---|---|---|---|---|---|---|---|---|
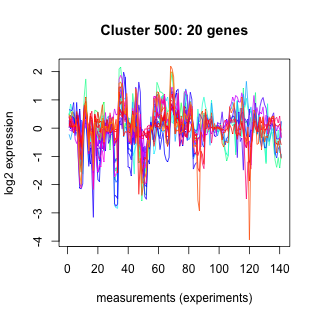
| Phatr_hclust_0500 |
 |
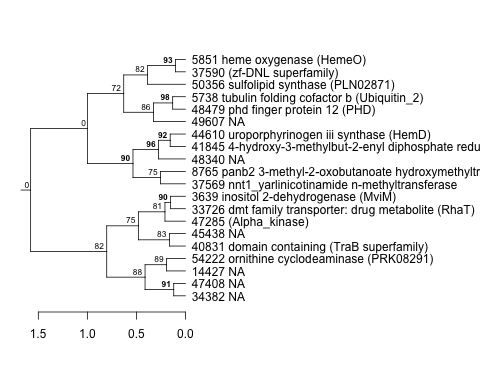 |
7.1 |
14 |
120 |
Blue_vs_Red_6h | 0.985113 | -0.00771173 |
| Title | Cluster Plot | Dendrogram | e-value | e-value | e-value | Condition | Condition FDR | Condition Difference |
|---|---|---|---|---|---|---|---|---|
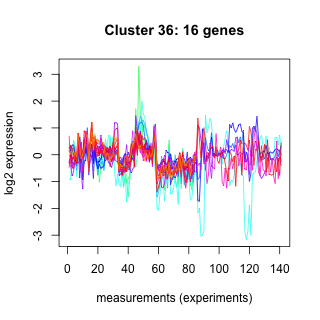
| Phatr_hclust_0036 |
 |
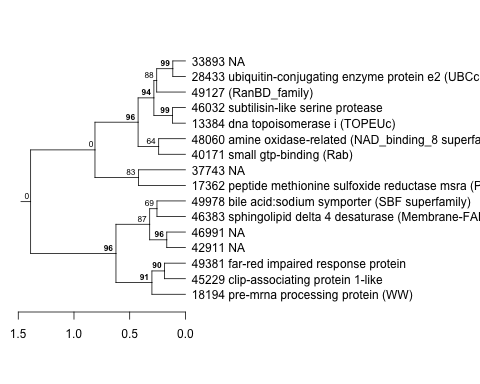 |
0.0048 |
2.6 |
1200 |
Blue_vs_Red_6h | 0.985113 | -0.0106373 |
| Phatr_hclust_0036 |
|
|
0.0048 |
2.6 |
1200 |
Green_vs_Red_6h | 0.985031 | -0.00532796 |
| Title | Cluster Plot | Dendrogram | e-value | e-value | e-value | Condition | Condition FDR | Condition Difference |
|---|---|---|---|---|---|---|---|---|
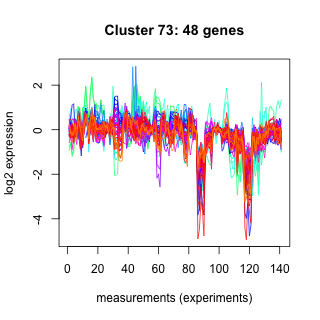
| Phatr_hclust_0073 |
 |
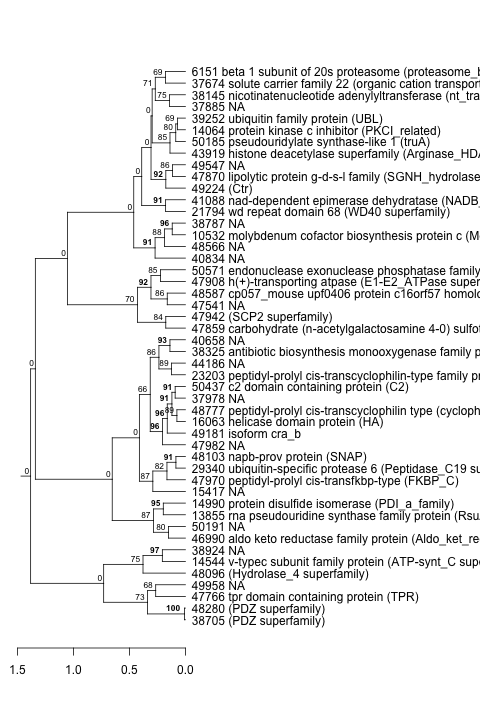 |
0.0000000013 |
5.1 |
150 |
Blue_vs_Red_6h | 0.985113 | -0.00541565 |
| Phatr_hclust_0073 |
|
|
0.0000000013 |
5.1 |
150 |
Green_vs_Red_24h | 0.984318 | 0.00251382 |
| Title | Cluster Plot | Dendrogram | e-value | e-value | e-value | Condition | Condition FDR | Condition Difference |
|---|---|---|---|---|---|---|---|---|
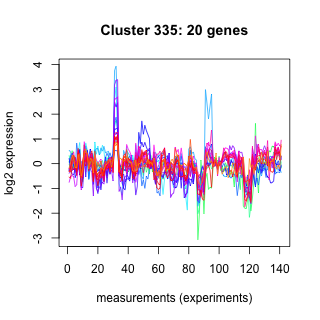
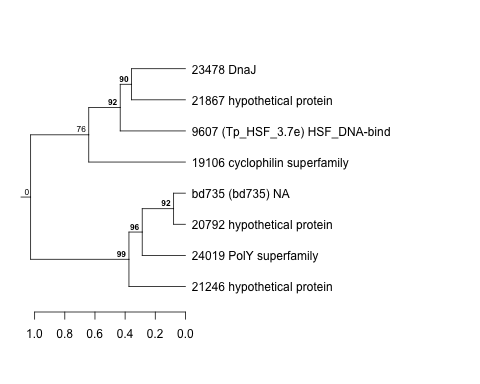
| Phatr_hclust_0335 |
 |
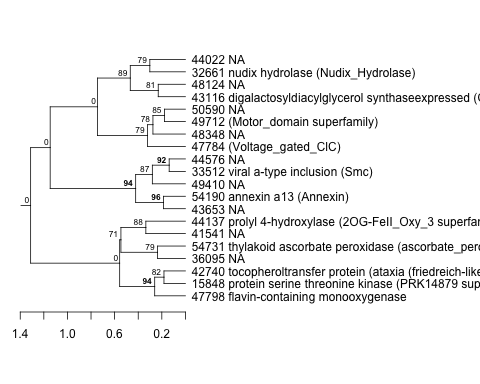 |
0.27 |
49 |
99 |
Blue_vs_Red_6h | 0.985113 | 0.00632587 |
| Title | Cluster Plot | Dendrogram | e-value | e-value | e-value | Condition | Condition FDR | Condition Difference |
|---|---|---|---|---|---|---|---|---|
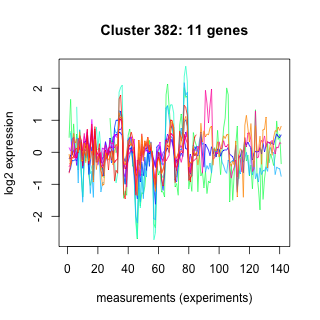
| Phatr_hclust_0382 |
 |
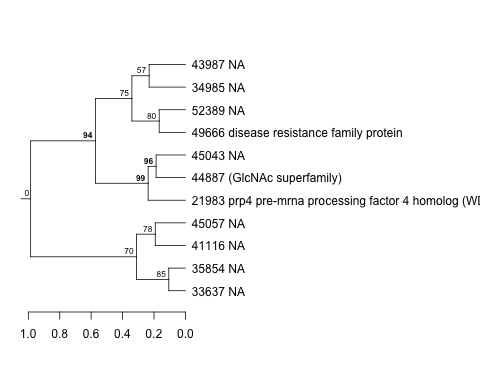 |
0.00027 |
0.0024 |
0.18 |
Blue_vs_Red_6h | 0.985113 | 0.00804259 |
| Title | Cluster Plot | Dendrogram | e-value | e-value | e-value | Condition | Condition FDR | Condition Difference |
|---|---|---|---|---|---|---|---|---|
| Phatr_hclust_0386 |
 |
 |
0.057 |
59 |
650 |
Blue_vs_Red_6h | 0.985113 | -0.00930529 |
| Title | Cluster Plot | Dendrogram | e-value | e-value | e-value | Condition | Condition FDR | Condition Difference |
|---|---|---|---|---|---|---|---|---|
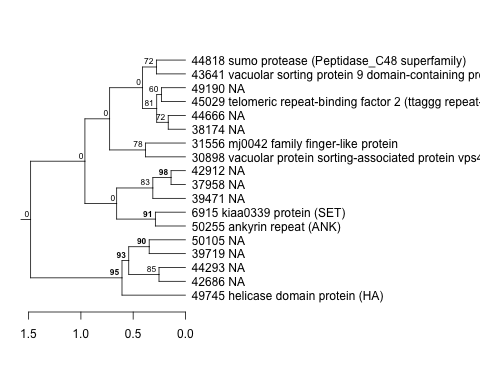
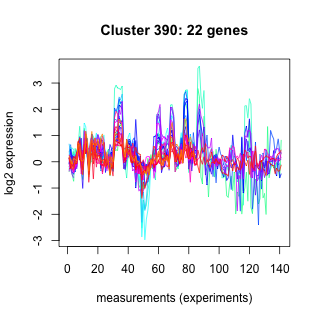
| Phatr_hclust_0390 |
 |
 |
83 |
2400 |
7900 |
Blue_vs_Red_6h | 0.985113 | -0.00597858 |
| Title | Cluster Plot | Dendrogram | e-value | e-value | e-value | Condition | Condition FDR | Condition Difference |
|---|---|---|---|---|---|---|---|---|
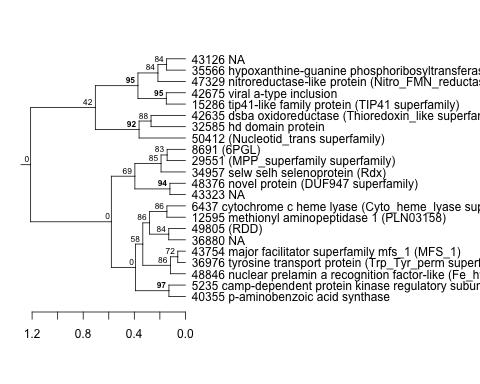
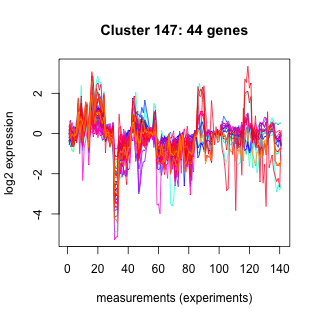
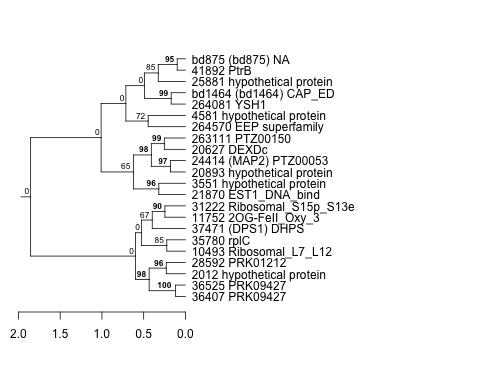
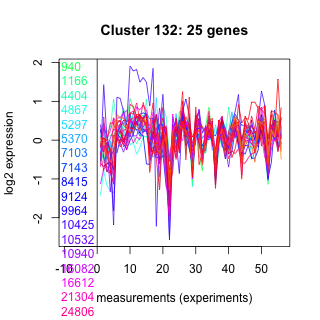
| Phatr_hclust_0147 |
 |
 |
0.000019 |
15 |
170 |
Blue_vs_Red_6h | 0.985113 | -0.00742519 |
| Title | Cluster Plot | Dendrogram | e-value | e-value | e-value | Condition | Condition FDR | Condition Difference |
|---|---|---|---|---|---|---|---|---|
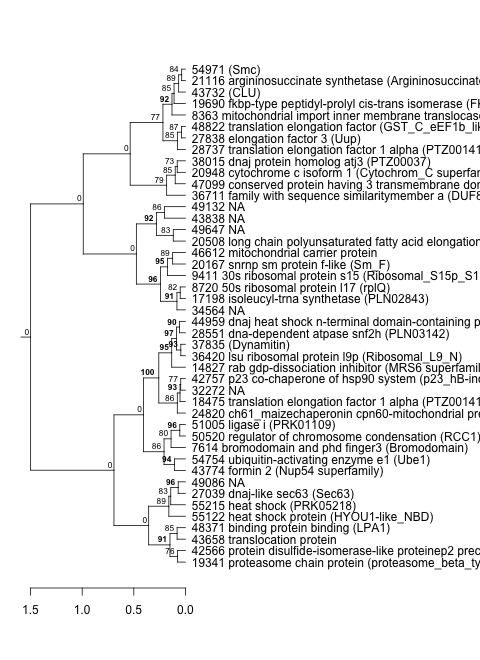
| Phatr_hclust_0094 |
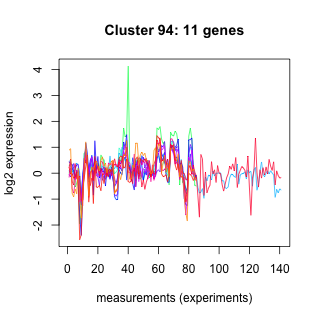 |
 |
4.2 |
1100 |
400 |
Blue_vs_Red_6h | 0.985113 | 0.0117509 |
| Title | Cluster Plot | Dendrogram | e-value | e-value | e-value | Condition | Condition FDR | Condition Difference |
|---|---|---|---|---|---|---|---|---|
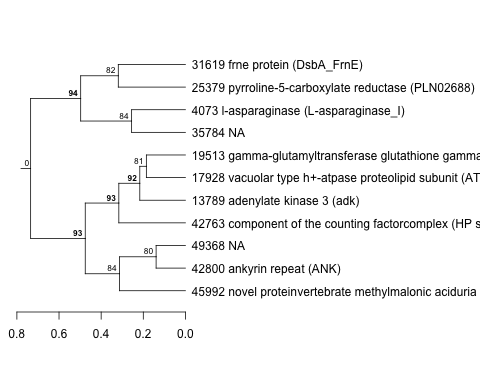
| Phatr_hclust_0124 |
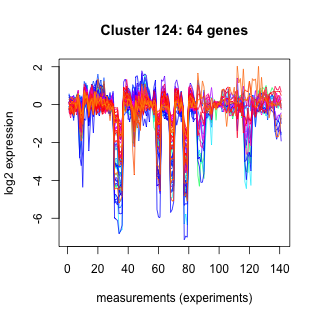 |
 |
0.000000027 |
3.7 |
18 |
Blue_vs_Red_6h | 0.985113 | -0.00606262 |
| Title | Cluster Plot | Dendrogram | e-value | e-value | e-value | Condition | Condition FDR | Condition Difference |
|---|---|---|---|---|---|---|---|---|
| Phatr_hclust_0433 |
 |
 |
5.5 |
38 |
300 |
Green_vs_Red_6h | 0.985061 | 0.00456376 |
| Title | Cluster Plot | Dendrogram | e-value | e-value | e-value | Condition | Condition FDR | Condition Difference |
|---|---|---|---|---|---|---|---|---|
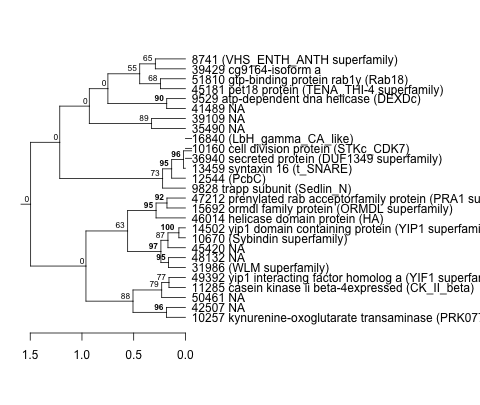
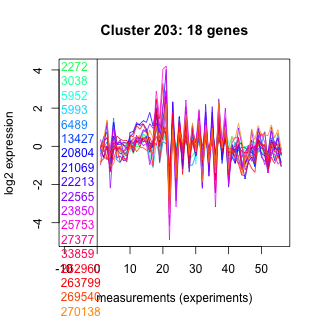
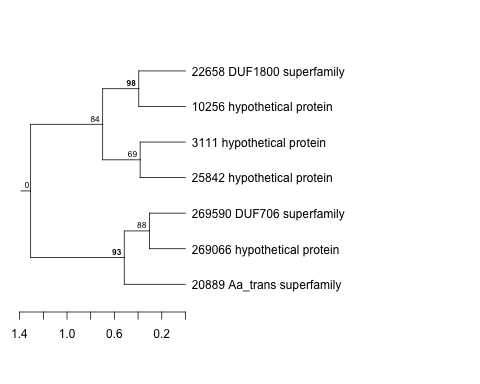
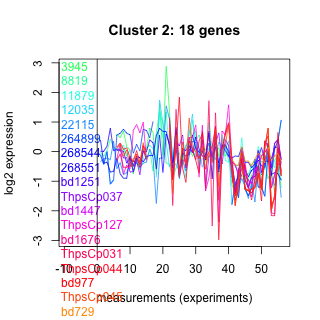
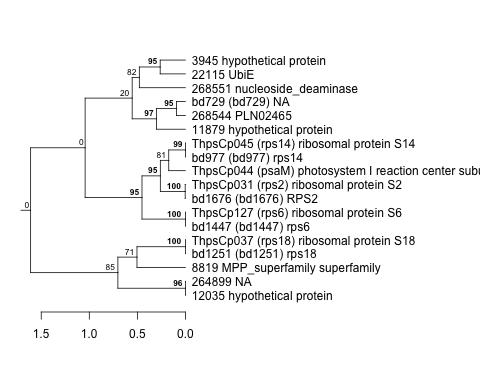
| Thaps_hclust_0203 |
 |
 |
0.00051 |
1.2 |
1.3 |
co2_elevated_expo_arrays | 0.985000 | 0.00936 |
| Title | Cluster Plot | Dendrogram | e-value | e-value | e-value | Condition | Condition FDR | Condition Difference |
|---|---|---|---|---|---|---|---|---|
| Thaps_hclust_0208 |
 |
|
1.2e-20 |
0.0000000000000057 |
0.0000000099 |
co2_elevated_expo_arrays | 0.985000 | -0.014 |
| Title | Cluster Plot | Dendrogram | e-value | e-value | e-value | Condition | Condition FDR | Condition Difference |
|---|---|---|---|---|---|---|---|---|
| Thaps_hclust_0214 |
 |
 |
0.00006 |
0.0000000031 |
0.00076 |
co2_elevated_expo_arrays | 0.985000 | -0.0179 |
| Title | Cluster Plot | Dendrogram | e-value | e-value | e-value | Condition | Condition FDR | Condition Difference |
|---|---|---|---|---|---|---|---|---|
| Thaps_hclust_0227 |
 |
 |
1.2e-22 |
0.0000000098 |
0.0018 |
co2_elevated_expo_arrays | 0.985000 | -0.0139 |
| Title | Cluster Plot | Dendrogram | e-value | e-value | e-value | Condition | Condition FDR | Condition Difference |
|---|---|---|---|---|---|---|---|---|
| Thaps_hclust_0228 |
 |
 |
0.00000000000028 |
0.0027 |
0.016 |
co2_elevated_expo_arrays | 0.985000 | 0.011 |
| Title | Cluster Plot | Dendrogram | e-value | e-value | e-value | Condition | Condition FDR | Condition Difference |
|---|---|---|---|---|---|---|---|---|
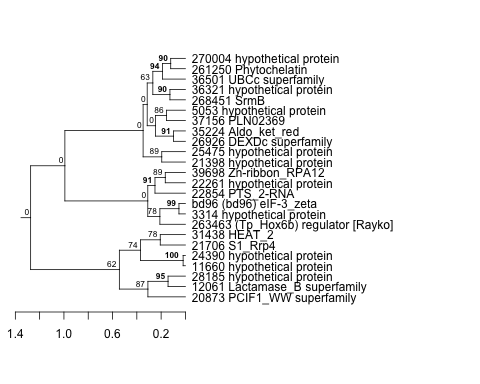
| Thaps_hclust_0240 |
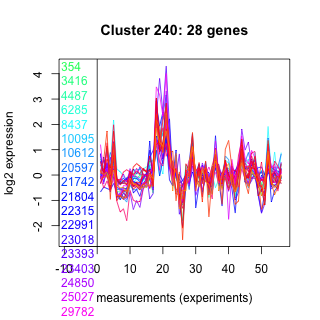 |
 |
0.000000064 |
0.000021 |
0.00078 |
co2_elevated_expo_arrays | 0.985000 | 0.0085 |
| Title | Cluster Plot | Dendrogram | e-value | e-value | e-value | Condition | Condition FDR | Condition Difference |
|---|---|---|---|---|---|---|---|---|
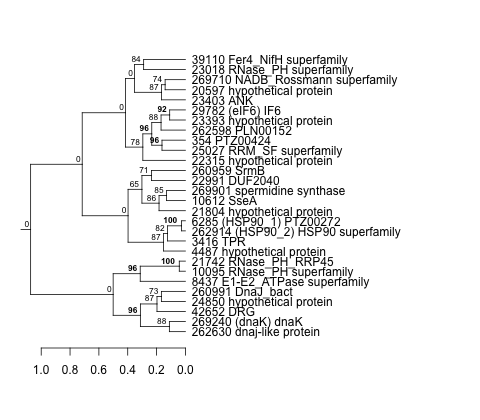
| Thaps_hclust_0247 |
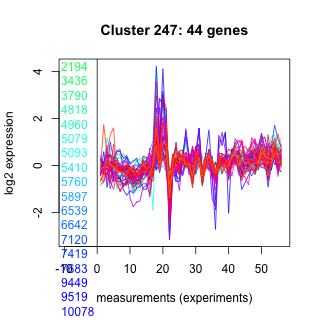 |
 |
8.7e-16 |
0.00000000045 |
0.0000019 |
lowFe_KTKB_Day5 | 0.985000 | 0.0036 |
| Title | Cluster Plot | Dendrogram | e-value | e-value | e-value | Condition | Condition FDR | Condition Difference |
|---|---|---|---|---|---|---|---|---|
| Thaps_hclust_0252 |
 |
 |
0.000053 |
0.0057 |
2.1 |
co2_elevated_expo_arrays | 0.985000 | -0.0101 |
| Title | Cluster Plot | Dendrogram | e-value | e-value | e-value | Condition | Condition FDR | Condition Difference |
|---|---|---|---|---|---|---|---|---|
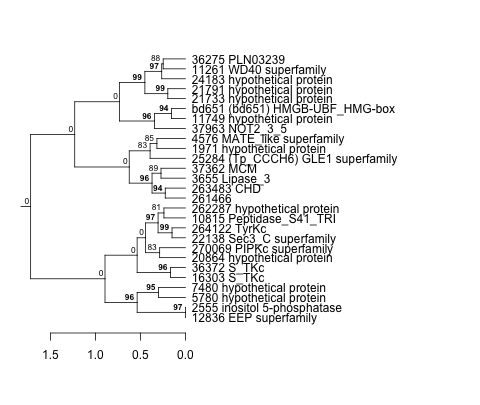
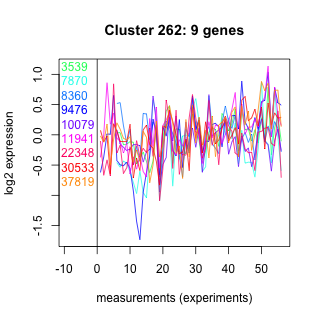
| Thaps_hclust_0262 |
 |
 |
12 |
130 |
130 |
co2_elevated_expo_arrays | 0.985000 | -0.0121 |
| Title | Cluster Plot | Dendrogram | e-value | e-value | e-value | Condition | Condition FDR | Condition Difference |
|---|---|---|---|---|---|---|---|---|
| Thaps_hclust_0267 |
 |
 |
0.00000003 |
0.39 |
0.58 |
co2_elevated_expo_arrays | 0.985000 | 0.0131 |
| Title | Cluster Plot | Dendrogram | e-value | e-value | e-value | Condition | Condition FDR | Condition Difference |
|---|---|---|---|---|---|---|---|---|
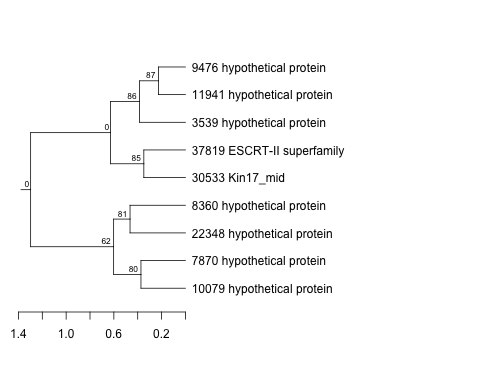
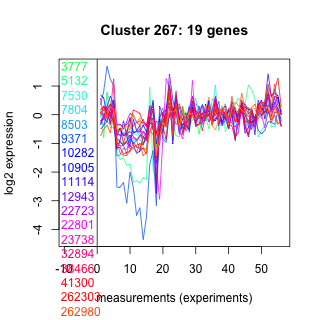
| Thaps_hclust_0271 |
 |
 |
Not available | Not available | Not available | co2_elevated_expo_arrays | 0.985000 | -0.00829 |
| Title | Cluster Plot | Dendrogram | e-value | e-value | e-value | Condition | Condition FDR | Condition Difference |
|---|---|---|---|---|---|---|---|---|
| Thaps_hclust_0272 |
 |
 |
0.0048 |
0.01 |
0.059 |
co2_elevated_expo_arrays | 0.985000 | 0.0108 |
| Title | Cluster Plot | Dendrogram | e-value | e-value | e-value | Condition | Condition FDR | Condition Difference |
|---|---|---|---|---|---|---|---|---|
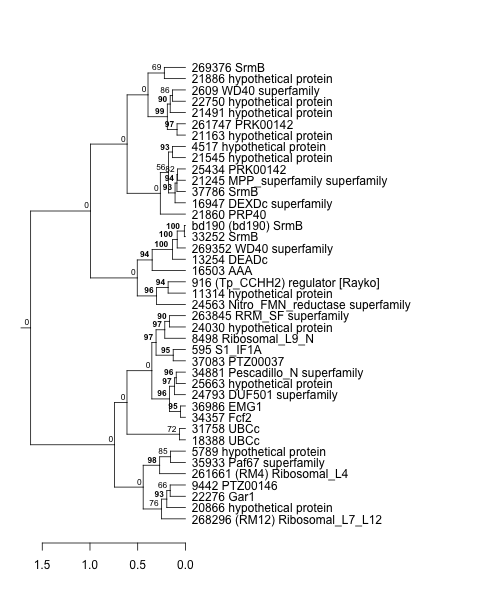
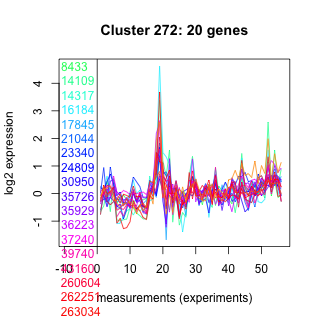
| Thaps_hclust_0292 |
 |
 |
1.4e-30 |
0.00000000000037 |
0.0000067 |
co2_elevated_expo_arrays | 0.985000 | 0.0103 |
| Title | Cluster Plot | Dendrogram | e-value | e-value | e-value | Condition | Condition FDR | Condition Difference |
|---|---|---|---|---|---|---|---|---|
| Thaps_hclust_0293 |
 |
 |
0.16 |
120 |
360 |
co2_elevated_expo_arrays | 0.985000 | 0.0161 |
| Title | Cluster Plot | Dendrogram | e-value | e-value | e-value | Condition | Condition FDR | Condition Difference |
|---|---|---|---|---|---|---|---|---|
| Thaps_hclust_0307 |
 |
 |
46 |
50 |
580 |
co2_elevated_expo_arrays | 0.985000 | -0.00834 |
| Title | Cluster Plot | Dendrogram | e-value | e-value | e-value | Condition | Condition FDR | Condition Difference |
|---|---|---|---|---|---|---|---|---|
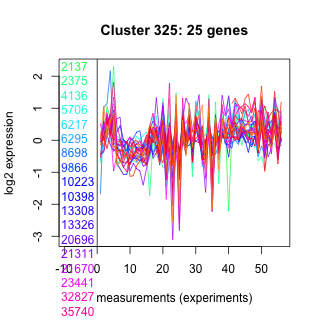
| Thaps_hclust_0325 |
 |
 |
0.00000000000002 |
0.000000076 |
0.17 |
co2_elevated_expo_arrays | 0.985000 | 0.0138 |
| Title | Cluster Plot | Dendrogram | e-value | e-value | e-value | Condition | Condition FDR | Condition Difference |
|---|---|---|---|---|---|---|---|---|
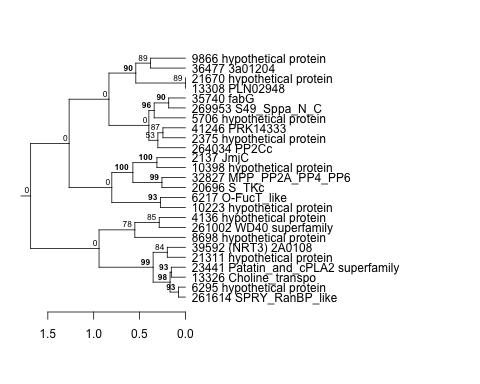
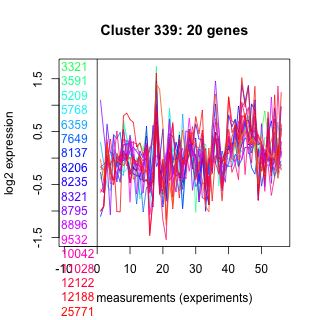
| Thaps_hclust_0339 |
 |
 |
0.000016 |
0.00038 |
0.0017 |
co2_elevated_expo_arrays | 0.985000 | -0.0171 |
| Title | Cluster Plot | Dendrogram | e-value | e-value | e-value | Condition | Condition FDR | Condition Difference |
|---|---|---|---|---|---|---|---|---|
| Thaps_hclust_0347 |
 |
 |
1.2 |
0.85 |
91 |
co2_elevated_expo_arrays | 0.985000 | 0.0129 |
| Title | Cluster Plot | Dendrogram | e-value | e-value | e-value | Condition | Condition FDR | Condition Difference |
|---|---|---|---|---|---|---|---|---|
| Thaps_hclust_0011 |
 |
 |
0.000023 |
10 |
1.3 |
co2_elevated_expo_arrays | 0.985000 | 0.00679 |
| Title | Cluster Plot | Dendrogram | e-value | e-value | e-value | Condition | Condition FDR | Condition Difference |
|---|---|---|---|---|---|---|---|---|
| Thaps_hclust_0030 |
 |
 |
0.000056 |
0.048 |
0.088 |
co2_elevated_expo_arrays | 0.985000 | 0.00772 |
| Title | Cluster Plot | Dendrogram | e-value | e-value | e-value | Condition | Condition FDR | Condition Difference |
|---|---|---|---|---|---|---|---|---|
| Thaps_hclust_0054 |
 |
 |
1.6e-17 |
0.0000000000053 |
0.000000000000024 |
co2_elevated_expo_arrays | 0.985000 | 0.00824 |
| Title | Cluster Plot | Dendrogram | e-value | e-value | e-value | Condition | Condition FDR | Condition Difference |
|---|---|---|---|---|---|---|---|---|
| Thaps_hclust_0068 |
 |
 |
0.34 |
36 |
100 |
co2_elevated_expo_arrays | 0.985000 | -0.00972 |
| Title | Cluster Plot | Dendrogram | e-value | e-value | e-value | Condition | Condition FDR | Condition Difference |
|---|---|---|---|---|---|---|---|---|
| Thaps_hclust_0111 |
 |
 |
0.00032 |
0.0074 |
0.8 |
diel_light_vs_dark | 0.985000 | -0.00665 |
| Title | Cluster Plot | Dendrogram | e-value | e-value | e-value | Condition | Condition FDR | Condition Difference |
|---|---|---|---|---|---|---|---|---|
| Thaps_hclust_0130 |
 |
 |
0.64 |
15 |
13 |
lowSi_TMEVA | 0.985000 | -0.11 |
| Title | Cluster Plot | Dendrogram | e-value | e-value | e-value | Condition | Condition FDR | Condition Difference |
|---|---|---|---|---|---|---|---|---|
| Thaps_hclust_0137 |
 |
|
2.3e-18 |
0.00000000000062 |
0.000025 |
co2_elevated_expo_arrays | 0.985000 | 0.0109 |
| Title | Cluster Plot | Dendrogram | e-value | e-value | e-value | Condition | Condition FDR | Condition Difference |
|---|---|---|---|---|---|---|---|---|
| Thaps_hclust_0142 |
 |
 |
0.000000000000013 |
0.0000000004 |
0.001 |
co2_elevated_expo_arrays | 0.985000 | 0.0136 |
| Title | Cluster Plot | Dendrogram | e-value | e-value | e-value | Condition | Condition FDR | Condition Difference |
|---|---|---|---|---|---|---|---|---|
| Thaps_hclust_0144 |
 |
 |
0.000000001 |
0.0000000019 |
0.00000019 |
co2_elevated_expo_arrays | 0.985000 | -0.0139 |
| Title | Cluster Plot | Dendrogram | e-value | e-value | e-value | Condition | Condition FDR | Condition Difference |
|---|---|---|---|---|---|---|---|---|
| Thaps_hclust_0145 |
 |
 |
0.015 |
1.6 |
11 |
co2_elevated_expo_arrays | 0.985000 | 0.019 |
| Title | Cluster Plot | Dendrogram | e-value | e-value | e-value | Condition | Condition FDR | Condition Difference |
|---|---|---|---|---|---|---|---|---|
| Thaps_hclust_0158 |
 |
 |
0.007 |
0.55 |
1.2 |
co2_elevated_expo_arrays | 0.985000 | -0.00877 |
| Title | Cluster Plot | Dendrogram | e-value | e-value | e-value | Condition | Condition FDR | Condition Difference |
|---|---|---|---|---|---|---|---|---|
| Thaps_hclust_0161 |
 |
 |
1.8 |
13 |
18 |
co2_elevated_expo_arrays | 0.985000 | -0.0156 |
| Title | Cluster Plot | Dendrogram | e-value | e-value | e-value | Condition | Condition FDR | Condition Difference |
|---|---|---|---|---|---|---|---|---|
| Thaps_hclust_0167 |
 |
 |
1 |
15 |
160 |
co2_elevated_expo_arrays | 0.985000 | 0.0142 |
| Title | Cluster Plot | Dendrogram | e-value | e-value | e-value | Condition | Condition FDR | Condition Difference |
|---|---|---|---|---|---|---|---|---|
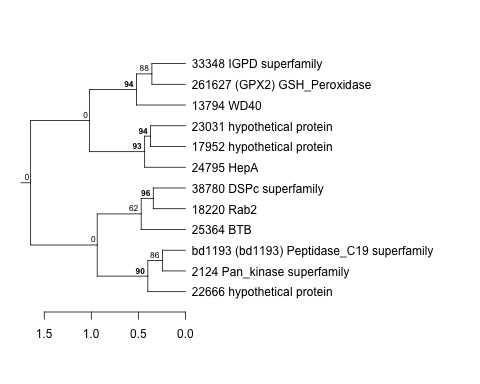
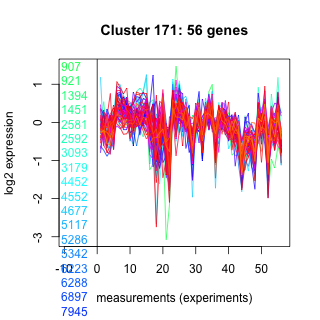
| Thaps_hclust_0171 |
 |
 |
0.0000000000052 |
0.000000000056 |
0.000000000083 |
co2_elevated_expo_arrays | 0.985000 | 0.00856 |
| Title | Cluster Plot | Dendrogram | e-value | e-value | e-value | Condition | Condition FDR | Condition Difference |
|---|---|---|---|---|---|---|---|---|
| Thaps_hclust_0173 |
 |
 |
0.013 |
0.83 |
0.45 |
co2_elevated_expo_arrays | 0.985000 | -0.00885 |
| Title | Cluster Plot | Dendrogram | e-value | e-value | e-value | Condition | Condition FDR | Condition Difference |
|---|---|---|---|---|---|---|---|---|
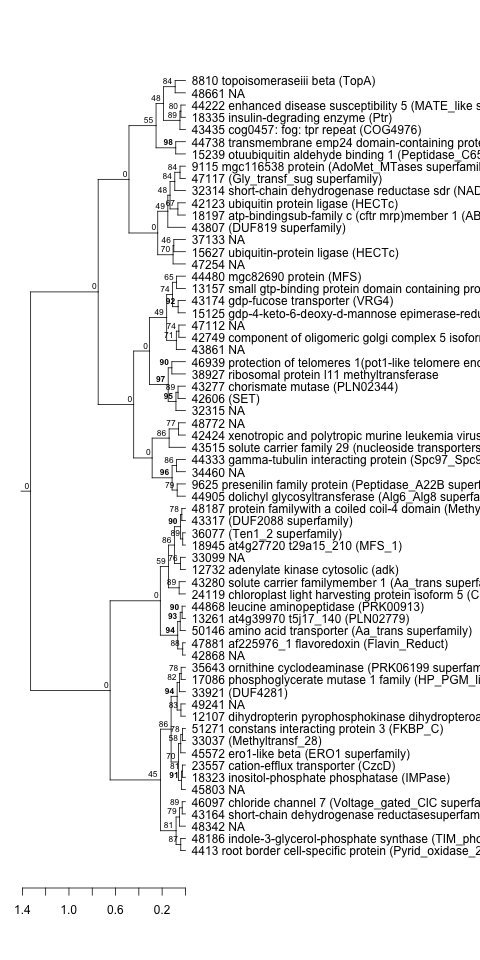
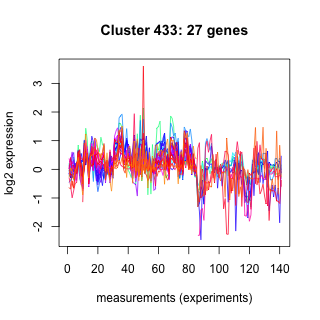
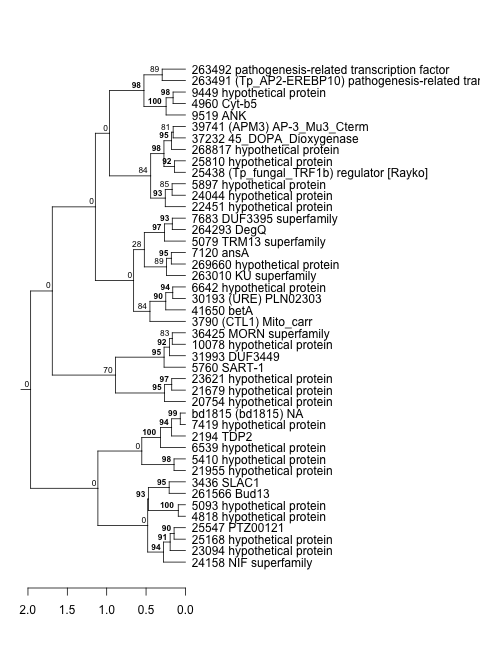
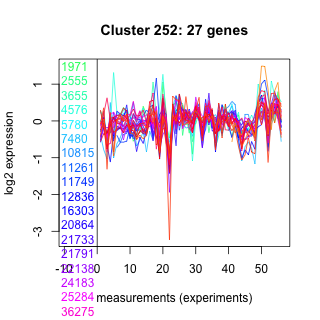
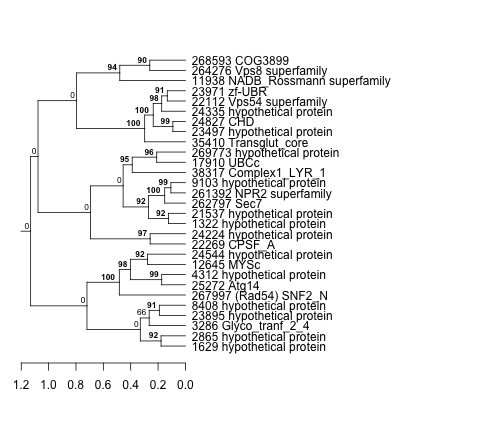
| Thaps_hclust_0397 |
 |
 |
0.00003 |
0.00016 |
0.0062 |
co2_elevated_expo_arrays | 0.985000 | 0.0115 |
| Title | Cluster Plot | Dendrogram | e-value | e-value | e-value | Condition | Condition FDR | Condition Difference |
|---|---|---|---|---|---|---|---|---|
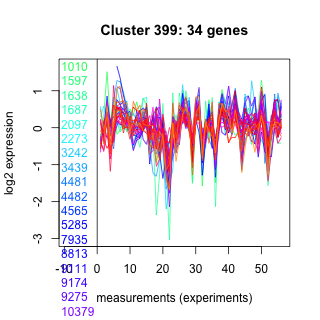
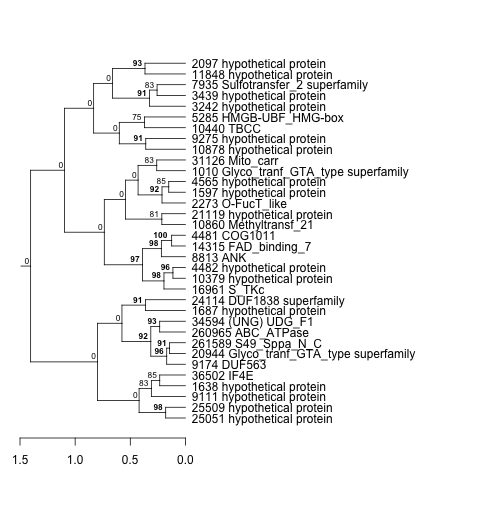
| Thaps_hclust_0399 |
 |
 |
0.0039 |
0.16 |
0.0016 |
co2_elevated_expo_arrays | 0.985000 | 0.0119 |
| Title | Cluster Plot | Dendrogram | e-value | e-value | e-value | Condition | Condition FDR | Condition Difference |
|---|---|---|---|---|---|---|---|---|
| Thaps_hclust_0400 |
 |
 |
Not available | Not available | Not available | co2_elevated_expo_arrays | 0.985000 | -0.0151 |
| Title | Cluster Plot | Dendrogram | e-value | e-value | e-value | Condition | Condition FDR | Condition Difference |
|---|---|---|---|---|---|---|---|---|
| Thaps_hclust_0406 |
 |
 |
0.000039 |
0.013 |
0.13 |
co2_elevated_expo_arrays | 0.985000 | -0.00937 |
| Title | Cluster Plot | Dendrogram | e-value | e-value | e-value | Condition | Condition FDR | Condition Difference |
|---|---|---|---|---|---|---|---|---|
| Thaps_hclust_0409 |
 |
 |
0.0000000066 |
0.0028 |
0.21 |
co2_elevated_expo_arrays | 0.985000 | -0.00796 |
| Title | Cluster Plot | Dendrogram | e-value | e-value | e-value | Condition | Condition FDR | Condition Difference |
|---|---|---|---|---|---|---|---|---|
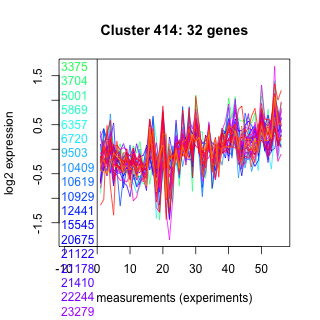
| Thaps_hclust_0414 |
 |
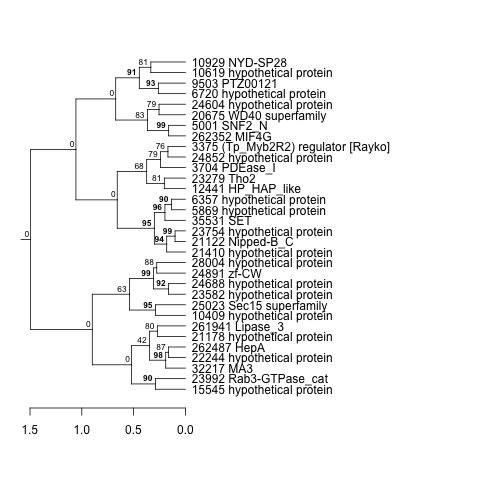 |
0.0000000000028 |
0.00000026 |
0.000019 |
co2_elevated_expo_arrays | 0.985000 | -0.0136 |
| Title | Cluster Plot | Dendrogram | e-value | e-value | e-value | Condition | Condition FDR | Condition Difference |
|---|---|---|---|---|---|---|---|---|
| Thaps_hclust_0415 |
 |
 |
0.0000000000041 |
0.000000046 |
0.000024 |
co2_elevated_expo_arrays | 0.985000 | 0.0186 |
| Title | Cluster Plot | Dendrogram | e-value | e-value | e-value | Condition | Condition FDR | Condition Difference |
|---|---|---|---|---|---|---|---|---|
| Thaps_hclust_0423 |
 |
 |
0.00046 |
0.13 |
9.2 |
co2_elevated_expo_arrays | 0.985000 | 0.0156 |
| Title | Cluster Plot | Dendrogram | e-value | e-value | e-value | Condition | Condition FDR | Condition Difference |
|---|---|---|---|---|---|---|---|---|
| Thaps_hclust_0431 |
 |
 |
0.003 |
0.00095 |
0.0043 |
co2_elevated_expo_arrays | 0.985000 | -0.013 |
| Title | Cluster Plot | Dendrogram | e-value | e-value | e-value | Condition | Condition FDR | Condition Difference |
|---|---|---|---|---|---|---|---|---|
| Thaps_hclust_0432 |
 |
 |
0.011 |
0.06 |
2.4 |
co2_elevated_expo_arrays | 0.985000 | 0.0127 |
| Title | Cluster Plot | Dendrogram | e-value | e-value | e-value | Condition | Condition FDR | Condition Difference |
|---|---|---|---|---|---|---|---|---|
| Thaps_hclust_0448 |
 |
 |
0.0000000026 |
0.00021 |
8.2 |
co2_elevated_expo_arrays | 0.985000 | -0.0106 |
| Title | Cluster Plot | Dendrogram | e-value | e-value | e-value | Condition | Condition FDR | Condition Difference |
|---|---|---|---|---|---|---|---|---|
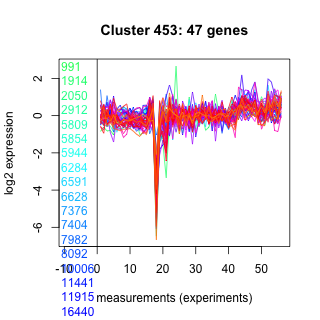
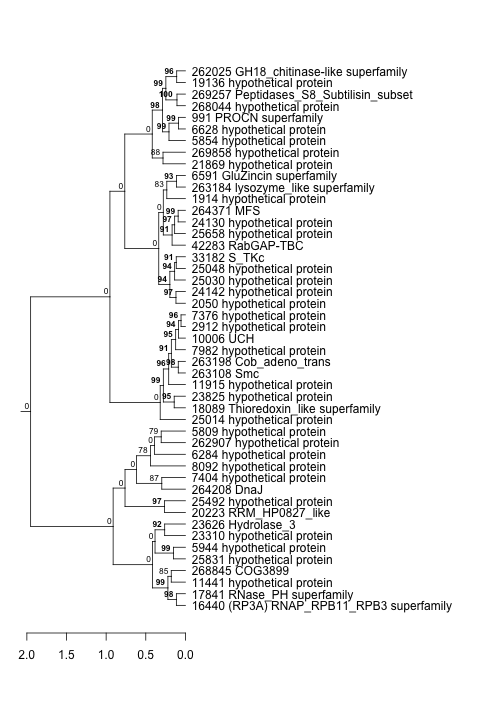
| Thaps_hclust_0453 |
 |
 |
0.000000000093 |
0.000000041 |
0.00016 |
co2_elevated_expo_arrays | 0.985000 | 0.00819 |
| Title | Cluster Plot | Dendrogram | e-value | e-value | e-value | Condition | Condition FDR | Condition Difference |
|---|---|---|---|---|---|---|---|---|
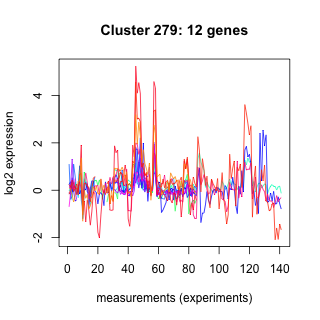
| Phatr_hclust_0279 |
 |
 |
1300 |
7300 |
2200 |
RedLight_24h | 0.984990 | 0.00513908 |
| Title | Cluster Plot | Dendrogram | e-value | e-value | e-value | Condition | Condition FDR | Condition Difference |
|---|---|---|---|---|---|---|---|---|
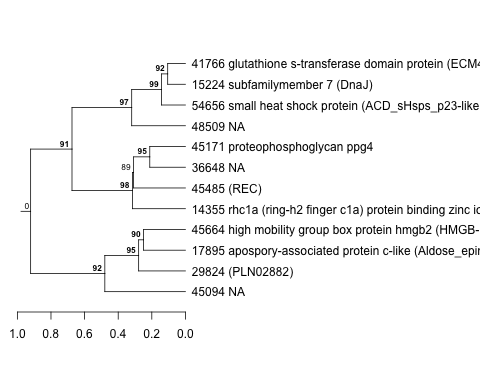
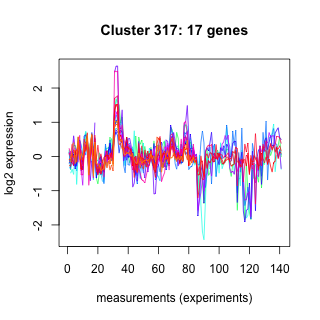
| Phatr_hclust_0317 |
 |
 |
47 |
220 |
260 |
RedLight_24h | 0.984990 | 0.0043748 |
| Title | Cluster Plot | Dendrogram | e-value | e-value | e-value | Condition | Condition FDR | Condition Difference |
|---|---|---|---|---|---|---|---|---|
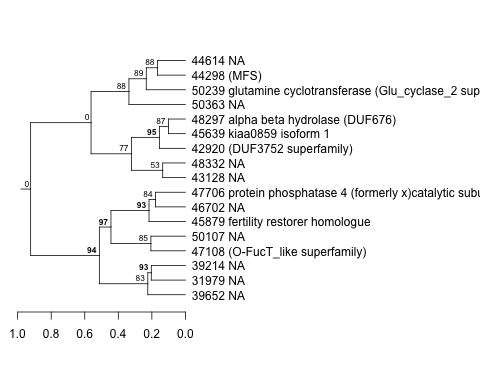
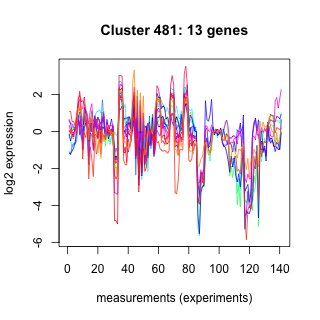
| Phatr_hclust_0481 |
 |
 |
0.98 |
42 |
780 |
RedLight_24h | 0.984990 | 0.0058142 |
| Title | Cluster Plot | Dendrogram | e-value | e-value | e-value | Condition | Condition FDR | Condition Difference |
|---|---|---|---|---|---|---|---|---|
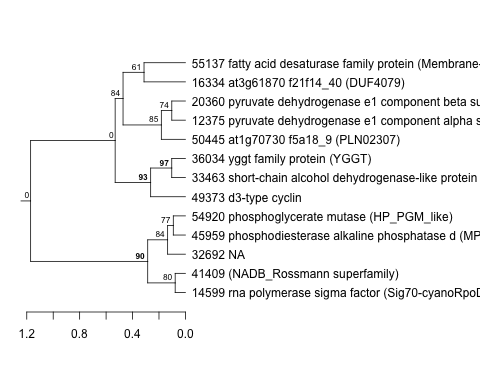
| Phatr_hclust_0185 |
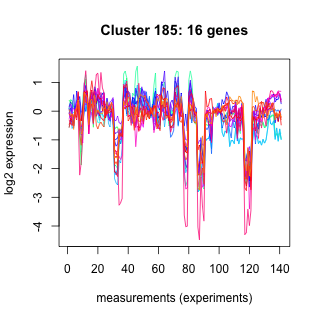 |
 |
0.31 |
0.3 |
4.3 |
RedLight_24h | 0.984990 | 0.00560988 |
| Title | Cluster Plot | Dendrogram | e-value | e-value | e-value | Condition | Condition FDR | Condition Difference |
|---|---|---|---|---|---|---|---|---|
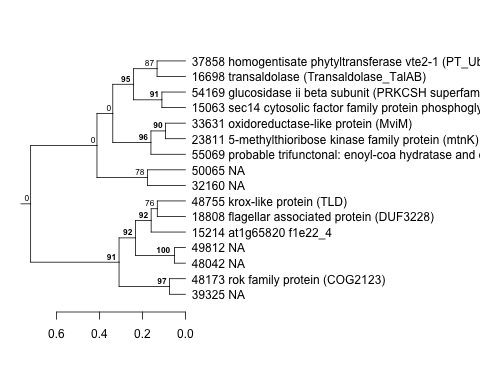
| Phatr_hclust_0198 |
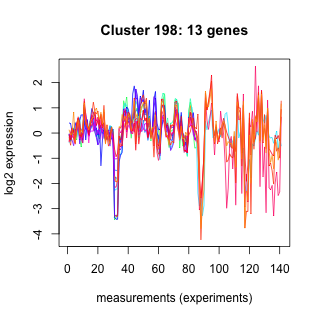 |
 |
0.0032 |
0.72 |
920 |
RedLight_24h | 0.984990 | -0.00474508 |
| Title | Cluster Plot | Dendrogram | e-value | e-value | e-value | Condition | Condition FDR | Condition Difference |
|---|---|---|---|---|---|---|---|---|
| Phatr_hclust_0283 |
 |
 |
0.66 |
1.6 |
450 |
highlight_0to6h | 0.984909 | 0.0043728 |
| Title | Cluster Plot | Dendrogram | e-value | e-value | e-value | Condition | Condition FDR | Condition Difference |
|---|---|---|---|---|---|---|---|---|
| Phatr_hclust_0320 |
 |
 |
100 |
360 |
800 |
highlight_0to6h | 0.984909 | -0.00428089 |
| Title | Cluster Plot | Dendrogram | e-value | e-value | e-value | Condition | Condition FDR | Condition Difference |
|---|---|---|---|---|---|---|---|---|
| Phatr_hclust_0057 |
 |
 |
0.045 |
5.2 |
110 |
highlight_0to6h | 0.984909 | -0.00484968 |
| Title | Cluster Plot | Dendrogram | e-value | e-value | e-value | Condition | Condition FDR | Condition Difference |
|---|---|---|---|---|---|---|---|---|
| Phatr_hclust_0217 |
 |
 |
35 |
370 |
510 |
highlight_0to6h | 0.984909 | 0.00860712 |
| Phatr_hclust_0217 |
|
|
35 |
370 |
510 |
Re-illuminated_0.5h | 0.984702 | 0.0404628 |
| Title | Cluster Plot | Dendrogram | e-value | e-value | e-value | Condition | Condition FDR | Condition Difference |
|---|---|---|---|---|---|---|---|---|
| Phatr_hclust_0009 |
 |
 |
0.93 |
3.1 |
5.2 |
highlight_0to6h | 0.984909 | 0.00409393 |
| Title | Cluster Plot | Dendrogram | e-value | e-value | e-value | Condition | Condition FDR | Condition Difference |
|---|---|---|---|---|---|---|---|---|
| Phatr_hclust_0097 |
 |
|
7.5e-17 |
1.9 |
3.5 |
Re-illuminated_6h | 0.984909 | -0.00367637 |
| Title | Cluster Plot | Dendrogram | e-value | e-value | e-value | Condition | Condition FDR | Condition Difference |
|---|---|---|---|---|---|---|---|---|
| Phatr_hclust_0479 |
 |
 |
110 |
660 |
360 |
highlight_0to6h | 0.984909 | -0.00614078 |
| Title | Cluster Plot | Dendrogram | e-value | e-value | e-value | Condition | Condition FDR | Condition Difference |
|---|---|---|---|---|---|---|---|---|
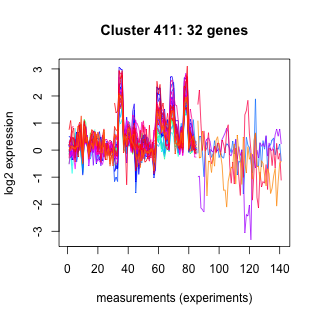
| Phatr_hclust_0411 |
 |
 |
0.066 |
6.5 |
13 |
Dark_treated | 0.984870 | 0.00834958 |
| Title | Cluster Plot | Dendrogram | e-value | e-value | e-value | Condition | Condition FDR | Condition Difference |
|---|---|---|---|---|---|---|---|---|
| Phatr_hclust_0468 |
 |
 |
6.1 |
12 |
72 |
highlight_0to6h | 0.984694 | 0.00858056 |
| Title | Cluster Plot | Dendrogram | e-value | e-value | e-value | Condition | Condition FDR | Condition Difference |
|---|---|---|---|---|---|---|---|---|
| Phatr_hclust_0079 |
 |
 |
28 |
1700 |
730 |
Si_free | 0.984544 | -0.00448591 |
| Title | Cluster Plot | Dendrogram | e-value | e-value | e-value | Condition | Condition FDR | Condition Difference |
|---|---|---|---|---|---|---|---|---|
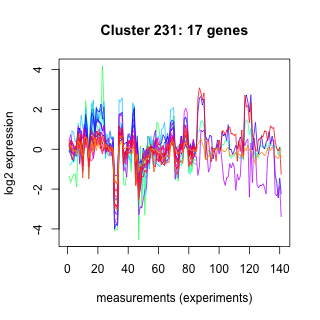
| Phatr_hclust_0231 |
 |
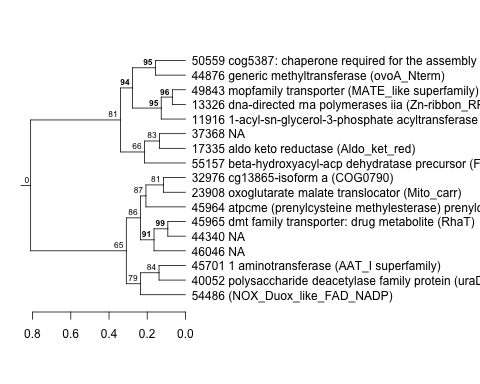 |
3 |
44 |
980 |
Green_vs_Red_24h | 0.984318 | 0.00347205 |
| Title | Cluster Plot | Dendrogram | e-value | e-value | e-value | Condition | Condition FDR | Condition Difference |
|---|---|---|---|---|---|---|---|---|
| Phatr_hclust_0453 |
 |
 |
220 |
310 |
370 |
light_15.5hr | 0.984242 | 0.0116826 |
| Title | Cluster Plot | Dendrogram | e-value | e-value | e-value | Condition | Condition FDR | Condition Difference |
|---|---|---|---|---|---|---|---|---|
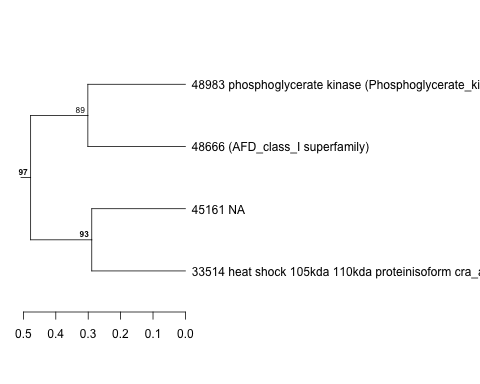
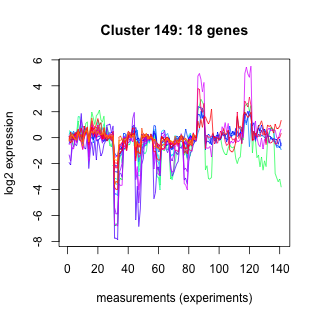
| Phatr_hclust_0149 |
 |
 |
0.0087 |
0.57 |
250 |
light_16hr_dark_7.5hr | 0.984146 | -2.2e-17 |
| Title | Cluster Plot | Dendrogram | e-value | e-value | e-value | Condition | Condition FDR | Condition Difference |
|---|---|---|---|---|---|---|---|---|
| Phatr_hclust_0457 |
 |
 |
0.018 |
0.76 |
48 |
dark_8hr_light_3hr | 0.984109 | -0.0053791 |
| Title | Cluster Plot | Dendrogram | e-value | e-value | e-value | Condition | Condition FDR | Condition Difference |
|---|---|---|---|---|---|---|---|---|
| Thaps_hclust_0389 |
 |
 |
0.00000008 |
0.00077 |
340 |
highpH_TMEVA | 0.984000 | -0.00695 |
| Title | Cluster Plot | Dendrogram | e-value | e-value | e-value | Condition | Condition FDR | Condition Difference |
|---|---|---|---|---|---|---|---|---|
| Thaps_hclust_0479 |
 |
 |
0.11 |
0.2 |
1.5 |
highpH_TMEVA | 0.984000 | -0.00683 |
| Title | Cluster Plot | Dendrogram | e-value | e-value | e-value | Condition | Condition FDR | Condition Difference |
|---|---|---|---|---|---|---|---|---|
| Thaps_hclust_0487 |
 |
 |
2.2 |
14 |
320 |
lowSi_TMEVA | 0.984000 | -0.101 |
| Title | Cluster Plot | Dendrogram | e-value | e-value | e-value | Condition | Condition FDR | Condition Difference |
|---|---|---|---|---|---|---|---|---|
| Thaps_hclust_0002 |
 |
 |
0.00000029 |
0.000000009 |
0.000055 |
exponential_vs_stationary_24light | 0.984000 | 0.00827 |
| Title | Cluster Plot | Dendrogram | e-value | e-value | e-value | Condition | Condition FDR | Condition Difference |
|---|---|---|---|---|---|---|---|---|
| Thaps_hclust_0050 |
 |
 |
0.0000000011 |
0.0000042 |
0.00021 |
lowFe_TMEVA | 0.984000 | 0.014 |
| Title | Cluster Plot | Dendrogram | e-value | e-value | e-value | Condition | Condition FDR | Condition Difference |
|---|---|---|---|---|---|---|---|---|
| Thaps_hclust_0109 |
 |
 |
17 |
32 |
5.5 |
exponential_vs_stationary_24light | 0.984000 | -0.0077 |
| Title | Cluster Plot | Dendrogram | e-value | e-value | e-value | Condition | Condition FDR | Condition Difference |
|---|---|---|---|---|---|---|---|---|
| Thaps_hclust_0132 |
 |
 |
0.00017 |
0.000096 |
26 |
co2_elevated_expo_arrays | 0.984000 | -0.0173 |
| Title | Cluster Plot | Dendrogram | e-value | e-value | e-value | Condition | Condition FDR | Condition Difference |
|---|---|---|---|---|---|---|---|---|
| Thaps_hclust_0148 |
 |
 |
4.7 |
39 |
51 |
highpH_TMEVA | 0.984000 | 0.00668 |
| Title | Cluster Plot | Dendrogram | e-value | e-value | e-value | Condition | Condition FDR | Condition Difference |
|---|---|---|---|---|---|---|---|---|
| Thaps_hclust_0195 |
 |
 |
0.0031 |
0.024 |
0.00037 |
lowSi_TMEVA | 0.984000 | -0.106 |