Hierarchical Clusters
Displaying 101 - 200 of 7500
| Title | Cluster Plot | Dendrogram | e-value | e-value | e-value | Condition | Condition FDR | Condition Difference |
|---|---|---|---|---|---|---|---|---|
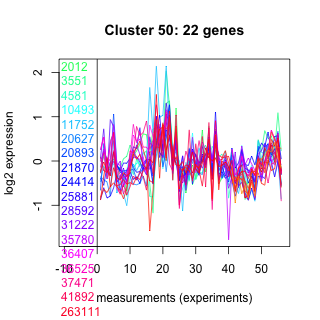
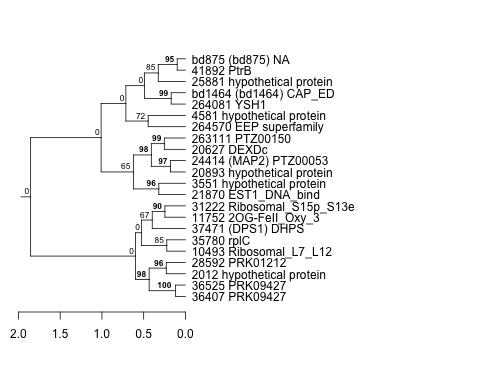
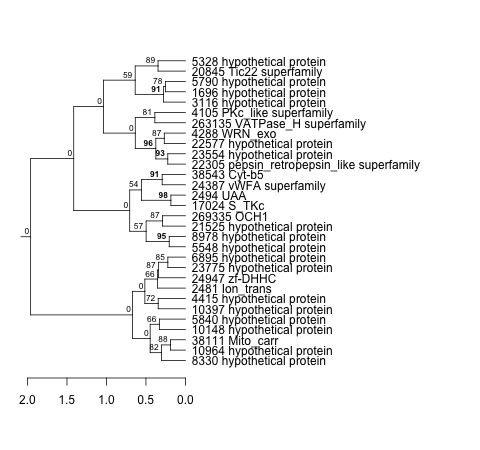
| Thaps_hclust_0050 |
 |
 |
0.0000000011 |
0.0000042 |
0.00021 |
co2_elevated_expo_arrays | 1.000000 | -0.00401 |
| Title | Cluster Plot | Dendrogram | e-value | e-value | e-value | Condition | Condition FDR | Condition Difference |
|---|---|---|---|---|---|---|---|---|
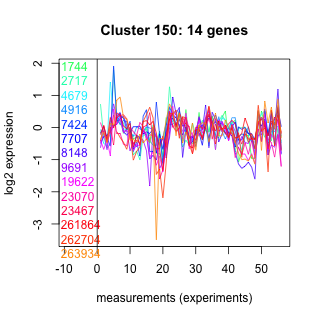
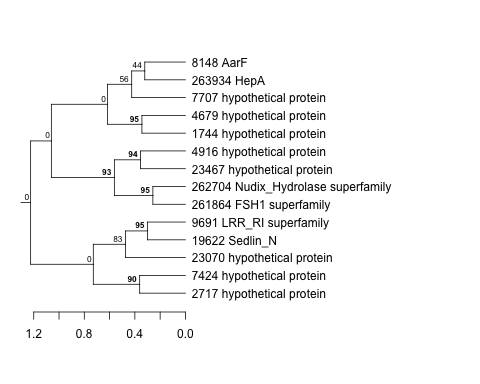
| Thaps_hclust_0150 |
 |
 |
0.16 |
0.73 |
6.8 |
lowSi_TMEVA | 1.000000 | -0.0264 |
| Title | Cluster Plot | Dendrogram | e-value | e-value | e-value | Condition | Condition FDR | Condition Difference |
|---|---|---|---|---|---|---|---|---|
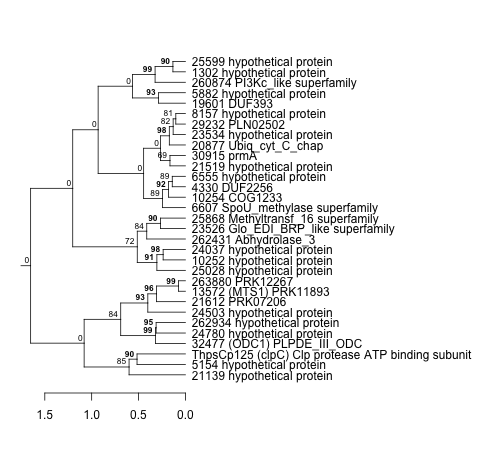
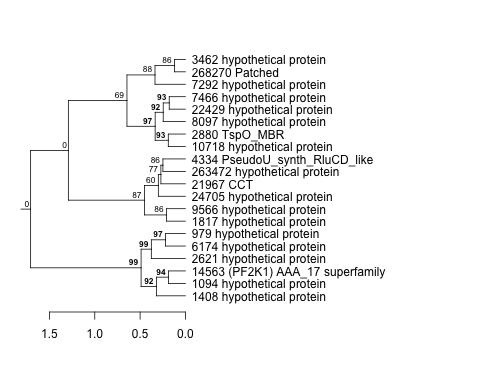
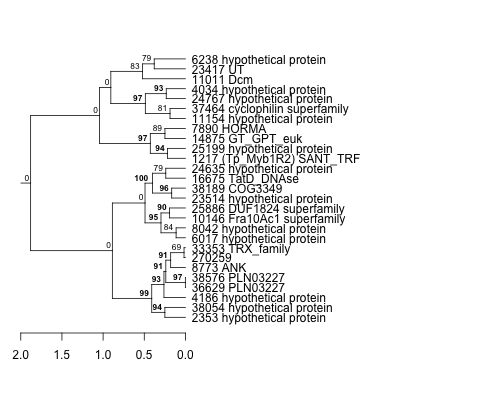
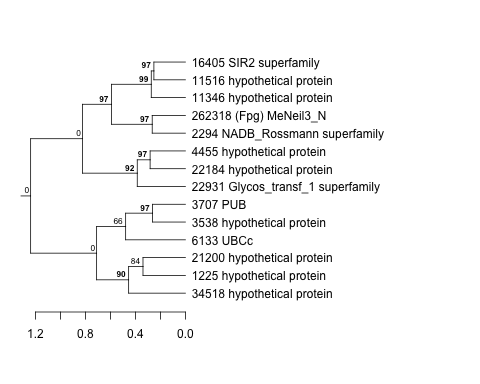
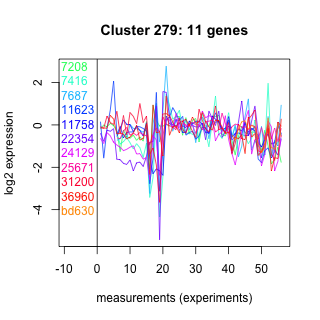
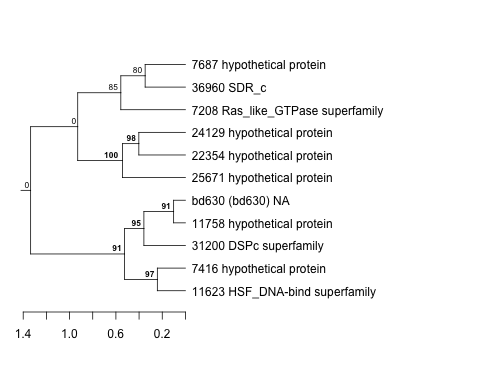
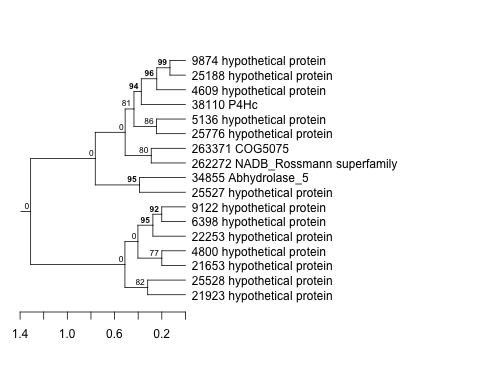
| Thaps_hclust_0255 |
 |
 |
1.4e-28 |
0.0000000000000024 |
0.000000029 |
lowtemp_TMEVA | 1.000000 | |
| Thaps_hclust_0255 |
|
|
1.4e-28 |
0.0000000000000024 |
0.000000029 |
highpH_TMEVA | 1.000000 | |
| Thaps_hclust_0255 |
|
|
1.4e-28 |
0.0000000000000024 |
0.000000029 |
lowFe_TMEVA | 1.000000 | |
| Thaps_hclust_0255 |
|
|
1.4e-28 |
0.0000000000000024 |
0.000000029 |
lowN_TMEVA | 1.000000 |
| Title | Cluster Plot | Dendrogram | e-value | e-value | e-value | Condition | Condition FDR | Condition Difference |
|---|---|---|---|---|---|---|---|---|
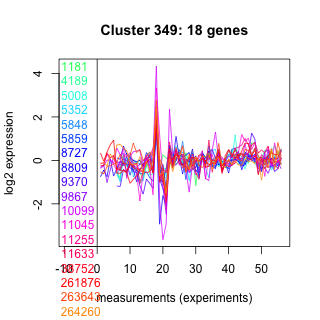
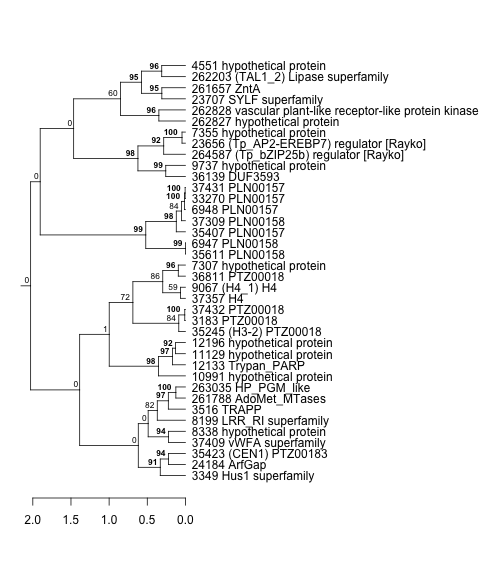
| Thaps_hclust_0349 |
 |
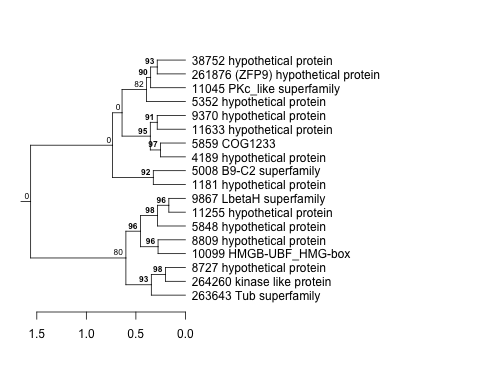 |
360 |
5.4 |
67 |
lowSi_TMEVA | 1.000000 | 0.0703 |
| Title | Cluster Plot | Dendrogram | e-value | e-value | e-value | Condition | Condition FDR | Condition Difference |
|---|---|---|---|---|---|---|---|---|
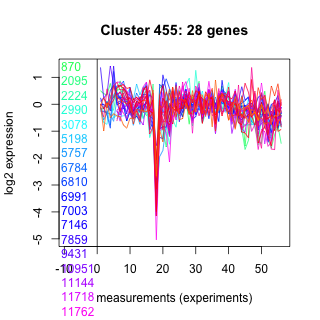
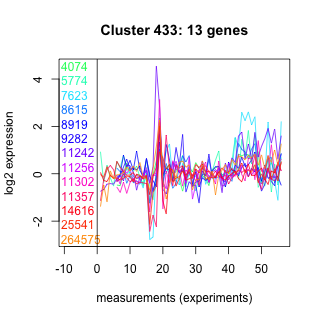
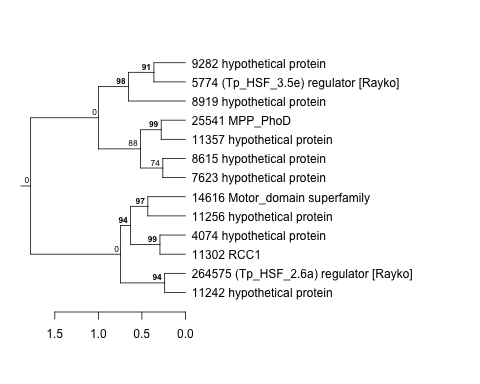
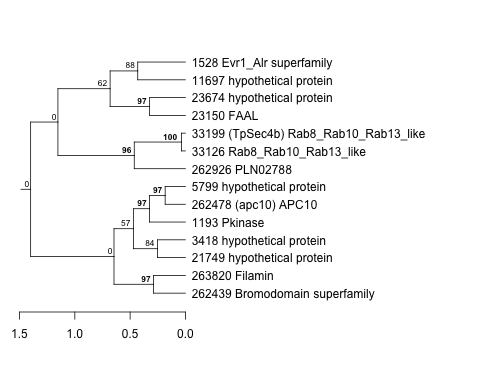
| Thaps_hclust_0455 |
 |
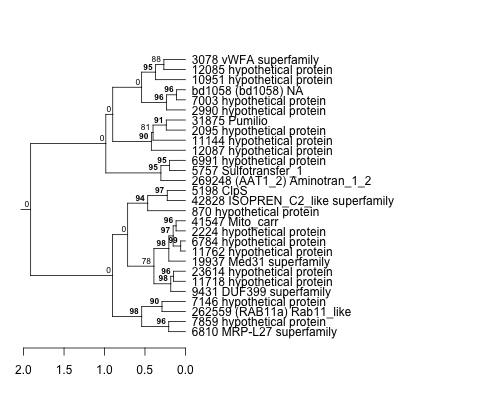 |
0.00038 |
0.18 |
0.01 |
lowSi_TMEVA | 1.000000 | 0.00972 |
| Title | Cluster Plot | Dendrogram | e-value | e-value | e-value | Condition | Condition FDR | Condition Difference |
|---|---|---|---|---|---|---|---|---|
| Thaps_hclust_0062 |
 |
 |
0.000000026 |
0.000000021 |
0.000000000021 |
lowtemp_TMEVA | 1.000000 | |
| Thaps_hclust_0062 |
|
|
0.000000026 |
0.000000021 |
0.000000000021 |
highpH_TMEVA | 1.000000 | |
| Thaps_hclust_0062 |
|
|
0.000000026 |
0.000000021 |
0.000000000021 |
lowFe_TMEVA | 1.000000 | |
| Thaps_hclust_0062 |
|
|
0.000000026 |
0.000000021 |
0.000000000021 |
lowN_TMEVA | 1.000000 |
| Title | Cluster Plot | Dendrogram | e-value | e-value | e-value | Condition | Condition FDR | Condition Difference |
|---|---|---|---|---|---|---|---|---|
| Thaps_hclust_0040 |
 |
 |
1.8e-29 |
0.000000000042 |
0.00000000063 |
lowtemp_TMEVA | 1.000000 | |
| Thaps_hclust_0040 |
|
|
1.8e-29 |
0.000000000042 |
0.00000000063 |
highpH_TMEVA | 1.000000 | |
| Thaps_hclust_0040 |
|
|
1.8e-29 |
0.000000000042 |
0.00000000063 |
lowFe_TMEVA | 1.000000 | |
| Thaps_hclust_0040 |
|
|
1.8e-29 |
0.000000000042 |
0.00000000063 |
lowN_TMEVA | 1.000000 | |
| Thaps_hclust_0040 |
|
|
1.8e-29 |
0.000000000042 |
0.00000000063 |
diel_exponential_vs_stationary | 0.998000 | 0.000908 |
| Title | Cluster Plot | Dendrogram | e-value | e-value | e-value | Condition | Condition FDR | Condition Difference |
|---|---|---|---|---|---|---|---|---|
| Thaps_hclust_0120 |
 |
 |
0.00000098 |
0.000000076 |
0.001 |
lowSi_TMEVA | 1.000000 | -0.0371 |
| Title | Cluster Plot | Dendrogram | e-value | e-value | e-value | Condition | Condition FDR | Condition Difference |
|---|---|---|---|---|---|---|---|---|
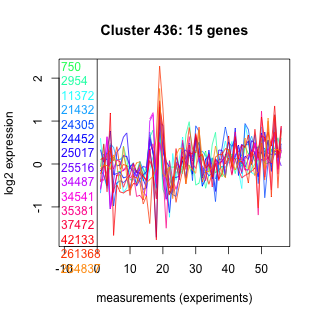
| Thaps_hclust_0436 |
 |
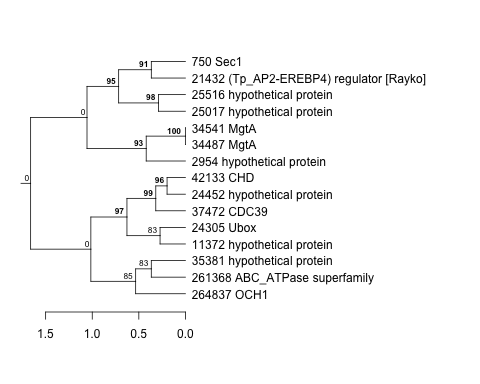 |
0.067 |
0.93 |
0.55 |
lowSi_TMEVA | 1.000000 | 0.0422 |
| Thaps_hclust_0436 |
|
|
0.067 |
0.93 |
0.55 |
lowFe_TMEVA | 0.996000 | -0.0041 |
| Title | Cluster Plot | Dendrogram | e-value | e-value | e-value | Condition | Condition FDR | Condition Difference |
|---|---|---|---|---|---|---|---|---|
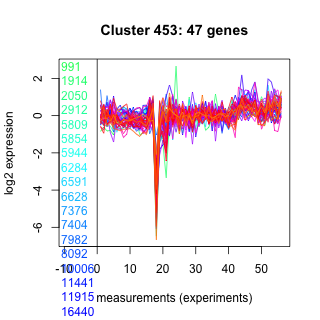
| Thaps_hclust_0453 |
 |
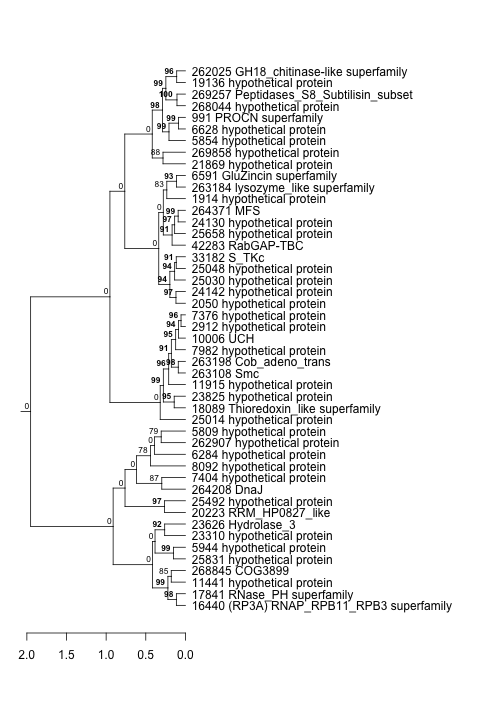 |
0.000000000093 |
0.000000041 |
0.00016 |
lowSi_TMEVA | 1.000000 | -0.00447 |
| Title | Cluster Plot | Dendrogram | e-value | e-value | e-value | Condition | Condition FDR | Condition Difference |
|---|---|---|---|---|---|---|---|---|
| Thaps_hclust_0149 |
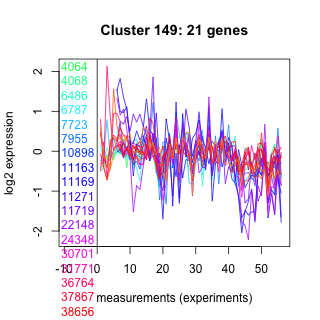 |
 |
0.00000027 |
0.46 |
3 |
lowSi_TMEVA | 1.000000 | -0.0367 |
| Title | Cluster Plot | Dendrogram | e-value | e-value | e-value | Condition | Condition FDR | Condition Difference |
|---|---|---|---|---|---|---|---|---|
| Thaps_hclust_0179 |
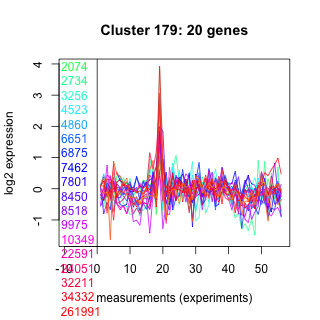 |
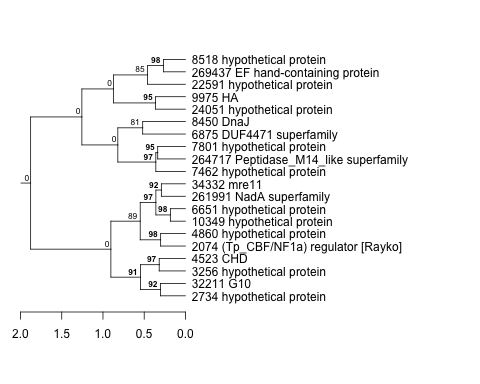 |
0.0000039 |
0.056 |
2.8 |
lowN_TMEVA | 1.000000 | -0.004 |
| Title | Cluster Plot | Dendrogram | e-value | e-value | e-value | Condition | Condition FDR | Condition Difference |
|---|---|---|---|---|---|---|---|---|
| Thaps_hclust_0348 |
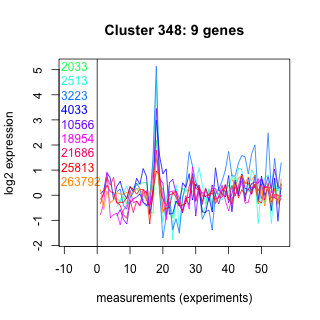 |
 |
8.7 |
34 |
60 |
lowSi_TMEVA | 1.000000 | 0.00471 |
| Title | Cluster Plot | Dendrogram | e-value | e-value | e-value | Condition | Condition FDR | Condition Difference |
|---|---|---|---|---|---|---|---|---|
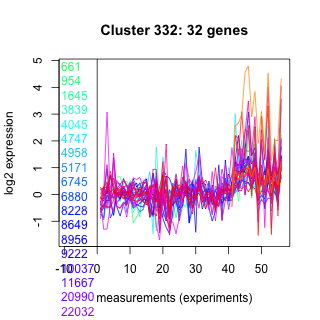
| Thaps_hclust_0332 |
 |
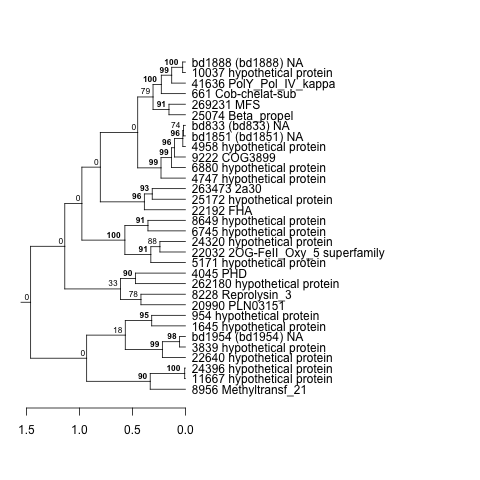 |
0.000000055 |
0.0000013 |
0.0037 |
lowSi_TMEVA | 1.000000 | -0.0301 |
| Title | Cluster Plot | Dendrogram | e-value | e-value | e-value | Condition | Condition FDR | Condition Difference |
|---|---|---|---|---|---|---|---|---|
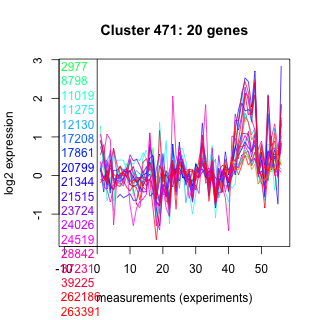
| Thaps_hclust_0471 |
 |
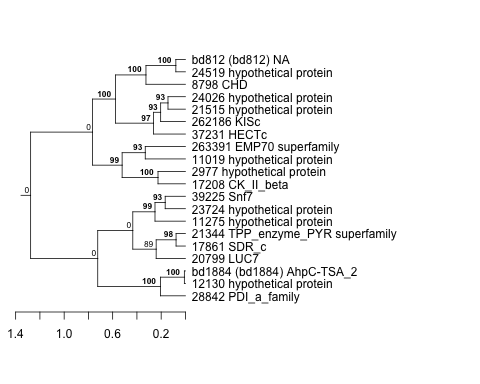 |
0.0086 |
0.14 |
2.6 |
lowSi_TMEVA | 1.000000 | 0.0402 |
| Title | Cluster Plot | Dendrogram | e-value | e-value | e-value | Condition | Condition FDR | Condition Difference |
|---|---|---|---|---|---|---|---|---|
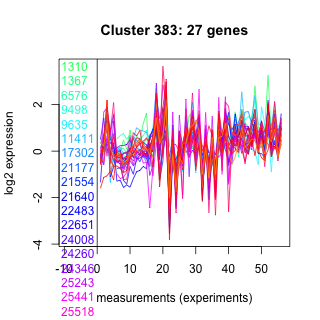
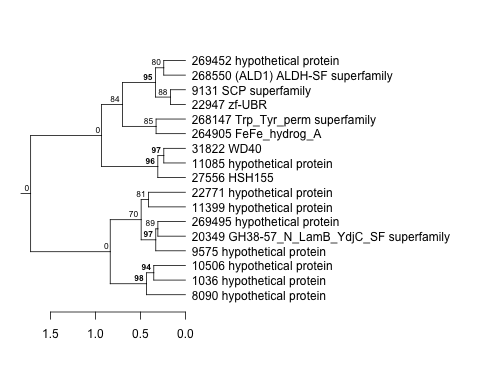
| Thaps_hclust_0383 |
 |
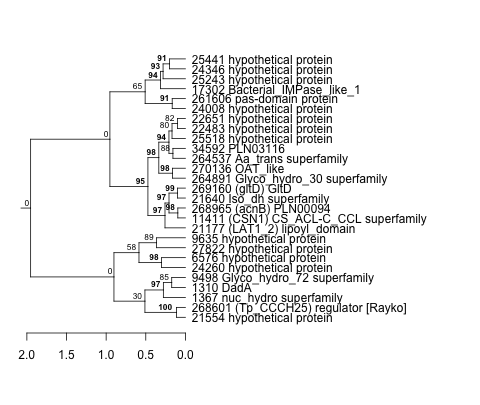 |
0.00049 |
0.088 |
0.58 |
lowSi_TMEVA | 1.000000 | -0.0621 |
| Title | Cluster Plot | Dendrogram | e-value | e-value | e-value | Condition | Condition FDR | Condition Difference |
|---|---|---|---|---|---|---|---|---|
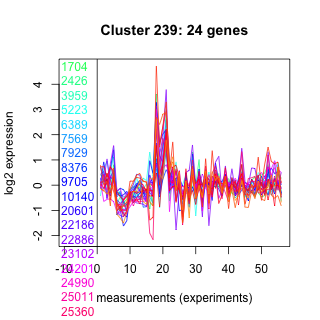
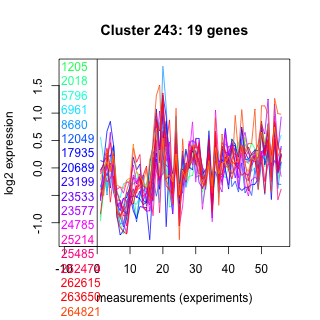
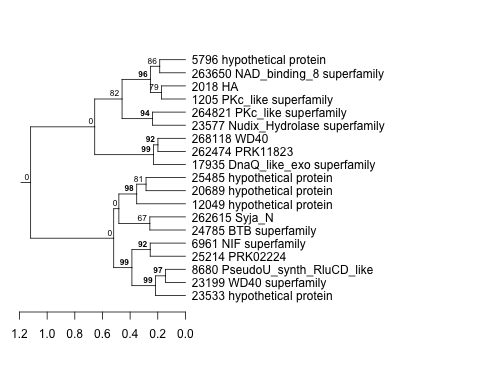
| Thaps_hclust_0239 |
 |
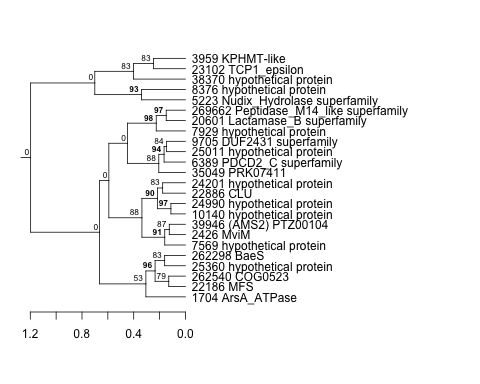 |
0.000019 |
0.001 |
0.06 |
co2_elevated_expo_arrays | 1.000000 | -0.00239 |
| Title | Cluster Plot | Dendrogram | e-value | e-value | e-value | Condition | Condition FDR | Condition Difference |
|---|---|---|---|---|---|---|---|---|
| Thaps_hclust_0028 |
 |
|
1.6e-27 |
6.8e-18 |
0.0000000000000078 |
co2_elevated_expo_arrays | 1.000000 | 0.00454 |
| Title | Cluster Plot | Dendrogram | e-value | e-value | e-value | Condition | Condition FDR | Condition Difference |
|---|---|---|---|---|---|---|---|---|
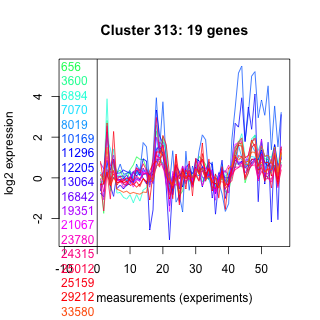
| Thaps_hclust_0313 |
 |
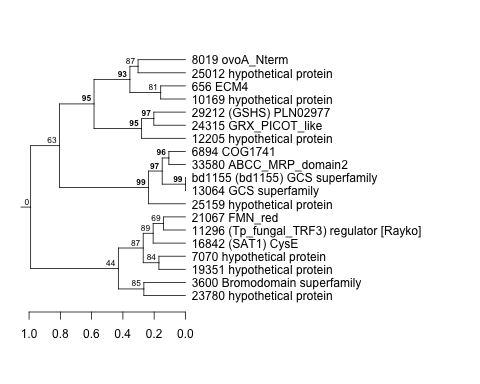 |
0.00000043 |
0.00014 |
0.00078 |
lowSi_TMEVA | 1.000000 | -0.039 |
| Title | Cluster Plot | Dendrogram | e-value | e-value | e-value | Condition | Condition FDR | Condition Difference |
|---|---|---|---|---|---|---|---|---|
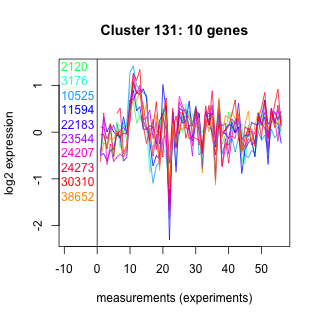
| Thaps_hclust_0131 |
 |
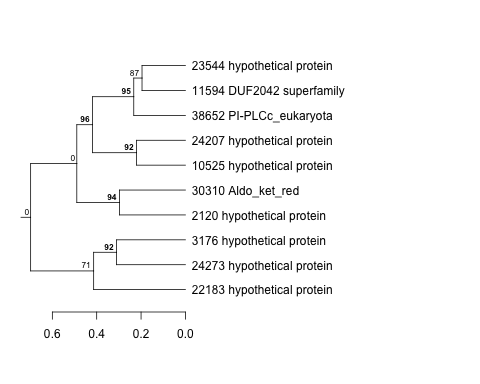 |
260 |
48 |
370 |
lowSi_TMEVA | 1.000000 | -0.0511 |
| Title | Cluster Plot | Dendrogram | e-value | e-value | e-value | Condition | Condition FDR | Condition Difference |
|---|---|---|---|---|---|---|---|---|
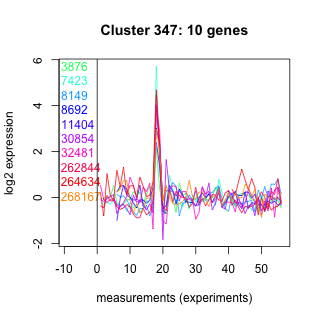
| Thaps_hclust_0347 |
 |
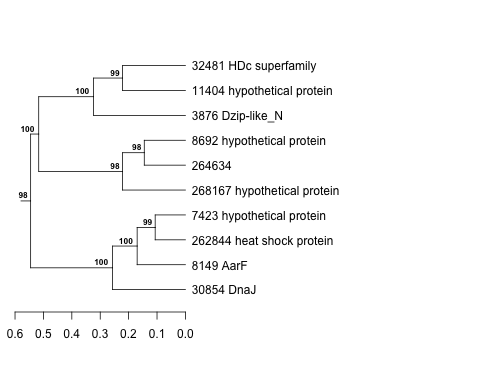 |
1.2 |
0.85 |
91 |
lowSi_TMEVA | 1.000000 | -0.0685 |
| Title | Cluster Plot | Dendrogram | e-value | e-value | e-value | Condition | Condition FDR | Condition Difference |
|---|---|---|---|---|---|---|---|---|
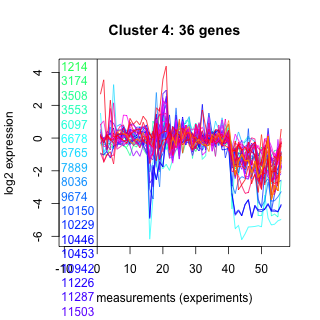
| Thaps_hclust_0004 |
 |
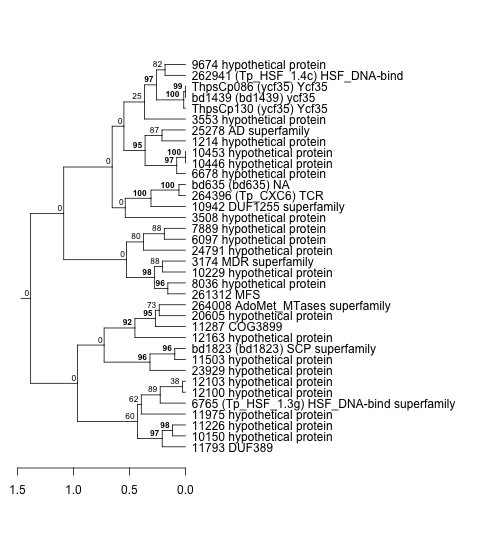 |
0.000000074 |
0.0000031 |
0.0000044 |
lowSi_TMEVA | 1.000000 | -0.000448 |
| Title | Cluster Plot | Dendrogram | e-value | e-value | e-value | Condition | Condition FDR | Condition Difference |
|---|---|---|---|---|---|---|---|---|
| Thaps_hclust_0243 |
 |
 |
0.00018 |
0.14 |
0.0019 |
lowSi_TMEVA | 1.000000 | 0.0645 |
| Title | Cluster Plot | Dendrogram | e-value | e-value | e-value | Condition | Condition FDR | Condition Difference |
|---|---|---|---|---|---|---|---|---|
| Thaps_hclust_0340 |
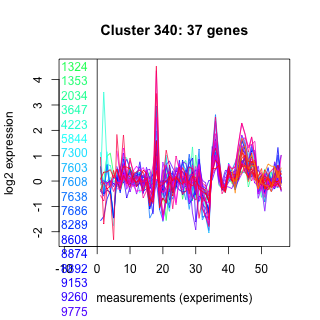 |
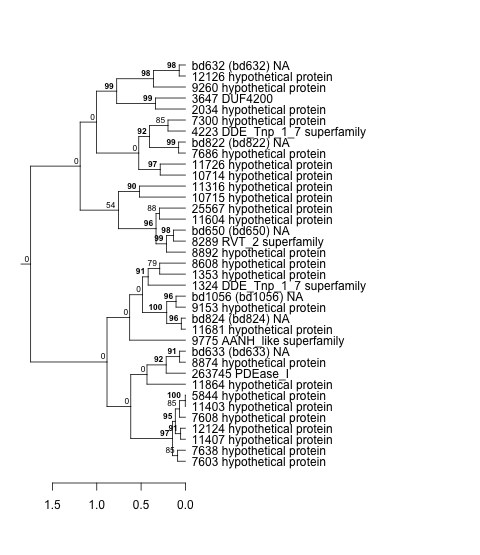 |
0.00000000039 |
0.0000000031 |
0.0000002 |
highpH_TMEVA | 1.000000 | -0.000836 |
| Title | Cluster Plot | Dendrogram | e-value | e-value | e-value | Condition | Condition FDR | Condition Difference |
|---|---|---|---|---|---|---|---|---|
| Thaps_hclust_0346 |
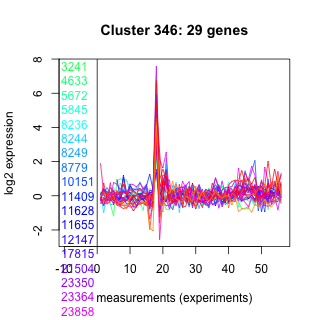 |
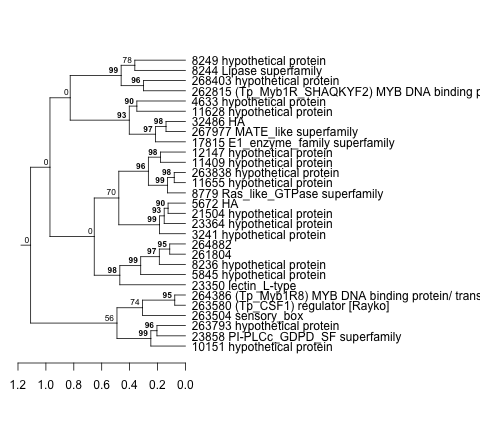 |
0.00053 |
4.7 |
80 |
lowSi_TMEVA | 1.000000 | -0.0296 |
| Title | Cluster Plot | Dendrogram | e-value | e-value | e-value | Condition | Condition FDR | Condition Difference |
|---|---|---|---|---|---|---|---|---|
| Thaps_hclust_0159 |
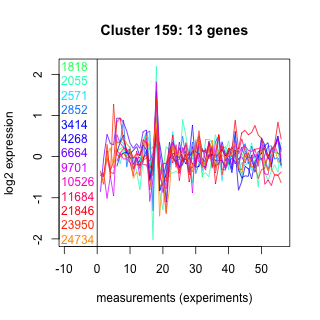 |
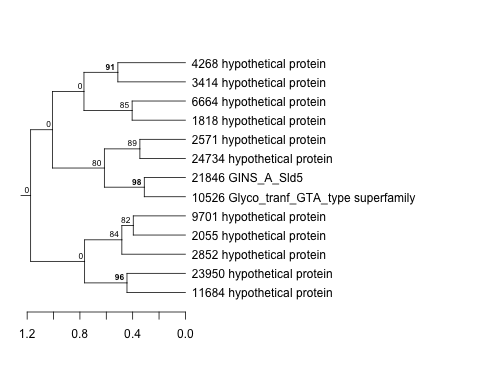 |
0.087 |
1.3 |
3 |
co2_elevated_expo_arrays | 1.000000 | -0.00147 |
| Title | Cluster Plot | Dendrogram | e-value | e-value | e-value | Condition | Condition FDR | Condition Difference |
|---|---|---|---|---|---|---|---|---|
| Thaps_hclust_0469 |
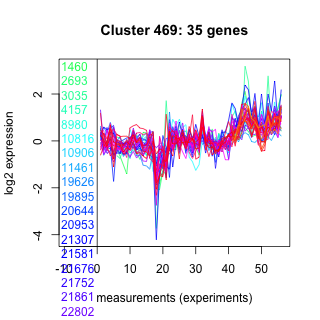 |
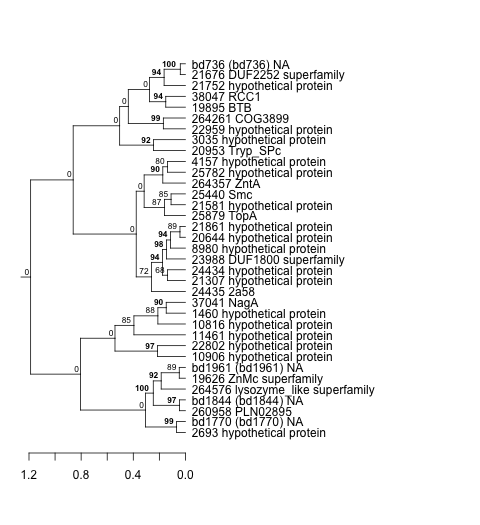 |
0.000013 |
0.00011 |
0.00029 |
lowSi_TMEVA | 1.000000 | 0.092 |
| Title | Cluster Plot | Dendrogram | e-value | e-value | e-value | Condition | Condition FDR | Condition Difference |
|---|---|---|---|---|---|---|---|---|
| Thaps_hclust_0259 |
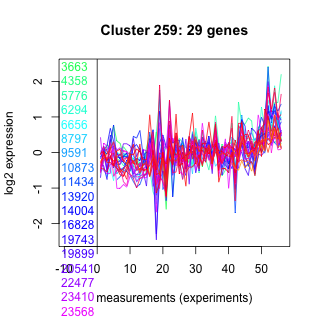 |
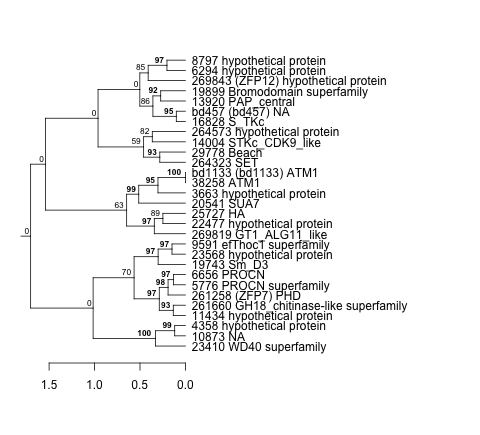 |
0.000051 |
0.026 |
17 |
lowSi_TMEVA | 1.000000 | 0.0108 |
| Title | Cluster Plot | Dendrogram | e-value | e-value | e-value | Condition | Condition FDR | Condition Difference |
|---|---|---|---|---|---|---|---|---|
| Thaps_hclust_0410 |
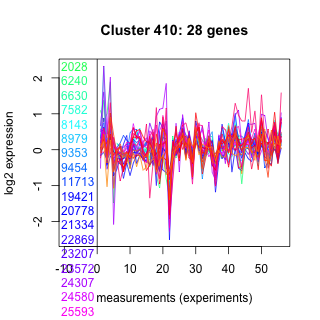 |
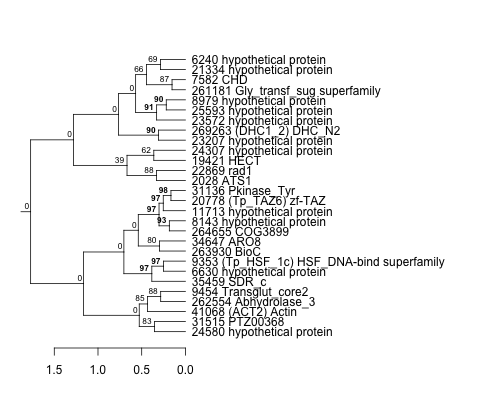 |
0.065 |
0.56 |
0.36 |
co2_elevated_expo_arrays | 1.000000 | 0.000102 |
| Title | Cluster Plot | Dendrogram | e-value | e-value | e-value | Condition | Condition FDR | Condition Difference |
|---|---|---|---|---|---|---|---|---|
| Thaps_hclust_0343 |
 |
 |
9.7e-16 |
0.000000023 |
0.0000000024 |
lowN_TMEVA | 1.000000 | 0.00376 |
| Thaps_hclust_0343 |
|
|
9.7e-16 |
0.000000023 |
0.0000000024 |
lowSi_TMEVA | 1.000000 | 0.0364 |
| Title | Cluster Plot | Dendrogram | e-value | e-value | e-value | Condition | Condition FDR | Condition Difference |
|---|---|---|---|---|---|---|---|---|
| Thaps_hclust_0260 |
 |
 |
1.6e-36 |
9.1e-22 |
8.6e-22 |
lowSi_TMEVA | 1.000000 | -0.0448 |
| Title | Cluster Plot | Dendrogram | e-value | e-value | e-value | Condition | Condition FDR | Condition Difference |
|---|---|---|---|---|---|---|---|---|
| Thaps_hclust_0434 |
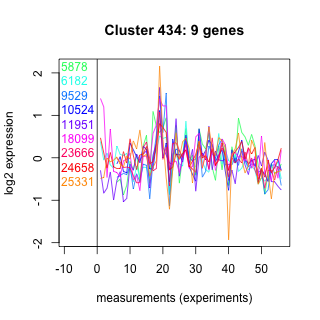 |
 |
0.011 |
17 |
57 |
lowSi_TMEVA | 1.000000 | 0.0404 |
| Title | Cluster Plot | Dendrogram | e-value | e-value | e-value | Condition | Condition FDR | Condition Difference |
|---|---|---|---|---|---|---|---|---|
| Thaps_hclust_0232 |
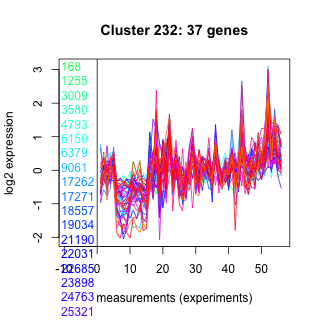 |
 |
9.2e-16 |
0.000000000000019 |
0.35 |
lowSi_TMEVA | 1.000000 | 0.0497 |
| Title | Cluster Plot | Dendrogram | e-value | e-value | e-value | Condition | Condition FDR | Condition Difference |
|---|---|---|---|---|---|---|---|---|
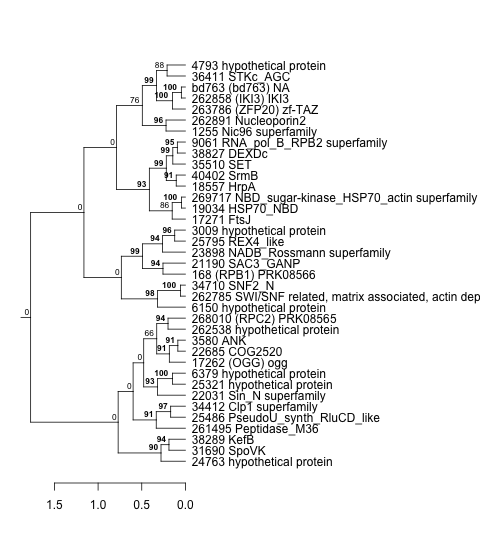
| Thaps_hclust_0451 |
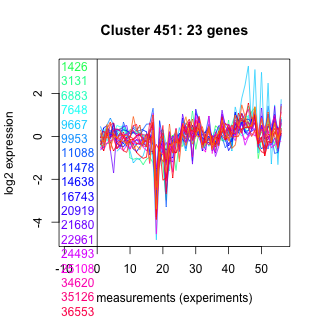 |
 |
10 |
0.0026 |
160 |
lowSi_TMEVA | 1.000000 | 0.00553 |
| Title | Cluster Plot | Dendrogram | e-value | e-value | e-value | Condition | Condition FDR | Condition Difference |
|---|---|---|---|---|---|---|---|---|
| Thaps_hclust_0329 |
 |
 |
0.0000000004 |
0.00000034 |
0.000023 |
lowSi_TMEVA | 1.000000 | 0.035 |
| Title | Cluster Plot | Dendrogram | e-value | e-value | e-value | Condition | Condition FDR | Condition Difference |
|---|---|---|---|---|---|---|---|---|
| Thaps_hclust_0468 |
 |
 |
0.0023 |
0.08 |
2.3 |
lowSi_TMEVA | 1.000000 | 0.0786 |
| Title | Cluster Plot | Dendrogram | e-value | e-value | e-value | Condition | Condition FDR | Condition Difference |
|---|---|---|---|---|---|---|---|---|
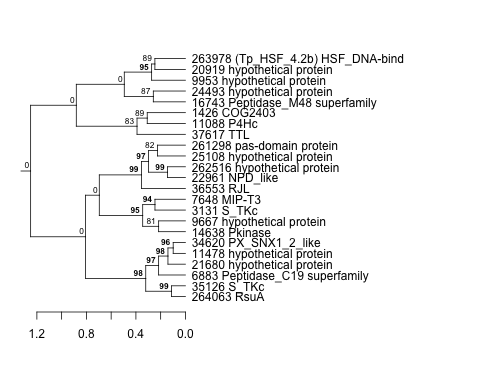
| Thaps_hclust_0241 |
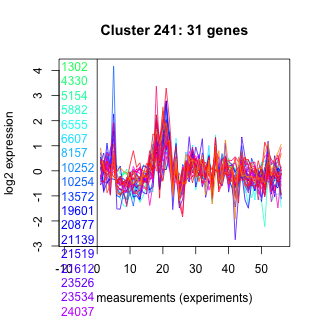 |
 |
0.0000000022 |
0.0000017 |
0.68 |
lowSi_TMEVA | 1.000000 | -0.0192 |
| Title | Cluster Plot | Dendrogram | e-value | e-value | e-value | Condition | Condition FDR | Condition Difference |
|---|---|---|---|---|---|---|---|---|
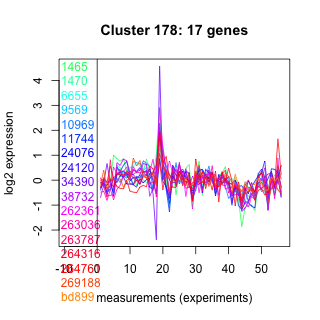
| Thaps_hclust_0178 |
 |
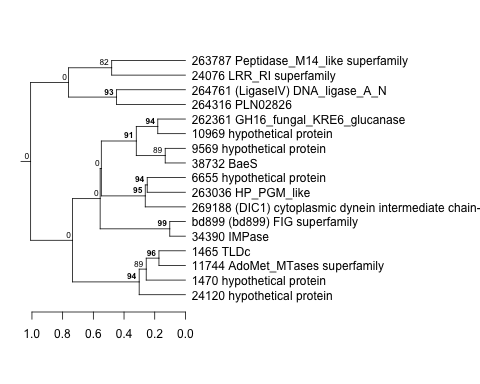 |
0.0000000019 |
0.00000047 |
0.000019 |
lowSi_TMEVA | 1.000000 | -0.0369 |
| Title | Cluster Plot | Dendrogram | e-value | e-value | e-value | Condition | Condition FDR | Condition Difference |
|---|---|---|---|---|---|---|---|---|
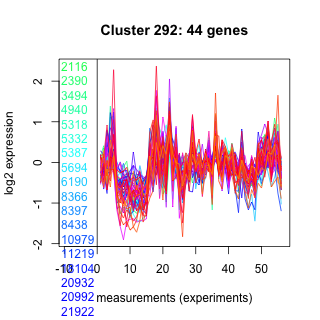
| Thaps_hclust_0292 |
 |
 |
1.4e-30 |
0.00000000000037 |
0.0000067 |
lowN_TMEVA | 1.000000 | -0.0000565 |
| Title | Cluster Plot | Dendrogram | e-value | e-value | e-value | Condition | Condition FDR | Condition Difference |
|---|---|---|---|---|---|---|---|---|
| Thaps_hclust_0483 |
 |
 |
0.7 |
5 |
0.096 |
lowSi_TMEVA | 1.000000 | 0.0299 |
| Title | Cluster Plot | Dendrogram | e-value | e-value | e-value | Condition | Condition FDR | Condition Difference |
|---|---|---|---|---|---|---|---|---|
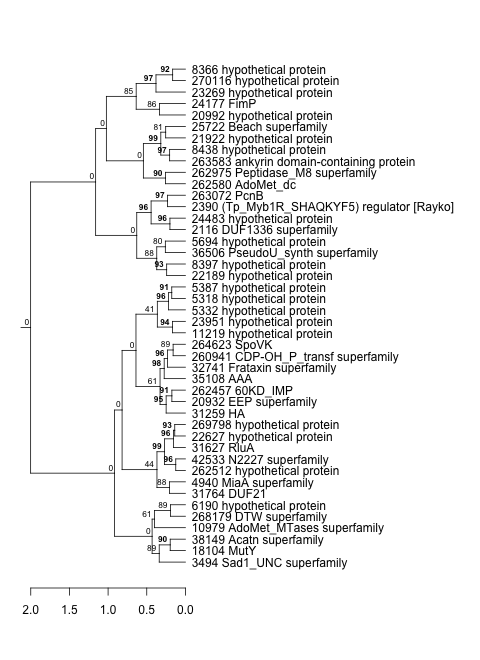
| Thaps_hclust_0196 |
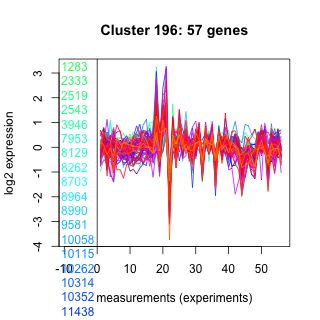 |
 |
0.0000000000000088 |
0.00000034 |
0.000017 |
lowSi_TMEVA | 1.000000 | -0.0249 |
| Title | Cluster Plot | Dendrogram | e-value | e-value | e-value | Condition | Condition FDR | Condition Difference |
|---|---|---|---|---|---|---|---|---|
| Thaps_hclust_0128 |
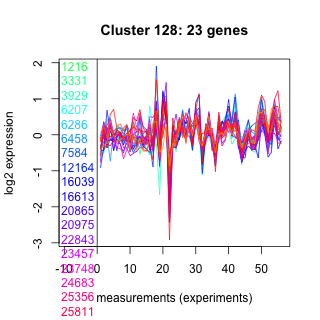 |
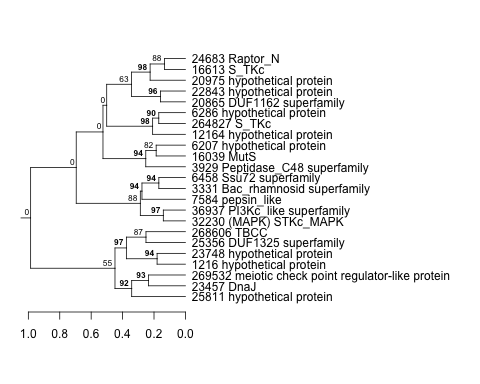 |
0.0000000058 |
0.00033 |
21 |
co2_elevated_expo_arrays | 1.000000 | 0.00246 |
| Title | Cluster Plot | Dendrogram | e-value | e-value | e-value | Condition | Condition FDR | Condition Difference |
|---|---|---|---|---|---|---|---|---|
| Thaps_hclust_0433 |
 |
 |
14 |
54 |
440 |
lowSi_TMEVA | 1.000000 | -0.0409 |
| Title | Cluster Plot | Dendrogram | e-value | e-value | e-value | Condition | Condition FDR | Condition Difference |
|---|---|---|---|---|---|---|---|---|
| Thaps_hclust_0231 |
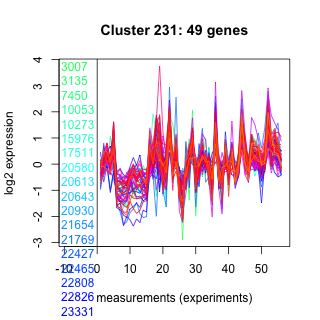 |
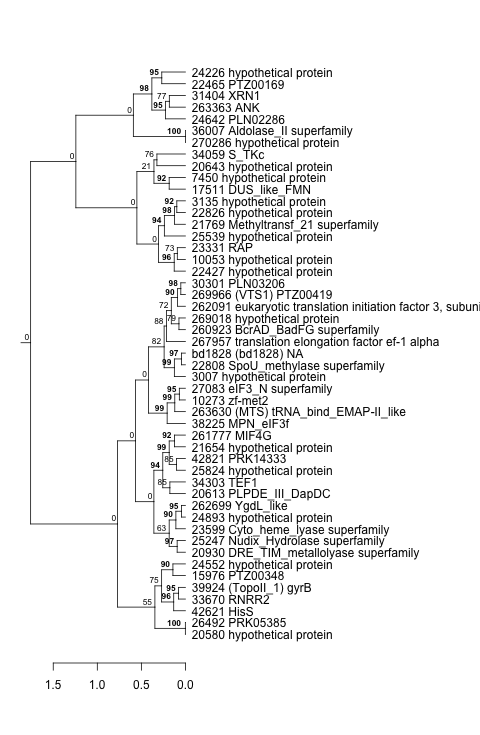 |
9.5e-23 |
0.000000000000034 |
0.00000039 |
lowSi_TMEVA | 1.000000 | -0.0141 |
| Title | Cluster Plot | Dendrogram | e-value | e-value | e-value | Condition | Condition FDR | Condition Difference |
|---|---|---|---|---|---|---|---|---|
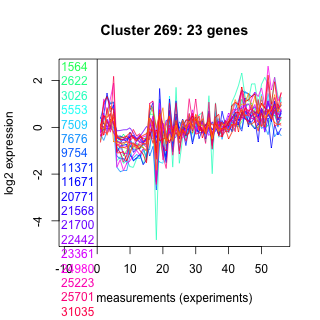
| Thaps_hclust_0269 |
 |
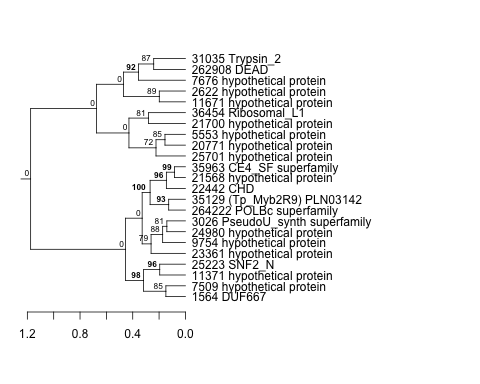 |
0.0025 |
0.032 |
0.077 |
co2_elevated_expo_arrays | 1.000000 | -0.0013 |
| Title | Cluster Plot | Dendrogram | e-value | e-value | e-value | Condition | Condition FDR | Condition Difference |
|---|---|---|---|---|---|---|---|---|
| Thaps_hclust_0064 |
 |
 |
0.000000012 |
0.00000073 |
0.0000002 |
lowSi_TMEVA | 1.000000 | -0.0228 |
| Title | Cluster Plot | Dendrogram | e-value | e-value | e-value | Condition | Condition FDR | Condition Difference |
|---|---|---|---|---|---|---|---|---|
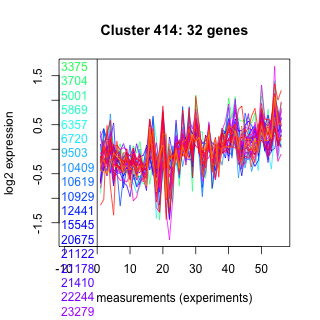
| Thaps_hclust_0414 |
 |
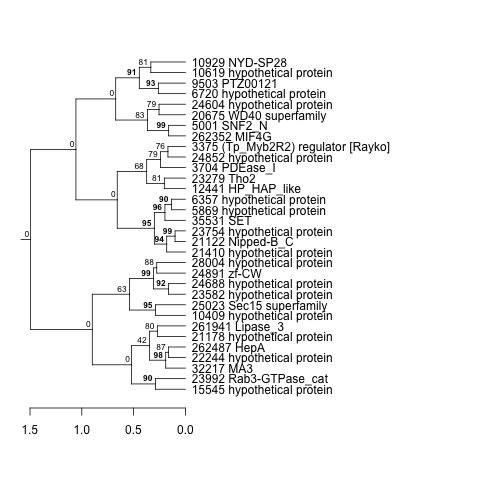 |
0.0000000000028 |
0.00000026 |
0.000019 |
lowSi_TMEVA | 1.000000 | 0.065 |
| Title | Cluster Plot | Dendrogram | e-value | e-value | e-value | Condition | Condition FDR | Condition Difference |
|---|---|---|---|---|---|---|---|---|
| Thaps_hclust_0042 |
 |
 |
0.26 |
5.9 |
0.46 |
lowSi_TMEVA | 1.000000 | 0.0000692 |
| Title | Cluster Plot | Dendrogram | e-value | e-value | e-value | Condition | Condition FDR | Condition Difference |
|---|---|---|---|---|---|---|---|---|
| Thaps_hclust_0293 |
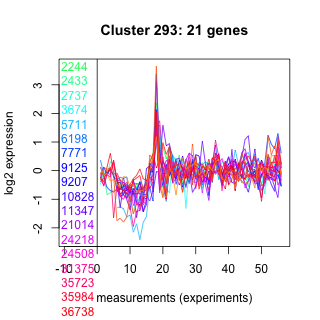 |
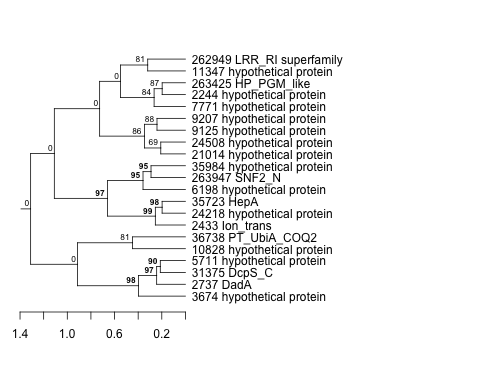 |
0.16 |
120 |
360 |
lowSi_TMEVA | 1.000000 | -0.0714 |
| Title | Cluster Plot | Dendrogram | e-value | e-value | e-value | Condition | Condition FDR | Condition Difference |
|---|---|---|---|---|---|---|---|---|
| Thaps_hclust_0310 |
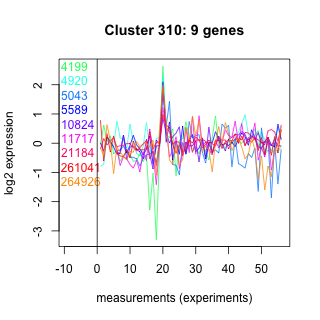 |
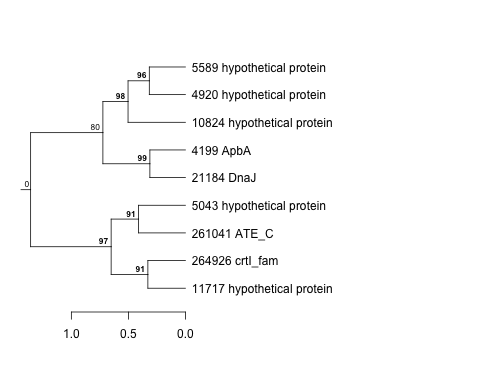 |
4.9 |
19 |
86 |
lowSi_TMEVA | 1.000000 | 0.0292 |
| Title | Cluster Plot | Dendrogram | e-value | e-value | e-value | Condition | Condition FDR | Condition Difference |
|---|---|---|---|---|---|---|---|---|
| Thaps_hclust_0449 |
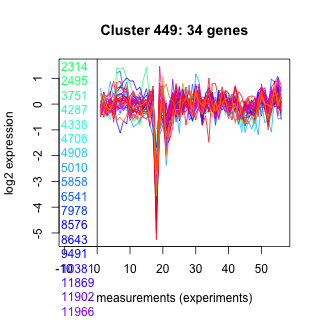 |
 |
0.0000000011 |
0.012 |
3.5 |
lowSi_TMEVA | 1.000000 | -0.0133 |
| Title | Cluster Plot | Dendrogram | e-value | e-value | e-value | Condition | Condition FDR | Condition Difference |
|---|---|---|---|---|---|---|---|---|
| Thaps_hclust_0467 |
 |
 |
0.000000000002 |
0.0000014 |
0.035 |
lowSi_TMEVA | 1.000000 | -0.0909 |
| Title | Cluster Plot | Dendrogram | e-value | e-value | e-value | Condition | Condition FDR | Condition Difference |
|---|---|---|---|---|---|---|---|---|
| Thaps_hclust_0387 |
 |
 |
0.0023 |
0.003 |
0.38 |
lowtemp_TMEVA | 0.999000 | 0.00275 |
| Title | Cluster Plot | Dendrogram | e-value | e-value | e-value | Condition | Condition FDR | Condition Difference |
|---|---|---|---|---|---|---|---|---|
| Thaps_hclust_0095 |
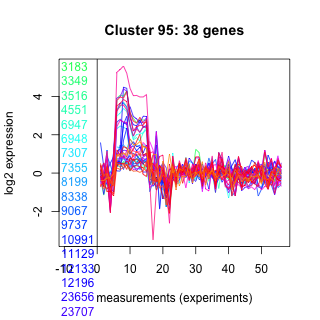 |
 |
5.3e-28 |
1.7e-25 |
1.6e-17 |
co2_elevated_stat_arrays | 0.999000 | -0.000503 |
| Title | Cluster Plot | Dendrogram | e-value | e-value | e-value | Condition | Condition FDR | Condition Difference |
|---|---|---|---|---|---|---|---|---|
| Thaps_hclust_0032 |
 |
 |
1.3e-16 |
0.00000035 |
0.00012 |
lowtemp_TMEVA | 0.999000 | -0.0022 |
| Title | Cluster Plot | Dendrogram | e-value | e-value | e-value | Condition | Condition FDR | Condition Difference |
|---|---|---|---|---|---|---|---|---|
| Thaps_hclust_0330 |
 |
 |
0.0000058 |
0.00000085 |
0.000041 |
lowtemp_TMEVA | 0.999000 | -0.00329 |
| Title | Cluster Plot | Dendrogram | e-value | e-value | e-value | Condition | Condition FDR | Condition Difference |
|---|---|---|---|---|---|---|---|---|
| Thaps_hclust_0055 |
 |
 |
0.000000038 |
0.0000074 |
0.1 |
diel_exponential_vs_stationary | 0.999000 | 0.000455 |
| Title | Cluster Plot | Dendrogram | e-value | e-value | e-value | Condition | Condition FDR | Condition Difference |
|---|---|---|---|---|---|---|---|---|
| Thaps_hclust_0378 |
 |
 |
0.0003 |
210 |
10 |
lowtemp_TMEVA | 0.999000 | -0.00497 |
| Title | Cluster Plot | Dendrogram | e-value | e-value | e-value | Condition | Condition FDR | Condition Difference |
|---|---|---|---|---|---|---|---|---|
| Thaps_hclust_0447 |
 |
 |
0.0005 |
0.0031 |
0.0041 |
lowtemp_TMEVA | 0.999000 | -0.00385 |
| Title | Cluster Plot | Dendrogram | e-value | e-value | e-value | Condition | Condition FDR | Condition Difference |
|---|---|---|---|---|---|---|---|---|
| Thaps_hclust_0432 |
 |
 |
0.011 |
0.06 |
2.4 |
diel_exponential_vs_stationary | 0.999000 | -0.000697 |
| Title | Cluster Plot | Dendrogram | e-value | e-value | e-value | Condition | Condition FDR | Condition Difference |
|---|---|---|---|---|---|---|---|---|
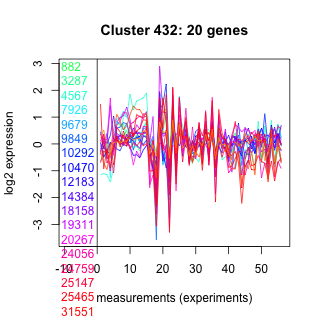
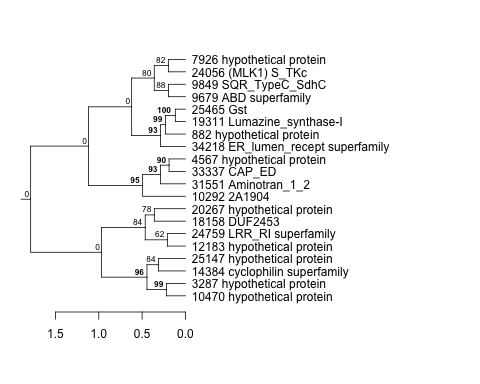
| Thaps_hclust_0204 |
 |
 |
0.000065 |
0.008 |
0.00052 |
co2_elevated_stat_arrays | 0.999000 | -0.00098 |
| Thaps_hclust_0204 |
|
|
0.000065 |
0.008 |
0.00052 |
co2_elevated_expo_arrays | 0.998000 | -0.00467 |
| Title | Cluster Plot | Dendrogram | e-value | e-value | e-value | Condition | Condition FDR | Condition Difference |
|---|---|---|---|---|---|---|---|---|
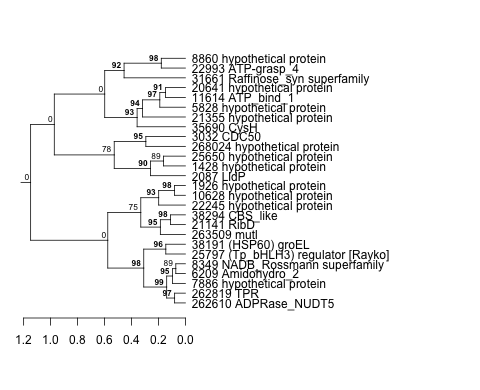
| Thaps_hclust_0285 |
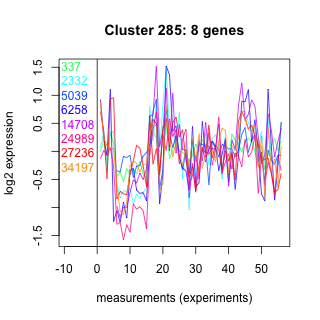 |
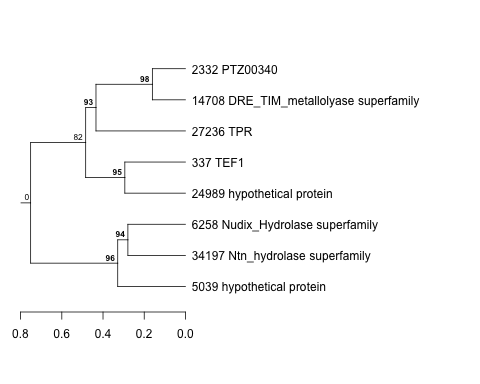 |
0.00019 |
0.057 |
5.9 |
lowtemp_TMEVA | 0.999000 | -0.00326 |
| Title | Cluster Plot | Dendrogram | e-value | e-value | e-value | Condition | Condition FDR | Condition Difference |
|---|---|---|---|---|---|---|---|---|
| Thaps_hclust_0034 |
 |
 |
0.000015 |
0.000083 |
0.63 |
co2_elevated_stat_arrays | 0.999000 | -0.000264 |
| Title | Cluster Plot | Dendrogram | e-value | e-value | e-value | Condition | Condition FDR | Condition Difference |
|---|---|---|---|---|---|---|---|---|
| Thaps_hclust_0226 |
 |
 |
0.000000041 |
0.95 |
4.6 |
diel_exponential_vs_stationary | 0.998000 | -0.00118 |
| Title | Cluster Plot | Dendrogram | e-value | e-value | e-value | Condition | Condition FDR | Condition Difference |
|---|---|---|---|---|---|---|---|---|
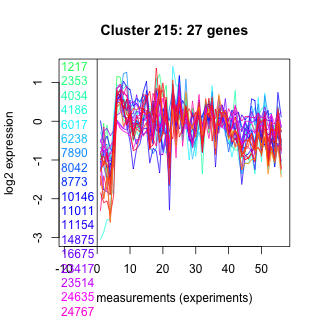
| Thaps_hclust_0215 |
 |
 |
0.000036 |
0.0000076 |
0.000057 |
diel_exponential_vs_stationary | 0.998000 | -0.00101 |
| Title | Cluster Plot | Dendrogram | e-value | e-value | e-value | Condition | Condition FDR | Condition Difference |
|---|---|---|---|---|---|---|---|---|
| Thaps_hclust_0169 |
 |
 |
2.2 |
23 |
3.9 |
exponential_vs_stationary_24highlight | 0.998000 | 0.000339 |
| Title | Cluster Plot | Dendrogram | e-value | e-value | e-value | Condition | Condition FDR | Condition Difference |
|---|---|---|---|---|---|---|---|---|
| Thaps_hclust_0063 |
 |
 |
9.8e-19 |
5.7e-17 |
8.2e-17 |
lowSi_TMEVA | 0.997000 | -0.0904 |
| Title | Cluster Plot | Dendrogram | e-value | e-value | e-value | Condition | Condition FDR | Condition Difference |
|---|---|---|---|---|---|---|---|---|
| Thaps_hclust_0413 |
 |
 |
0.000043 |
0.0057 |
0.67 |
lowSi_TMEVA | 0.997000 | -0.0876 |
| Title | Cluster Plot | Dendrogram | e-value | e-value | e-value | Condition | Condition FDR | Condition Difference |
|---|---|---|---|---|---|---|---|---|
| Thaps_hclust_0388 |
 |
 |
0.0000000024 |
23 |
380 |
co2_elevated_expo_arrays | 0.997000 | 0.00442 |
| Title | Cluster Plot | Dendrogram | e-value | e-value | e-value | Condition | Condition FDR | Condition Difference |
|---|---|---|---|---|---|---|---|---|
| Thaps_hclust_0480 |
 |
 |
0.18 |
1.3 |
44 |
lowSi_TMEVA | 0.997000 | -0.0876 |
| Title | Cluster Plot | Dendrogram | e-value | e-value | e-value | Condition | Condition FDR | Condition Difference |
|---|---|---|---|---|---|---|---|---|
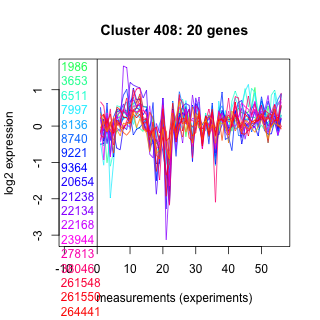
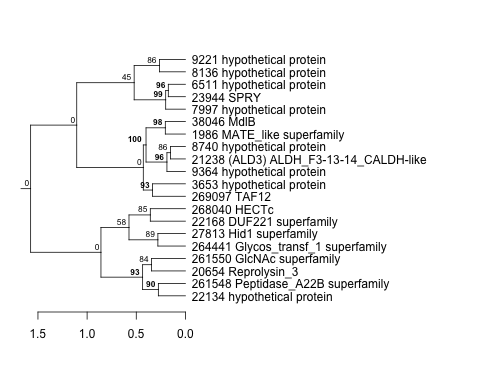
| Thaps_hclust_0408 |
 |
 |
0.3 |
4.9 |
5.3 |
lowN_TMEVA | 0.997000 | 0.00525 |
| Title | Cluster Plot | Dendrogram | e-value | e-value | e-value | Condition | Condition FDR | Condition Difference |
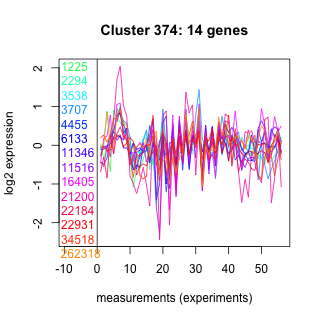
|---|---|---|---|---|---|---|---|---|
| Thaps_hclust_0374 |
 |
 |
1.4 |
19 |
50 |
lowSi_TMEVA | 0.997000 | 0.0866 |
| Title | Cluster Plot | Dendrogram | e-value | e-value | e-value | Condition | Condition FDR | Condition Difference |
|---|---|---|---|---|---|---|---|---|
| Thaps_hclust_0152 |
 |
 |
0.00015 |
0.00023 |
0.031 |
highpH_TMEVA | 0.997000 | -0.00452 |
| Title | Cluster Plot | Dendrogram | e-value | e-value | e-value | Condition | Condition FDR | Condition Difference |
|---|---|---|---|---|---|---|---|---|
| Thaps_hclust_0246 |
 |
 |
0.0000088 |
0.0034 |
3.7 |
co2_elevated_expo_arrays | 0.997000 | 0.00444 |
| Title | Cluster Plot | Dendrogram | e-value | e-value | e-value | Condition | Condition FDR | Condition Difference |
|---|---|---|---|---|---|---|---|---|
| Thaps_hclust_0333 |
 |
 |
0.00062 |
4 |
17 |
lowFe_TMEVA | 0.997000 | -0.00209 |
| Title | Cluster Plot | Dendrogram | e-value | e-value | e-value | Condition | Condition FDR | Condition Difference |
|---|---|---|---|---|---|---|---|---|
| Thaps_hclust_0491 |
 |
 |
0.35 |
17 |
52 |
lowSi_TMEVA | 0.997000 | -0.0912 |
| Title | Cluster Plot | Dendrogram | e-value | e-value | e-value | Condition | Condition FDR | Condition Difference |
|---|---|---|---|---|---|---|---|---|
| Thaps_hclust_0279 |
 |
 |
2.7 |
22 |
38 |
lowSi_TMEVA | 0.997000 | 0.0878 |
| Title | Cluster Plot | Dendrogram | e-value | e-value | e-value | Condition | Condition FDR | Condition Difference |
|---|---|---|---|---|---|---|---|---|
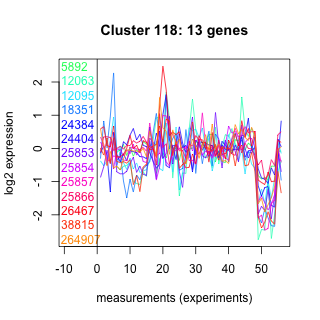
| Thaps_hclust_0118 |
 |
 |
0.0037 |
1.2 |
1.4 |
lowSi_TMEVA | 0.997000 | -0.0891 |
| Title | Cluster Plot | Dendrogram | e-value | e-value | e-value | Condition | Condition FDR | Condition Difference |
|---|---|---|---|---|---|---|---|---|
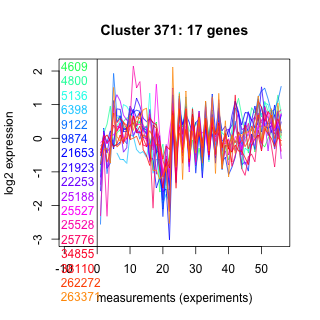
| Thaps_hclust_0371 |
 |
 |
0.0051 |
0.11 |
1.1 |
exponential_vs_stationary_24highlight | 0.997000 | -0.000745 |
| Title | Cluster Plot | Dendrogram | e-value | e-value | e-value | Condition | Condition FDR | Condition Difference |
|---|---|---|---|---|---|---|---|---|
| Thaps_hclust_0267 |
 |
 |
0.00000003 |
0.39 |
0.58 |
lowFe_TMEVA | 0.996000 | 0.00375 |
| Title | Cluster Plot | Dendrogram | e-value | e-value | e-value | Condition | Condition FDR | Condition Difference |
|---|---|---|---|---|---|---|---|---|
| Thaps_hclust_0430 |
 |
 |
0.0000088 |
0.0043 |
0.22 |
lowFe_KTKB_Day3 | 0.996000 | -0.00183 |
| Title | Cluster Plot | Dendrogram | e-value | e-value | e-value | Condition | Condition FDR | Condition Difference |
|---|---|---|---|---|---|---|---|---|
| Thaps_hclust_0123 |
 |
 |
0.000073 |
0.05 |
0.076 |
lowFe_TMEVA | 0.996000 | 0.00289 |
| Title | Cluster Plot | Dendrogram | e-value | e-value | e-value | Condition | Condition FDR | Condition Difference |
|---|---|---|---|---|---|---|---|---|
| Thaps_hclust_0066 |
 |
 |
0.0000000000000019 |
0.00000025 |
0.00000047 |
lowFe_TMEVA | 0.996000 | -0.00559 |
| Title | Cluster Plot | Dendrogram | e-value | e-value | e-value | Condition | Condition FDR | Condition Difference |
|---|---|---|---|---|---|---|---|---|
| Thaps_hclust_0134 |
 |
 |
0.00013 |
0.55 |
0.0039 |
lowFe_TMEVA | 0.996000 | 0.00299 |
| Title | Cluster Plot | Dendrogram | e-value | e-value | e-value | Condition | Condition FDR | Condition Difference |
|---|---|---|---|---|---|---|---|---|
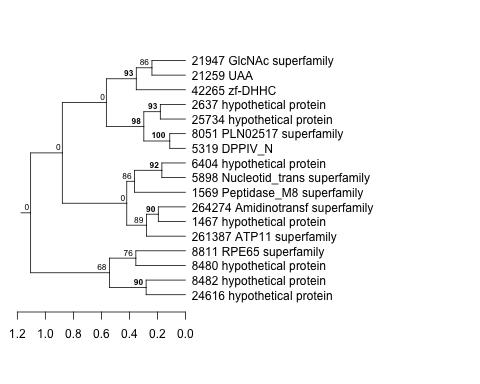
| Thaps_hclust_0119 |
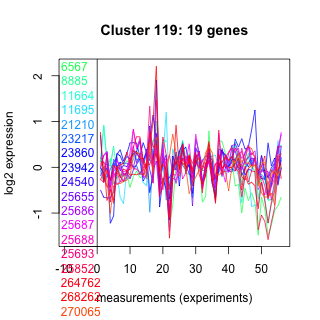 |
 |
0.000017 |
0.0015 |
0.0058 |
lowFe_TMEVA | 0.996000 | 0.00697 |
| Title | Cluster Plot | Dendrogram | e-value | e-value | e-value | Condition | Condition FDR | Condition Difference |
|---|---|---|---|---|---|---|---|---|
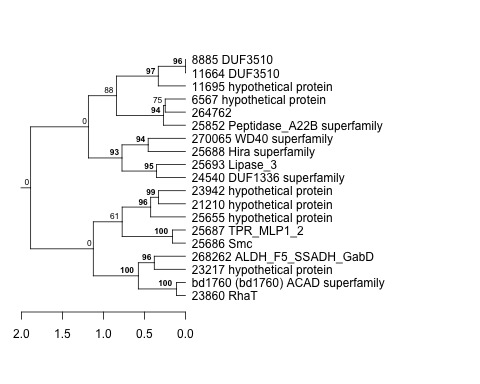
| Thaps_hclust_0401 |
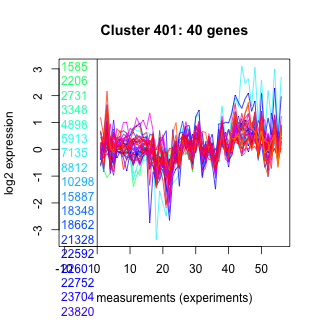 |
 |
3.5e-16 |
0.000000000077 |
0.000000012 |
lowFe_TMEVA | 0.996000 | -0.00594 |
| Title | Cluster Plot | Dendrogram | e-value | e-value | e-value | Condition | Condition FDR | Condition Difference |
|---|---|---|---|---|---|---|---|---|
| Thaps_hclust_0096 |
 |
 |
0.0000028 |
0.9 |
0.38 |
lowN_TMEVA | 0.996000 | -0.00685 |