Hierarchical Clusters
Displaying 1001 - 1100 of 7500
| Title | Cluster Plot | Dendrogram | e-value | e-value | e-value | Condition | Condition FDR | Condition Difference |
|---|---|---|---|---|---|---|---|---|
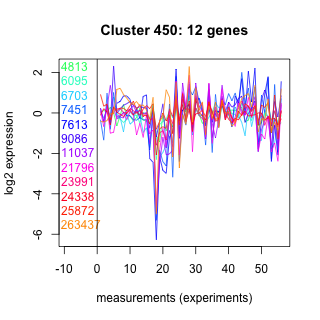
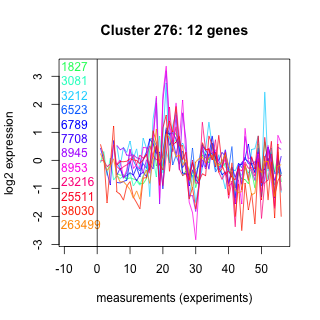
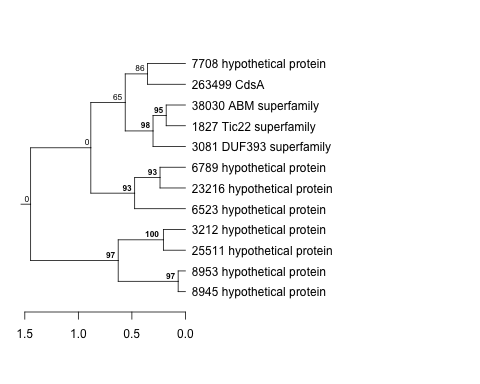
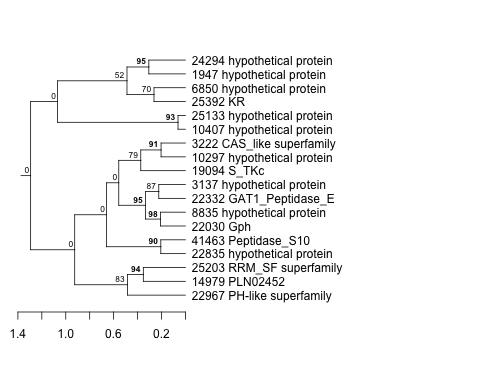
| Thaps_hclust_0450 |
 |
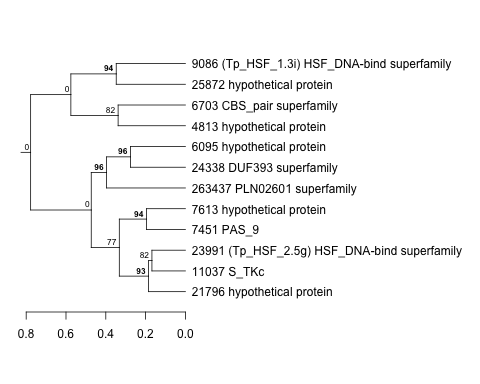 |
0.00076 |
0.024 |
0.16 |
co2_elevated_expo_arrays | 0.021800 | 0.38 |
| Title | Cluster Plot | Dendrogram | e-value | e-value | e-value | Condition | Condition FDR | Condition Difference |
|---|---|---|---|---|---|---|---|---|
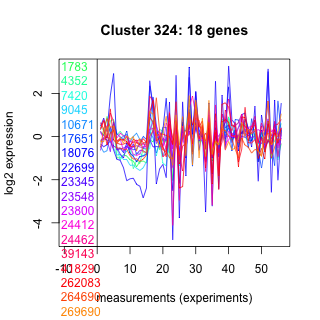
| Thaps_hclust_0324 |
 |
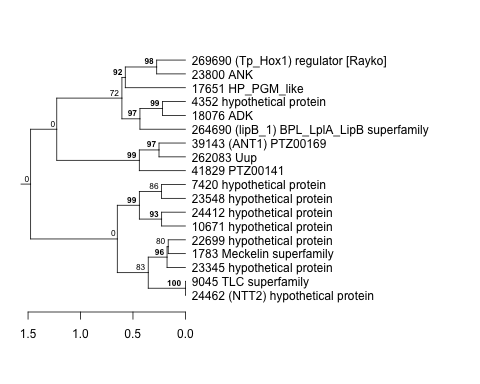 |
0.0023 |
2.4 |
5.1 |
lowtemp_TMEVA | 0.158000 | 0.38 |
| Thaps_hclust_0324 |
|
|
0.0023 |
2.4 |
5.1 |
co2_elevated_stat_arrays | 0.100000 | 0.378 |
| Title | Cluster Plot | Dendrogram | e-value | e-value | e-value | Condition | Condition FDR | Condition Difference |
|---|---|---|---|---|---|---|---|---|
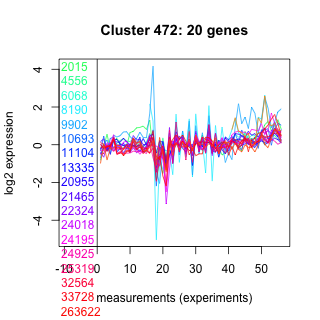
| Thaps_hclust_0472 |
 |
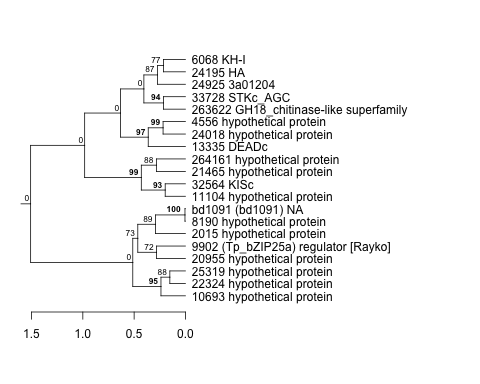 |
0.00000011 |
0.000015 |
0.00015 |
lowFe_KTKB_Day3 | 0.096700 | 0.38 |
| Title | Cluster Plot | Dendrogram | e-value | e-value | e-value | Condition | Condition FDR | Condition Difference |
|---|---|---|---|---|---|---|---|---|
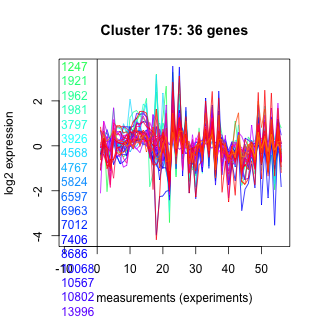
| Thaps_hclust_0175 |
 |
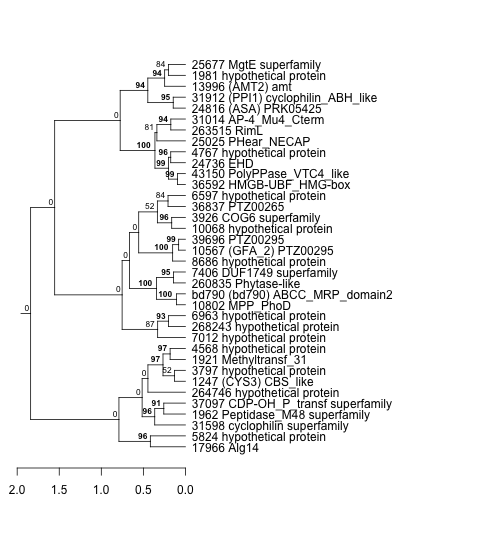 |
0.00000000000027 |
0.0000042 |
0.58 |
exponential_vs_stationary_24highlight | 0.000526 | 0.38 |
| Thaps_hclust_0175 |
|
|
0.00000000000027 |
0.0000042 |
0.58 |
lowtemp_TMEVA | 0.042100 | 0.374 |
| Title | Cluster Plot | Dendrogram | e-value | e-value | e-value | Condition | Condition FDR | Condition Difference |
|---|---|---|---|---|---|---|---|---|
| Thaps_hclust_0034 |
 |
 |
0.000015 |
0.000083 |
0.63 |
lowtemp_TMEVA | 0.136000 | 0.38 |
| Title | Cluster Plot | Dendrogram | e-value | e-value | e-value | Condition | Condition FDR | Condition Difference |
|---|---|---|---|---|---|---|---|---|
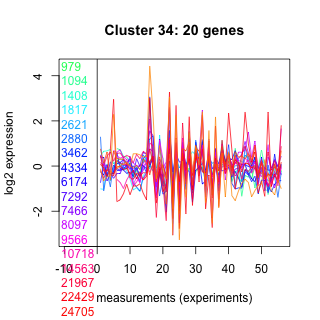
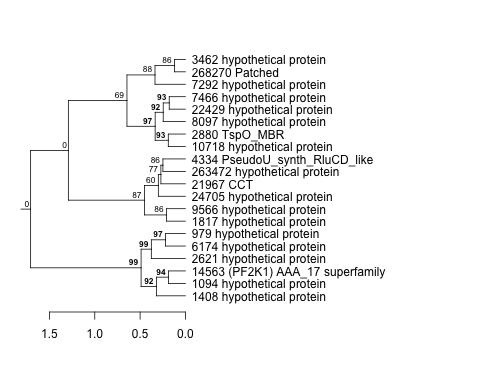
| Thaps_hclust_0316 |
 |
 |
0.14 |
2.2 |
4.4 |
lowSi_TMEVA | 0.620000 | 0.379 |
| Title | Cluster Plot | Dendrogram | e-value | e-value | e-value | Condition | Condition FDR | Condition Difference |
|---|---|---|---|---|---|---|---|---|
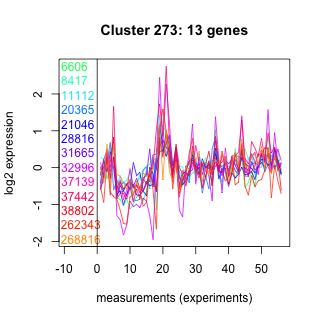
| Thaps_hclust_0273 |
 |
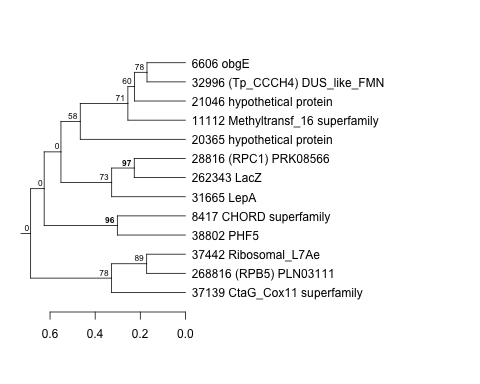 |
0.052 |
0.27 |
12 |
lowtemp_TMEVA | 0.225000 | 0.379 |
| Title | Cluster Plot | Dendrogram | e-value | e-value | e-value | Condition | Condition FDR | Condition Difference |
|---|---|---|---|---|---|---|---|---|
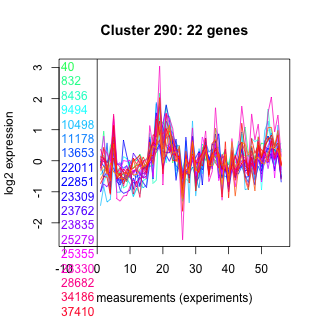
| Thaps_hclust_0290 |
 |
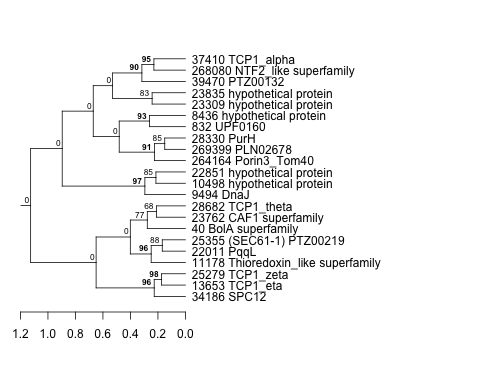 |
3e-16 |
0.014 |
0.072 |
exponential_vs_stationary_24light | 0.212000 | 0.379 |
| Title | Cluster Plot | Dendrogram | e-value | e-value | e-value | Condition | Condition FDR | Condition Difference |
|---|---|---|---|---|---|---|---|---|
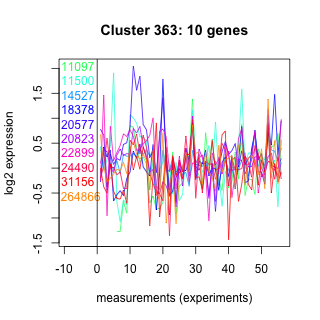
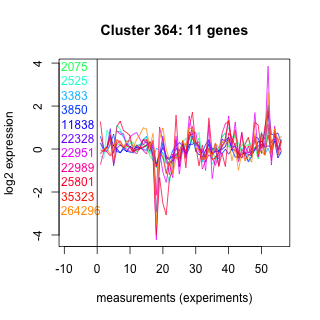
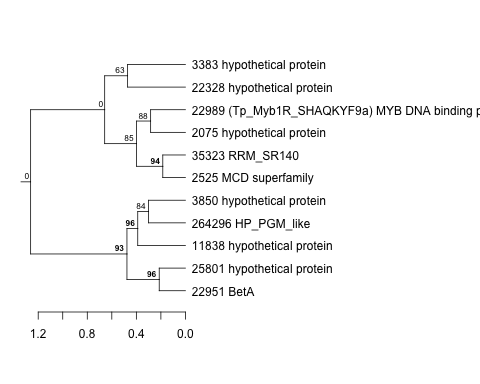
| Thaps_hclust_0363 |
 |
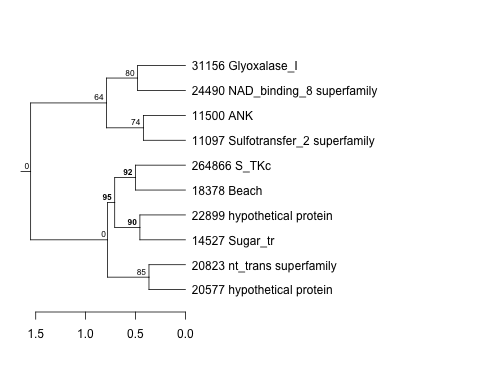 |
0.56 |
1.4 |
2.1 |
diel_light_vs_dark | 0.199000 | 0.379 |
| Title | Cluster Plot | Dendrogram | e-value | e-value | e-value | Condition | Condition FDR | Condition Difference |
|---|---|---|---|---|---|---|---|---|
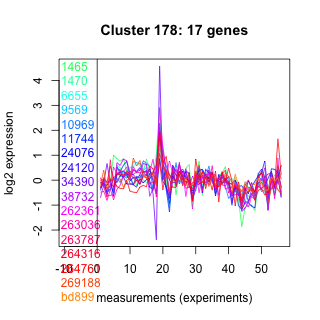
| Thaps_hclust_0178 |
 |
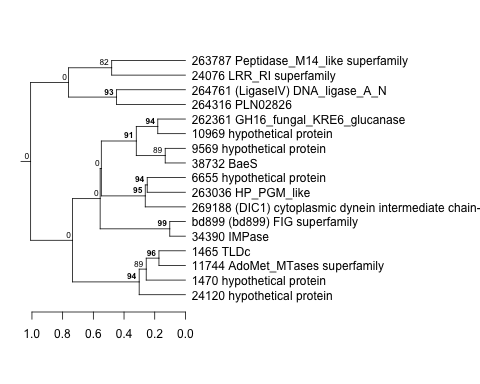 |
0.0000000019 |
0.00000047 |
0.000019 |
exponential_vs_stationary_24light | 0.269000 | 0.379 |
| Title | Cluster Plot | Dendrogram | e-value | e-value | e-value | Condition | Condition FDR | Condition Difference |
|---|---|---|---|---|---|---|---|---|
| Thaps_hclust_0343 |
 |
 |
9.7e-16 |
0.000000023 |
0.0000000024 |
BaP | 0.026900 | 0.379 |
| Title | Cluster Plot | Dendrogram | e-value | e-value | e-value | Condition | Condition FDR | Condition Difference |
|---|---|---|---|---|---|---|---|---|
| Thaps_hclust_0193 |
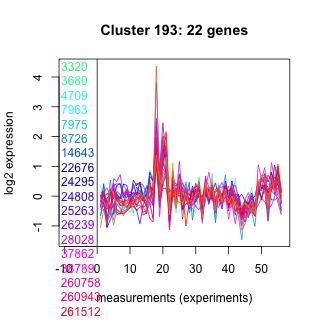 |
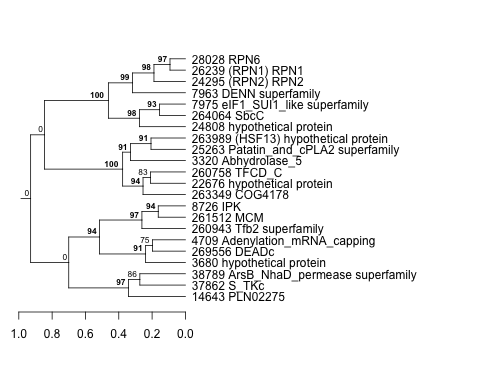 |
0.00027 |
0.013 |
6.2 |
diel_light_vs_dark | 0.043700 | 0.378 |
| Title | Cluster Plot | Dendrogram | e-value | e-value | e-value | Condition | Condition FDR | Condition Difference |
|---|---|---|---|---|---|---|---|---|
| Thaps_hclust_0481 |
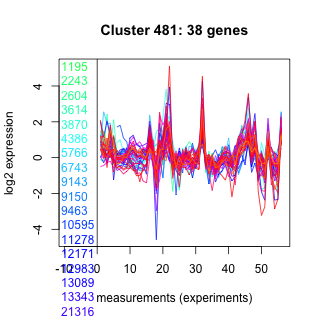 |
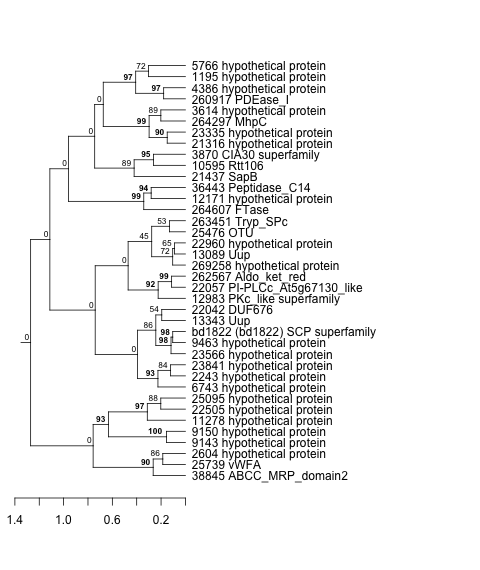 |
0.000000069 |
0.00000053 |
0.000012 |
BaP | 0.013100 | 0.377 |
| Title | Cluster Plot | Dendrogram | e-value | e-value | e-value | Condition | Condition FDR | Condition Difference |
|---|---|---|---|---|---|---|---|---|
| Thaps_hclust_0053 |
 |
 |
0.000012 |
0.000065 |
0.009 |
BaP | 0.227000 | 0.377 |
| Title | Cluster Plot | Dendrogram | e-value | e-value | e-value | Condition | Condition FDR | Condition Difference |
|---|---|---|---|---|---|---|---|---|
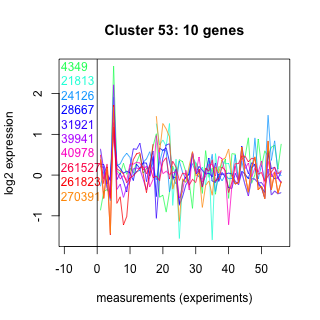
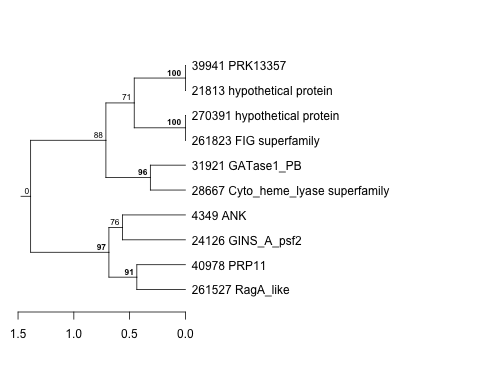
| Thaps_hclust_0378 |
 |
 |
0.0003 |
210 |
10 |
lowSi_TMEVA | 0.613000 | 0.377 |
| Thaps_hclust_0378 |
|
|
0.0003 |
210 |
10 |
lowFe_TMEVA | 0.300000 | 0.355 |
| Title | Cluster Plot | Dendrogram | e-value | e-value | e-value | Condition | Condition FDR | Condition Difference |
|---|---|---|---|---|---|---|---|---|
| Thaps_hclust_0043 |
 |
 |
3.9e-18 |
0.0000000053 |
2 |
lowFe_KTKB_Day5 | 0.001320 | 0.376 |
| Title | Cluster Plot | Dendrogram | e-value | e-value | e-value | Condition | Condition FDR | Condition Difference |
|---|---|---|---|---|---|---|---|---|
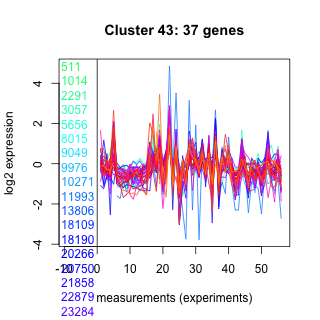
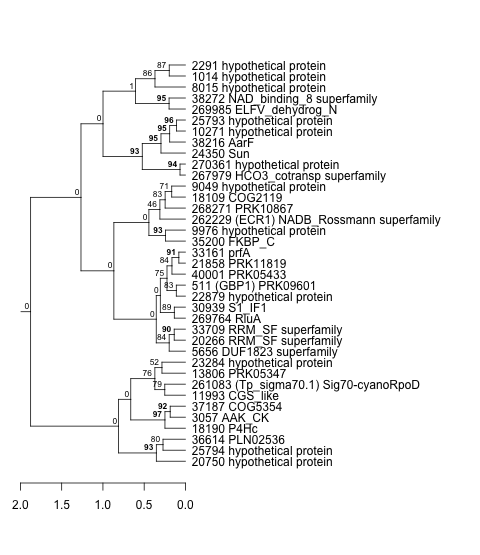
| Thaps_hclust_0466 |
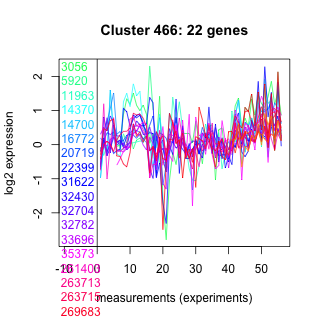 |
 |
0.0000055 |
0.000014 |
0.0017 |
lowtemp_TMEVA | 0.119000 | 0.376 |
| Title | Cluster Plot | Dendrogram | e-value | e-value | e-value | Condition | Condition FDR | Condition Difference |
|---|---|---|---|---|---|---|---|---|
| Thaps_hclust_0024 |
 |
|
2.8e-19 |
1.2e-20 |
0.00000000000043 |
co2_elevated_stat_arrays | 0.002130 | 0.376 |
| Title | Cluster Plot | Dendrogram | e-value | e-value | e-value | Condition | Condition FDR | Condition Difference |
|---|---|---|---|---|---|---|---|---|
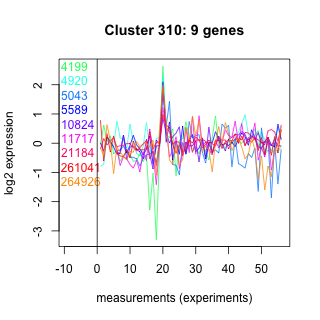
| Thaps_hclust_0310 |
 |
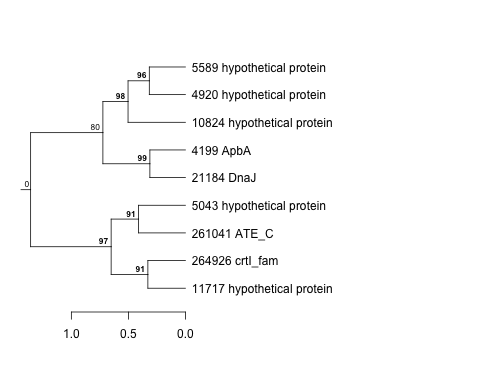 |
4.9 |
19 |
86 |
BaP | 0.254000 | 0.376 |
| Title | Cluster Plot | Dendrogram | e-value | e-value | e-value | Condition | Condition FDR | Condition Difference |
|---|---|---|---|---|---|---|---|---|
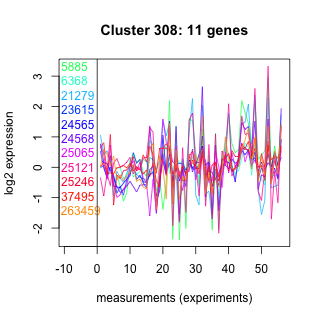
| Thaps_hclust_0308 |
 |
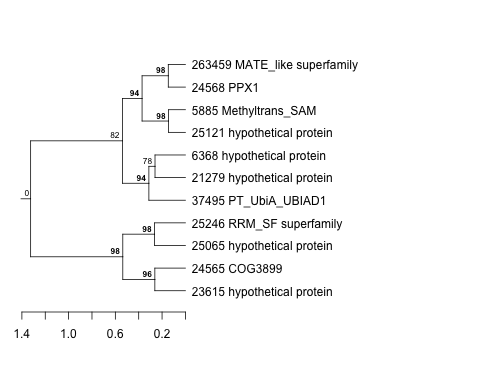 |
0.37 |
17 |
1.6 |
highpH_TMEVA | 0.072300 | 0.375 |
| Title | Cluster Plot | Dendrogram | e-value | e-value | e-value | Condition | Condition FDR | Condition Difference |
|---|---|---|---|---|---|---|---|---|
| Thaps_hclust_0322 |
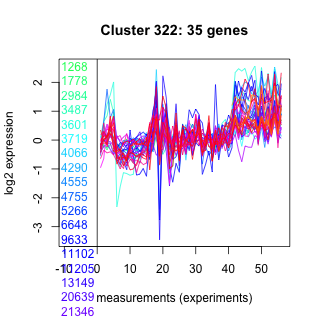 |
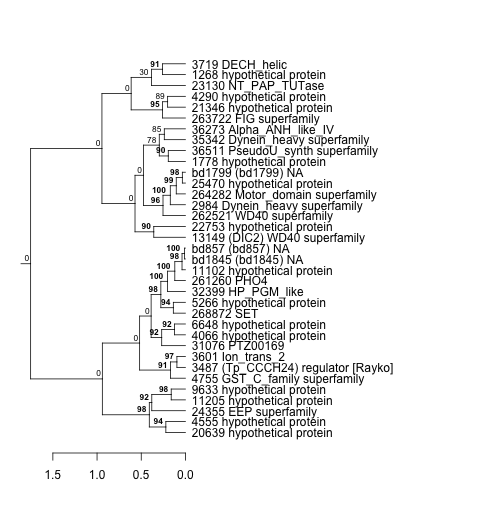 |
0.0000000021 |
0.0000000053 |
0.0051 |
lowSi_TMEVA | 0.450000 | 0.375 |
| Title | Cluster Plot | Dendrogram | e-value | e-value | e-value | Condition | Condition FDR | Condition Difference |
|---|---|---|---|---|---|---|---|---|
| Thaps_hclust_0143 |
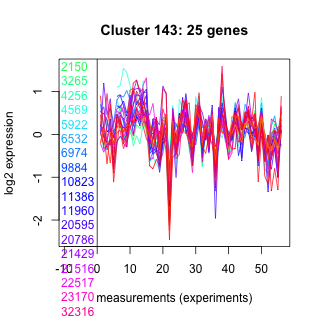 |
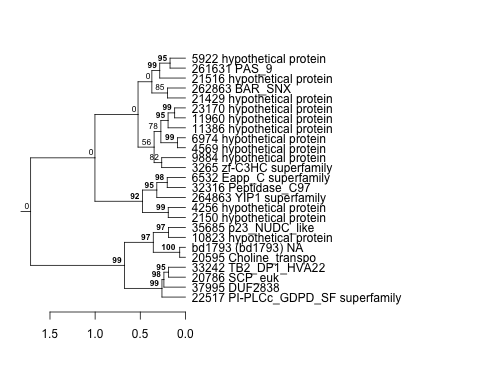 |
0.018 |
0.041 |
0.67 |
diel_light_vs_dark | 0.030500 | 0.374 |
| Title | Cluster Plot | Dendrogram | e-value | e-value | e-value | Condition | Condition FDR | Condition Difference |
|---|---|---|---|---|---|---|---|---|
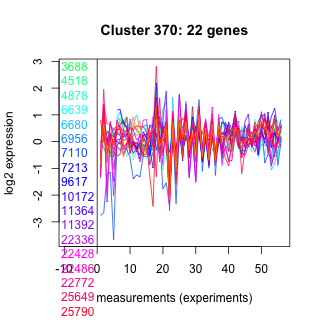
| Thaps_hclust_0370 |
 |
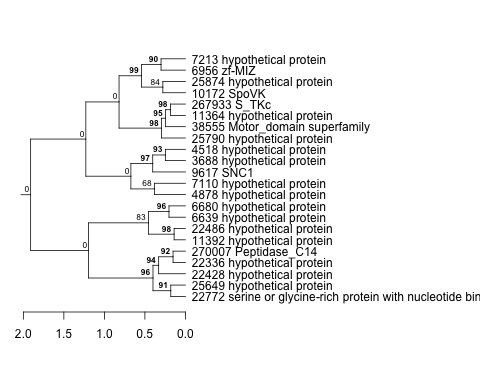 |
0.55 |
1 |
7 |
BaP | 0.055700 | 0.374 |
| Title | Cluster Plot | Dendrogram | e-value | e-value | e-value | Condition | Condition FDR | Condition Difference |
|---|---|---|---|---|---|---|---|---|
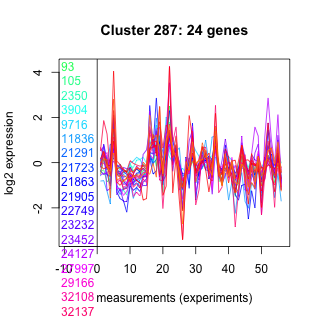
| Thaps_hclust_0287 |
 |
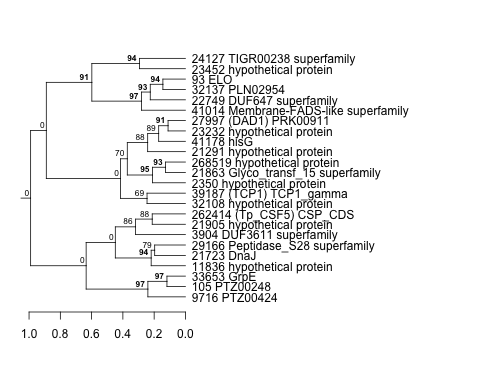 |
0.0000001 |
0.00007 |
0.003 |
diel_exponential_vs_stationary | 0.018600 | 0.374 |
| Title | Cluster Plot | Dendrogram | e-value | e-value | e-value | Condition | Condition FDR | Condition Difference |
|---|---|---|---|---|---|---|---|---|
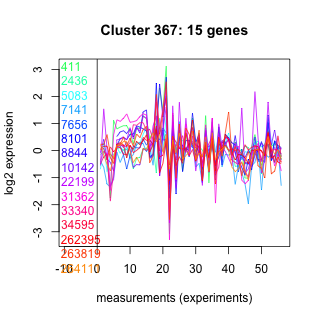
| Thaps_hclust_0367 |
 |
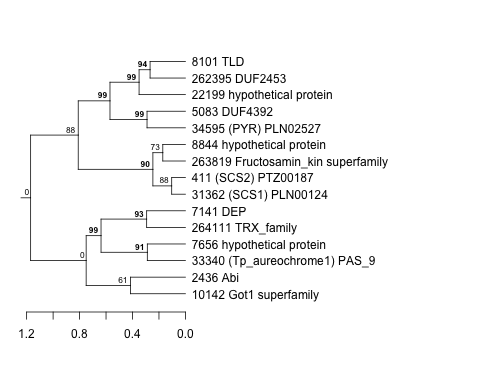 |
0.027 |
0.079 |
0.86 |
co2_elevated_stat_arrays | 0.125000 | 0.374 |
| Title | Cluster Plot | Dendrogram | e-value | e-value | e-value | Condition | Condition FDR | Condition Difference |
|---|---|---|---|---|---|---|---|---|
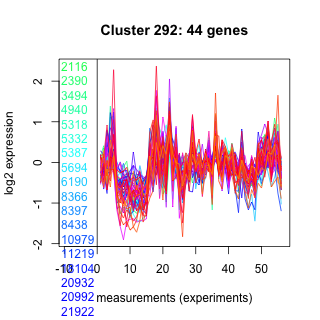
| Thaps_hclust_0292 |
 |
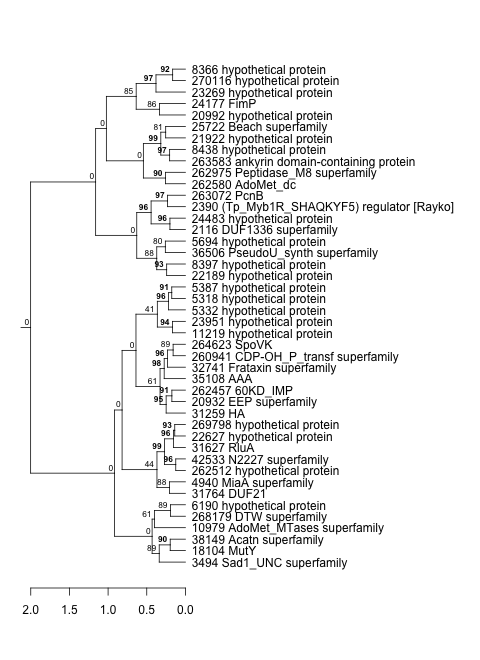 |
1.4e-30 |
0.00000000000037 |
0.0000067 |
lowtemp_TMEVA | 0.028900 | 0.373 |
| Title | Cluster Plot | Dendrogram | e-value | e-value | e-value | Condition | Condition FDR | Condition Difference |
|---|---|---|---|---|---|---|---|---|
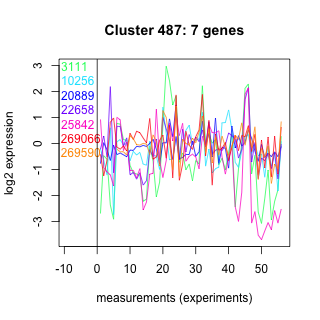
| Thaps_hclust_0487 |
 |
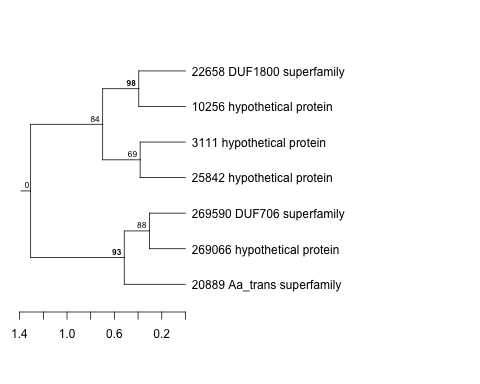 |
2.2 |
14 |
320 |
diel_exponential_vs_stationary | 0.216000 | 0.373 |
| Title | Cluster Plot | Dendrogram | e-value | e-value | e-value | Condition | Condition FDR | Condition Difference |
|---|---|---|---|---|---|---|---|---|
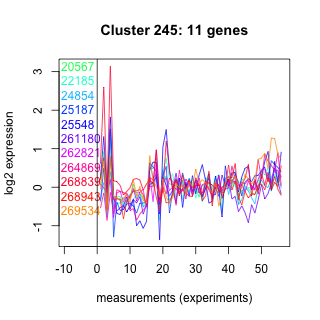
| Thaps_hclust_0245 |
 |
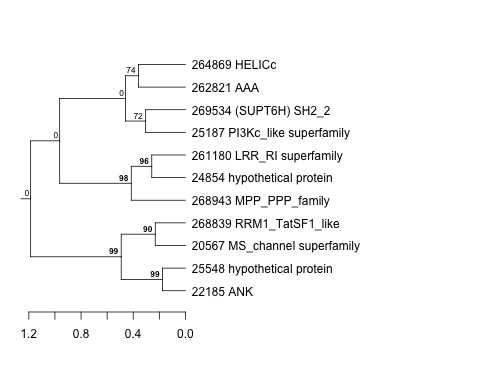 |
0.52 |
100 |
150 |
lowFe_KTKB_Day3 | 0.241000 | 0.372 |
| Title | Cluster Plot | Dendrogram | e-value | e-value | e-value | Condition | Condition FDR | Condition Difference |
|---|---|---|---|---|---|---|---|---|
| Thaps_hclust_0087 |
 |
 |
0.00000000000011 |
0.000026 |
0.028 |
lowtemp_TMEVA | 0.063900 | 0.372 |
| Title | Cluster Plot | Dendrogram | e-value | e-value | e-value | Condition | Condition FDR | Condition Difference |
|---|---|---|---|---|---|---|---|---|
| Thaps_hclust_0382 |
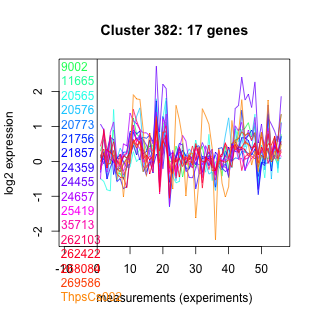 |
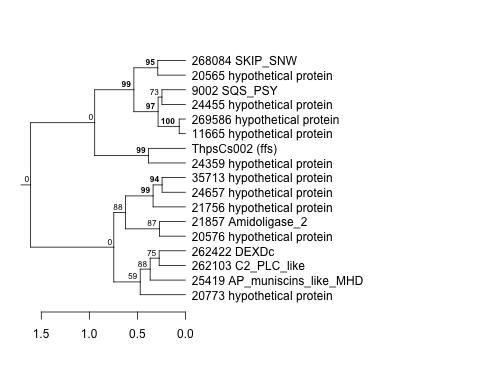 |
0.0000042 |
0.012 |
0.055 |
lowtemp_TMEVA | 0.184000 | 0.372 |
| Thaps_hclust_0382 |
|
|
0.0000042 |
0.012 |
0.055 |
lowFe_TMEVA | 0.223000 | 0.355 |
| Title | Cluster Plot | Dendrogram | e-value | e-value | e-value | Condition | Condition FDR | Condition Difference |
|---|---|---|---|---|---|---|---|---|
| Thaps_hclust_0205 |
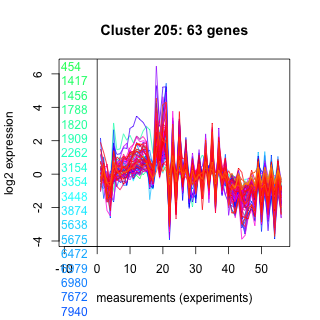 |
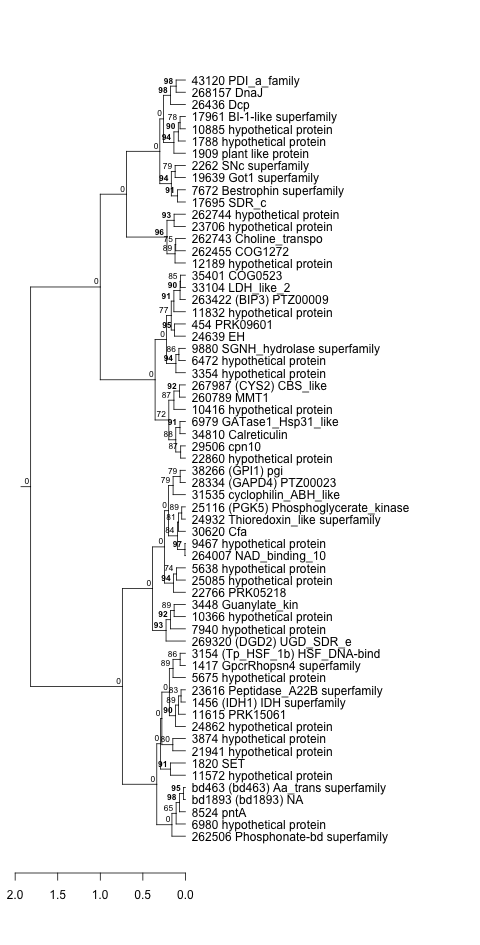 |
2.3e-23 |
7.6e-16 |
0.00000015 |
lowtemp_TMEVA | 0.012000 | 0.371 |
| Title | Cluster Plot | Dendrogram | e-value | e-value | e-value | Condition | Condition FDR | Condition Difference |
|---|---|---|---|---|---|---|---|---|
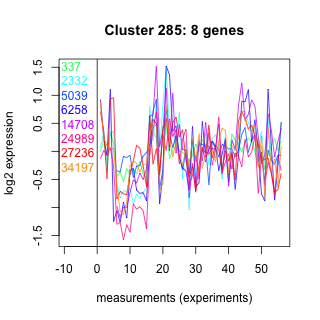
| Thaps_hclust_0285 |
 |
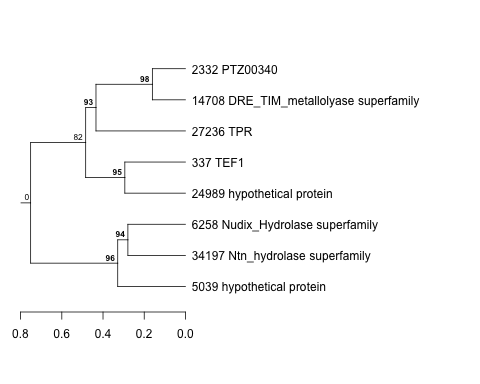 |
0.00019 |
0.057 |
5.9 |
lowFe_KTKB_Day3 | 0.334000 | 0.369 |
| Thaps_hclust_0285 |
|
|
0.00019 |
0.057 |
5.9 |
co2_elevated_stat_arrays | 0.229000 | 0.368 |
| Title | Cluster Plot | Dendrogram | e-value | e-value | e-value | Condition | Condition FDR | Condition Difference |
|---|---|---|---|---|---|---|---|---|
| Thaps_hclust_0073 |
 |
 |
0.013 |
0.043 |
210 |
exponential_vs_stationary_24highlight | 0.000926 | 0.368 |
| Title | Cluster Plot | Dendrogram | e-value | e-value | e-value | Condition | Condition FDR | Condition Difference |
|---|---|---|---|---|---|---|---|---|
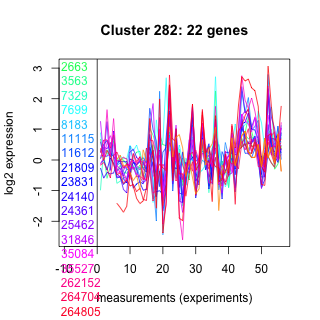
| Thaps_hclust_0282 |
 |
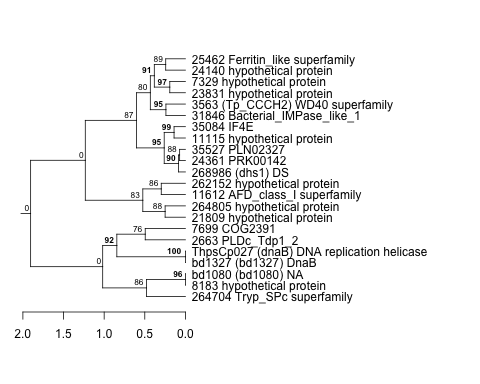 |
0.0005 |
0.0059 |
0.15 |
lowFe_KTKB_Day3 | 0.089400 | 0.368 |
| Title | Cluster Plot | Dendrogram | e-value | e-value | e-value | Condition | Condition FDR | Condition Difference |
|---|---|---|---|---|---|---|---|---|
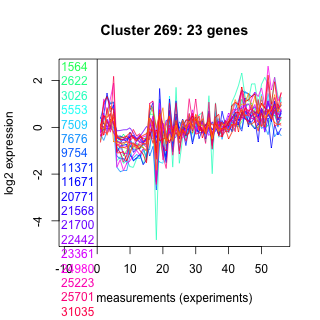
| Thaps_hclust_0269 |
 |
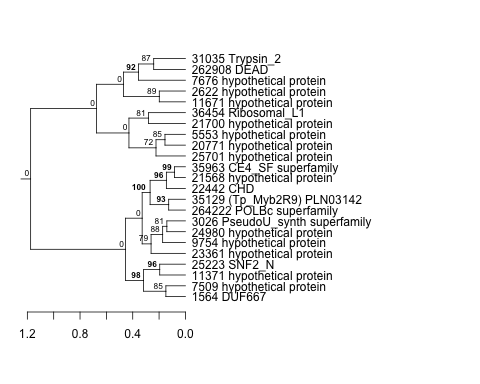 |
0.0025 |
0.032 |
0.077 |
lowN_TMEVA | 0.241000 | 0.368 |
| Title | Cluster Plot | Dendrogram | e-value | e-value | e-value | Condition | Condition FDR | Condition Difference |
|---|---|---|---|---|---|---|---|---|
| Thaps_hclust_0032 |
 |
 |
1.3e-16 |
0.00000035 |
0.00012 |
diel_exponential_vs_stationary | 0.006030 | 0.368 |
| Title | Cluster Plot | Dendrogram | e-value | e-value | e-value | Condition | Condition FDR | Condition Difference |
|---|---|---|---|---|---|---|---|---|
| Thaps_hclust_0286 |
 |
 |
0.00008 |
0.0046 |
0.0058 |
diel_exponential_vs_stationary | 0.109000 | 0.368 |
| Title | Cluster Plot | Dendrogram | e-value | e-value | e-value | Condition | Condition FDR | Condition Difference |
|---|---|---|---|---|---|---|---|---|
| Thaps_hclust_0369 |
 |
 |
0.34 |
2.4 |
5 |
lowFe_TMEVA | 0.215000 | 0.368 |
| Title | Cluster Plot | Dendrogram | e-value | e-value | e-value | Condition | Condition FDR | Condition Difference |
|---|---|---|---|---|---|---|---|---|
| Thaps_hclust_0275 |
 |
 |
Not available | Not available | Not available | exponential_vs_stationary_24highlight | 0.007200 | 0.368 |
| Title | Cluster Plot | Dendrogram | e-value | e-value | e-value | Condition | Condition FDR | Condition Difference |
|---|---|---|---|---|---|---|---|---|
| Thaps_hclust_0364 |
 |
 |
4.5 |
28 |
590 |
lowSi_TMEVA | 0.614000 | 0.367 |
| Title | Cluster Plot | Dendrogram | e-value | e-value | e-value | Condition | Condition FDR | Condition Difference |
|---|---|---|---|---|---|---|---|---|
| Thaps_hclust_0054 |
 |
 |
1.6e-17 |
0.0000000000053 |
0.000000000000024 |
lowFe_KTKB_Day5 | 0.088000 | 0.367 |
| Title | Cluster Plot | Dendrogram | e-value | e-value | e-value | Condition | Condition FDR | Condition Difference |
|---|---|---|---|---|---|---|---|---|
| Thaps_hclust_0121 |
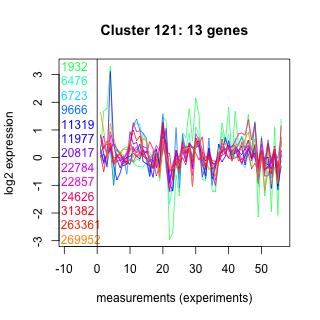 |
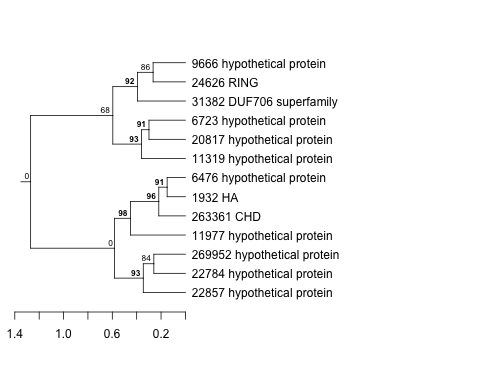 |
0.00021 |
0.77 |
30 |
lowFe_TMEVA | 0.251000 | 0.367 |
| Title | Cluster Plot | Dendrogram | e-value | e-value | e-value | Condition | Condition FDR | Condition Difference |
|---|---|---|---|---|---|---|---|---|
| Thaps_hclust_0052 |
 |
 |
1.4e-22 |
3.3e-19 |
0.0000000000037 |
diel_exponential_vs_stationary | 0.001110 | 0.366 |
| Title | Cluster Plot | Dendrogram | e-value | e-value | e-value | Condition | Condition FDR | Condition Difference |
|---|---|---|---|---|---|---|---|---|
| Thaps_hclust_0302 |
 |
 |
0.000000015 |
0.00000024 |
0.00000000039 |
highpH_TMEVA | 0.000725 | 0.366 |
| Title | Cluster Plot | Dendrogram | e-value | e-value | e-value | Condition | Condition FDR | Condition Difference |
|---|---|---|---|---|---|---|---|---|
| Thaps_hclust_0485 |
 |
 |
0.0012 |
0.0078 |
0.16 |
lowSi_TMEVA | 0.389000 | 0.366 |
| Title | Cluster Plot | Dendrogram | e-value | e-value | e-value | Condition | Condition FDR | Condition Difference |
|---|---|---|---|---|---|---|---|---|
| Thaps_hclust_0418 |
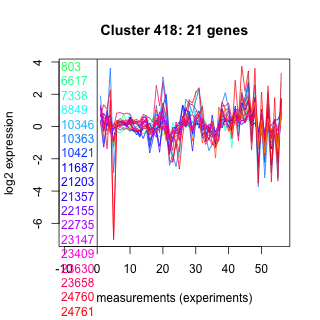 |
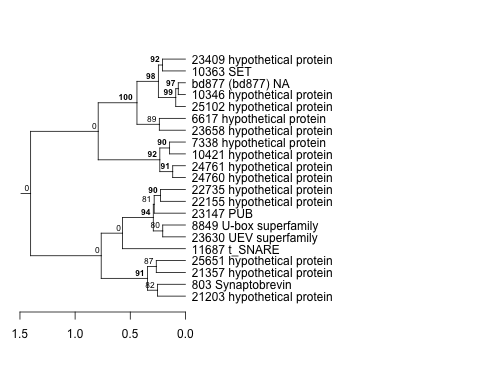 |
0.00074 |
0.0098 |
0.29 |
BaP | 0.064100 | 0.366 |
| Title | Cluster Plot | Dendrogram | e-value | e-value | e-value | Condition | Condition FDR | Condition Difference |
|---|---|---|---|---|---|---|---|---|
| Thaps_hclust_0276 |
 |
 |
0.063 |
39 |
53 |
lowtemp_TMEVA | 0.265000 | 0.366 |
| Title | Cluster Plot | Dendrogram | e-value | e-value | e-value | Condition | Condition FDR | Condition Difference |
|---|---|---|---|---|---|---|---|---|
| Thaps_hclust_0072 |
 |
 |
1.2e-22 |
1.1e-16 |
0.000000000000011 |
highpH_TMEVA | 0.131000 | 0.364 |
| Thaps_hclust_0072 |
|
|
1.2e-22 |
1.1e-16 |
0.000000000000011 |
exponential_vs_stationary_24highlight | 0.035600 | 0.354 |
| Title | Cluster Plot | Dendrogram | e-value | e-value | e-value | Condition | Condition FDR | Condition Difference |
|---|---|---|---|---|---|---|---|---|
| Thaps_hclust_0246 |
 |
 |
0.0000088 |
0.0034 |
3.7 |
BaP | 0.041300 | 0.363 |
| Title | Cluster Plot | Dendrogram | e-value | e-value | e-value | Condition | Condition FDR | Condition Difference |
|---|---|---|---|---|---|---|---|---|
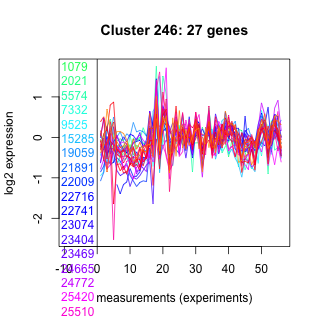
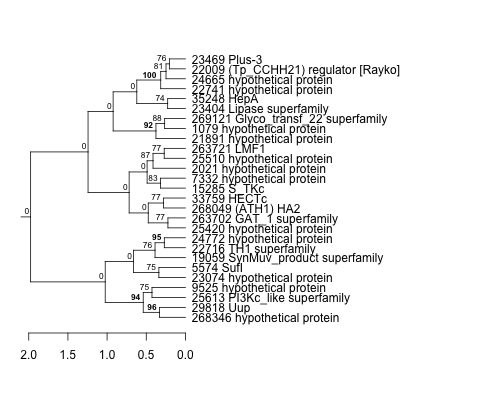
| Thaps_hclust_0454 |
 |
 |
0.0000012 |
0.00054 |
0.21 |
exponential_vs_stationary_24light | 0.206000 | 0.362 |
| Title | Cluster Plot | Dendrogram | e-value | e-value | e-value | Condition | Condition FDR | Condition Difference |
|---|---|---|---|---|---|---|---|---|
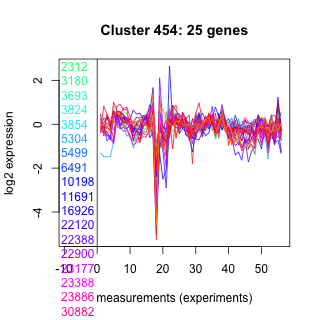
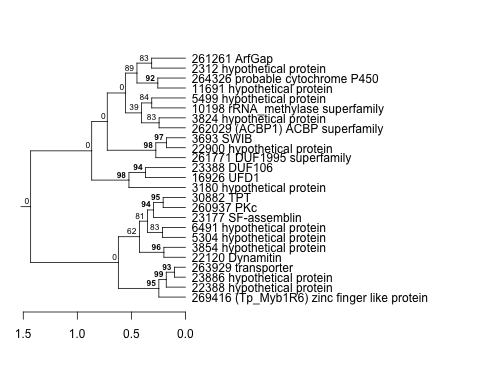
| Thaps_hclust_0456 |
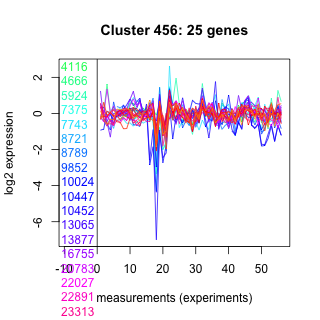 |
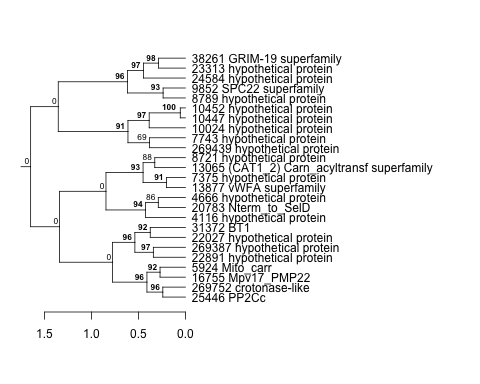 |
0.0000000043 |
0.047 |
6.5 |
diel_exponential_vs_stationary | 0.015600 | 0.362 |
| Title | Cluster Plot | Dendrogram | e-value | e-value | e-value | Condition | Condition FDR | Condition Difference |
|---|---|---|---|---|---|---|---|---|
| Thaps_hclust_0338 |
 |
 |
0.0000012 |
0.0000014 |
0.000012 |
lowFe_KTKB_Day5 | 0.015100 | 0.362 |
| Thaps_hclust_0338 |
|
|
0.0000012 |
0.0000014 |
0.000012 |
BaP | 0.029600 | 0.356 |
| Title | Cluster Plot | Dendrogram | e-value | e-value | e-value | Condition | Condition FDR | Condition Difference |
|---|---|---|---|---|---|---|---|---|
| Thaps_hclust_0224 |
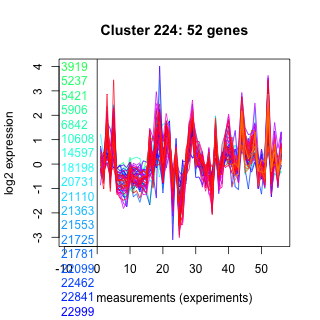 |
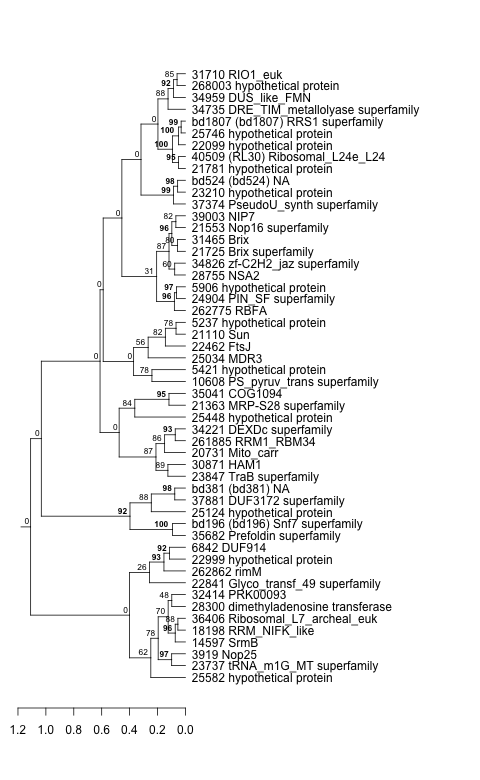 |
9.3e-28 |
1.9e-21 |
0.046 |
highlight_arrays | 0.000442 | 0.362 |
| Title | Cluster Plot | Dendrogram | e-value | e-value | e-value | Condition | Condition FDR | Condition Difference |
|---|---|---|---|---|---|---|---|---|
| Thaps_hclust_0015 |
 |
|
2.5e-25 |
7.4e-21 |
0.0000000011 |
lowtemp_TMEVA | 0.012000 | 0.362 |
| Title | Cluster Plot | Dendrogram | e-value | e-value | e-value | Condition | Condition FDR | Condition Difference |
|---|---|---|---|---|---|---|---|---|
| Thaps_hclust_0196 |
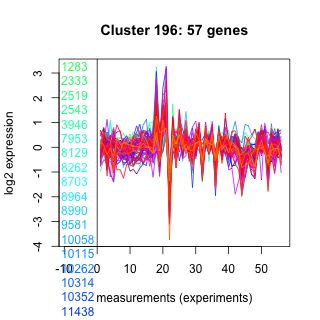 |
 |
0.0000000000000088 |
0.00000034 |
0.000017 |
exponential_vs_stationary_24light | 0.075200 | 0.362 |
| Title | Cluster Plot | Dendrogram | e-value | e-value | e-value | Condition | Condition FDR | Condition Difference |
|---|---|---|---|---|---|---|---|---|
| Thaps_hclust_0427 |
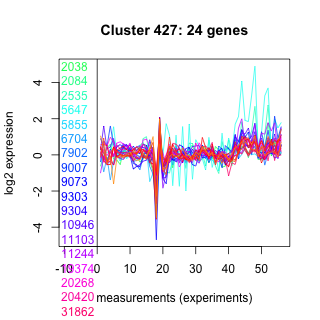 |
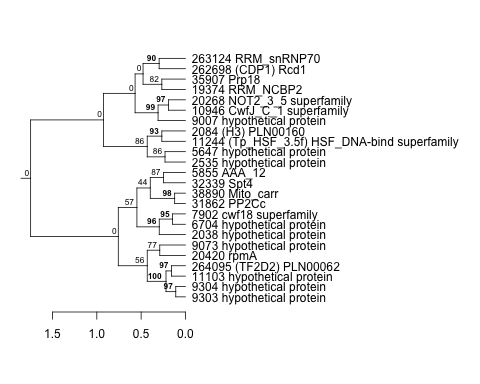 |
0.0000022 |
8.8 |
40 |
co2_elevated_stat_arrays | 0.074600 | 0.361 |
| Title | Cluster Plot | Dendrogram | e-value | e-value | e-value | Condition | Condition FDR | Condition Difference |
|---|---|---|---|---|---|---|---|---|
| Thaps_hclust_0009 |
 |
 |
0.0000023 |
0.0000027 |
0.000035 |
diel_exponential_vs_stationary | 0.005310 | 0.361 |
| Title | Cluster Plot | Dendrogram | e-value | e-value | e-value | Condition | Condition FDR | Condition Difference |
|---|---|---|---|---|---|---|---|---|
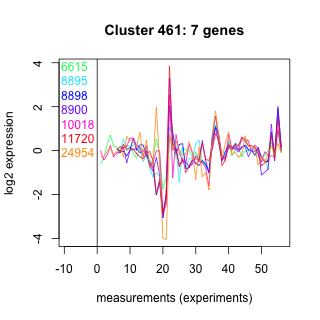
| Thaps_hclust_0461 |
 |
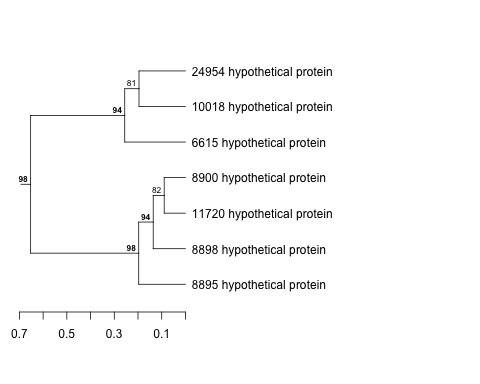 |
0.00000000082 |
0.01 |
0.079 |
lowSi_TMEVA | 0.671000 | 0.361 |
| Title | Cluster Plot | Dendrogram | e-value | e-value | e-value | Condition | Condition FDR | Condition Difference |
|---|---|---|---|---|---|---|---|---|
| Thaps_hclust_0274 |
 |
 |
0.0000064 |
0.048 |
6.7 |
co2_elevated_stat_arrays | 0.106000 | 0.36 |
| Title | Cluster Plot | Dendrogram | e-value | e-value | e-value | Condition | Condition FDR | Condition Difference |
|---|---|---|---|---|---|---|---|---|
| Thaps_hclust_0019 |
 |
 |
0.0000001 |
0.00000017 |
0.000037 |
highpH_TMEVA | 0.013400 | 0.36 |
| Title | Cluster Plot | Dendrogram | e-value | e-value | e-value | Condition | Condition FDR | Condition Difference |
|---|---|---|---|---|---|---|---|---|
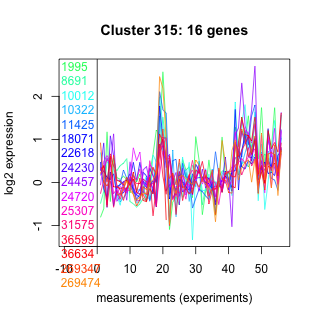
| Thaps_hclust_0315 |
 |
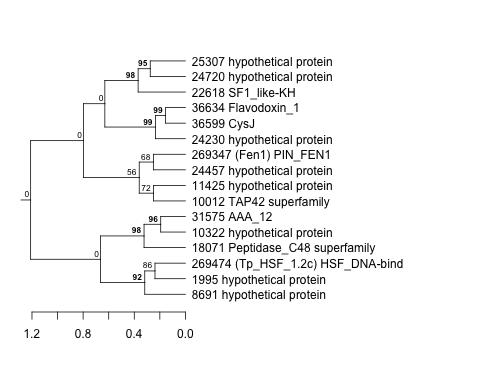 |
0.01 |
0.93 |
0.53 |
lowSi_TMEVA | 0.613000 | 0.359 |
| Title | Cluster Plot | Dendrogram | e-value | e-value | e-value | Condition | Condition FDR | Condition Difference |
|---|---|---|---|---|---|---|---|---|
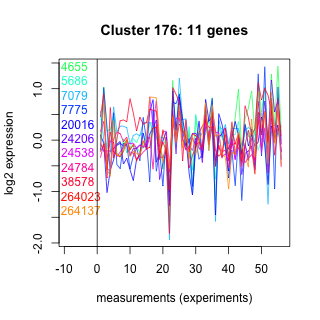
| Thaps_hclust_0176 |
 |
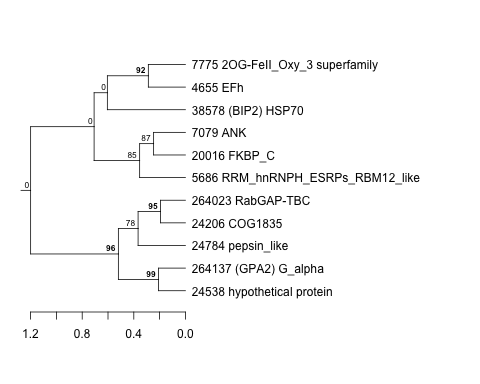 |
29 |
59 |
110 |
lowFe_TMEVA | 0.300000 | 0.357 |
| Thaps_hclust_0176 |
|
|
29 |
59 |
110 |
lowFe_KTKB_Day5 | 0.188000 | 0.353 |
| Title | Cluster Plot | Dendrogram | e-value | e-value | e-value | Condition | Condition FDR | Condition Difference |
|---|---|---|---|---|---|---|---|---|
| Thaps_hclust_0148 |
 |
 |
4.7 |
39 |
51 |
lowFe_KTKB_Day5 | 0.068400 | 0.357 |
| Title | Cluster Plot | Dendrogram | e-value | e-value | e-value | Condition | Condition FDR | Condition Difference |
|---|---|---|---|---|---|---|---|---|
| Thaps_hclust_0022 |
 |
|
1.9e-31 |
2.4e-22 |
6.4e-20 |
exponential_vs_stationary_24highlight | 0.000526 | 0.356 |
| Title | Cluster Plot | Dendrogram | e-value | e-value | e-value | Condition | Condition FDR | Condition Difference |
|---|---|---|---|---|---|---|---|---|
| Thaps_hclust_0036 |
 |
 |
0.0000003 |
0.00016 |
110 |
diel_exponential_vs_stationary | 0.009270 | 0.355 |
| Title | Cluster Plot | Dendrogram | e-value | e-value | e-value | Condition | Condition FDR | Condition Difference |
|---|---|---|---|---|---|---|---|---|
| Thaps_hclust_0280 |
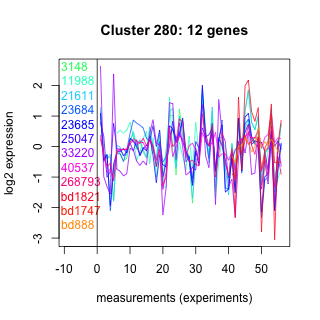 |
 |
0.75 |
0.64 |
81 |
highlight_arrays | 0.071500 | 0.354 |
| Title | Cluster Plot | Dendrogram | e-value | e-value | e-value | Condition | Condition FDR | Condition Difference |
|---|---|---|---|---|---|---|---|---|
| Thaps_hclust_0119 |
 |
 |
0.000017 |
0.0015 |
0.0058 |
lowFe_KTKB_Day3 | 0.141000 | 0.354 |
| Thaps_hclust_0119 |
|
|
0.000017 |
0.0015 |
0.0058 |
highlight_arrays | 0.026800 | 0.349 |
| Title | Cluster Plot | Dendrogram | e-value | e-value | e-value | Condition | Condition FDR | Condition Difference |
|---|---|---|---|---|---|---|---|---|
| Thaps_hclust_0372 |
 |
 |
0.0016 |
0.064 |
18 |
lowtemp_TMEVA | 0.206000 | 0.354 |
| Thaps_hclust_0372 |
|
|
0.0016 |
0.064 |
18 |
exponential_vs_stationary_24light | 0.318000 | 0.349 |
| Title | Cluster Plot | Dendrogram | e-value | e-value | e-value | Condition | Condition FDR | Condition Difference |
|---|---|---|---|---|---|---|---|---|
| Thaps_hclust_0434 |
 |
 |
0.011 |
17 |
57 |
highlight_arrays | 0.129000 | 0.354 |
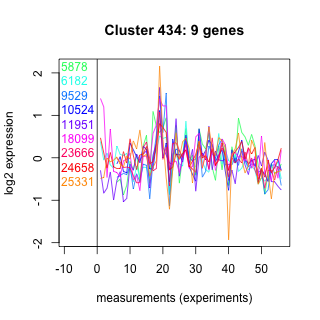
| Title | Cluster Plot | Dendrogram | e-value | e-value | e-value | Condition | Condition FDR | Condition Difference |
|---|---|---|---|---|---|---|---|---|
| Thaps_hclust_0334 |
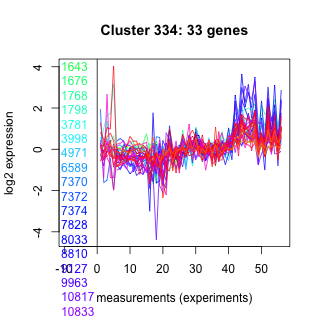 |
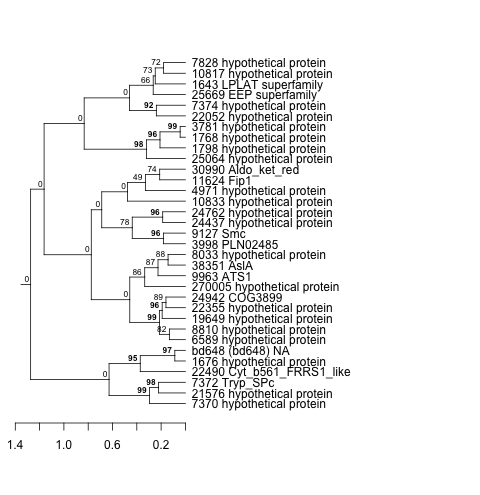 |
0.51 |
0.00047 |
0.25 |
highlight_arrays | 0.002540 | 0.353 |
| Title | Cluster Plot | Dendrogram | e-value | e-value | e-value | Condition | Condition FDR | Condition Difference |
|---|---|---|---|---|---|---|---|---|
| Thaps_hclust_0309 |
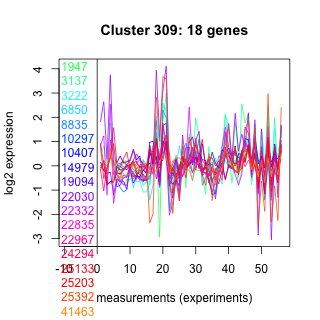 |
 |
0.0000055 |
0.015 |
1.1 |
highlight_arrays | 0.029800 | 0.353 |
| Title | Cluster Plot | Dendrogram | e-value | e-value | e-value | Condition | Condition FDR | Condition Difference |
|---|---|---|---|---|---|---|---|---|
| Thaps_hclust_0133 |
 |
 |
0.95 |
2.2 |
2.4 |
lowSi_TMEVA | 0.557000 | 0.352 |
| Title | Cluster Plot | Dendrogram | e-value | e-value | e-value | Condition | Condition FDR | Condition Difference |
|---|---|---|---|---|---|---|---|---|
| Thaps_hclust_0321 |
 |
 |
0.000000086 |
0.0000000042 |
0.0000028 |
lowN_TMEVA | 0.209000 | 0.352 |
| Title | Cluster Plot | Dendrogram | e-value | e-value | e-value | Condition | Condition FDR | Condition Difference |
|---|---|---|---|---|---|---|---|---|
| Thaps_hclust_0025 |
 |
 |
0.14 |
0.45 |
4.6 |
diel_exponential_vs_stationary | 0.114000 | 0.351 |
| Title | Cluster Plot | Dendrogram | e-value | e-value | e-value | Condition | Condition FDR | Condition Difference |
|---|---|---|---|---|---|---|---|---|
| Thaps_hclust_0109 |
 |
 |
17 |
32 |
5.5 |
lowFe_KTKB_Day5 | 0.179000 | 0.351 |
| Title | Cluster Plot | Dendrogram | e-value | e-value | e-value | Condition | Condition FDR | Condition Difference |
|---|---|---|---|---|---|---|---|---|
| Thaps_hclust_0040 |
 |
 |
1.8e-29 |
0.000000000042 |
0.00000000063 |
exponential_vs_stationary_24light | 0.191000 | 0.35 |
| Thaps_hclust_0040 |
|
|
1.8e-29 |
0.000000000042 |
0.00000000063 |
exponential_vs_stationary_24highlight | 0.000526 | 0.348 |
| Title | Cluster Plot | Dendrogram | e-value | e-value | e-value | Condition | Condition FDR | Condition Difference |
|---|---|---|---|---|---|---|---|---|
| Thaps_hclust_0389 |
 |
 |
0.00000008 |
0.00077 |
340 |
co2_elevated_stat_arrays | 0.090200 | 0.349 |
| Title | Cluster Plot | Dendrogram | e-value | e-value | e-value | Condition | Condition FDR | Condition Difference |
|---|---|---|---|---|---|---|---|---|
| Thaps_hclust_0071 |
 |
 |
0.0000019 |
0.0000028 |
0.00008 |
co2_elevated_expo_arrays | 0.002630 | 0.349 |
| Title | Cluster Plot | Dendrogram | e-value | e-value | e-value | Condition | Condition FDR | Condition Difference |
|---|---|---|---|---|---|---|---|---|
| Thaps_hclust_0004 |
 |
 |
0.000000074 |
0.0000031 |
0.0000044 |
co2_elevated_expo_arrays | 0.001390 | 0.349 |
| Title | Cluster Plot | Dendrogram | e-value | e-value | e-value | Condition | Condition FDR | Condition Difference |
|---|---|---|---|---|---|---|---|---|
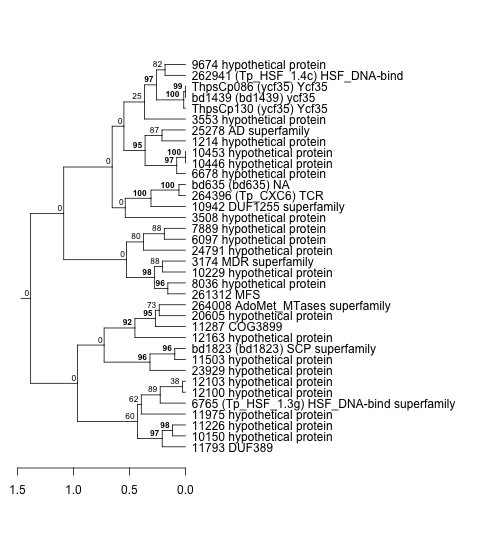
| Thaps_hclust_0394 |
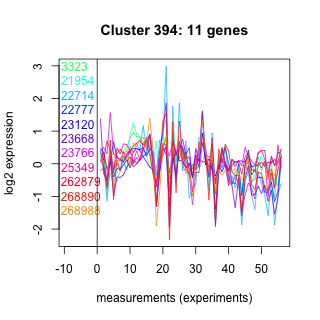 |
 |
0.044 |
0.46 |
610 |
lowSi_TMEVA | 0.639000 | 0.349 |
| Title | Cluster Plot | Dendrogram | e-value | e-value | e-value | Condition | Condition FDR | Condition Difference |
|---|---|---|---|---|---|---|---|---|
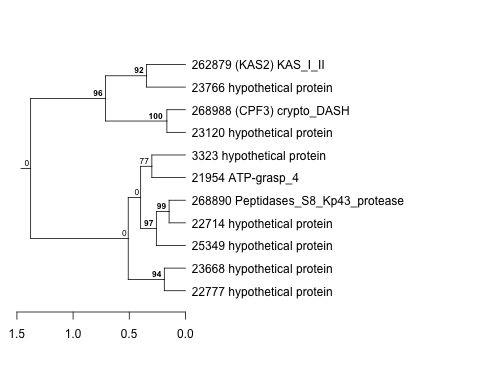
| Thaps_hclust_0442 |
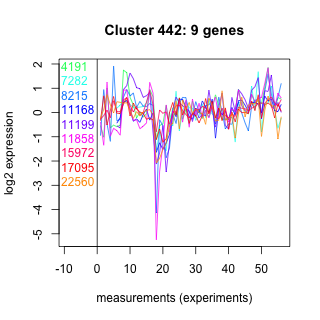 |
 |
0.045 |
2.3 |
2.8 |
lowN_TMEVA | 0.436000 | 0.349 |
| Title | Cluster Plot | Dendrogram | e-value | e-value | e-value | Condition | Condition FDR | Condition Difference |
|---|---|---|---|---|---|---|---|---|
| Thaps_hclust_0118 |
 |
 |
0.0037 |
1.2 |
1.4 |
lowtemp_TMEVA | 0.263000 | 0.349 |
| Title | Cluster Plot | Dendrogram | e-value | e-value | e-value | Condition | Condition FDR | Condition Difference |
|---|---|---|---|---|---|---|---|---|
| Thaps_hclust_0048 |
 |
 |
4.8e-17 |
0.000000018 |
0.0000097 |
exponential_vs_stationary_24highlight | 0.000526 | 0.349 |
| Title | Cluster Plot | Dendrogram | e-value | e-value | e-value | Condition | Condition FDR | Condition Difference |
|---|---|---|---|---|---|---|---|---|
| Thaps_hclust_0238 |
 |
 |
0.0018 |
0.095 |
0.069 |
lowtemp_TMEVA | 0.215000 | 0.348 |
| Title | Cluster Plot | Dendrogram | e-value | e-value | e-value | Condition | Condition FDR | Condition Difference |
|---|---|---|---|---|---|---|---|---|
| Thaps_hclust_0202 |
 |
 |
0.0064 |
0.023 |
0.32 |
highpH_TMEVA | 0.194000 | 0.348 |
| Title | Cluster Plot | Dendrogram | e-value | e-value | e-value | Condition | Condition FDR | Condition Difference |
|---|---|---|---|---|---|---|---|---|
| Thaps_hclust_0183 |
 |
 |
0.000026 |
0.000017 |
0.00004 |
diel_exponential_vs_stationary | 0.300000 | 0.348 |
| Title | Cluster Plot | Dendrogram | e-value | e-value | e-value | Condition | Condition FDR | Condition Difference |
|---|---|---|---|---|---|---|---|---|
| Thaps_hclust_0209 |
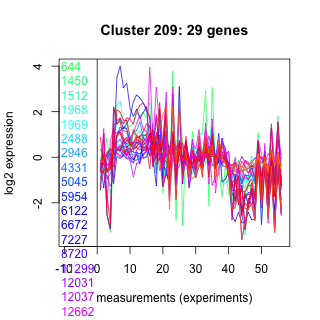 |
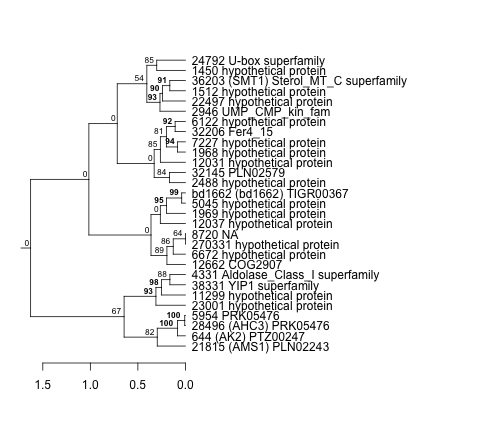 |
1.2e-16 |
0.00011 |
0.000027 |
lowtemp_TMEVA | 0.102000 | 0.348 |
| Title | Cluster Plot | Dendrogram | e-value | e-value | e-value | Condition | Condition FDR | Condition Difference |
|---|---|---|---|---|---|---|---|---|
| Thaps_hclust_0356 |
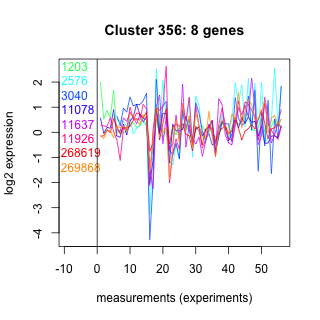 |
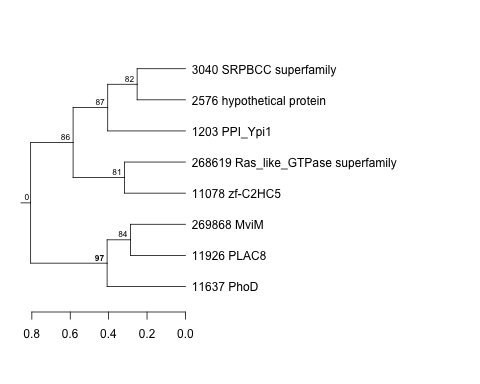 |
2.1 |
41 |
71 |
highlight_arrays | 0.153000 | 0.348 |
| Title | Cluster Plot | Dendrogram | e-value | e-value | e-value | Condition | Condition FDR | Condition Difference |
|---|---|---|---|---|---|---|---|---|
| Thaps_hclust_0251 |
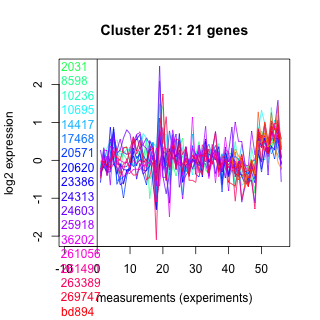 |
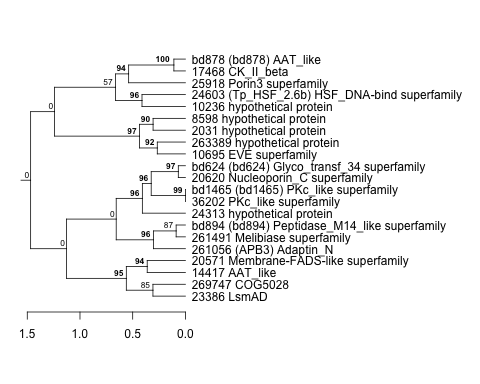 |
0.027 |
0.025 |
9.3 |
lowtemp_TMEVA | 0.175000 | 0.347 |