Hierarchical Clusters
Displaying 1401 - 1500 of 7500
| Title | Cluster Plot | Dendrogram | e-value | e-value | e-value | Condition | Condition FDR | Condition Difference |
|---|---|---|---|---|---|---|---|---|
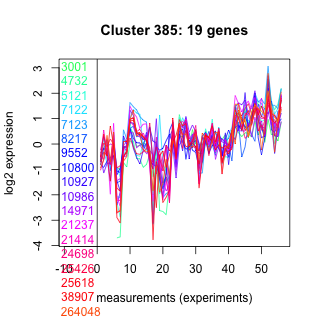
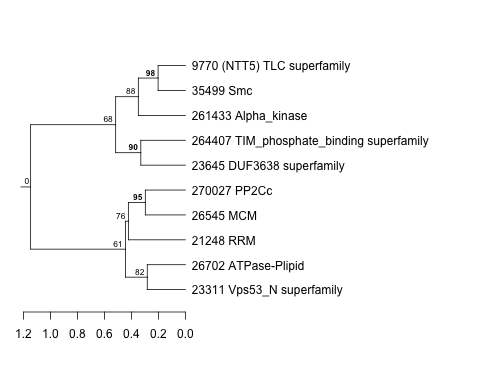
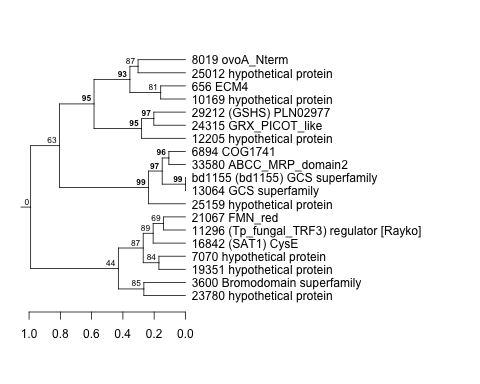
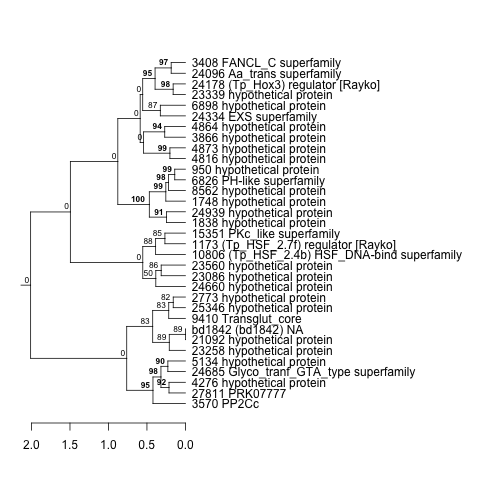
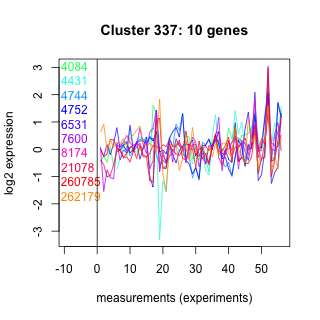
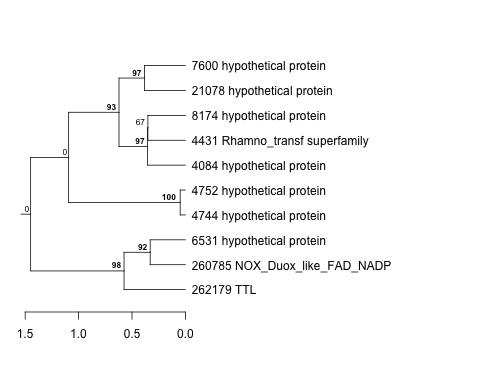
| Thaps_hclust_0385 |
 |
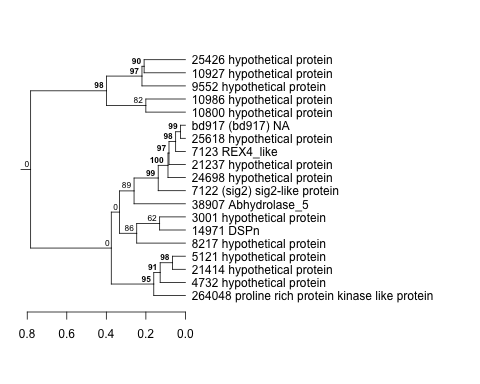 |
0.000029 |
2.1 |
2.2 |
exponential_vs_stationary_24light | 0.294000 | -0.343 |
| Title | Cluster Plot | Dendrogram | e-value | e-value | e-value | Condition | Condition FDR | Condition Difference |
|---|---|---|---|---|---|---|---|---|
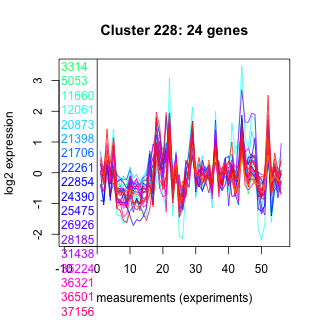
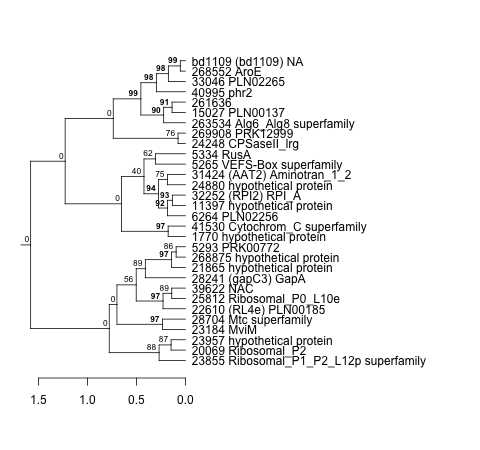
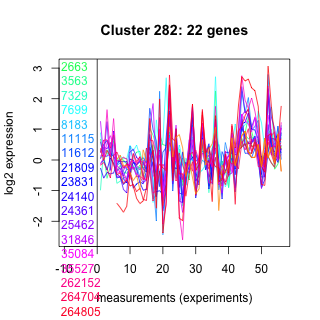
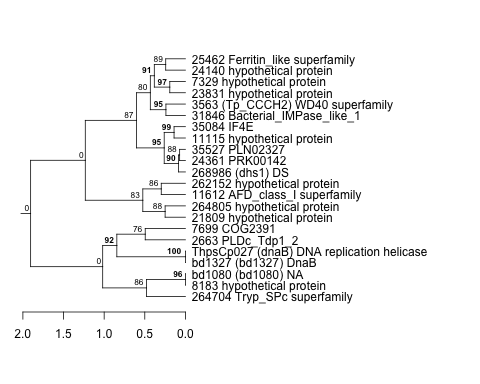
| Thaps_hclust_0228 |
 |
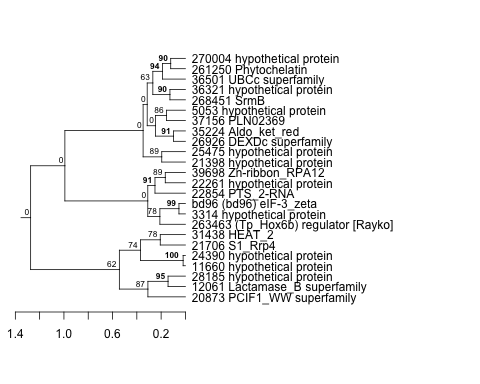 |
0.00000000000028 |
0.0027 |
0.016 |
lowFe_TMEVA | 0.177000 | -0.343 |
| Title | Cluster Plot | Dendrogram | e-value | e-value | e-value | Condition | Condition FDR | Condition Difference |
|---|---|---|---|---|---|---|---|---|
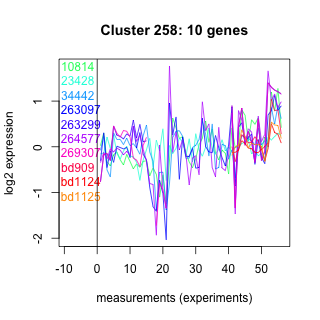
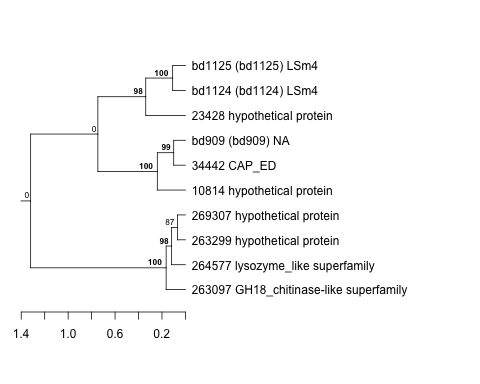
| Thaps_hclust_0258 |
 |
 |
0.027 |
0.021 |
0.036 |
highpH_TMEVA | 0.116000 | -0.342 |
| Title | Cluster Plot | Dendrogram | e-value | e-value | e-value | Condition | Condition FDR | Condition Difference |
|---|---|---|---|---|---|---|---|---|
| Thaps_hclust_0154 |
 |
 |
0.00015 |
0.0049 |
0.29 |
highlight_arrays | 0.024100 | -0.342 |
| Title | Cluster Plot | Dendrogram | e-value | e-value | e-value | Condition | Condition FDR | Condition Difference |
|---|---|---|---|---|---|---|---|---|
| Thaps_hclust_0011 |
 |
 |
0.000023 |
10 |
1.3 |
lowN_TMEVA | 0.335000 | -0.342 |
| Title | Cluster Plot | Dendrogram | e-value | e-value | e-value | Condition | Condition FDR | Condition Difference |
|---|---|---|---|---|---|---|---|---|
| Thaps_hclust_0021 |
 |
 |
0.00000000002 |
0.0000088 |
0.0012 |
lowN_TMEVA | 0.193000 | -0.342 |
| Title | Cluster Plot | Dendrogram | e-value | e-value | e-value | Condition | Condition FDR | Condition Difference |
|---|---|---|---|---|---|---|---|---|
| Thaps_hclust_0156 |
 |
 |
0.00054 |
0.00071 |
0.0013 |
lowFe_KTKB_Day3 | 0.070400 | -0.341 |
| Title | Cluster Plot | Dendrogram | e-value | e-value | e-value | Condition | Condition FDR | Condition Difference |
|---|---|---|---|---|---|---|---|---|
| Thaps_hclust_0096 |
 |
 |
0.0000028 |
0.9 |
0.38 |
highpH_TMEVA | 0.006190 | -0.341 |
| Title | Cluster Plot | Dendrogram | e-value | e-value | e-value | Condition | Condition FDR | Condition Difference |
|---|---|---|---|---|---|---|---|---|
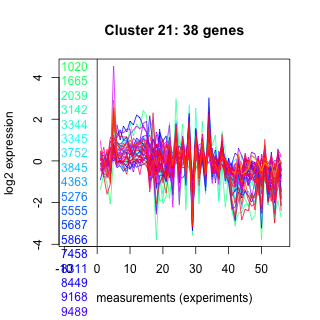
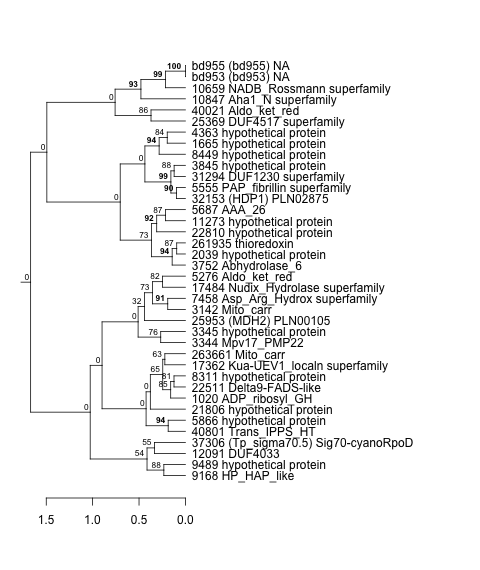
| Thaps_hclust_0292 |
 |
 |
1.4e-30 |
0.00000000000037 |
0.0000067 |
highlight_arrays | 0.000442 | -0.341 |
| Title | Cluster Plot | Dendrogram | e-value | e-value | e-value | Condition | Condition FDR | Condition Difference |
|---|---|---|---|---|---|---|---|---|
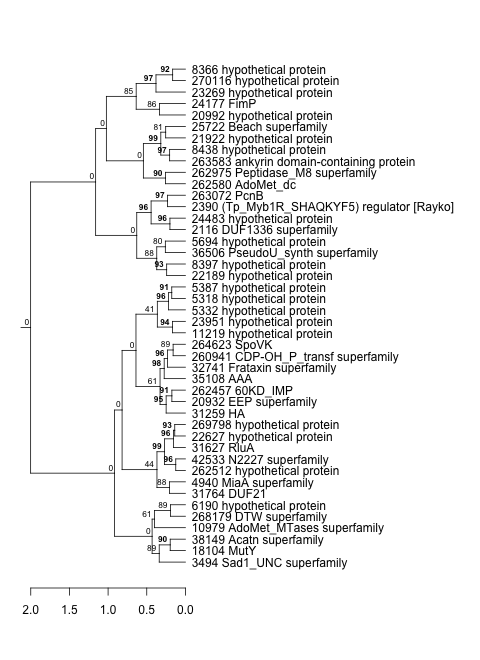
| Thaps_hclust_0368 |
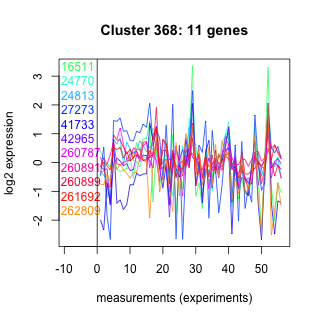 |
 |
0.0078 |
2.5 |
3.1 |
lowFe_TMEVA | 0.316000 | -0.341 |
| Title | Cluster Plot | Dendrogram | e-value | e-value | e-value | Condition | Condition FDR | Condition Difference |
|---|---|---|---|---|---|---|---|---|
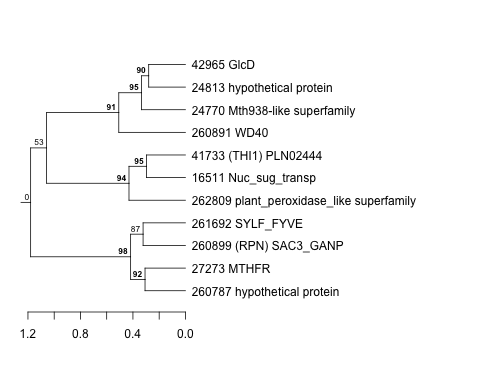
| Thaps_hclust_0488 |
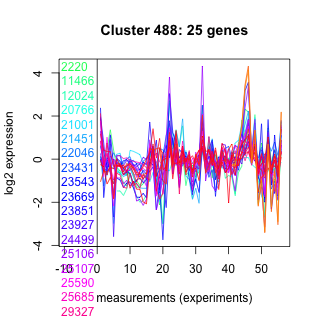 |
 |
0.15 |
0.012 |
0.2 |
lowFe_TMEVA | 0.160000 | -0.34 |
| Thaps_hclust_0488 |
|
|
0.15 |
0.012 |
0.2 |
co2_elevated_expo_arrays | 0.001390 | -0.337 |
| Title | Cluster Plot | Dendrogram | e-value | e-value | e-value | Condition | Condition FDR | Condition Difference |
|---|---|---|---|---|---|---|---|---|
| Thaps_hclust_0253 |
 |
 |
1.5 |
61 |
370 |
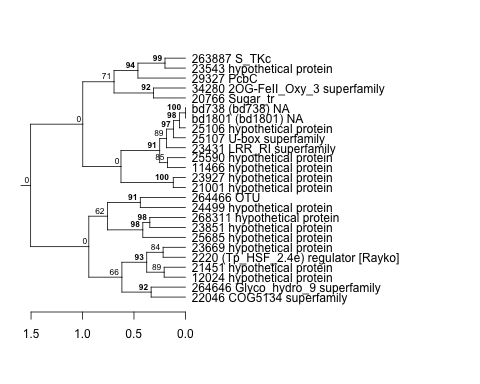
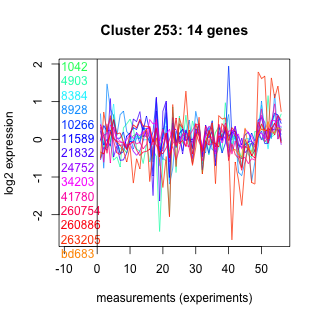
lowFe_KTKB_Day5 | 0.167000 | -0.34 |
| Title | Cluster Plot | Dendrogram | e-value | e-value | e-value | Condition | Condition FDR | Condition Difference |
|---|---|---|---|---|---|---|---|---|
| Thaps_hclust_0163 |
 |
 |
2.5 |
63 |
210 |
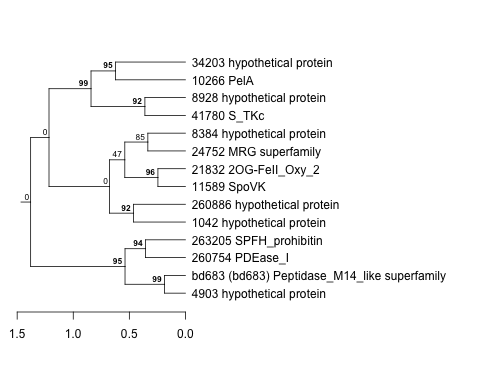
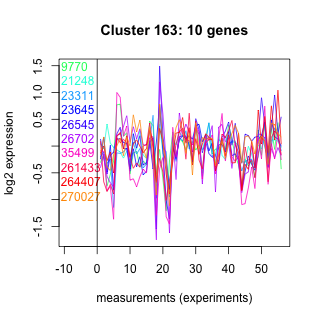
highlight_arrays | 0.118000 | -0.34 |
| Title | Cluster Plot | Dendrogram | e-value | e-value | e-value | Condition | Condition FDR | Condition Difference |
|---|---|---|---|---|---|---|---|---|
| Thaps_hclust_0094 |
 |
 |
0.0000000025 |
0.000014 |
0.0000045 |
diel_exponential_vs_stationary | 0.002970 | -0.34 |
| Title | Cluster Plot | Dendrogram | e-value | e-value | e-value | Condition | Condition FDR | Condition Difference |
|---|---|---|---|---|---|---|---|---|
| Thaps_hclust_0150 |
 |
 |
0.16 |
0.73 |
6.8 |
co2_elevated_stat_arrays | 0.178000 | -0.339 |
| Title | Cluster Plot | Dendrogram | e-value | e-value | e-value | Condition | Condition FDR | Condition Difference |
|---|---|---|---|---|---|---|---|---|
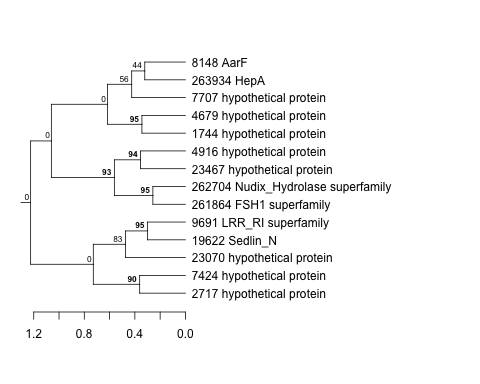
| Thaps_hclust_0414 |
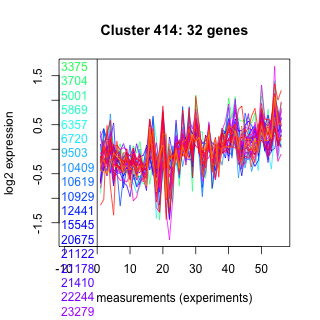 |
 |
0.0000000000028 |
0.00000026 |
0.000019 |
diel_exponential_vs_stationary | 0.010200 | -0.339 |
| Title | Cluster Plot | Dendrogram | e-value | e-value | e-value | Condition | Condition FDR | Condition Difference |
|---|---|---|---|---|---|---|---|---|
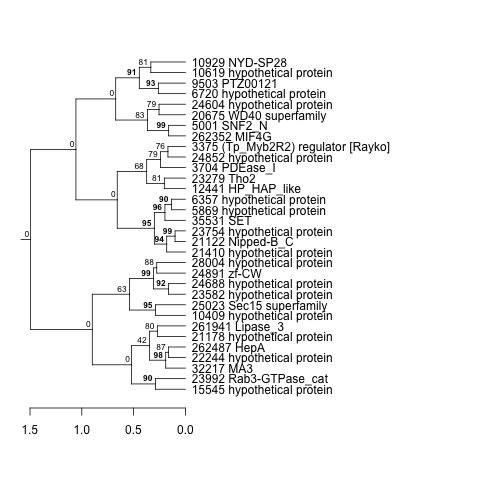
| Thaps_hclust_0318 |
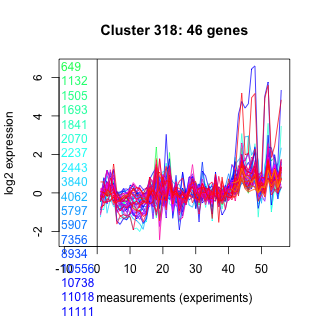 |
 |
1.1e-17 |
0.000000015 |
0.0000081 |
exponential_vs_stationary_24highlight | 0.000526 | -0.339 |
| Title | Cluster Plot | Dendrogram | e-value | e-value | e-value | Condition | Condition FDR | Condition Difference |
|---|---|---|---|---|---|---|---|---|
| Thaps_hclust_0031 |
 |
 |
0.00000077 |
0.000041 |
6.3 |
lowFe_KTKB_Day3 | 0.088700 | -0.339 |
| Title | Cluster Plot | Dendrogram | e-value | e-value | e-value | Condition | Condition FDR | Condition Difference |
|---|---|---|---|---|---|---|---|---|
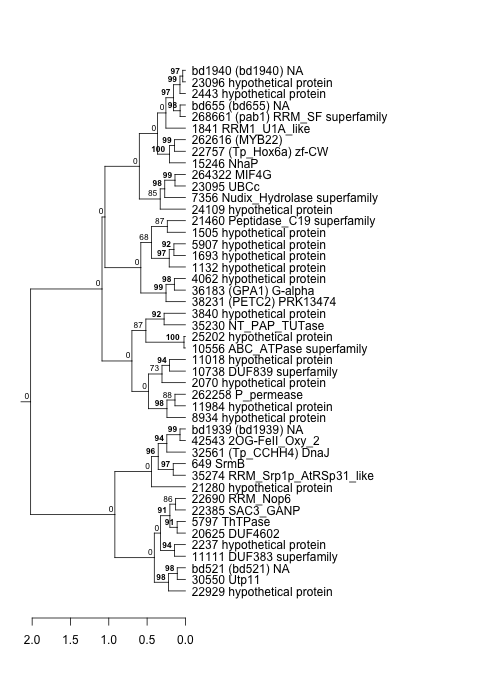
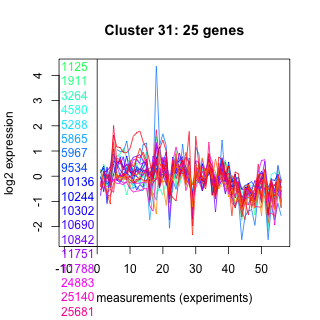
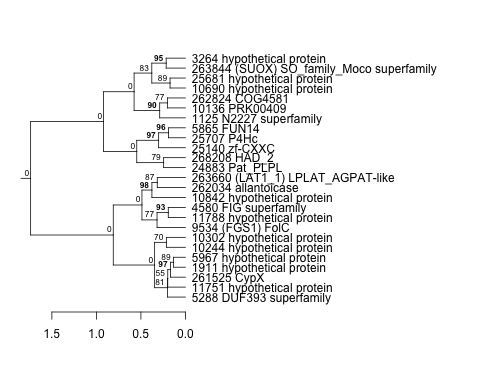
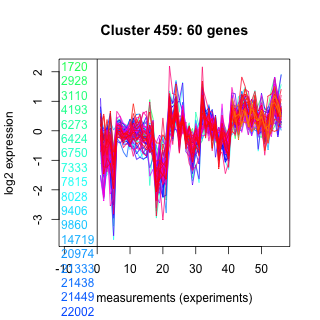
| Thaps_hclust_0459 |
 |
 |
0.00000000015 |
0.0000000056 |
0.000000015 |
lowFe_KTKB_Day5 | 0.001320 | -0.338 |
| Title | Cluster Plot | Dendrogram | e-value | e-value | e-value | Condition | Condition FDR | Condition Difference |
|---|---|---|---|---|---|---|---|---|
| Thaps_hclust_0002 |
 |
 |
0.00000029 |
0.000000009 |
0.000055 |
lowtemp_TMEVA | 0.215000 | -0.338 |
| Thaps_hclust_0002 |
|
|
0.00000029 |
0.000000009 |
0.000055 |
lowSi_TMEVA | 0.638000 | -0.327 |
| Title | Cluster Plot | Dendrogram | e-value | e-value | e-value | Condition | Condition FDR | Condition Difference |
|---|---|---|---|---|---|---|---|---|
| Thaps_hclust_0136 |
 |
 |
0.0034 |
0.034 |
340 |
lowFe_TMEVA | 0.143000 | -0.337 |
| Title | Cluster Plot | Dendrogram | e-value | e-value | e-value | Condition | Condition FDR | Condition Difference |
|---|---|---|---|---|---|---|---|---|
| Thaps_hclust_0126 |
 |
 |
0.025 |
1.3 |
0.6 |
highpH_TMEVA | 0.022700 | -0.337 |
| Thaps_hclust_0126 |
|
|
0.025 |
1.3 |
0.6 |
lowtemp_TMEVA | 0.169000 | -0.331 |
| Title | Cluster Plot | Dendrogram | e-value | e-value | e-value | Condition | Condition FDR | Condition Difference |
|---|---|---|---|---|---|---|---|---|
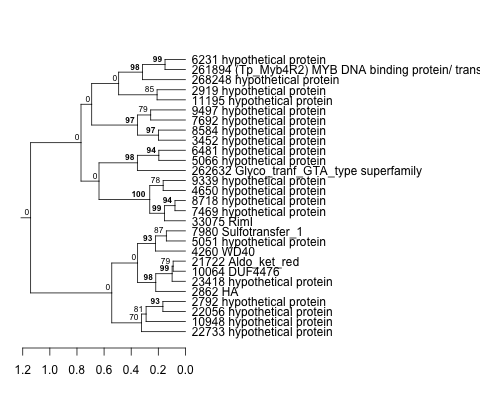
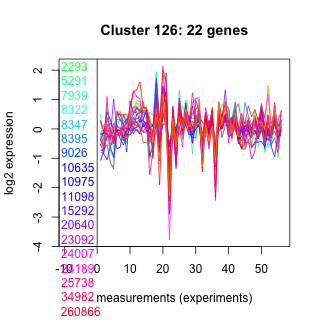
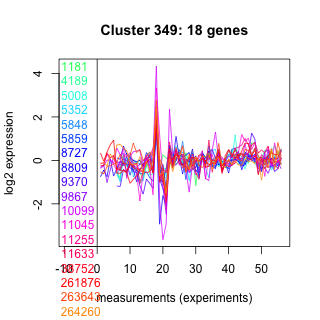
| Thaps_hclust_0349 |
 |
 |
360 |
5.4 |
67 |
lowFe_KTKB_Day5 | 0.105000 | -0.337 |
| Title | Cluster Plot | Dendrogram | e-value | e-value | e-value | Condition | Condition FDR | Condition Difference |
|---|---|---|---|---|---|---|---|---|
| Thaps_hclust_0161 |
 |
 |
1.8 |
13 |
18 |
diel_exponential_vs_stationary | 0.207000 | -0.337 |
| Thaps_hclust_0161 |
|
|
1.8 |
13 |
18 |
lowN_TMEVA | 0.469000 | -0.33 |
| Title | Cluster Plot | Dendrogram | e-value | e-value | e-value | Condition | Condition FDR | Condition Difference |
|---|---|---|---|---|---|---|---|---|
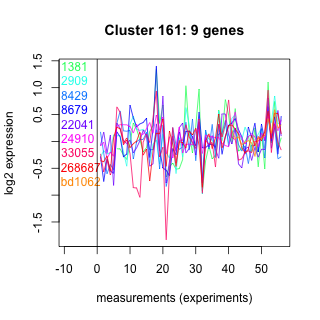
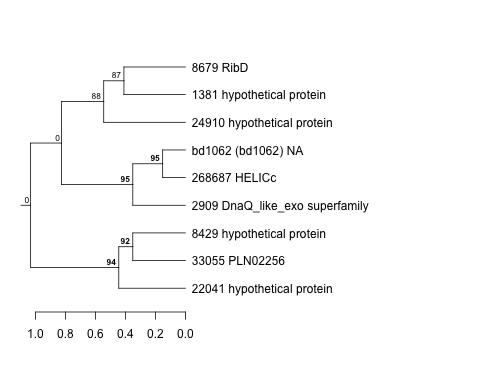
| Thaps_hclust_0421 |
 |
 |
0.0000074 |
0.00013 |
0.34 |
lowSi_TMEVA | 0.557000 | -0.336 |
| Title | Cluster Plot | Dendrogram | e-value | e-value | e-value | Condition | Condition FDR | Condition Difference |
|---|---|---|---|---|---|---|---|---|
| Thaps_hclust_0497 |
 |
 |
0.1 |
5.2 |
29 |
BaP | 0.259000 | -0.336 |
| Title | Cluster Plot | Dendrogram | e-value | e-value | e-value | Condition | Condition FDR | Condition Difference |
|---|---|---|---|---|---|---|---|---|
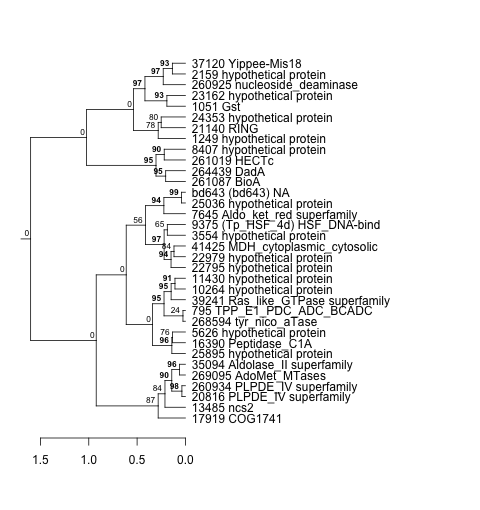
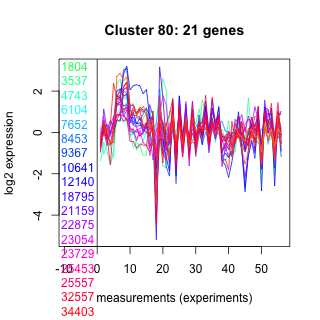
| Thaps_hclust_0080 |
 |
 |
0.000037 |
0.000075 |
0.96 |
BaP | 0.093500 | -0.336 |
| Thaps_hclust_0080 |
|
|
0.000037 |
0.000075 |
0.96 |
lowSi_TMEVA | 0.614000 | -0.333 |
| Title | Cluster Plot | Dendrogram | e-value | e-value | e-value | Condition | Condition FDR | Condition Difference |
|---|---|---|---|---|---|---|---|---|
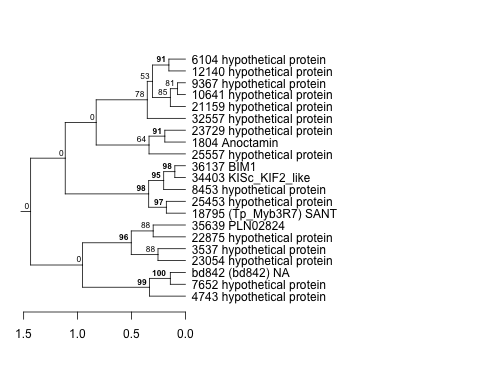
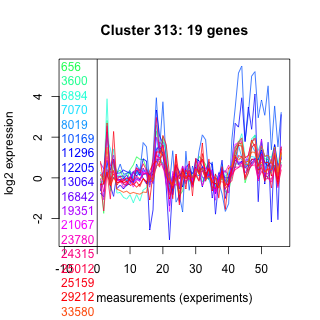
| Thaps_hclust_0313 |
 |
 |
0.00000043 |
0.00014 |
0.00078 |
exponential_vs_stationary_24highlight | 0.000526 | -0.336 |
| Title | Cluster Plot | Dendrogram | e-value | e-value | e-value | Condition | Condition FDR | Condition Difference |
|---|---|---|---|---|---|---|---|---|
| Thaps_hclust_0116 |
 |
 |
0.74 |
8.1 |
4.9 |
lowtemp_TMEVA | 0.246000 | -0.336 |
| Title | Cluster Plot | Dendrogram | e-value | e-value | e-value | Condition | Condition FDR | Condition Difference |
|---|---|---|---|---|---|---|---|---|
| Thaps_hclust_0049 |
 |
 |
0.00054 |
0.0063 |
0.03 |
highlight_arrays | 0.007090 | -0.335 |
| Title | Cluster Plot | Dendrogram | e-value | e-value | e-value | Condition | Condition FDR | Condition Difference |
|---|---|---|---|---|---|---|---|---|
| Thaps_hclust_0129 |
 |
 |
0.015 |
0.29 |
1 |
exponential_vs_stationary_24light | 0.263000 | -0.335 |
| Title | Cluster Plot | Dendrogram | e-value | e-value | e-value | Condition | Condition FDR | Condition Difference |
|---|---|---|---|---|---|---|---|---|
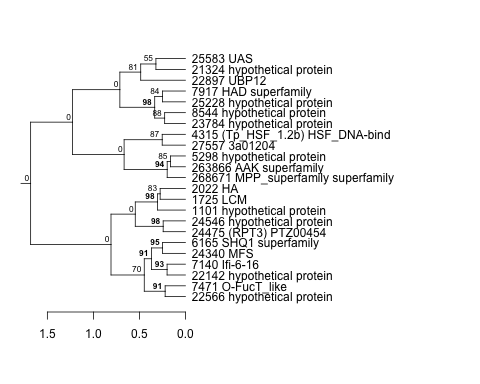
| Thaps_hclust_0429 |
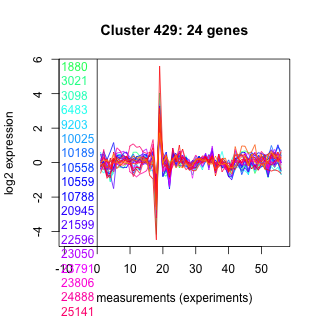 |
 |
0.0000000033 |
0.00000039 |
0.000054 |
lowSi_TMEVA | 0.599000 | -0.335 |
| Title | Cluster Plot | Dendrogram | e-value | e-value | e-value | Condition | Condition FDR | Condition Difference |
|---|---|---|---|---|---|---|---|---|
| Thaps_hclust_0084 |
 |
 |
0.0000000000035 |
0.00000025 |
0.12 |
lowN_TMEVA | 0.293000 | -0.335 |
| Title | Cluster Plot | Dendrogram | e-value | e-value | e-value | Condition | Condition FDR | Condition Difference |
|---|---|---|---|---|---|---|---|---|
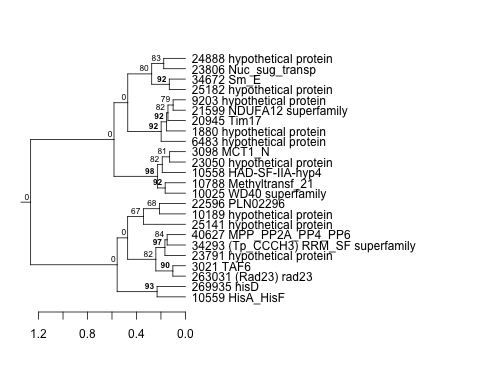
| Thaps_hclust_0068 |
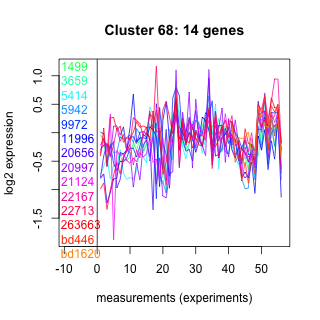 |
 |
0.34 |
36 |
100 |
BaP | 0.191000 | -0.335 |
| Title | Cluster Plot | Dendrogram | e-value | e-value | e-value | Condition | Condition FDR | Condition Difference |
|---|---|---|---|---|---|---|---|---|
| Thaps_hclust_0169 |
 |
 |
2.2 |
23 |
3.9 |
lowFe_TMEVA | 0.300000 | -0.334 |
| Thaps_hclust_0169 |
|
|
2.2 |
23 |
3.9 |
diel_light_vs_dark | 0.190000 | -0.334 |
| Title | Cluster Plot | Dendrogram | e-value | e-value | e-value | Condition | Condition FDR | Condition Difference |
|---|---|---|---|---|---|---|---|---|
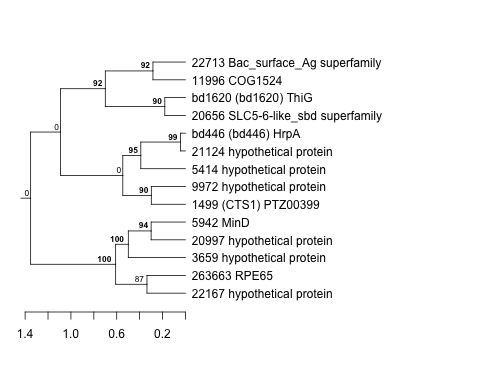
| Thaps_hclust_0400 |
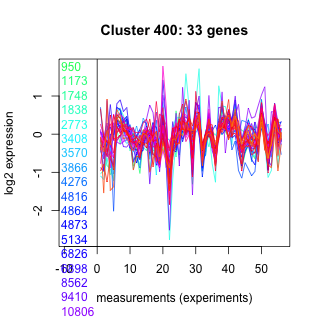 |
 |
Not available | Not available | Not available | lowSi_TMEVA | 0.557000 | -0.334 |
| Title | Cluster Plot | Dendrogram | e-value | e-value | e-value | Condition | Condition FDR | Condition Difference |
|---|---|---|---|---|---|---|---|---|
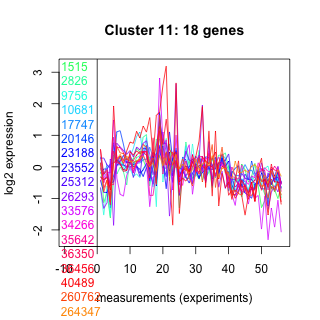
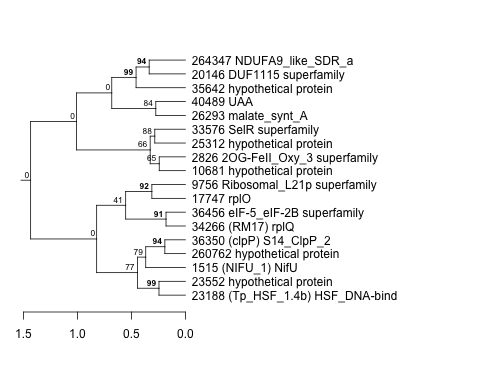
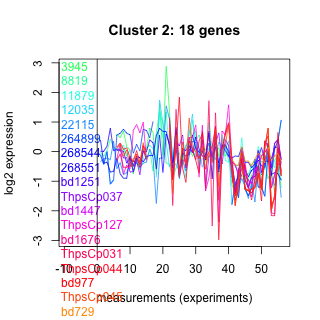
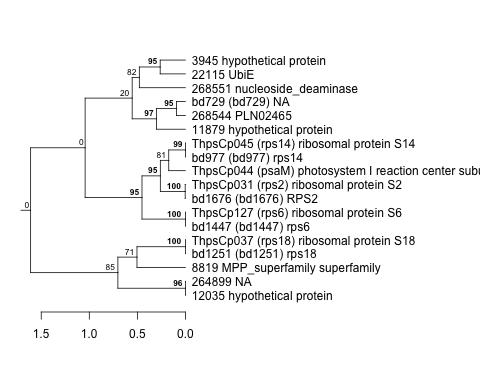
| Thaps_hclust_0208 |
 |
|
1.2e-20 |
0.0000000000000057 |
0.0000000099 |
lowSi_TMEVA | 0.445000 | -0.334 |
| Title | Cluster Plot | Dendrogram | e-value | e-value | e-value | Condition | Condition FDR | Condition Difference |
|---|---|---|---|---|---|---|---|---|
| Thaps_hclust_0282 |
 |
 |
0.0005 |
0.0059 |
0.15 |
BaP | 0.092900 | -0.334 |
| Title | Cluster Plot | Dendrogram | e-value | e-value | e-value | Condition | Condition FDR | Condition Difference |
|---|---|---|---|---|---|---|---|---|
| Thaps_hclust_0346 |
 |
 |
0.00053 |
4.7 |
80 |
lowFe_KTKB_Day3 | 0.082100 | -0.334 |
| Title | Cluster Plot | Dendrogram | e-value | e-value | e-value | Condition | Condition FDR | Condition Difference |
|---|---|---|---|---|---|---|---|---|
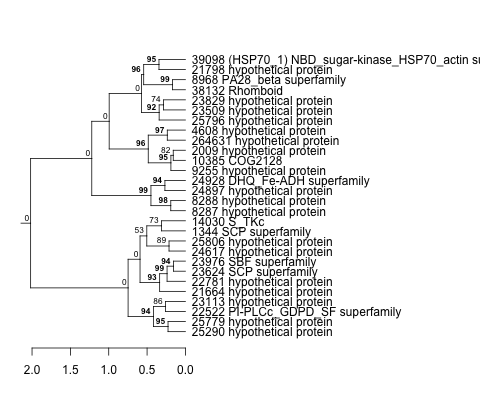
| Thaps_hclust_0265 |
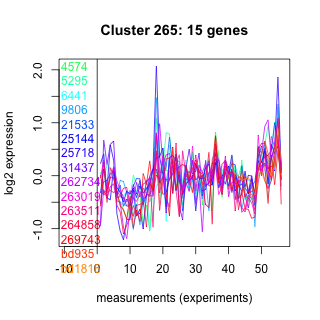 |
 |
0.02 |
0.000051 |
27 |
highpH_TMEVA | 0.059900 | -0.334 |
| Title | Cluster Plot | Dendrogram | e-value | e-value | e-value | Condition | Condition FDR | Condition Difference |
|---|---|---|---|---|---|---|---|---|
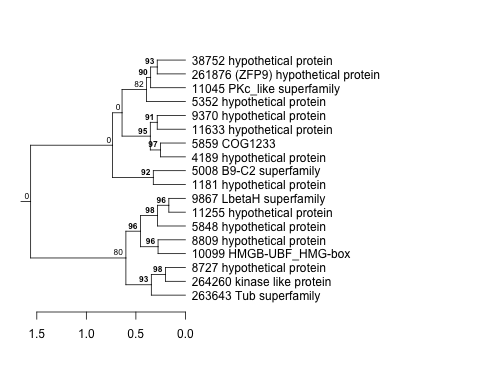
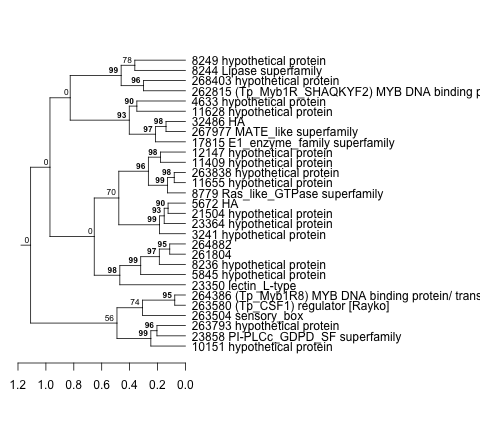
| Thaps_hclust_0381 |
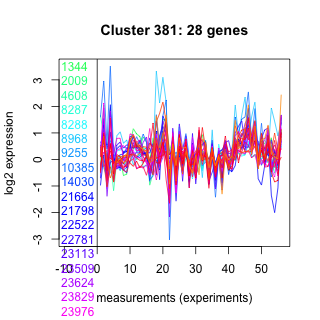 |
 |
0.0001 |
0.0035 |
0.061 |
exponential_vs_stationary_24highlight | 0.000526 | -0.334 |
| Title | Cluster Plot | Dendrogram | e-value | e-value | e-value | Condition | Condition FDR | Condition Difference |
|---|---|---|---|---|---|---|---|---|
| Thaps_hclust_0387 |
 |
 |
0.0023 |
0.003 |
0.38 |
exponential_vs_stationary_24light | 0.263000 | -0.334 |
| Title | Cluster Plot | Dendrogram | e-value | e-value | e-value | Condition | Condition FDR | Condition Difference |
|---|---|---|---|---|---|---|---|---|
| Thaps_hclust_0204 |
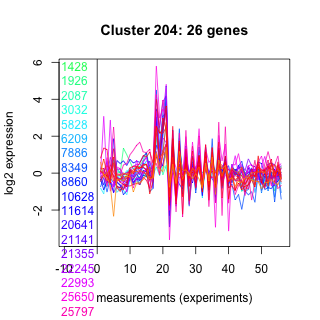 |
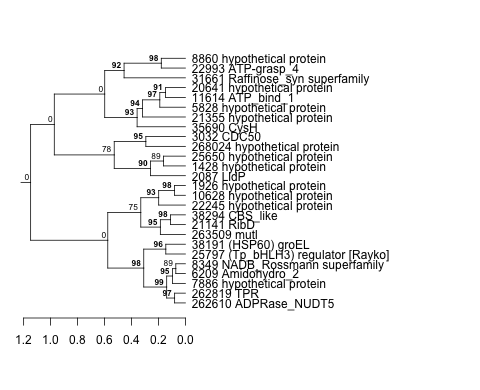 |
0.000065 |
0.008 |
0.00052 |
diel_exponential_vs_stationary | 0.025200 | -0.333 |
| Title | Cluster Plot | Dendrogram | e-value | e-value | e-value | Condition | Condition FDR | Condition Difference |
|---|---|---|---|---|---|---|---|---|
| Thaps_hclust_0373 |
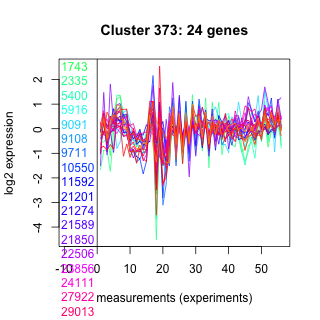 |
 |
0.00017 |
0.001 |
0.066 |
lowN_TMEVA | 0.293000 | -0.333 |
| Title | Cluster Plot | Dendrogram | e-value | e-value | e-value | Condition | Condition FDR | Condition Difference |
|---|---|---|---|---|---|---|---|---|
| Thaps_hclust_0022 |
 |
|
1.9e-31 |
2.4e-22 |
6.4e-20 |
co2_elevated_expo_arrays | 0.001390 | -0.333 |
| Title | Cluster Plot | Dendrogram | e-value | e-value | e-value | Condition | Condition FDR | Condition Difference |
|---|---|---|---|---|---|---|---|---|
| Thaps_hclust_0309 |
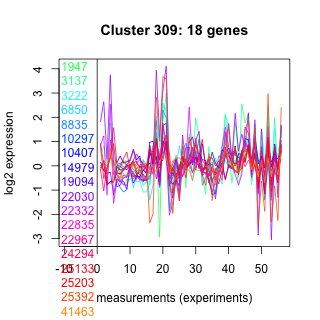 |
 |
0.0000055 |
0.015 |
1.1 |
lowN_TMEVA | 0.347000 | -0.332 |
| Title | Cluster Plot | Dendrogram | e-value | e-value | e-value | Condition | Condition FDR | Condition Difference |
|---|---|---|---|---|---|---|---|---|
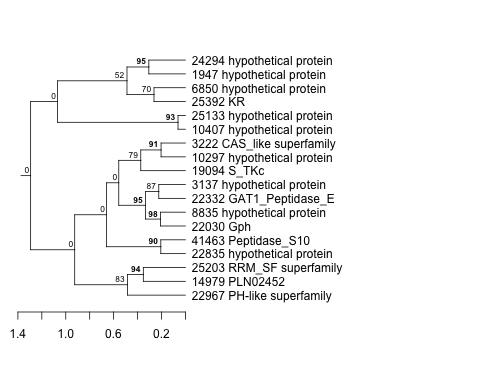
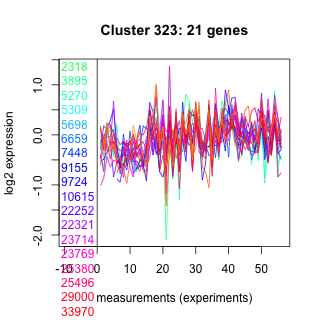
| Thaps_hclust_0323 |
 |
 |
0.0011 |
0.014 |
36 |
lowFe_TMEVA | 0.218000 | -0.332 |
| Title | Cluster Plot | Dendrogram | e-value | e-value | e-value | Condition | Condition FDR | Condition Difference |
|---|---|---|---|---|---|---|---|---|
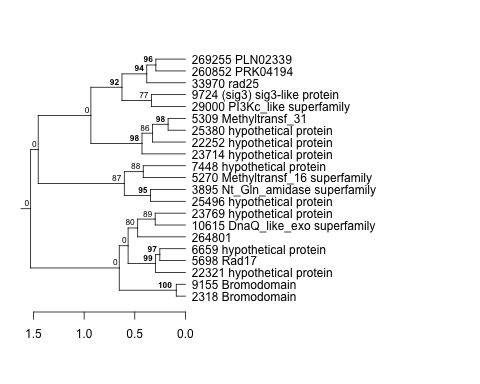
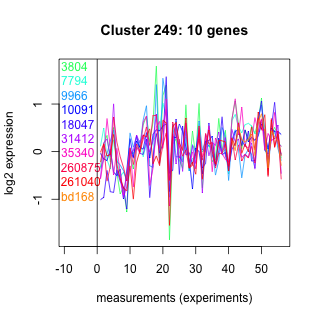
| Thaps_hclust_0249 |
 |
 |
14 |
39 |
180 |
highpH_TMEVA | 0.126000 | -0.332 |
| Title | Cluster Plot | Dendrogram | e-value | e-value | e-value | Condition | Condition FDR | Condition Difference |
|---|---|---|---|---|---|---|---|---|
| Thaps_hclust_0336 |
 |
 |
8.7e-23 |
0.00000000000015 |
0.0000000000000032 |
lowFe_TMEVA | 0.331000 | -0.332 |
| Title | Cluster Plot | Dendrogram | e-value | e-value | e-value | Condition | Condition FDR | Condition Difference |
|---|---|---|---|---|---|---|---|---|
| Thaps_hclust_0047 |
 |
 |
3.4e-21 |
3.4e-17 |
5.5e-19 |
co2_elevated_expo_arrays | 0.001390 | -0.332 |
| Title | Cluster Plot | Dendrogram | e-value | e-value | e-value | Condition | Condition FDR | Condition Difference |
|---|---|---|---|---|---|---|---|---|
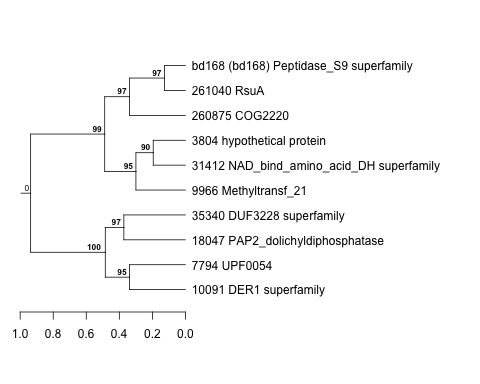
| Thaps_hclust_0216 |
 |
 |
0.0000076 |
0.019 |
0.0036 |
diel_exponential_vs_stationary | 0.012100 | -0.332 |
| Title | Cluster Plot | Dendrogram | e-value | e-value | e-value | Condition | Condition FDR | Condition Difference |
|---|---|---|---|---|---|---|---|---|
| Thaps_hclust_0426 |
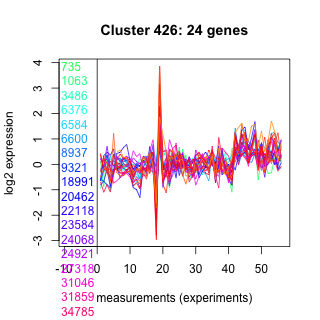 |
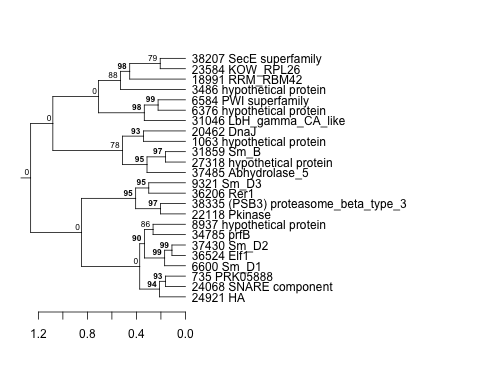 |
0.0000000000000021 |
0.00000000000026 |
0.000025 |
lowSi_TMEVA | 0.605000 | -0.332 |
| Title | Cluster Plot | Dendrogram | e-value | e-value | e-value | Condition | Condition FDR | Condition Difference |
|---|---|---|---|---|---|---|---|---|
| Thaps_hclust_0015 |
 |
|
2.5e-25 |
7.4e-21 |
0.0000000011 |
highpH_TMEVA | 0.000725 | -0.331 |
| Title | Cluster Plot | Dendrogram | e-value | e-value | e-value | Condition | Condition FDR | Condition Difference |
|---|---|---|---|---|---|---|---|---|
| Thaps_hclust_0351 |
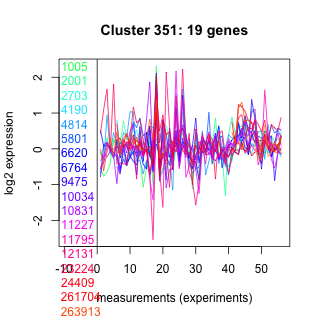 |
 |
0.033 |
0.06 |
50 |
diel_light_vs_dark | 0.117000 | -0.331 |
| Title | Cluster Plot | Dendrogram | e-value | e-value | e-value | Condition | Condition FDR | Condition Difference |
|---|---|---|---|---|---|---|---|---|
| Thaps_hclust_0331 |
 |
 |
0.000000000011 |
20 |
1600 |
diel_exponential_vs_stationary | 0.012400 | -0.331 |
| Thaps_hclust_0331 |
|
|
0.000000000011 |
20 |
1600 |
lowFe_TMEVA | 0.133000 | -0.327 |
| Title | Cluster Plot | Dendrogram | e-value | e-value | e-value | Condition | Condition FDR | Condition Difference |
|---|---|---|---|---|---|---|---|---|
| Thaps_hclust_0266 |
 |
 |
0.44 |
17 |
30 |
highpH_TMEVA | 0.186000 | -0.331 |
| Thaps_hclust_0266 |
|
|
0.44 |
17 |
30 |
highlight_arrays | 0.208000 | -0.33 |
| Title | Cluster Plot | Dendrogram | e-value | e-value | e-value | Condition | Condition FDR | Condition Difference |
|---|---|---|---|---|---|---|---|---|
| Thaps_hclust_0157 |
 |
 |
2 |
4.6 |
4.9 |
highpH_TMEVA | 0.142000 | -0.331 |
| Title | Cluster Plot | Dendrogram | e-value | e-value | e-value | Condition | Condition FDR | Condition Difference |
|---|---|---|---|---|---|---|---|---|
| Thaps_hclust_0091 |
 |
 |
0.00000061 |
0.00022 |
0.44 |
lowN_TMEVA | 0.349000 | -0.33 |
| Title | Cluster Plot | Dendrogram | e-value | e-value | e-value | Condition | Condition FDR | Condition Difference |
|---|---|---|---|---|---|---|---|---|
| Thaps_hclust_0440 |
 |
 |
0.68 |
4.6 |
250 |
highlight_arrays | 0.075500 | -0.33 |
| Thaps_hclust_0440 |
|
|
0.68 |
4.6 |
250 |
lowFe_KTKB_Day5 | 0.188000 | -0.325 |
| Title | Cluster Plot | Dendrogram | e-value | e-value | e-value | Condition | Condition FDR | Condition Difference |
|---|---|---|---|---|---|---|---|---|
| Thaps_hclust_0413 |
 |
 |
0.000043 |
0.0057 |
0.67 |
lowFe_TMEVA | 0.260000 | -0.33 |
| Title | Cluster Plot | Dendrogram | e-value | e-value | e-value | Condition | Condition FDR | Condition Difference |
|---|---|---|---|---|---|---|---|---|
| Thaps_hclust_0498 |
 |
 |
1.3 |
1.8 |
1.8 |
co2_elevated_expo_arrays | 0.021800 | -0.33 |
| Title | Cluster Plot | Dendrogram | e-value | e-value | e-value | Condition | Condition FDR | Condition Difference |
|---|---|---|---|---|---|---|---|---|
| Thaps_hclust_0120 |
 |
 |
0.00000098 |
0.000000076 |
0.001 |
co2_elevated_stat_arrays | 0.112000 | -0.33 |
| Title | Cluster Plot | Dendrogram | e-value | e-value | e-value | Condition | Condition FDR | Condition Difference |
|---|---|---|---|---|---|---|---|---|
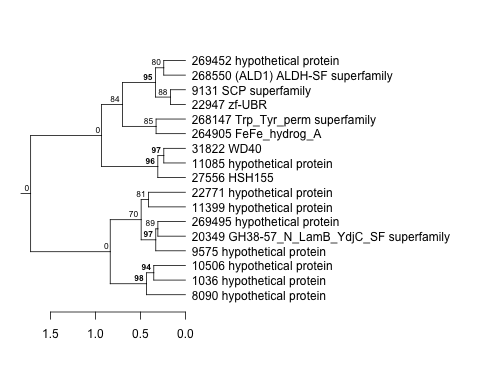
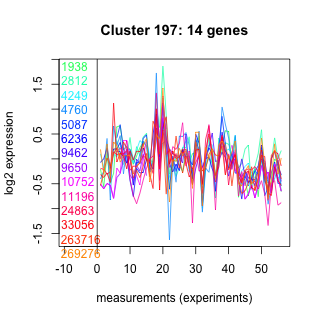
| Thaps_hclust_0197 |
 |
 |
0.12 |
0.3 |
0.65 |
lowFe_TMEVA | 0.297000 | -0.33 |
| Title | Cluster Plot | Dendrogram | e-value | e-value | e-value | Condition | Condition FDR | Condition Difference |
|---|---|---|---|---|---|---|---|---|
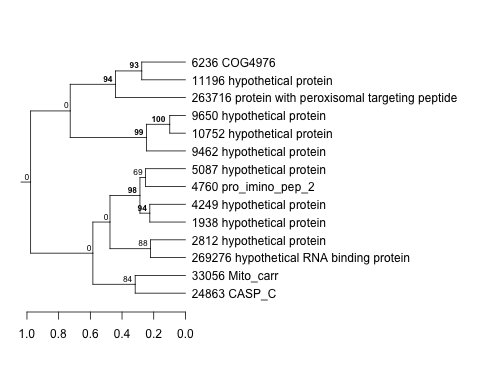
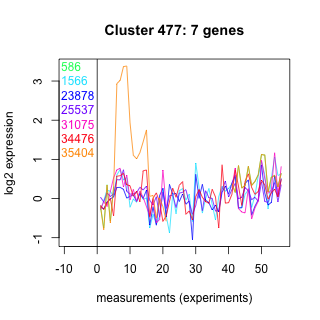
| Thaps_hclust_0477 |
 |
 |
0.02 |
0.011 |
0.071 |
lowFe_TMEVA | 0.416000 | -0.33 |
| Title | Cluster Plot | Dendrogram | e-value | e-value | e-value | Condition | Condition FDR | Condition Difference |
|---|---|---|---|---|---|---|---|---|
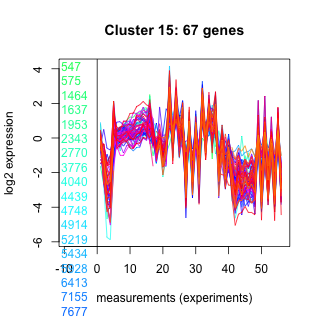
| Thaps_hclust_0065 |
 |
 |
1.5e-32 |
2.5e-32 |
9.9e-33 |
lowSi_TMEVA | 0.557000 | -0.33 |
| Title | Cluster Plot | Dendrogram | e-value | e-value | e-value | Condition | Condition FDR | Condition Difference |
|---|---|---|---|---|---|---|---|---|
| Thaps_hclust_0422 |
 |
 |
1.9 |
15 |
0.0027 |
lowFe_TMEVA | 0.216000 | -0.33 |
| Title | Cluster Plot | Dendrogram | e-value | e-value | e-value | Condition | Condition FDR | Condition Difference |
|---|---|---|---|---|---|---|---|---|
| Thaps_hclust_0122 |
 |
 |
0.0000037 |
0.061 |
0.0018 |
lowSi_TMEVA | 0.590000 | -0.33 |
| Title | Cluster Plot | Dendrogram | e-value | e-value | e-value | Condition | Condition FDR | Condition Difference |
|---|---|---|---|---|---|---|---|---|
| Thaps_hclust_0466 |
 |
 |
0.0000055 |
0.000014 |
0.0017 |
BaP | 0.097300 | -0.33 |
| Title | Cluster Plot | Dendrogram | e-value | e-value | e-value | Condition | Condition FDR | Condition Difference |
|---|---|---|---|---|---|---|---|---|
| Thaps_hclust_0003 |
 |
 |
0.24 |
16 |
240 |
exponential_vs_stationary_24light | 0.348000 | -0.329 |
| Title | Cluster Plot | Dendrogram | e-value | e-value | e-value | Condition | Condition FDR | Condition Difference |
|---|---|---|---|---|---|---|---|---|
| Thaps_hclust_0404 |
 |
 |
0.007 |
0.025 |
0.049 |
lowFe_KTKB_Day3 | 0.102000 | -0.329 |
| Title | Cluster Plot | Dendrogram | e-value | e-value | e-value | Condition | Condition FDR | Condition Difference |
|---|---|---|---|---|---|---|---|---|
| Thaps_hclust_0260 |
 |
 |
1.6e-36 |
9.1e-22 |
8.6e-22 |
highpH_TMEVA | 0.111000 | -0.328 |
| Title | Cluster Plot | Dendrogram | e-value | e-value | e-value | Condition | Condition FDR | Condition Difference |
|---|---|---|---|---|---|---|---|---|
| Thaps_hclust_0173 |
 |
 |
0.013 |
0.83 |
0.45 |
lowN_TMEVA | 0.310000 | -0.328 |
| Title | Cluster Plot | Dendrogram | e-value | e-value | e-value | Condition | Condition FDR | Condition Difference |
|---|---|---|---|---|---|---|---|---|
| Thaps_hclust_0262 |
 |
 |
12 |
130 |
130 |
lowSi_TMEVA | 0.707000 | -0.328 |
| Title | Cluster Plot | Dendrogram | e-value | e-value | e-value | Condition | Condition FDR | Condition Difference |
|---|---|---|---|---|---|---|---|---|
| Thaps_hclust_0450 |
 |
 |
0.00076 |
0.024 |
0.16 |
diel_exponential_vs_stationary | 0.151000 | -0.328 |
| Title | Cluster Plot | Dendrogram | e-value | e-value | e-value | Condition | Condition FDR | Condition Difference |
|---|---|---|---|---|---|---|---|---|
| Thaps_hclust_0167 |
 |
 |
1 |
15 |
160 |
lowSi_TMEVA | 0.688000 | -0.328 |
| Title | Cluster Plot | Dendrogram | e-value | e-value | e-value | Condition | Condition FDR | Condition Difference |
|---|---|---|---|---|---|---|---|---|
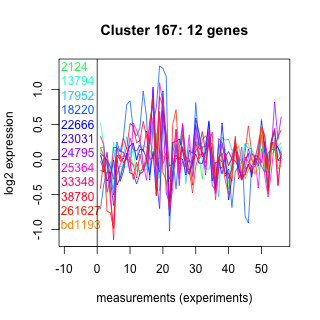
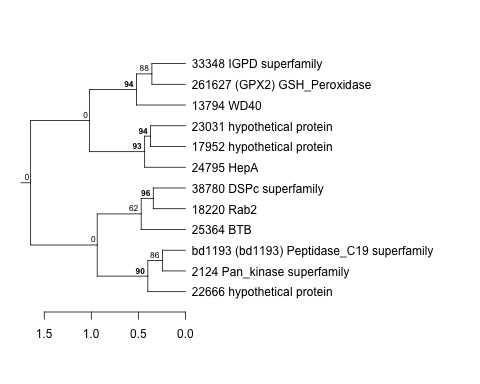
| Thaps_hclust_0471 |
 |
 |
0.0086 |
0.14 |
2.6 |
BaP | 0.131000 | -0.328 |
| Title | Cluster Plot | Dendrogram | e-value | e-value | e-value | Condition | Condition FDR | Condition Difference |
|---|---|---|---|---|---|---|---|---|
| Thaps_hclust_0337 |
 |
 |
3.5 |
3 |
280 |
lowFe_TMEVA | 0.373000 | -0.328 |
| Title | Cluster Plot | Dendrogram | e-value | e-value | e-value | Condition | Condition FDR | Condition Difference |
|---|---|---|---|---|---|---|---|---|
| Thaps_hclust_0439 |
 |
 |
0.00085 |
0.014 |
0.032 |
lowN_TMEVA | 0.341000 | -0.328 |
| Title | Cluster Plot | Dendrogram | e-value | e-value | e-value | Condition | Condition FDR | Condition Difference |
|---|---|---|---|---|---|---|---|---|
| Thaps_hclust_0114 |
 |
 |
0.086 |
4.8 |
3.2 |
lowFe_TMEVA | 0.257000 | -0.327 |
| Title | Cluster Plot | Dendrogram | e-value | e-value | e-value | Condition | Condition FDR | Condition Difference |
|---|---|---|---|---|---|---|---|---|
| Thaps_hclust_0410 |
 |
 |
0.065 |
0.56 |
0.36 |
co2_elevated_stat_arrays | 0.083600 | -0.327 |
| Title | Cluster Plot | Dendrogram | e-value | e-value | e-value | Condition | Condition FDR | Condition Difference |
|---|---|---|---|---|---|---|---|---|
| Thaps_hclust_0134 |
 |
 |
0.00013 |
0.55 |
0.0039 |
lowFe_KTKB_Day5 | 0.125000 | -0.327 |
| Title | Cluster Plot | Dendrogram | e-value | e-value | e-value | Condition | Condition FDR | Condition Difference |
|---|---|---|---|---|---|---|---|---|
| Thaps_hclust_0304 |
 |
 |
0.16 |
1.3 |
16 |
lowFe_KTKB_Day5 | 0.016700 | -0.326 |
| Title | Cluster Plot | Dendrogram | e-value | e-value | e-value | Condition | Condition FDR | Condition Difference |
|---|---|---|---|---|---|---|---|---|
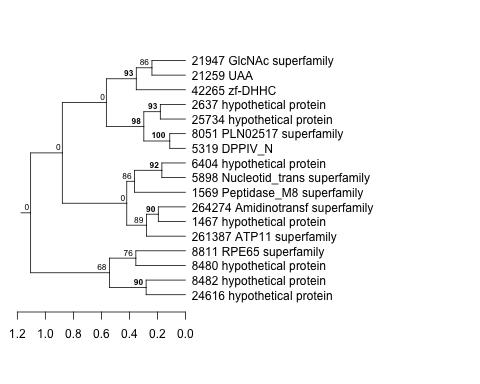
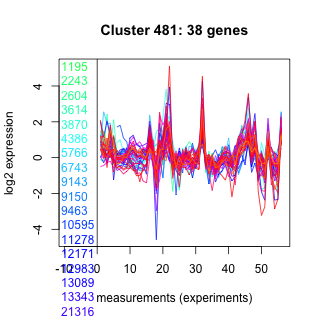
| Thaps_hclust_0481 |
 |
 |
0.000000069 |
0.00000053 |
0.000012 |
diel_light_vs_dark | 0.018800 | -0.326 |
| Title | Cluster Plot | Dendrogram | e-value | e-value | e-value | Condition | Condition FDR | Condition Difference |
|---|---|---|---|---|---|---|---|---|
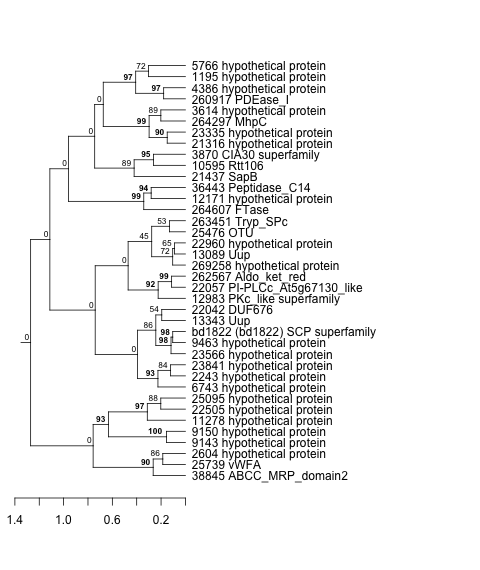
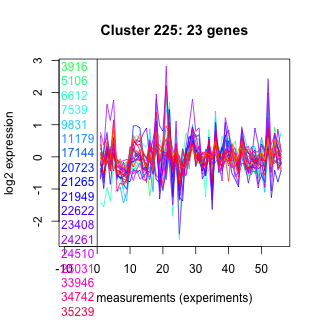
| Thaps_hclust_0225 |
 |
 |
0.00000024 |
0.000003 |
0.0048 |
lowFe_TMEVA | 0.215000 | -0.325 |
| Title | Cluster Plot | Dendrogram | e-value | e-value | e-value | Condition | Condition FDR | Condition Difference |
|---|---|---|---|---|---|---|---|---|
| Thaps_hclust_0165 |
 |
 |
0.00011 |
2.3 |
3.9 |
lowFe_TMEVA | 0.288000 | -0.325 |
| Title | Cluster Plot | Dendrogram | e-value | e-value | e-value | Condition | Condition FDR | Condition Difference |
|---|---|---|---|---|---|---|---|---|
| Thaps_hclust_0294 |
 |
 |
0.0033 |
0.13 |
0.53 |
highlight_arrays | 0.035700 | -0.325 |
| Title | Cluster Plot | Dendrogram | e-value | e-value | e-value | Condition | Condition FDR | Condition Difference |
|---|---|---|---|---|---|---|---|---|
| Thaps_hclust_0441 |
 |
 |
0.00081 |
0.001 |
0.0015 |
lowSi_TMEVA | 0.711000 | -0.325 |
| Title | Cluster Plot | Dendrogram | e-value | e-value | e-value | Condition | Condition FDR | Condition Difference |
|---|---|---|---|---|---|---|---|---|
| Thaps_hclust_0108 |
 |
 |
0.0000001 |
0.013 |
4 |
lowSi_TMEVA | 0.590000 | -0.324 |
| Title | Cluster Plot | Dendrogram | e-value | e-value | e-value | Condition | Condition FDR | Condition Difference |
|---|---|---|---|---|---|---|---|---|
| Thaps_hclust_0124 |
 |
 |
1 |
0.23 |
42 |
co2_elevated_stat_arrays | 0.189000 | -0.324 |
| Title | Cluster Plot | Dendrogram | e-value | e-value | e-value | Condition | Condition FDR | Condition Difference |
|---|---|---|---|---|---|---|---|---|
| Thaps_hclust_0257 |
 |
 |
Not available | Not available | Not available | lowFe_TMEVA | 0.395000 | -0.324 |
| Title | Cluster Plot | Dendrogram | e-value | e-value | e-value | Condition | Condition FDR | Condition Difference |
|---|---|---|---|---|---|---|---|---|
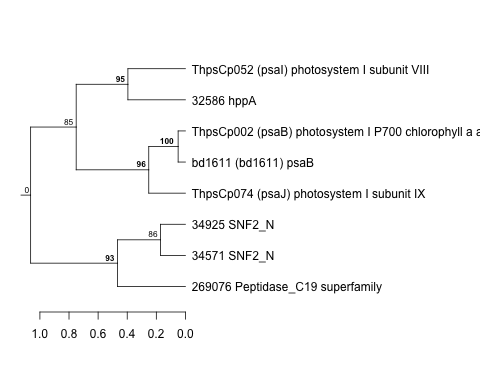
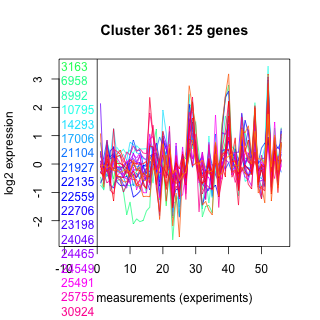
| Thaps_hclust_0361 |
 |
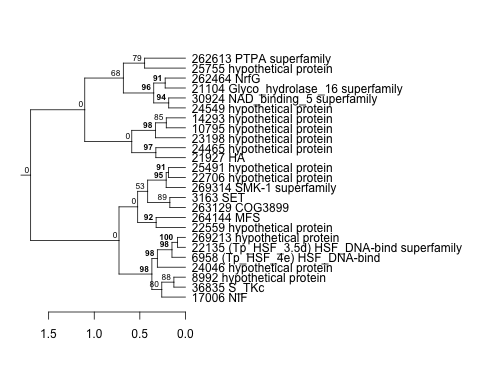 |
0.00000000081 |
0.14 |
2.1 |
lowFe_TMEVA | 0.191000 | -0.324 |