Hierarchical Clusters
Displaying 1301 - 1400 of 7500
| Title | Cluster Plot | Dendrogram | e-value | e-value | e-value | Condition | Condition FDR | Condition Difference |
|---|---|---|---|---|---|---|---|---|
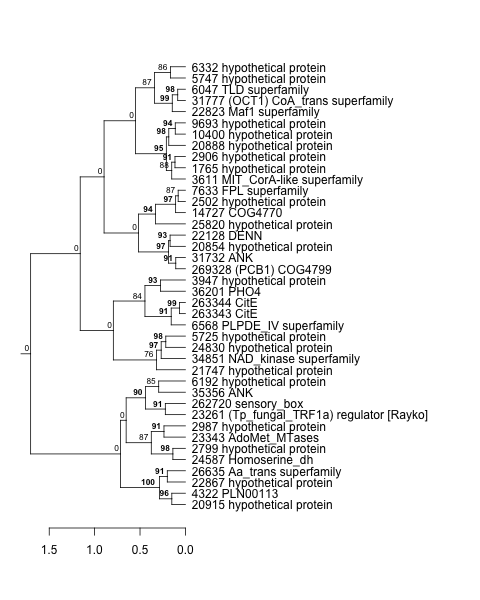
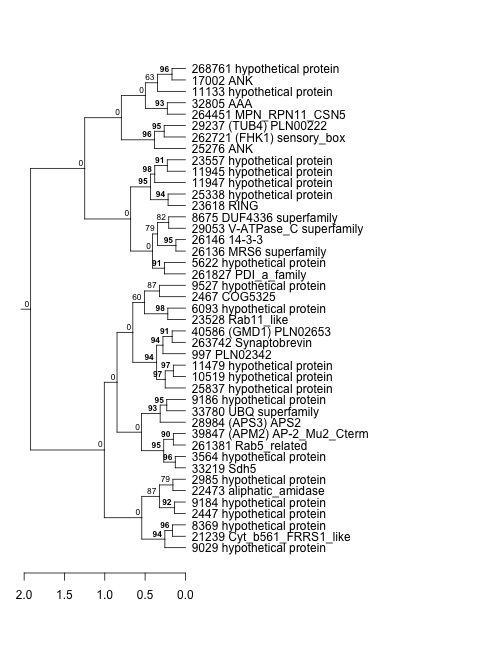
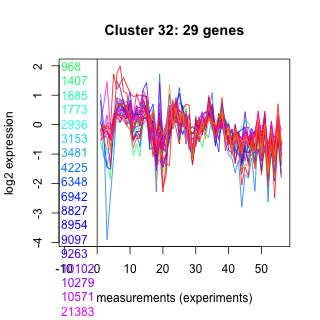
| Thaps_hclust_0411 |
 |
 |
0.00079 |
0.0092 |
0.029 |
exponential_vs_stationary_24highlight | 0.003600 | -0.223 |
| Title | Cluster Plot | Dendrogram | e-value | e-value | e-value | Condition | Condition FDR | Condition Difference |
|---|---|---|---|---|---|---|---|---|
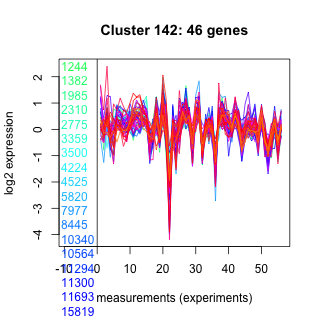
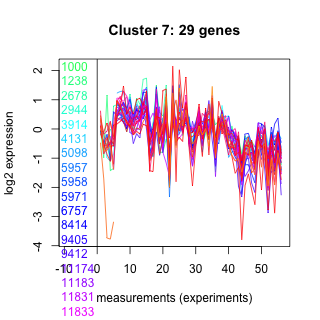
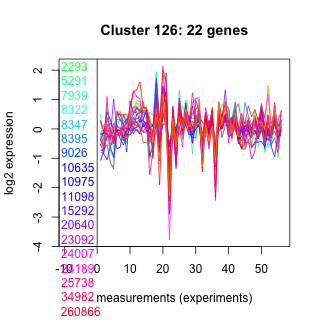
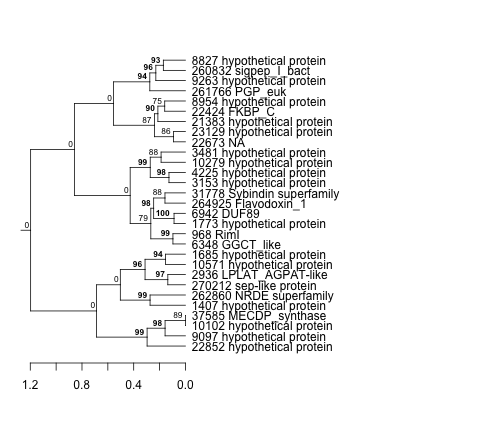
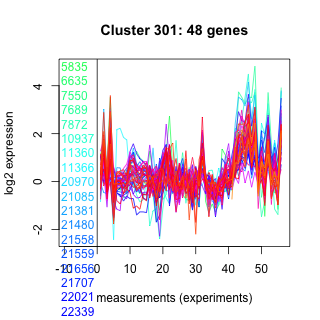
| Thaps_hclust_0142 |
 |
 |
0.000000000000013 |
0.0000000004 |
0.001 |
lowFe_KTKB_Day3 | 0.003620 | -0.424 |
| Thaps_hclust_0142 |
|
|
0.000000000000013 |
0.0000000004 |
0.001 |
highpH_TMEVA | 0.005560 | 0.291 |
| Title | Cluster Plot | Dendrogram | e-value | e-value | e-value | Condition | Condition FDR | Condition Difference |
|---|---|---|---|---|---|---|---|---|
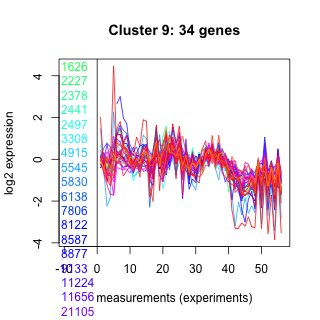
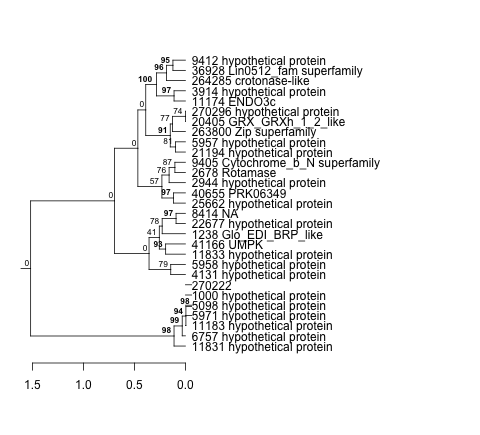
| Thaps_hclust_0009 |
 |
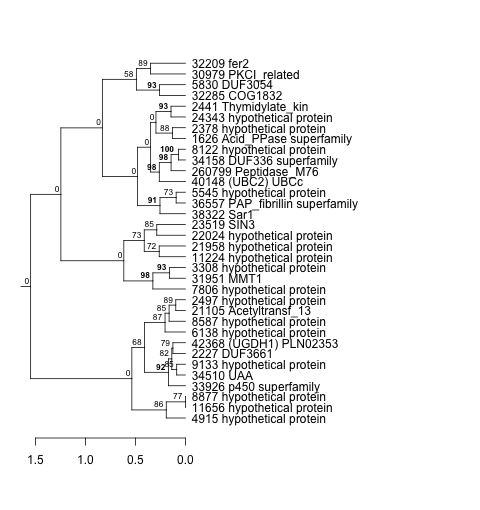 |
0.0000023 |
0.0000027 |
0.000035 |
lowFe_KTKB_Day3 | 0.003620 | -0.489 |
| Thaps_hclust_0009 |
|
|
0.0000023 |
0.0000027 |
0.000035 |
diel_exponential_vs_stationary | 0.005310 | 0.361 |
| Title | Cluster Plot | Dendrogram | e-value | e-value | e-value | Condition | Condition FDR | Condition Difference |
|---|---|---|---|---|---|---|---|---|
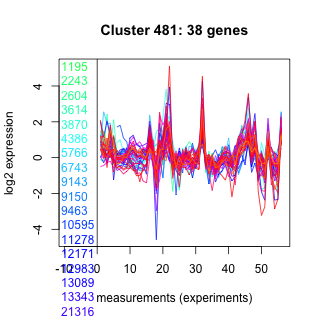
| Thaps_hclust_0481 |
 |
 |
0.000000069 |
0.00000053 |
0.000012 |
lowFe_TMEVA | 0.003700 | 0.508 |
| Title | Cluster Plot | Dendrogram | e-value | e-value | e-value | Condition | Condition FDR | Condition Difference |
|---|---|---|---|---|---|---|---|---|
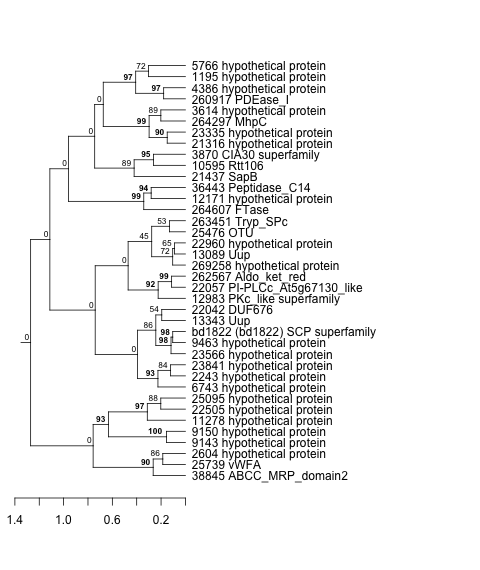
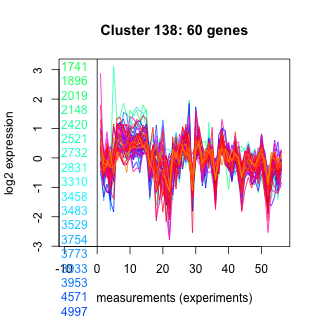
| Thaps_hclust_0138 |
 |
 |
0.00000000000028 |
0.0000000011 |
0.0000065 |
lowFe_TMEVA | 0.003700 | -0.403 |
| Title | Cluster Plot | Dendrogram | e-value | e-value | e-value | Condition | Condition FDR | Condition Difference |
|---|---|---|---|---|---|---|---|---|
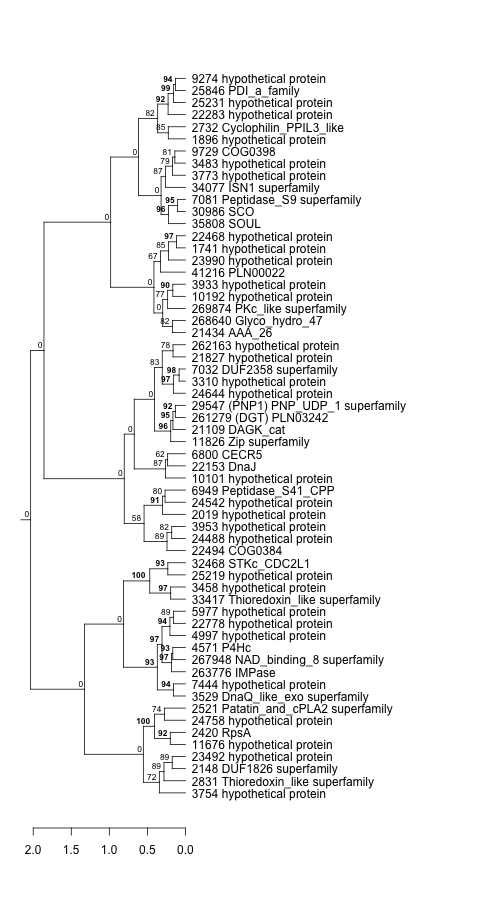
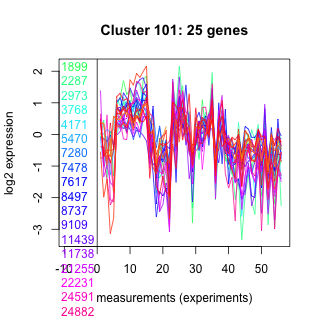
| Thaps_hclust_0101 |
 |
 |
0.000000016 |
0.0000038 |
0.014 |
lowFe_TMEVA | 0.003700 | -0.529 |
| Thaps_hclust_0101 |
|
|
0.000000016 |
0.0000038 |
0.014 |
exponential_vs_stationary_24highlight | 0.004330 | 0.252 |
| Title | Cluster Plot | Dendrogram | e-value | e-value | e-value | Condition | Condition FDR | Condition Difference |
|---|---|---|---|---|---|---|---|---|
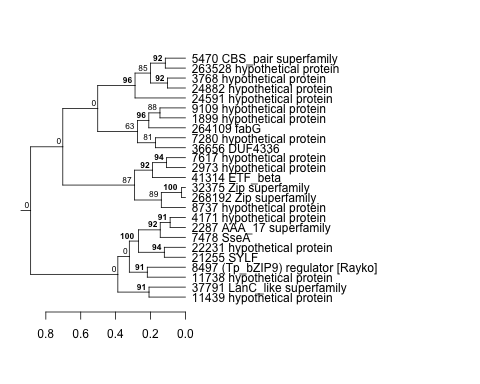
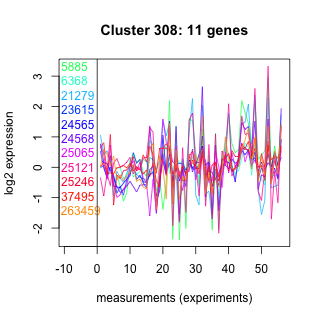
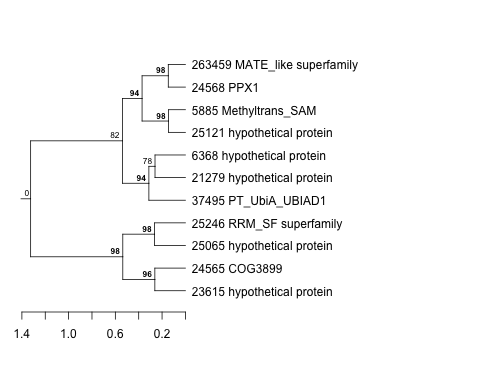
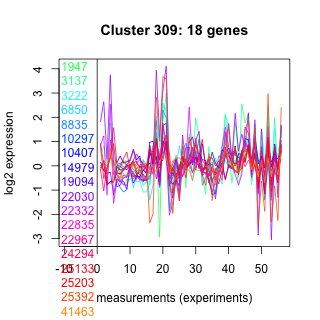
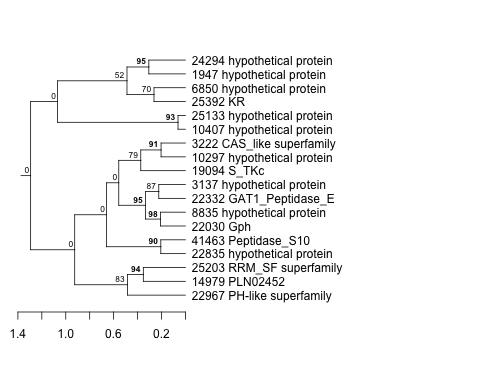
| Thaps_hclust_0308 |
 |
 |
0.37 |
17 |
1.6 |
diel_light_vs_dark | 0.003750 | -0.804 |
| Title | Cluster Plot | Dendrogram | e-value | e-value | e-value | Condition | Condition FDR | Condition Difference |
|---|---|---|---|---|---|---|---|---|
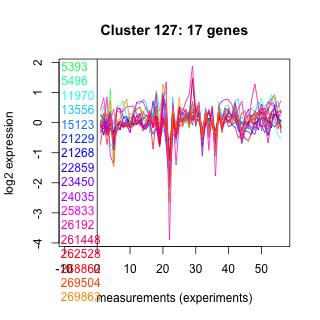
| Thaps_hclust_0127 |
 |
 |
2.6 |
32 |
48 |
diel_light_vs_dark | 0.003750 | 0.592 |
| Title | Cluster Plot | Dendrogram | e-value | e-value | e-value | Condition | Condition FDR | Condition Difference |
|---|---|---|---|---|---|---|---|---|
| Thaps_hclust_0035 |
 |
 |
0.00023 |
0.0000098 |
0.064 |
diel_light_vs_dark | 0.003750 | -0.606 |
| Title | Cluster Plot | Dendrogram | e-value | e-value | e-value | Condition | Condition FDR | Condition Difference |
|---|---|---|---|---|---|---|---|---|
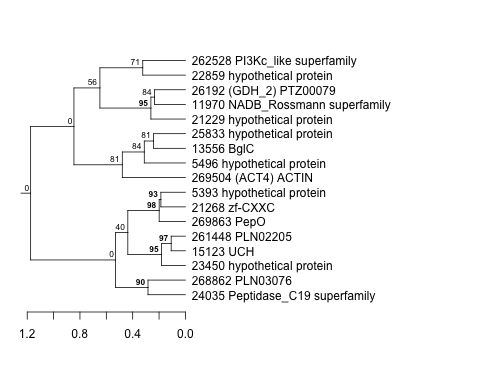
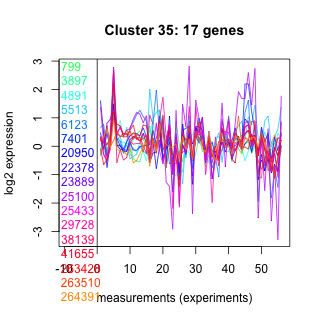
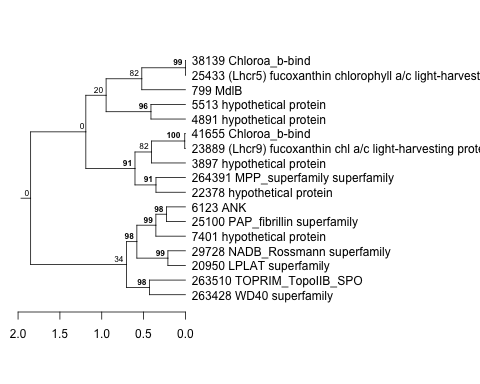
| Thaps_hclust_0405 |
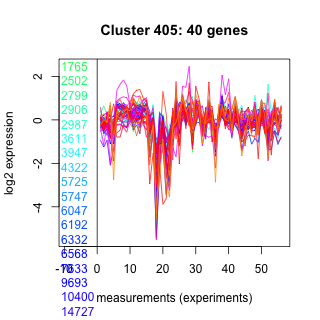 |
 |
0.00000000036 |
0.0000000063 |
0.005 |
lowtemp_TMEVA | 0.003800 | -0.521 |
| Title | Cluster Plot | Dendrogram | e-value | e-value | e-value | Condition | Condition FDR | Condition Difference |
|---|---|---|---|---|---|---|---|---|
| Thaps_hclust_0007 |
 |
 |
0.0000000001 |
0.0000000097 |
0.000027 |
lowtemp_TMEVA | 0.003800 | -0.641 |
| Thaps_hclust_0007 |
|
|
0.0000000001 |
0.0000000097 |
0.000027 |
exponential_vs_stationary_24light | 0.004950 | 0.691 |
| Title | Cluster Plot | Dendrogram | e-value | e-value | e-value | Condition | Condition FDR | Condition Difference |
|---|---|---|---|---|---|---|---|---|
| Thaps_hclust_0126 |
 |
 |
0.025 |
1.3 |
0.6 |
BaP | 0.003850 | 0.556 |
| Title | Cluster Plot | Dendrogram | e-value | e-value | e-value | Condition | Condition FDR | Condition Difference |
|---|---|---|---|---|---|---|---|---|
| Thaps_hclust_0096 |
 |
 |
0.0000028 |
0.9 |
0.38 |
co2_elevated_expo_arrays | 0.003850 | 0.31 |
| Title | Cluster Plot | Dendrogram | e-value | e-value | e-value | Condition | Condition FDR | Condition Difference |
|---|---|---|---|---|---|---|---|---|
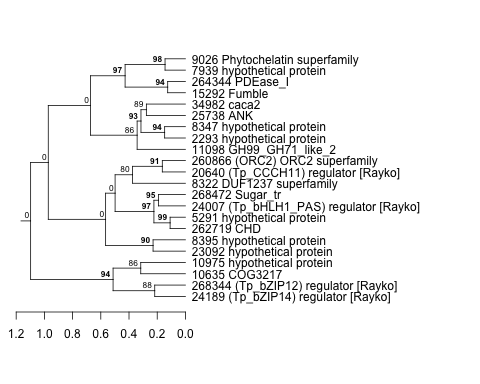
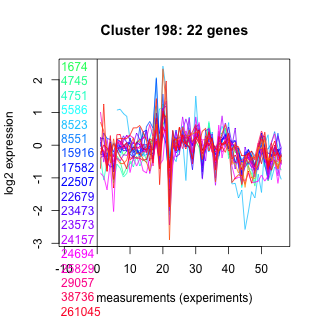
| Thaps_hclust_0198 |
 |
 |
0.00091 |
0.017 |
0.0046 |
BaP | 0.003850 | 0.542 |
| Title | Cluster Plot | Dendrogram | e-value | e-value | e-value | Condition | Condition FDR | Condition Difference |
|---|---|---|---|---|---|---|---|---|
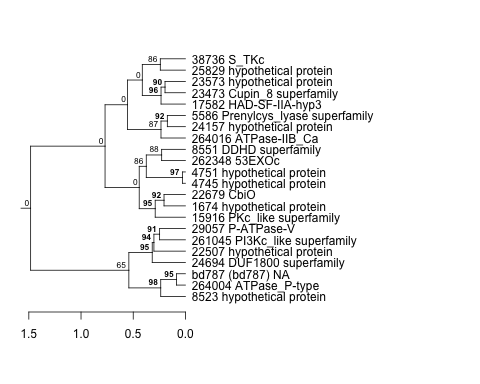
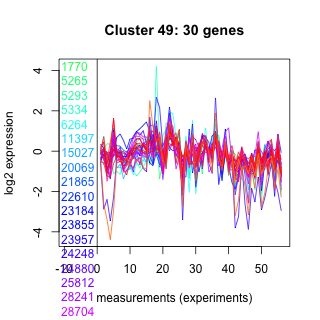
| Thaps_hclust_0049 |
 |
 |
0.00054 |
0.0063 |
0.03 |
diel_exponential_vs_stationary | 0.003880 | 0.413 |
| Title | Cluster Plot | Dendrogram | e-value | e-value | e-value | Condition | Condition FDR | Condition Difference |
|---|---|---|---|---|---|---|---|---|
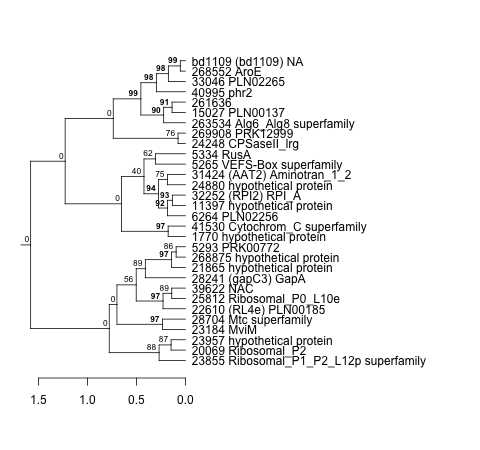
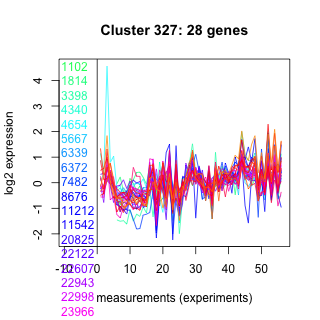
| Thaps_hclust_0327 |
 |
 |
0.0000000037 |
0.013 |
3.8 |
exponential_vs_stationary_24highlight | 0.003970 | -0.256 |
| Thaps_hclust_0327 |
|
|
0.0000000037 |
0.013 |
3.8 |
diel_exponential_vs_stationary | 0.005700 | -0.389 |
| Title | Cluster Plot | Dendrogram | e-value | e-value | e-value | Condition | Condition FDR | Condition Difference |
|---|---|---|---|---|---|---|---|---|
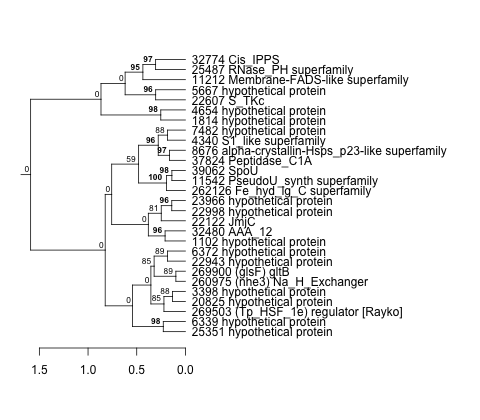
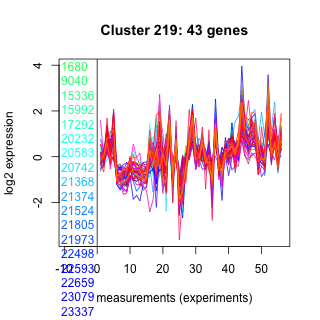
| Thaps_hclust_0219 |
 |
 |
2.8e-16 |
0.0000000055 |
0.012 |
lowN_TMEVA | 0.004000 | 0.623 |
| Title | Cluster Plot | Dendrogram | e-value | e-value | e-value | Condition | Condition FDR | Condition Difference |
|---|---|---|---|---|---|---|---|---|
| Thaps_hclust_0069 |
 |
 |
1.2e-26 |
2.6e-24 |
2.4e-20 |
lowN_TMEVA | 0.004000 | -0.621 |
| Thaps_hclust_0069 |
|
|
1.2e-26 |
2.6e-24 |
2.4e-20 |
diel_light_vs_dark | 0.004510 | -0.384 |
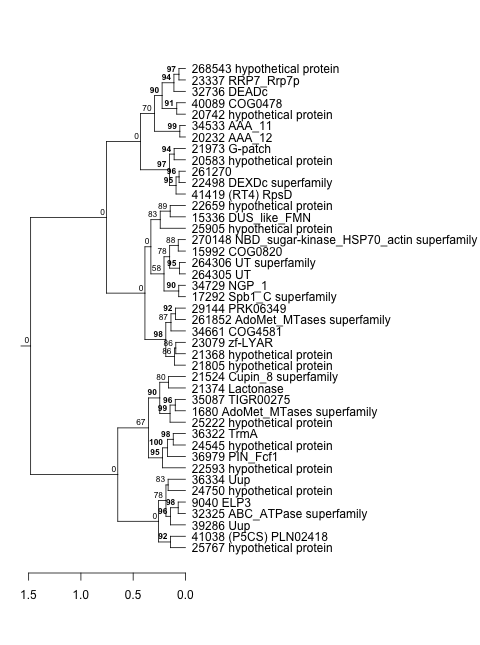
| Title | Cluster Plot | Dendrogram | e-value | e-value | e-value | Condition | Condition FDR | Condition Difference |
|---|---|---|---|---|---|---|---|---|
| Thaps_hclust_0443 |
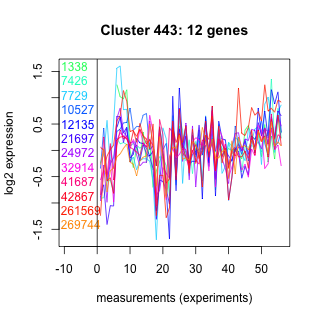 |
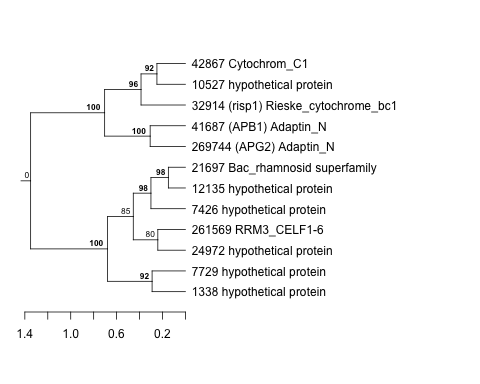 |
0.96 |
9.8 |
42 |
highpH_TMEVA | 0.004020 | -0.623 |
| Title | Cluster Plot | Dendrogram | e-value | e-value | e-value | Condition | Condition FDR | Condition Difference |
|---|---|---|---|---|---|---|---|---|
| Thaps_hclust_0066 |
 |
 |
0.0000000000000019 |
0.00000025 |
0.00000047 |
highpH_TMEVA | 0.004020 | -0.359 |
| Title | Cluster Plot | Dendrogram | e-value | e-value | e-value | Condition | Condition FDR | Condition Difference |
|---|---|---|---|---|---|---|---|---|
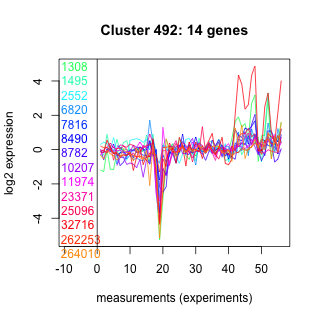
| Thaps_hclust_0491 |
 |
 |
0.35 |
17 |
52 |
highpH_TMEVA | 0.004020 | 0.633 |
| Title | Cluster Plot | Dendrogram | e-value | e-value | e-value | Condition | Condition FDR | Condition Difference |
|---|---|---|---|---|---|---|---|---|
| Thaps_hclust_0213 |
 |
 |
0.0000045 |
0.075 |
0.54 |
exponential_vs_stationary_24light | 0.004040 | 0.605 |
| Title | Cluster Plot | Dendrogram | e-value | e-value | e-value | Condition | Condition FDR | Condition Difference |
|---|---|---|---|---|---|---|---|---|
| Thaps_hclust_0209 |
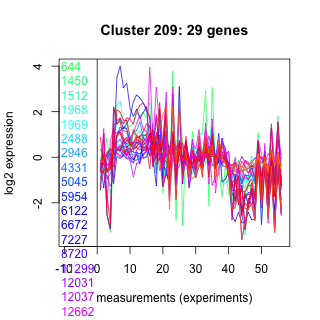 |
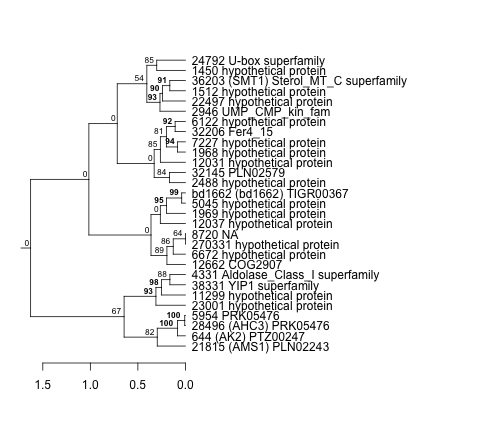 |
1.2e-16 |
0.00011 |
0.000027 |
BaP | 0.004070 | 0.486 |
| Title | Cluster Plot | Dendrogram | e-value | e-value | e-value | Condition | Condition FDR | Condition Difference |
|---|---|---|---|---|---|---|---|---|
| Thaps_hclust_0271 |
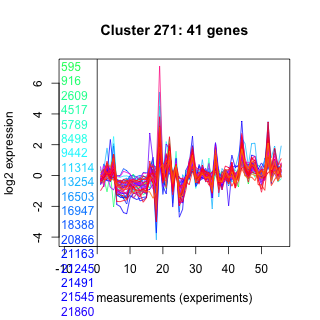 |
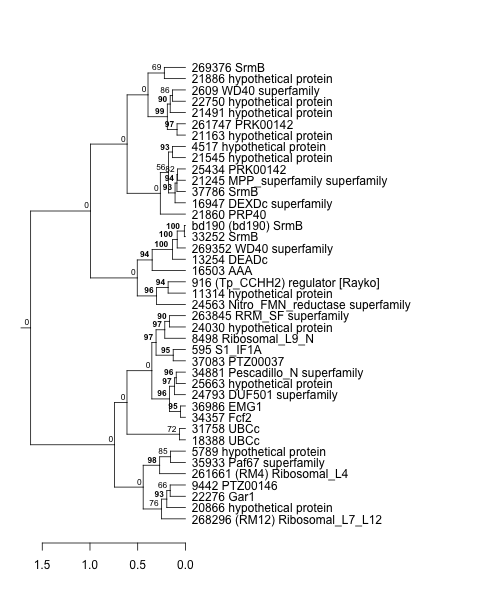 |
Not available | Not available | Not available | BaP | 0.004070 | 0.413 |
| Thaps_hclust_0271 |
|
|
Not available | Not available | Not available | diel_light_vs_dark | 0.005470 | -0.366 |
| Title | Cluster Plot | Dendrogram | e-value | e-value | e-value | Condition | Condition FDR | Condition Difference |
|---|---|---|---|---|---|---|---|---|
| Thaps_hclust_0100 |
 |
 |
0.00000073 |
0.000076 |
2.6 |
BaP | 0.004070 | -0.613 |
| Title | Cluster Plot | Dendrogram | e-value | e-value | e-value | Condition | Condition FDR | Condition Difference |
|---|---|---|---|---|---|---|---|---|
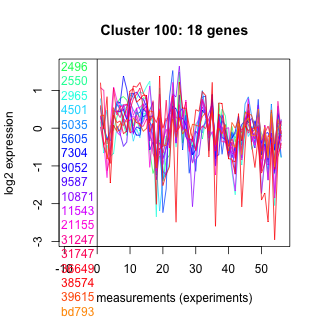
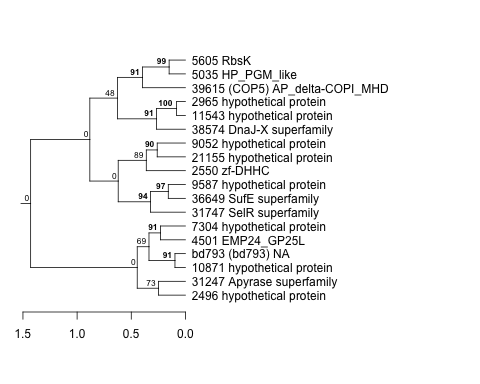
| Thaps_hclust_0287 |
 |
 |
0.0000001 |
0.00007 |
0.003 |
lowFe_KTKB_Day5 | 0.004170 | 0.482 |
| Title | Cluster Plot | Dendrogram | e-value | e-value | e-value | Condition | Condition FDR | Condition Difference |
|---|---|---|---|---|---|---|---|---|
| Thaps_hclust_0496 |
 |
 |
0.00082 |
0.0031 |
0.43 |
lowFe_KTKB_Day5 | 0.004170 | -0.493 |
| Title | Cluster Plot | Dendrogram | e-value | e-value | e-value | Condition | Condition FDR | Condition Difference |
|---|---|---|---|---|---|---|---|---|
| Thaps_hclust_0060 |
 |
 |
0.00000047 |
0.00077 |
0.0075 |
lowFe_KTKB_Day5 | 0.004170 | 0.433 |
| Title | Cluster Plot | Dendrogram | e-value | e-value | e-value | Condition | Condition FDR | Condition Difference |
|---|---|---|---|---|---|---|---|---|
| Thaps_hclust_0003 |
 |
 |
0.24 |
16 |
240 |
lowFe_KTKB_Day5 | 0.004170 | -0.633 |
| Title | Cluster Plot | Dendrogram | e-value | e-value | e-value | Condition | Condition FDR | Condition Difference |
|---|---|---|---|---|---|---|---|---|
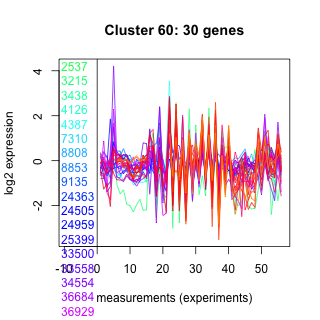
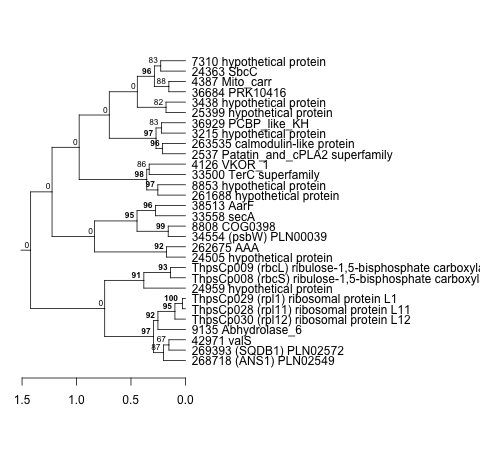
| Thaps_hclust_0221 |
 |
|
|
1e-37 |
0.0000000000012 |
diel_exponential_vs_stationary | 0.004250 | -0.226 |
| Title | Cluster Plot | Dendrogram | e-value | e-value | e-value | Condition | Condition FDR | Condition Difference |
|---|---|---|---|---|---|---|---|---|
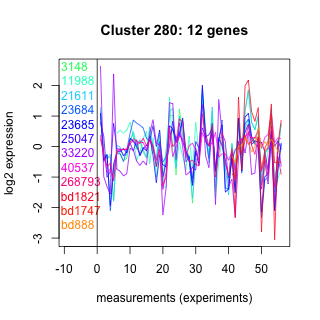
| Thaps_hclust_0280 |
 |
 |
0.75 |
0.64 |
81 |
diel_exponential_vs_stationary | 0.004250 | 0.708 |
| Title | Cluster Plot | Dendrogram | e-value | e-value | e-value | Condition | Condition FDR | Condition Difference |
|---|---|---|---|---|---|---|---|---|
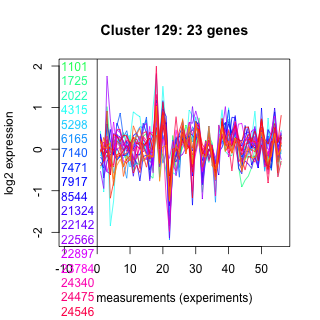
| Thaps_hclust_0129 |
 |
 |
0.015 |
0.29 |
1 |
diel_exponential_vs_stationary | 0.004250 | -0.48 |
| Title | Cluster Plot | Dendrogram | e-value | e-value | e-value | Condition | Condition FDR | Condition Difference |
|---|---|---|---|---|---|---|---|---|
| Thaps_hclust_0343 |
 |
 |
9.7e-16 |
0.000000023 |
0.0000000024 |
lowFe_KTKB_Day3 | 0.004290 | -0.509 |
| Title | Cluster Plot | Dendrogram | e-value | e-value | e-value | Condition | Condition FDR | Condition Difference |
|---|---|---|---|---|---|---|---|---|
| Thaps_hclust_0110 |
 |
 |
0.64 |
35 |
160 |
BaP | 0.004310 | 1.03 |
| Title | Cluster Plot | Dendrogram | e-value | e-value | e-value | Condition | Condition FDR | Condition Difference |
|---|---|---|---|---|---|---|---|---|
| Thaps_hclust_0269 |
 |
 |
0.0025 |
0.032 |
0.077 |
BaP | 0.004310 | -0.546 |
| Title | Cluster Plot | Dendrogram | e-value | e-value | e-value | Condition | Condition FDR | Condition Difference |
|---|---|---|---|---|---|---|---|---|
| Thaps_hclust_0390 |
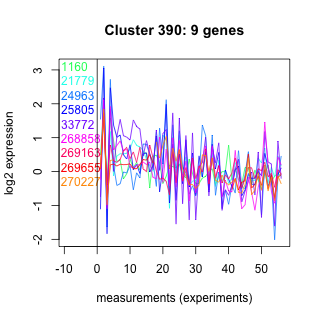 |
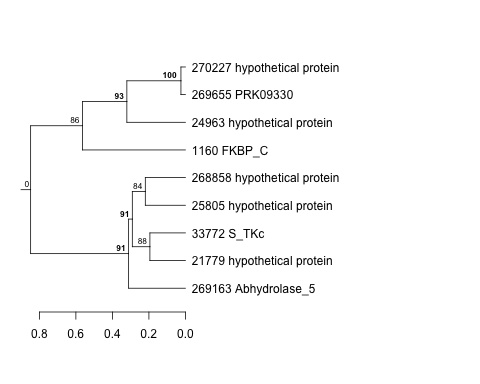 |
0.013 |
0.066 |
0.15 |
lowSi_TMEVA | 0.004350 | 1.45 |
| Title | Cluster Plot | Dendrogram | e-value | e-value | e-value | Condition | Condition FDR | Condition Difference |
|---|---|---|---|---|---|---|---|---|
| Thaps_hclust_0212 |
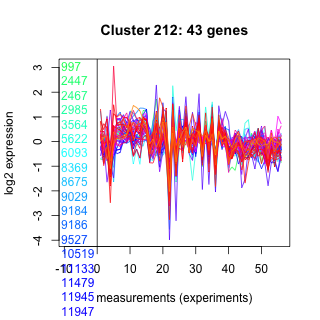 |
 |
2.5e-17 |
0.000019 |
0.027 |
lowSi_TMEVA | 0.004350 | -0.754 |
| Title | Cluster Plot | Dendrogram | e-value | e-value | e-value | Condition | Condition FDR | Condition Difference |
|---|---|---|---|---|---|---|---|---|
| Thaps_hclust_0032 |
 |
 |
1.3e-16 |
0.00000035 |
0.00012 |
lowSi_TMEVA | 0.004350 | -0.805 |
| Title | Cluster Plot | Dendrogram | e-value | e-value | e-value | Condition | Condition FDR | Condition Difference |
|---|---|---|---|---|---|---|---|---|
| Thaps_hclust_0301 |
 |
 |
0.000000022 |
0.82 |
2.1 |
lowtemp_TMEVA | 0.004380 | -0.522 |
| Title | Cluster Plot | Dendrogram | e-value | e-value | e-value | Condition | Condition FDR | Condition Difference |
|---|---|---|---|---|---|---|---|---|
| Thaps_hclust_0001 |
 |
 |
0.0033 |
0.052 |
2 |
co2_elevated_stat_arrays | 0.004460 | 0.578 |
| Title | Cluster Plot | Dendrogram | e-value | e-value | e-value | Condition | Condition FDR | Condition Difference |
|---|---|---|---|---|---|---|---|---|
| Thaps_hclust_0080 |
 |
 |
0.000037 |
0.000075 |
0.96 |
co2_elevated_stat_arrays | 0.004460 | 0.528 |
| Title | Cluster Plot | Dendrogram | e-value | e-value | e-value | Condition | Condition FDR | Condition Difference |
|---|---|---|---|---|---|---|---|---|
| Thaps_hclust_0154 |
 |
 |
0.00015 |
0.0049 |
0.29 |
co2_elevated_stat_arrays | 0.004460 | -0.539 |
| Title | Cluster Plot | Dendrogram | e-value | e-value | e-value | Condition | Condition FDR | Condition Difference |
|---|---|---|---|---|---|---|---|---|
| Thaps_hclust_0004 |
 |
 |
0.000000074 |
0.0000031 |
0.0000044 |
co2_elevated_stat_arrays | 0.004460 | 0.469 |
| Title | Cluster Plot | Dendrogram | e-value | e-value | e-value | Condition | Condition FDR | Condition Difference |
|---|---|---|---|---|---|---|---|---|
| Thaps_hclust_0039 |
 |
 |
2.2e-16 |
0.000000000000049 |
0.00083 |
exponential_vs_stationary_24light | 0.004500 | 0.559 |
| Title | Cluster Plot | Dendrogram | e-value | e-value | e-value | Condition | Condition FDR | Condition Difference |
|---|---|---|---|---|---|---|---|---|
| Thaps_hclust_0235 |
 |
 |
0.47 |
5.6 |
74 |
diel_light_vs_dark | 0.004510 | -0.789 |
| Thaps_hclust_0235 |
|
|
0.47 |
5.6 |
74 |
BaP | 0.004570 | 0.834 |
| Title | Cluster Plot | Dendrogram | e-value | e-value | e-value | Condition | Condition FDR | Condition Difference |
|---|---|---|---|---|---|---|---|---|
| Thaps_hclust_0120 |
 |
 |
0.00000098 |
0.000000076 |
0.001 |
diel_exponential_vs_stationary | 0.004550 | -0.479 |
| Thaps_hclust_0120 |
|
|
0.00000098 |
0.000000076 |
0.001 |
lowFe_KTKB_Day3 | 0.005630 | -0.54 |
| Title | Cluster Plot | Dendrogram | e-value | e-value | e-value | Condition | Condition FDR | Condition Difference |
|---|---|---|---|---|---|---|---|---|
| Thaps_hclust_0136 |
 |
 |
0.0034 |
0.034 |
340 |
diel_exponential_vs_stationary | 0.004550 | -0.399 |
| Title | Cluster Plot | Dendrogram | e-value | e-value | e-value | Condition | Condition FDR | Condition Difference |
|---|---|---|---|---|---|---|---|---|
| Thaps_hclust_0214 |
 |
 |
0.00006 |
0.0000000031 |
0.00076 |
diel_exponential_vs_stationary | 0.004550 | -0.291 |
| Title | Cluster Plot | Dendrogram | e-value | e-value | e-value | Condition | Condition FDR | Condition Difference |
|---|---|---|---|---|---|---|---|---|
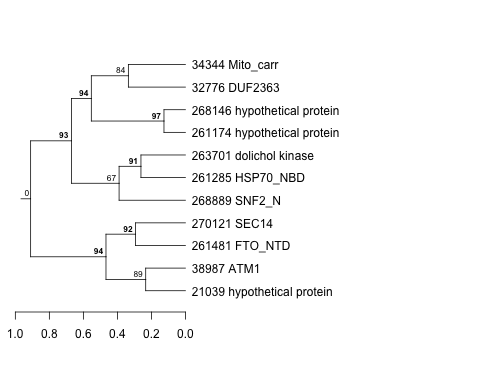
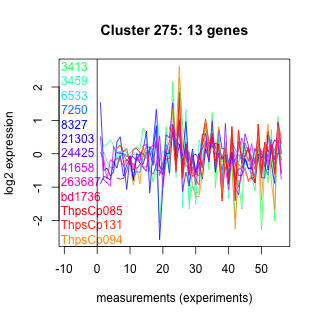
| Thaps_hclust_0275 |
 |
 |
Not available | Not available | Not available | diel_exponential_vs_stationary | 0.004550 | 0.599 |
| Title | Cluster Plot | Dendrogram | e-value | e-value | e-value | Condition | Condition FDR | Condition Difference |
|---|---|---|---|---|---|---|---|---|
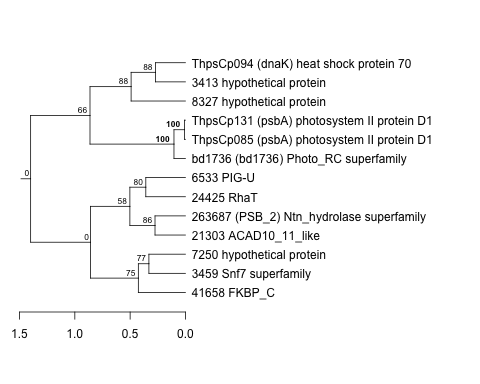
| Thaps_hclust_0141 |
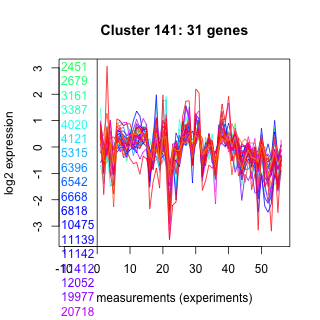 |
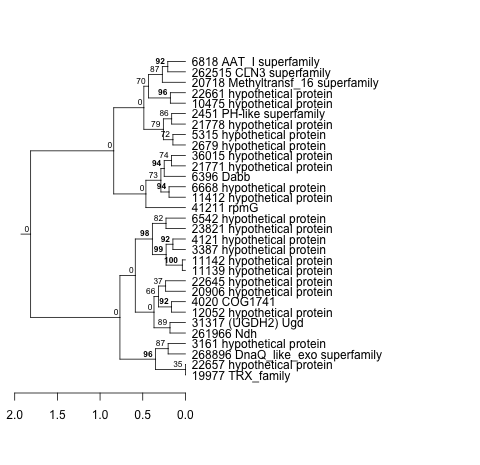 |
0.000021 |
0.0007 |
0.0051 |
lowFe_TMEVA | 0.004550 | -0.549 |
| Thaps_hclust_0141 |
|
|
0.000021 |
0.0007 |
0.0051 |
highpH_TMEVA | 0.005910 | 0.345 |
| Title | Cluster Plot | Dendrogram | e-value | e-value | e-value | Condition | Condition FDR | Condition Difference |
|---|---|---|---|---|---|---|---|---|
| Thaps_hclust_0005 |
 |
 |
0.00013 |
0.0027 |
2 |
highpH_TMEVA | 0.004550 | 0.454 |
| Title | Cluster Plot | Dendrogram | e-value | e-value | e-value | Condition | Condition FDR | Condition Difference |
|---|---|---|---|---|---|---|---|---|
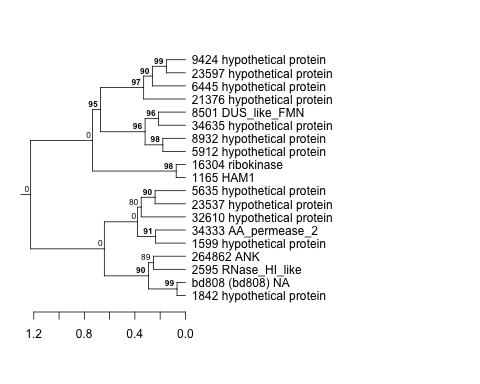
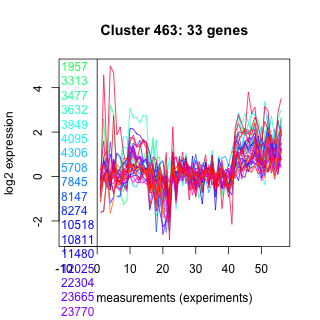
| Thaps_hclust_0463 |
 |
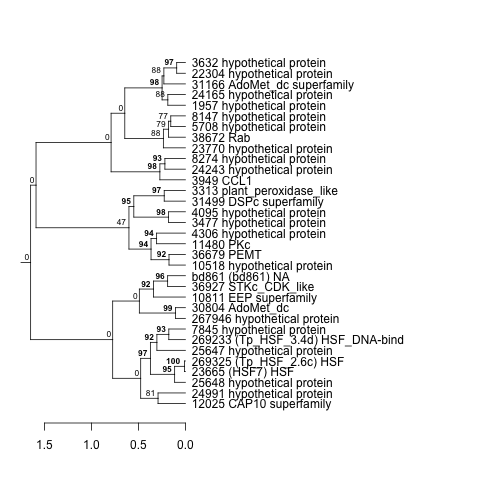 |
0.0000000063 |
0.000000075 |
0.78 |
exponential_vs_stationary_24highlight | 0.004690 | -0.22 |
| Thaps_hclust_0463 |
|
|
0.0000000063 |
0.000000075 |
0.78 |
co2_elevated_stat_arrays | 0.005610 | 0.444 |
| Title | Cluster Plot | Dendrogram | e-value | e-value | e-value | Condition | Condition FDR | Condition Difference |
|---|---|---|---|---|---|---|---|---|
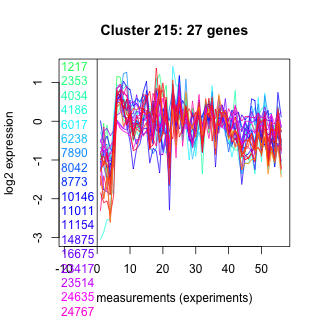
| Thaps_hclust_0215 |
 |
 |
0.000036 |
0.0000076 |
0.000057 |
diel_light_vs_dark | 0.004840 | 0.471 |
| Title | Cluster Plot | Dendrogram | e-value | e-value | e-value | Condition | Condition FDR | Condition Difference |
|---|---|---|---|---|---|---|---|---|
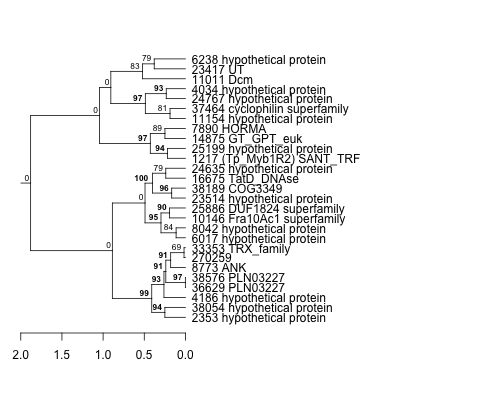
| Thaps_hclust_0380 |
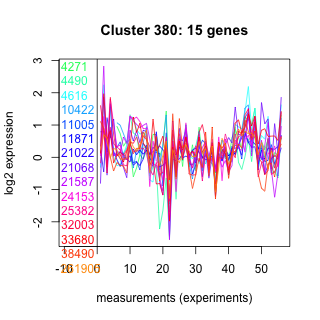 |
 |
1.1 |
5 |
8.7 |
diel_light_vs_dark | 0.004840 | 0.624 |
| Thaps_hclust_0380 |
|
|
1.1 |
5 |
8.7 |
highlight_arrays | 0.005480 | 0.483 |
| Title | Cluster Plot | Dendrogram | e-value | e-value | e-value | Condition | Condition FDR | Condition Difference |
|---|---|---|---|---|---|---|---|---|
| Thaps_hclust_0227 |
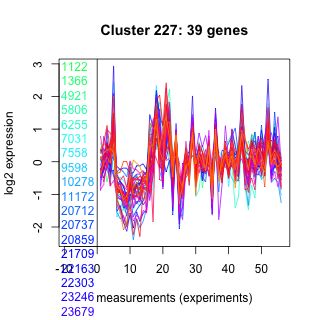 |
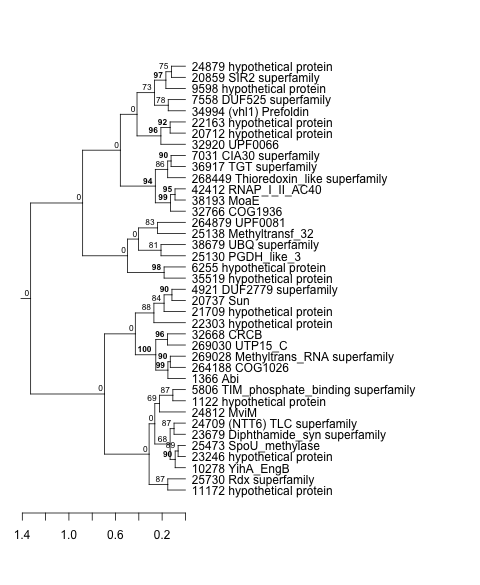 |
1.2e-22 |
0.0000000098 |
0.0018 |
co2_elevated_stat_arrays | 0.004850 | 0.447 |
| Title | Cluster Plot | Dendrogram | e-value | e-value | e-value | Condition | Condition FDR | Condition Difference |
|---|---|---|---|---|---|---|---|---|
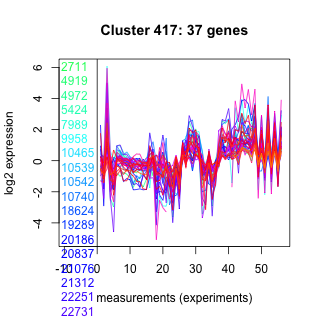
| Thaps_hclust_0417 |
 |
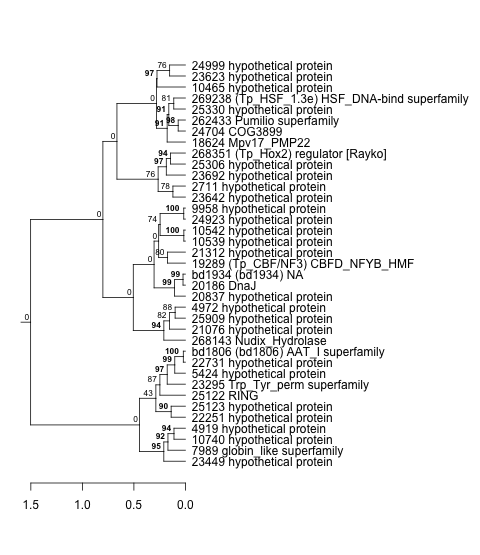 |
0.0000000018 |
0.00013 |
0.00029 |
co2_elevated_stat_arrays | 0.004850 | 0.43 |
| Title | Cluster Plot | Dendrogram | e-value | e-value | e-value | Condition | Condition FDR | Condition Difference |
|---|---|---|---|---|---|---|---|---|
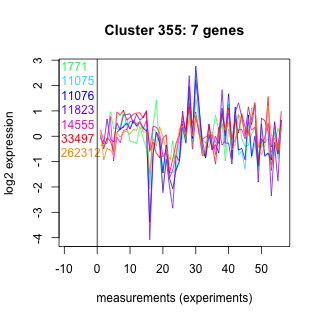
| Thaps_hclust_0355 |
 |
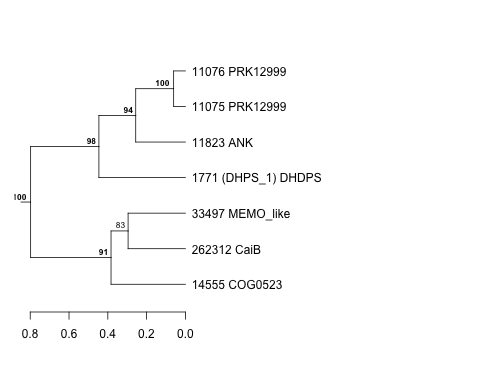 |
0.49 |
16 |
310 |
co2_elevated_expo_arrays | 0.004880 | 0.605 |
| Title | Cluster Plot | Dendrogram | e-value | e-value | e-value | Condition | Condition FDR | Condition Difference |
|---|---|---|---|---|---|---|---|---|
| Thaps_hclust_0492 |
 |
 |
0.29 |
0.47 |
23 |
co2_elevated_expo_arrays | 0.004880 | 0.429 |
| Title | Cluster Plot | Dendrogram | e-value | e-value | e-value | Condition | Condition FDR | Condition Difference |
|---|---|---|---|---|---|---|---|---|
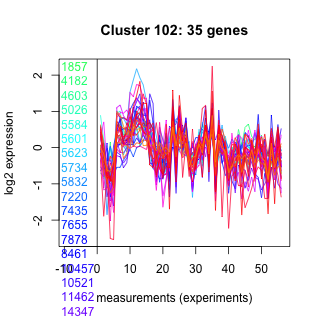
| Thaps_hclust_0102 |
 |
 |
3.2e-16 |
0.00000000002 |
0.0000006 |
lowN_TMEVA | 0.004900 | -0.653 |
| Title | Cluster Plot | Dendrogram | e-value | e-value | e-value | Condition | Condition FDR | Condition Difference |
|---|---|---|---|---|---|---|---|---|
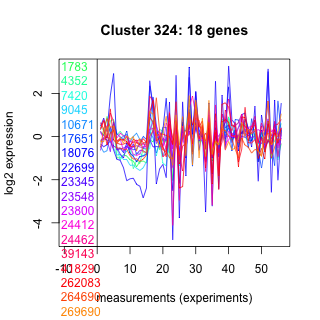
| Thaps_hclust_0324 |
 |
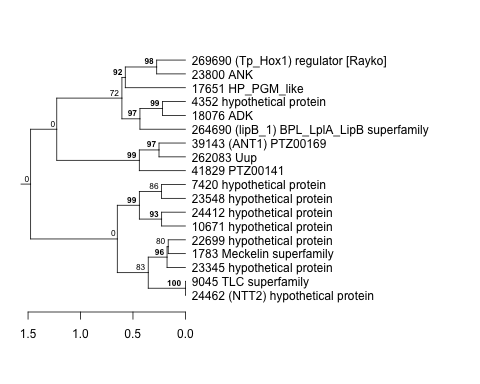 |
0.0023 |
2.4 |
5.1 |
diel_exponential_vs_stationary | 0.004950 | -0.537 |
| Title | Cluster Plot | Dendrogram | e-value | e-value | e-value | Condition | Condition FDR | Condition Difference |
|---|---|---|---|---|---|---|---|---|
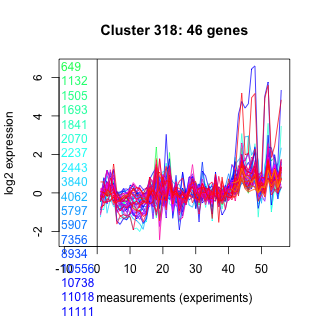
| Thaps_hclust_0318 |
 |
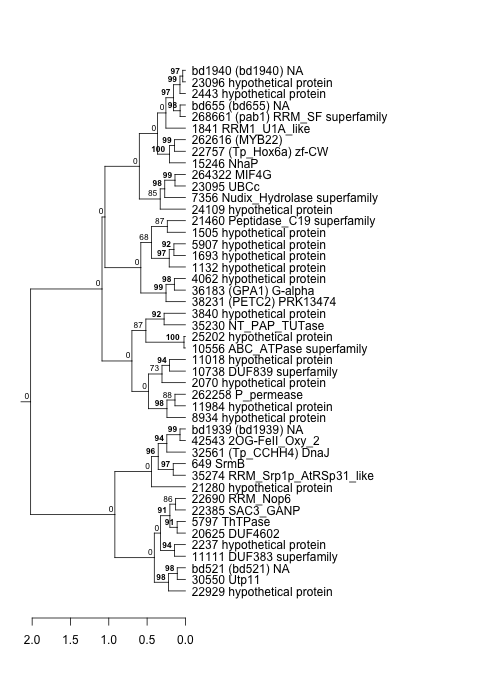 |
1.1e-17 |
0.000000015 |
0.0000081 |
highpH_TMEVA | 0.005060 | -0.3 |
| Title | Cluster Plot | Dendrogram | e-value | e-value | e-value | Condition | Condition FDR | Condition Difference |
|---|---|---|---|---|---|---|---|---|
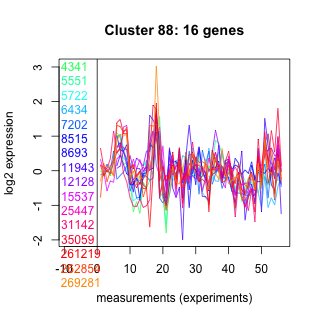
| Thaps_hclust_0088 |
 |
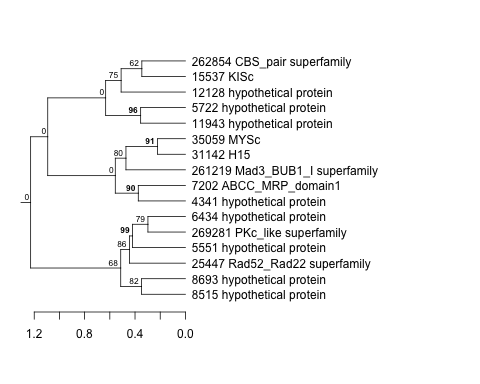 |
0.036 |
27 |
18 |
lowFe_KTKB_Day5 | 0.005100 | 0.648 |
| Title | Cluster Plot | Dendrogram | e-value | e-value | e-value | Condition | Condition FDR | Condition Difference |
|---|---|---|---|---|---|---|---|---|
| Thaps_hclust_0109 |
 |
 |
17 |
32 |
5.5 |
BaP | 0.005110 | 0.764 |
| Title | Cluster Plot | Dendrogram | e-value | e-value | e-value | Condition | Condition FDR | Condition Difference |
|---|---|---|---|---|---|---|---|---|
| Thaps_hclust_0202 |
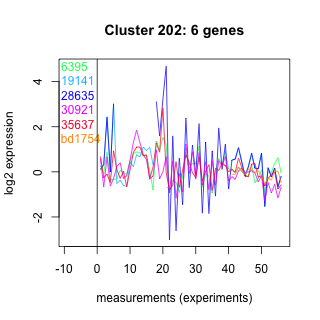 |
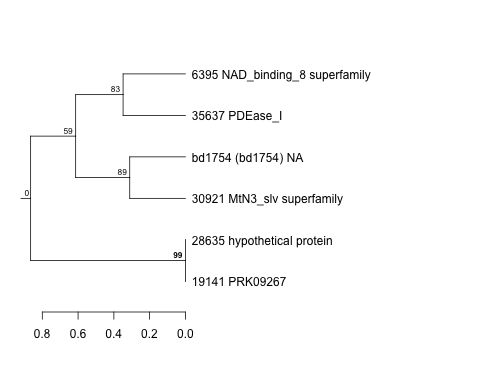 |
0.0064 |
0.023 |
0.32 |
diel_light_vs_dark | 0.005160 | 1.06 |
| Title | Cluster Plot | Dendrogram | e-value | e-value | e-value | Condition | Condition FDR | Condition Difference |
|---|---|---|---|---|---|---|---|---|
| Thaps_hclust_0033 |
 |
 |
0.000000000000011 |
0.0012 |
0.0073 |
diel_light_vs_dark | 0.005160 | -0.32 |
| Title | Cluster Plot | Dendrogram | e-value | e-value | e-value | Condition | Condition FDR | Condition Difference |
|---|---|---|---|---|---|---|---|---|
| Thaps_hclust_0384 |
 |
 |
0.0000000074 |
0.000000031 |
0.12 |
highlight_arrays | 0.005170 | -0.319 |
| Title | Cluster Plot | Dendrogram | e-value | e-value | e-value | Condition | Condition FDR | Condition Difference |
|---|---|---|---|---|---|---|---|---|
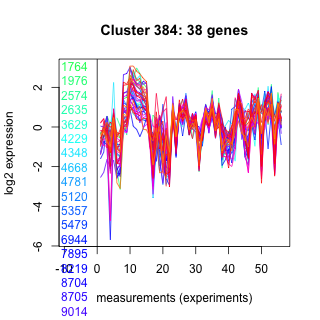
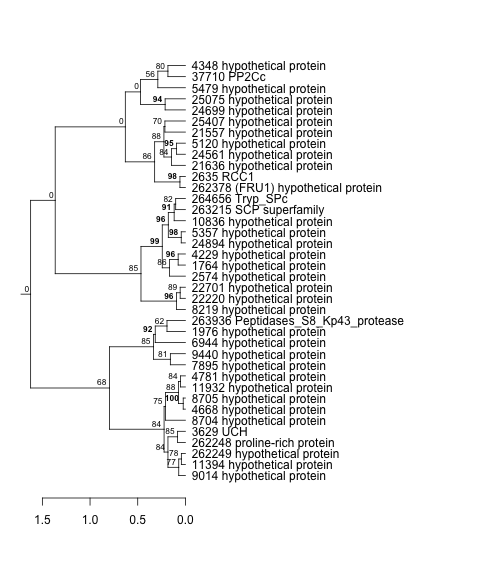
| Thaps_hclust_0419 |
 |
 |
0.0014 |
0.00031 |
0.0014 |
highlight_arrays | 0.005170 | 0.595 |
| Title | Cluster Plot | Dendrogram | e-value | e-value | e-value | Condition | Condition FDR | Condition Difference |
|---|---|---|---|---|---|---|---|---|
| Thaps_hclust_0464 |
 |
 |
0.0002 |
14 |
31 |
co2_elevated_stat_arrays | 0.005290 | 0.497 |
| Title | Cluster Plot | Dendrogram | e-value | e-value | e-value | Condition | Condition FDR | Condition Difference |
|---|---|---|---|---|---|---|---|---|
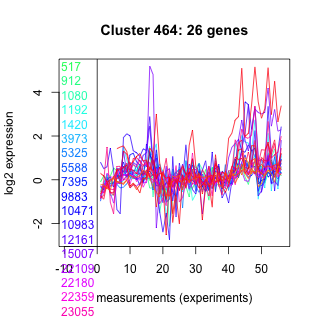
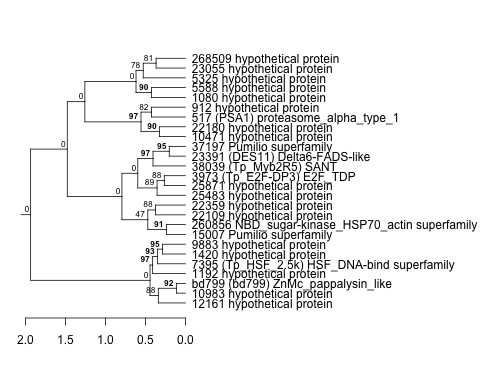
| Thaps_hclust_0396 |
 |
 |
0.082 |
10 |
29 |
diel_exponential_vs_stationary | 0.005310 | -0.407 |
| Title | Cluster Plot | Dendrogram | e-value | e-value | e-value | Condition | Condition FDR | Condition Difference |
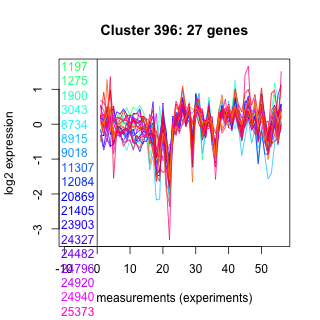
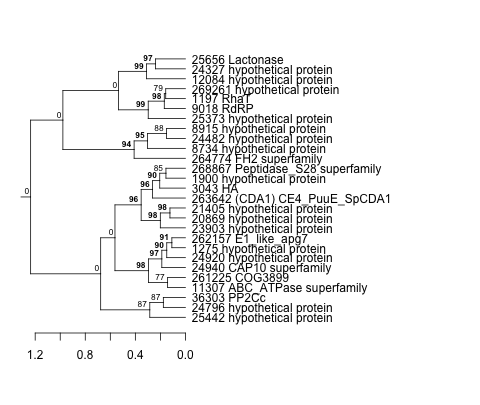
|---|---|---|---|---|---|---|---|---|
| Thaps_hclust_0389 |
 |
 |
0.00000008 |
0.00077 |
340 |
BaP | 0.005340 | -0.534 |
| Title | Cluster Plot | Dendrogram | e-value | e-value | e-value | Condition | Condition FDR | Condition Difference |
|---|---|---|---|---|---|---|---|---|
| Thaps_hclust_0116 |
 |
 |
0.74 |
8.1 |
4.9 |
BaP | 0.005340 | -0.65 |
| Title | Cluster Plot | Dendrogram | e-value | e-value | e-value | Condition | Condition FDR | Condition Difference |
|---|---|---|---|---|---|---|---|---|
| Thaps_hclust_0020 |
 |
 |
0.004 |
0.15 |
3.3 |
lowFe_TMEVA | 0.005360 | -0.604 |
| Title | Cluster Plot | Dendrogram | e-value | e-value | e-value | Condition | Condition FDR | Condition Difference |
|---|---|---|---|---|---|---|---|---|
| Thaps_hclust_0207 |
 |
 |
0.0000000025 |
0.0000000037 |
0.1 |
exponential_vs_stationary_24light | 0.005390 | 0.673 |
| Title | Cluster Plot | Dendrogram | e-value | e-value | e-value | Condition | Condition FDR | Condition Difference |
|---|---|---|---|---|---|---|---|---|
| Thaps_hclust_0135 |
 |
 |
0.0000000028 |
0.0077 |
0.17 |
diel_light_vs_dark | 0.005470 | 0.385 |
| Title | Cluster Plot | Dendrogram | e-value | e-value | e-value | Condition | Condition FDR | Condition Difference |
|---|---|---|---|---|---|---|---|---|
| Thaps_hclust_0019 |
 |
 |
0.0000001 |
0.00000017 |
0.000037 |
BaP | 0.005590 | -0.532 |
| Title | Cluster Plot | Dendrogram | e-value | e-value | e-value | Condition | Condition FDR | Condition Difference |
|---|---|---|---|---|---|---|---|---|
| Thaps_hclust_0395 |
 |
 |
0.0015 |
0.0018 |
0.48 |
co2_elevated_stat_arrays | 0.005610 | -0.469 |
| Title | Cluster Plot | Dendrogram | e-value | e-value | e-value | Condition | Condition FDR | Condition Difference |
|---|---|---|---|---|---|---|---|---|
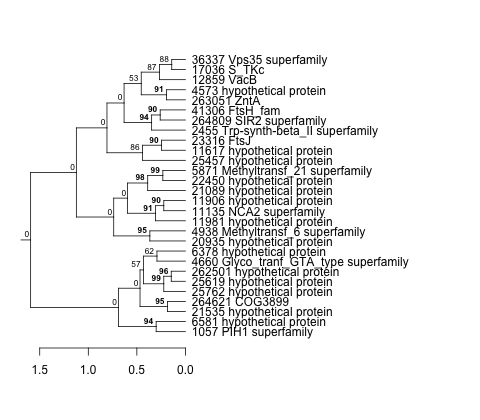
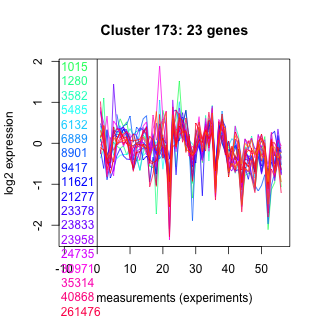
| Thaps_hclust_0173 |
 |
 |
0.013 |
0.83 |
0.45 |
co2_elevated_stat_arrays | 0.005610 | -0.526 |
| Title | Cluster Plot | Dendrogram | e-value | e-value | e-value | Condition | Condition FDR | Condition Difference |
|---|---|---|---|---|---|---|---|---|
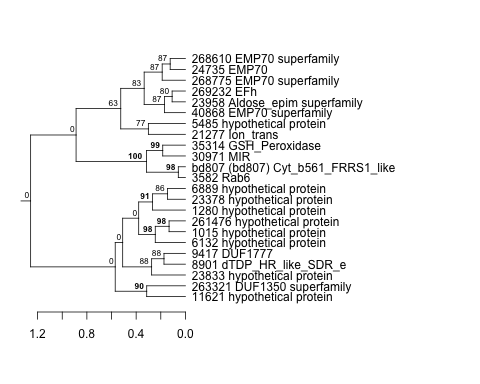
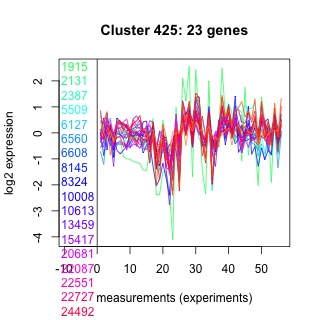
| Thaps_hclust_0425 |
 |
 |
0.017 |
1.1 |
140 |
diel_light_vs_dark | 0.005770 | -0.496 |
| Title | Cluster Plot | Dendrogram | e-value | e-value | e-value | Condition | Condition FDR | Condition Difference |
|---|---|---|---|---|---|---|---|---|
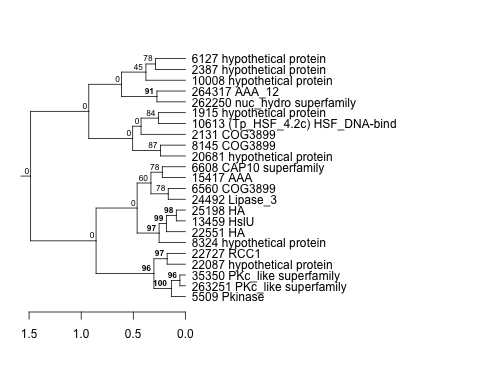
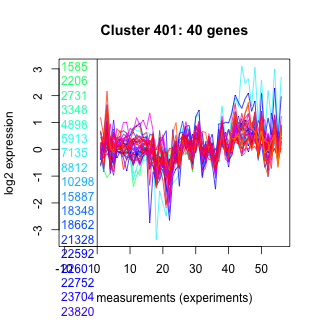
| Thaps_hclust_0401 |
 |
 |
3.5e-16 |
0.000000000077 |
0.000000012 |
lowN_TMEVA | 0.005770 | 0.607 |
| Title | Cluster Plot | Dendrogram | e-value | e-value | e-value | Condition | Condition FDR | Condition Difference |
|---|---|---|---|---|---|---|---|---|
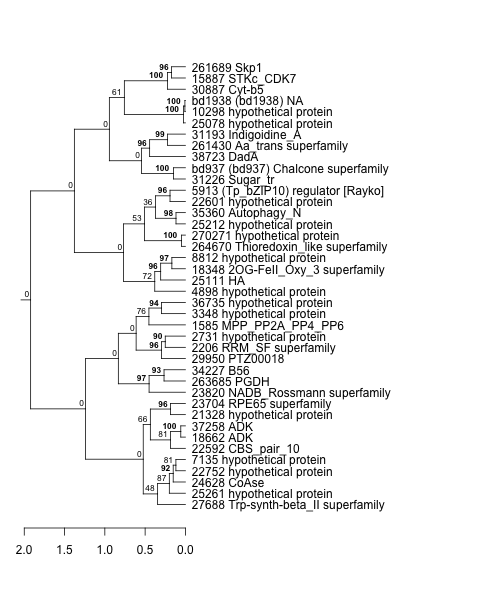
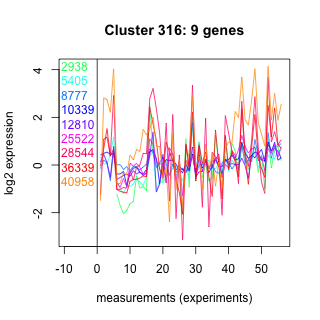
| Thaps_hclust_0316 |
 |
 |
0.14 |
2.2 |
4.4 |
diel_light_vs_dark | 0.005770 | 0.836 |
| Title | Cluster Plot | Dendrogram | e-value | e-value | e-value | Condition | Condition FDR | Condition Difference |
|---|---|---|---|---|---|---|---|---|
| Thaps_hclust_0391 |
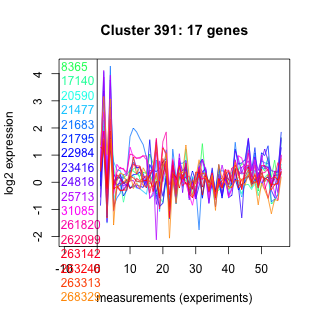 |
 |
1.9 |
34 |
32 |
exponential_vs_stationary_24highlight | 0.005770 | -0.321 |
| Title | Cluster Plot | Dendrogram | e-value | e-value | e-value | Condition | Condition FDR | Condition Difference |
|---|---|---|---|---|---|---|---|---|
| Thaps_hclust_0114 |
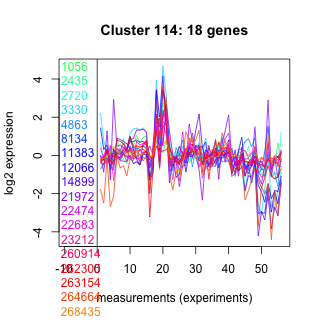 |
 |
0.086 |
4.8 |
3.2 |
exponential_vs_stationary_24highlight | 0.005770 | -0.312 |
| Title | Cluster Plot | Dendrogram | e-value | e-value | e-value | Condition | Condition FDR | Condition Difference |
|---|---|---|---|---|---|---|---|---|
| Thaps_hclust_0150 |
 |
 |
0.16 |
0.73 |
6.8 |
BaP | 0.005830 | -0.677 |
| Title | Cluster Plot | Dendrogram | e-value | e-value | e-value | Condition | Condition FDR | Condition Difference |
|---|---|---|---|---|---|---|---|---|
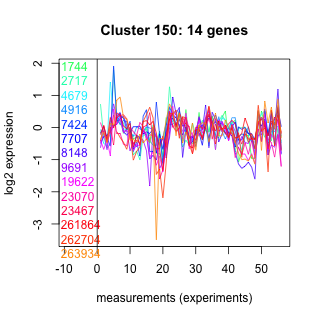
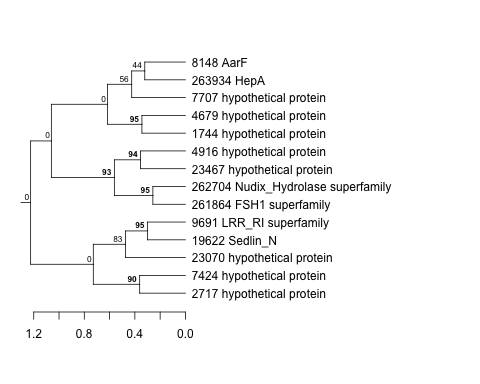
| Thaps_hclust_0232 |
 |
 |
9.2e-16 |
0.000000000000019 |
0.35 |
highpH_TMEVA | 0.005910 | -0.315 |
| Title | Cluster Plot | Dendrogram | e-value | e-value | e-value | Condition | Condition FDR | Condition Difference |
|---|---|---|---|---|---|---|---|---|
| Thaps_hclust_0309 |
 |
 |
0.0000055 |
0.015 |
1.1 |
highpH_TMEVA | 0.005910 | 0.485 |
| Title | Cluster Plot | Dendrogram | e-value | e-value | e-value | Condition | Condition FDR | Condition Difference |
|---|---|---|---|---|---|---|---|---|
| Thaps_hclust_0078 |
 |
 |
8.1e-17 |
0.00018 |
0.021 |
co2_elevated_expo_arrays | 0.005950 | 0.316 |
| Title | Cluster Plot | Dendrogram | e-value | e-value | e-value | Condition | Condition FDR | Condition Difference |
|---|---|---|---|---|---|---|---|---|
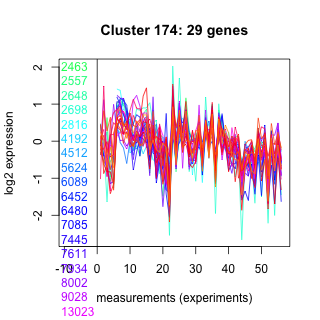
| Thaps_hclust_0174 |
 |
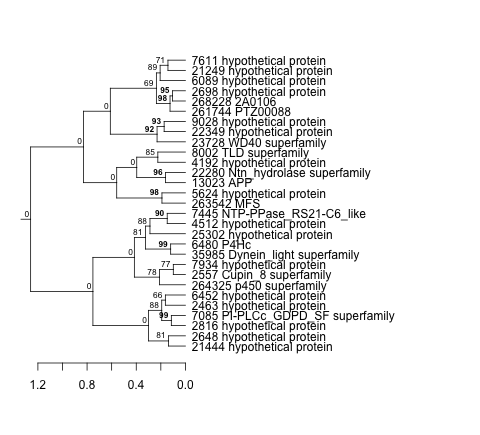 |
1.3 |
0.99 |
2.2 |
co2_elevated_stat_arrays | 0.006020 | -0.469 |
| Title | Cluster Plot | Dendrogram | e-value | e-value | e-value | Condition | Condition FDR | Condition Difference |
|---|---|---|---|---|---|---|---|---|
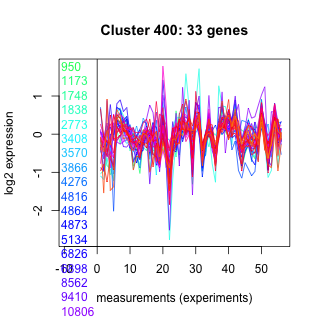
| Thaps_hclust_0400 |
 |
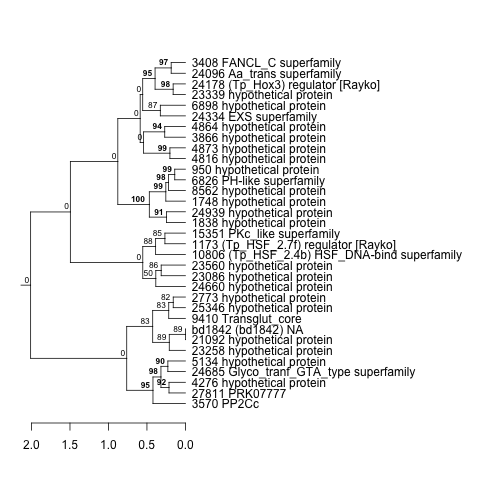 |
Not available | Not available | Not available | lowFe_TMEVA | 0.006030 | -0.5 |