Hierarchical Clusters
Displaying 1801 - 1900 of 7500
| Title | Cluster Plot | Dendrogram | e-value | e-value | e-value | Condition | Condition FDR | Condition Difference |
|---|---|---|---|---|---|---|---|---|
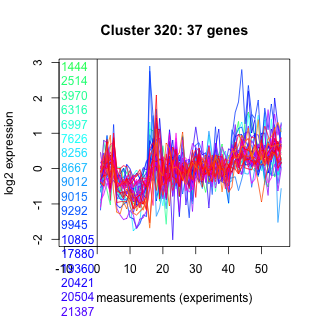
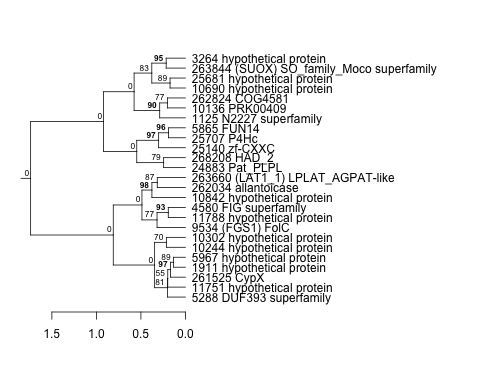
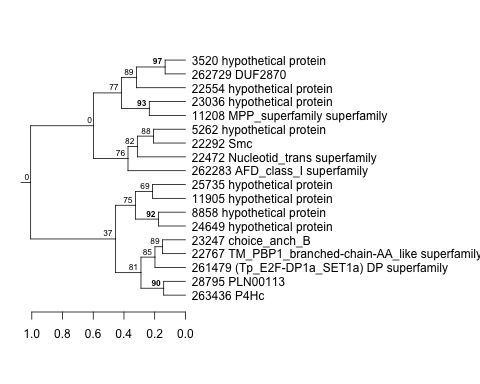
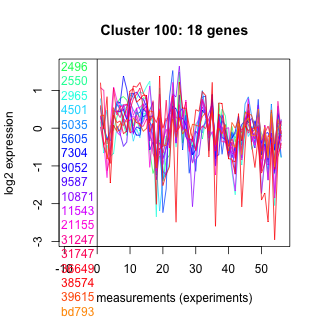
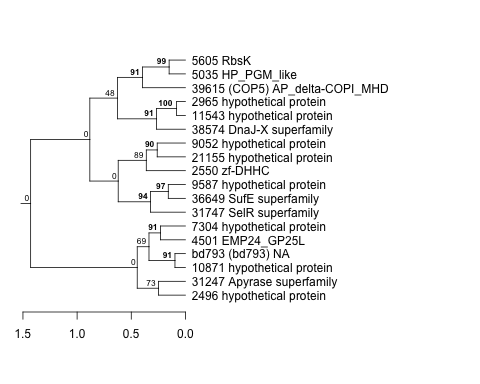
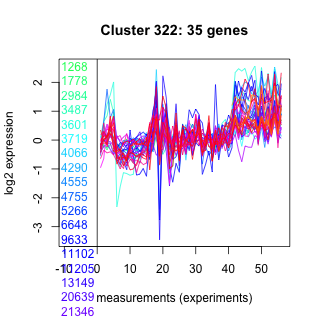
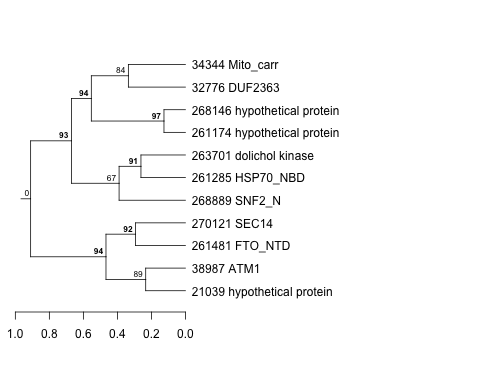
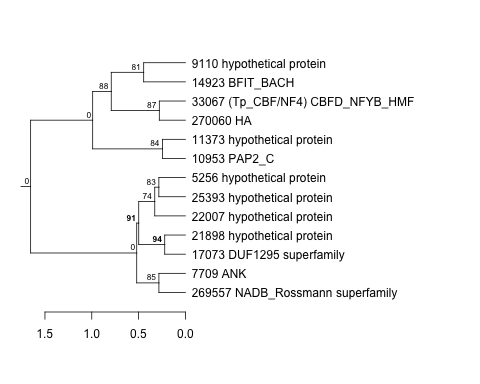
| Thaps_hclust_0320 |
 |
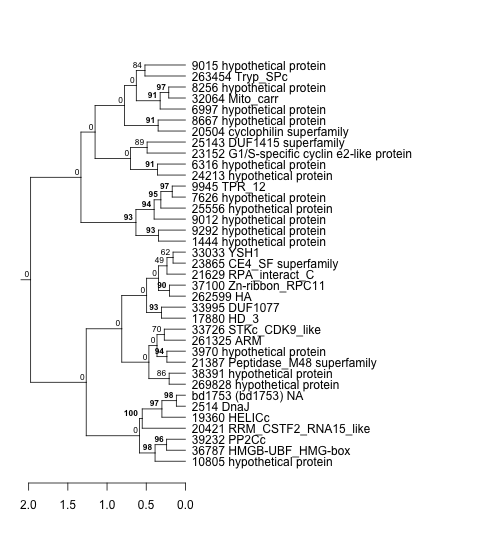 |
0.0000055 |
0.32 |
8.8 |
lowFe_KTKB_Day5 | 0.024300 | 0.301 |
| Title | Cluster Plot | Dendrogram | e-value | e-value | e-value | Condition | Condition FDR | Condition Difference |
|---|---|---|---|---|---|---|---|---|
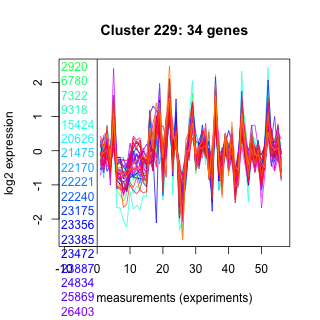
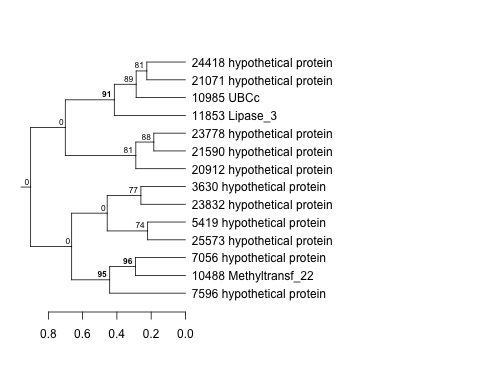
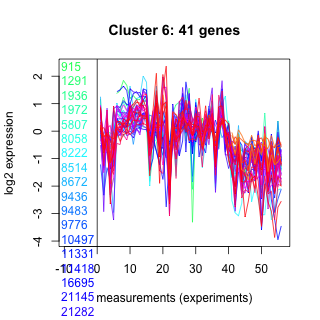
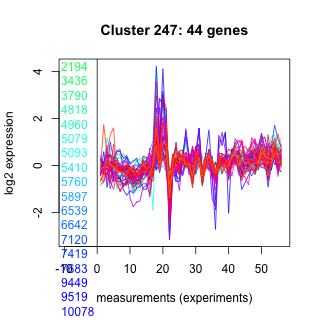
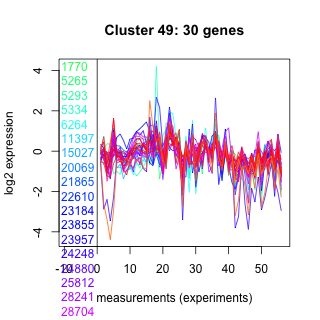
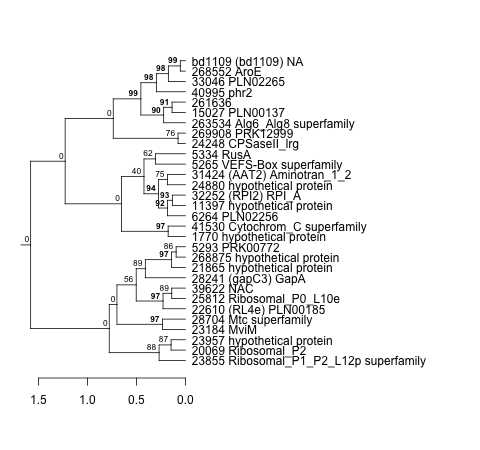
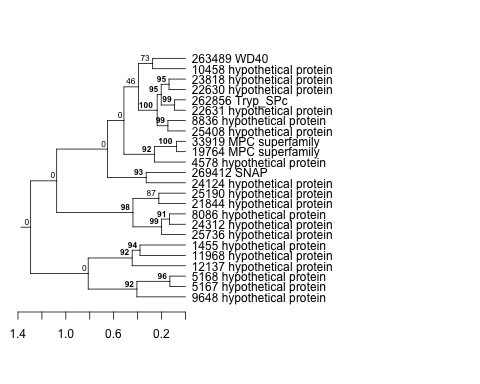
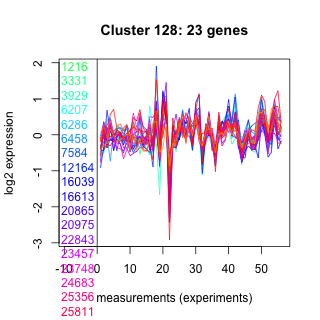
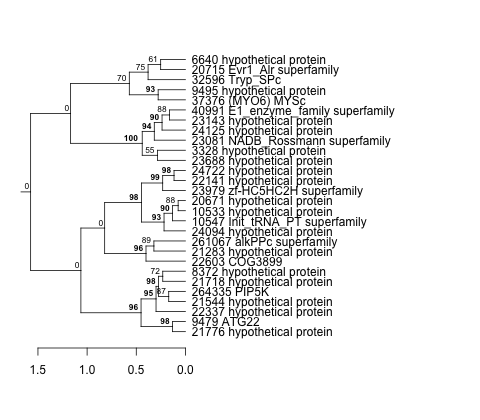
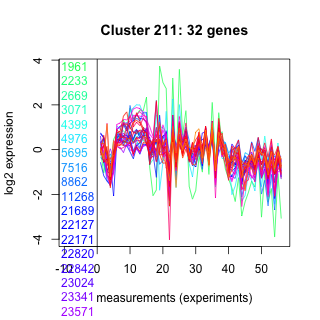
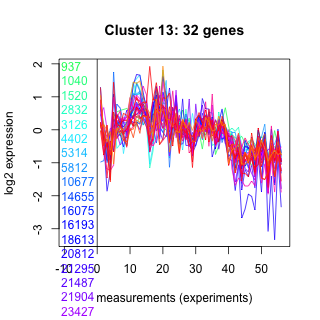
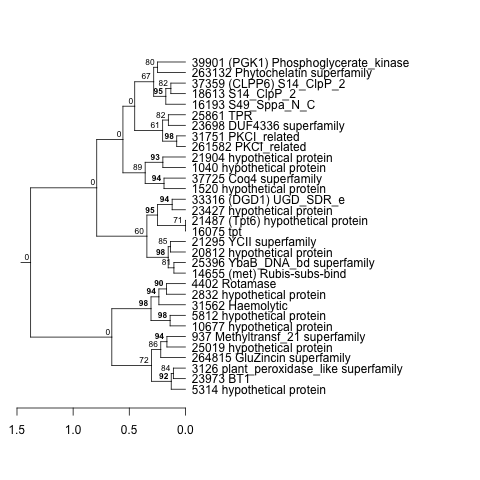
| Thaps_hclust_0229 |
 |
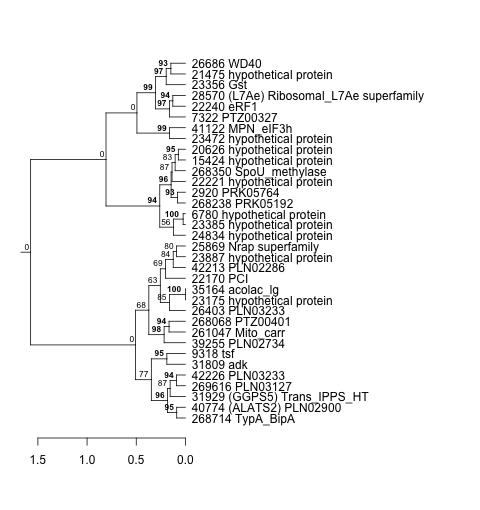 |
9.9e-18 |
0.000000000000034 |
0.0000002 |
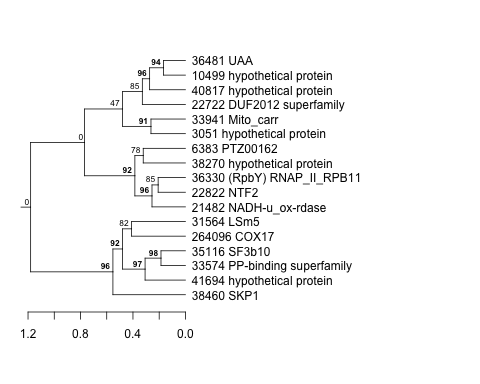
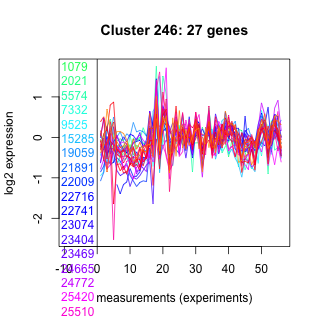
exponential_vs_stationary_24highlight | 0.024400 | 0.176 |
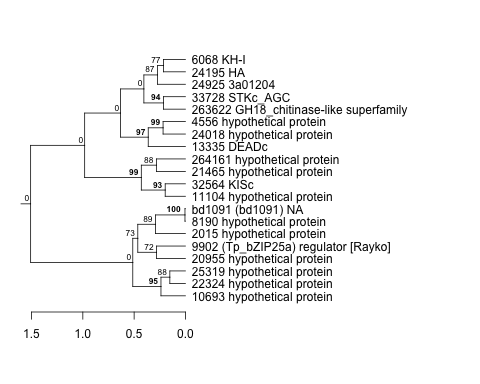
| Thaps_hclust_0229 |
|
|
9.9e-18 |
0.000000000000034 |
0.0000002 |
BaP | 0.029500 | 0.342 |
| Title | Cluster Plot | Dendrogram | e-value | e-value | e-value | Condition | Condition FDR | Condition Difference |
|---|---|---|---|---|---|---|---|---|
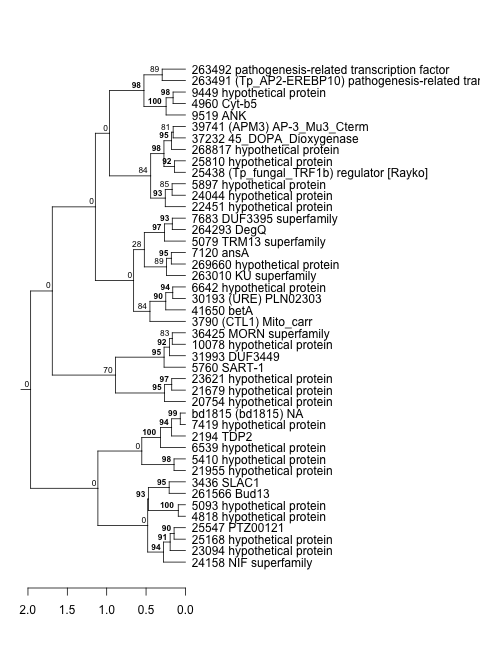
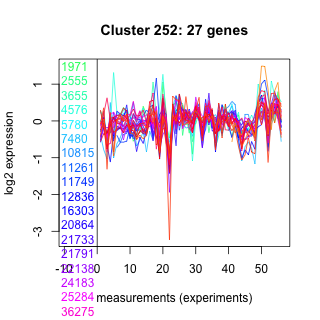
| Thaps_hclust_0075 |
 |
 |
0.069 |
53 |
33 |
exponential_vs_stationary_24highlight | 0.024500 | 0.311 |
| Title | Cluster Plot | Dendrogram | e-value | e-value | e-value | Condition | Condition FDR | Condition Difference |
|---|---|---|---|---|---|---|---|---|
| Thaps_hclust_0330 |
 |
 |
0.0000058 |
0.00000085 |
0.000041 |
co2_elevated_expo_arrays | 0.024600 | 0.257 |
| Title | Cluster Plot | Dendrogram | e-value | e-value | e-value | Condition | Condition FDR | Condition Difference |
|---|---|---|---|---|---|---|---|---|
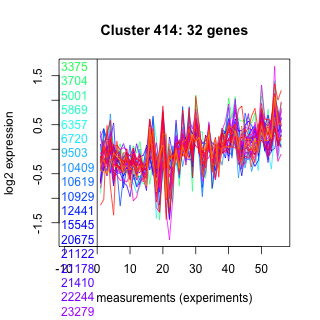
| Thaps_hclust_0414 |
 |
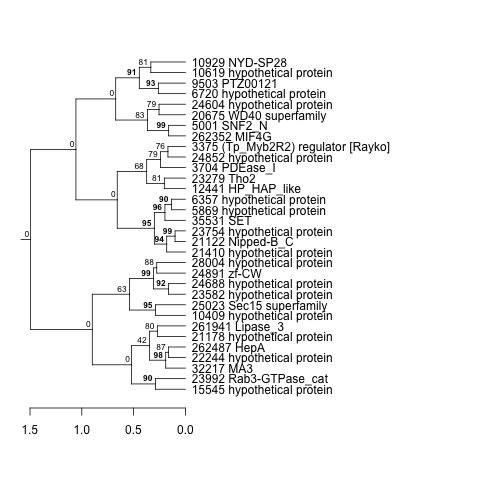 |
0.0000000000028 |
0.00000026 |
0.000019 |
highpH_TMEVA | 0.024600 | -0.284 |
| Thaps_hclust_0414 |
|
|
0.0000000000028 |
0.00000026 |
0.000019 |
BaP | 0.029900 | -0.355 |
| Title | Cluster Plot | Dendrogram | e-value | e-value | e-value | Condition | Condition FDR | Condition Difference |
|---|---|---|---|---|---|---|---|---|
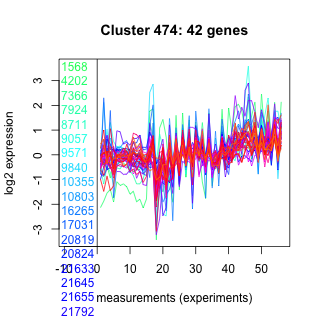
| Thaps_hclust_0474 |
 |
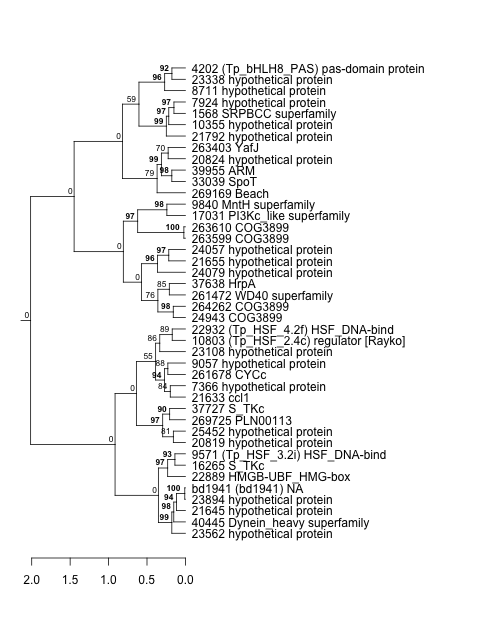 |
0.0078 |
0.000018 |
0.003 |
lowtemp_TMEVA | 0.024800 | -0.397 |
| Title | Cluster Plot | Dendrogram | e-value | e-value | e-value | Condition | Condition FDR | Condition Difference |
|---|---|---|---|---|---|---|---|---|
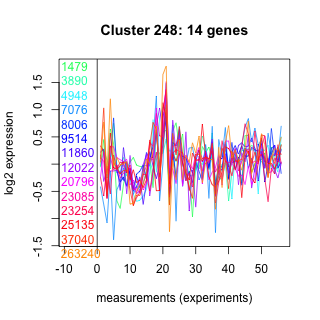
| Thaps_hclust_0248 |
 |
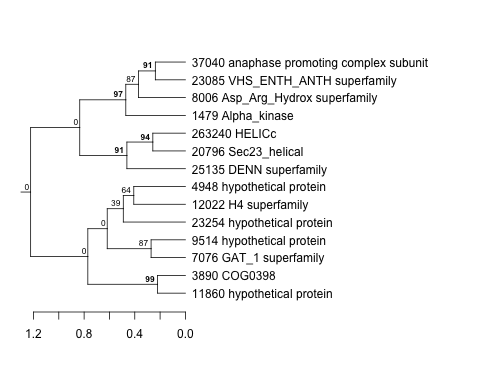 |
0.000037 |
0.000078 |
39 |
BaP | 0.024800 | 0.564 |
| Title | Cluster Plot | Dendrogram | e-value | e-value | e-value | Condition | Condition FDR | Condition Difference |
|---|---|---|---|---|---|---|---|---|
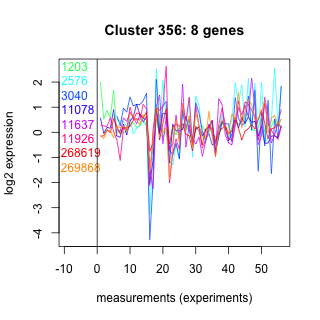
| Thaps_hclust_0356 |
 |
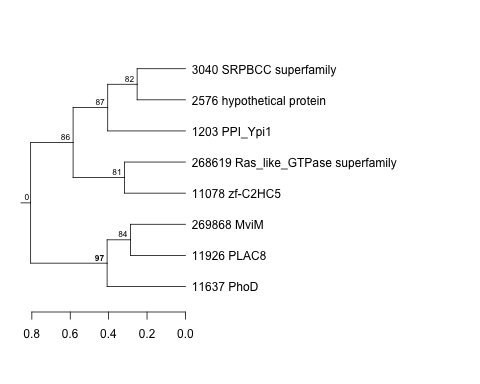 |
2.1 |
41 |
71 |
BaP | 0.024900 | 0.763 |
| Title | Cluster Plot | Dendrogram | e-value | e-value | e-value | Condition | Condition FDR | Condition Difference |
|---|---|---|---|---|---|---|---|---|
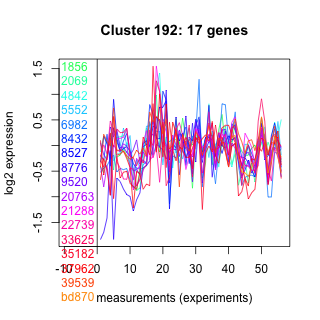
| Thaps_hclust_0192 |
 |
 |
0.000012 |
0.017 |
1.3 |
co2_elevated_stat_arrays | 0.025000 | -0.511 |
| Title | Cluster Plot | Dendrogram | e-value | e-value | e-value | Condition | Condition FDR | Condition Difference |
|---|---|---|---|---|---|---|---|---|
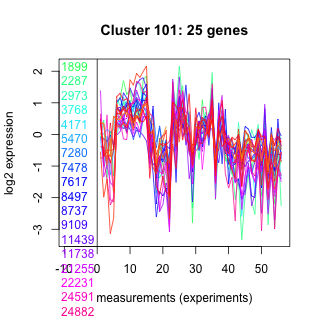
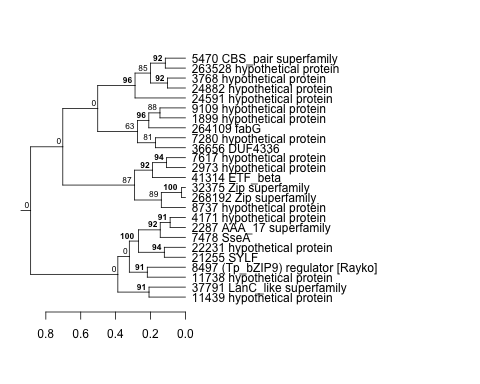
| Thaps_hclust_0101 |
 |
 |
0.000000016 |
0.0000038 |
0.014 |
lowN_TMEVA | 0.025000 | -0.617 |
| Title | Cluster Plot | Dendrogram | e-value | e-value | e-value | Condition | Condition FDR | Condition Difference |
|---|---|---|---|---|---|---|---|---|
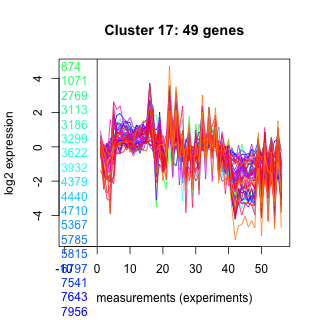
| Thaps_hclust_0017 |
 |
 |
4.6e-24 |
0.00000000000046 |
0.000000000000098 |
co2_elevated_expo_arrays | 0.025000 | 0.206 |
| Title | Cluster Plot | Dendrogram | e-value | e-value | e-value | Condition | Condition FDR | Condition Difference |
|---|---|---|---|---|---|---|---|---|
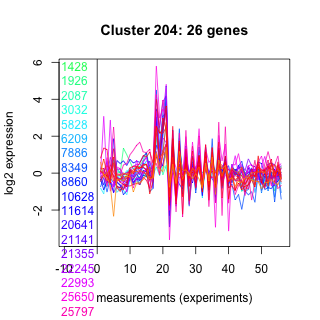
| Thaps_hclust_0204 |
 |
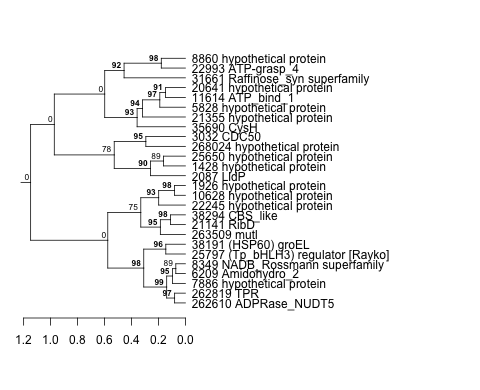 |
0.000065 |
0.008 |
0.00052 |
diel_exponential_vs_stationary | 0.025200 | -0.333 |
| Title | Cluster Plot | Dendrogram | e-value | e-value | e-value | Condition | Condition FDR | Condition Difference |
|---|---|---|---|---|---|---|---|---|
| Thaps_hclust_0302 |
 |
 |
0.000000015 |
0.00000024 |
0.00000000039 |
lowFe_KTKB_Day5 | 0.025300 | 0.317 |
| Title | Cluster Plot | Dendrogram | e-value | e-value | e-value | Condition | Condition FDR | Condition Difference |
|---|---|---|---|---|---|---|---|---|
| Thaps_hclust_0064 |
 |
 |
0.000000012 |
0.00000073 |
0.0000002 |
co2_elevated_expo_arrays | 0.025400 | 0.322 |
| Title | Cluster Plot | Dendrogram | e-value | e-value | e-value | Condition | Condition FDR | Condition Difference |
|---|---|---|---|---|---|---|---|---|
| Thaps_hclust_0065 |
 |
 |
1.5e-32 |
2.5e-32 |
9.9e-33 |
BaP | 0.025500 | -0.349 |
| Title | Cluster Plot | Dendrogram | e-value | e-value | e-value | Condition | Condition FDR | Condition Difference |
|---|---|---|---|---|---|---|---|---|
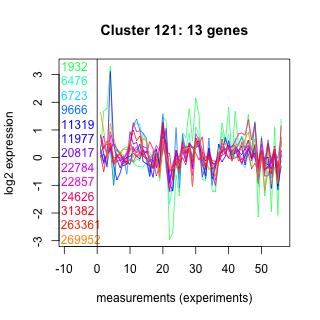
| Thaps_hclust_0121 |
 |
 |
0.00021 |
0.77 |
30 |
exponential_vs_stationary_24highlight | 0.025600 | -0.292 |
| Title | Cluster Plot | Dendrogram | e-value | e-value | e-value | Condition | Condition FDR | Condition Difference |
|---|---|---|---|---|---|---|---|---|
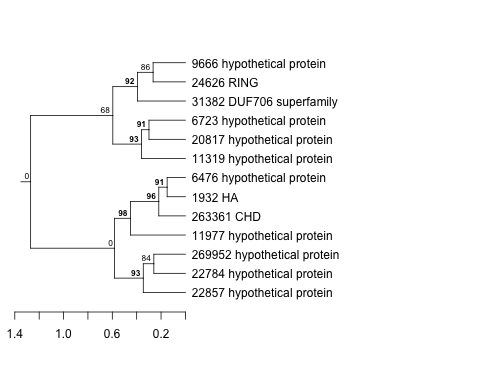
| Thaps_hclust_0239 |
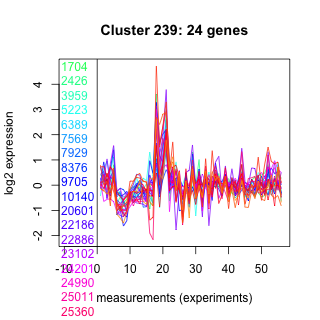 |
 |
0.000019 |
0.001 |
0.06 |
lowtemp_TMEVA | 0.025800 | 0.531 |
| Title | Cluster Plot | Dendrogram | e-value | e-value | e-value | Condition | Condition FDR | Condition Difference |
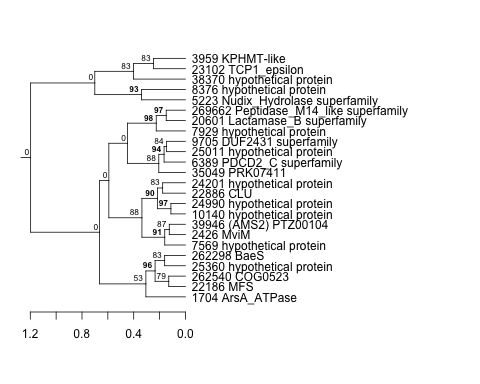
|---|---|---|---|---|---|---|---|---|
| Thaps_hclust_0307 |
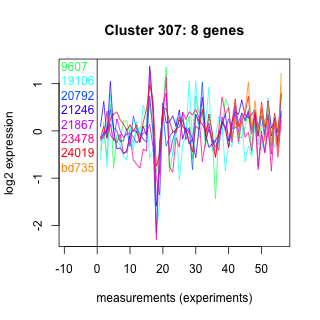 |
 |
46 |
50 |
580 |
exponential_vs_stationary_24highlight | 0.025800 | -0.38 |
| Title | Cluster Plot | Dendrogram | e-value | e-value | e-value | Condition | Condition FDR | Condition Difference |
|---|---|---|---|---|---|---|---|---|
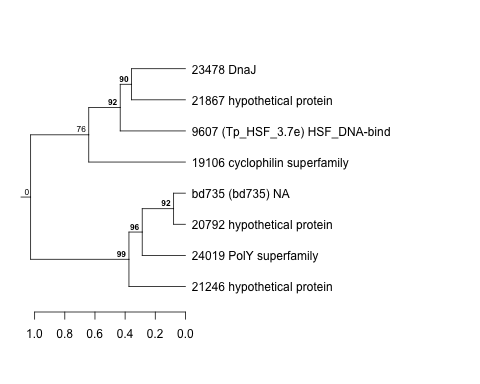
| Thaps_hclust_0388 |
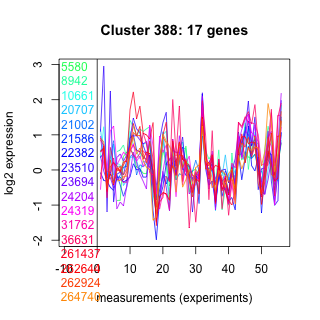 |
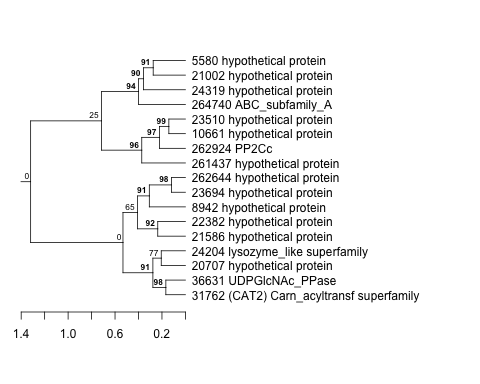 |
0.0000000024 |
23 |
380 |
lowFe_KTKB_Day3 | 0.025800 | 0.55 |
| Title | Cluster Plot | Dendrogram | e-value | e-value | e-value | Condition | Condition FDR | Condition Difference |
|---|---|---|---|---|---|---|---|---|
| Thaps_hclust_0498 |
 |
 |
1.3 |
1.8 |
1.8 |
exponential_vs_stationary_24highlight | 0.026000 | -0.253 |
| Title | Cluster Plot | Dendrogram | e-value | e-value | e-value | Condition | Condition FDR | Condition Difference |
|---|---|---|---|---|---|---|---|---|
| Thaps_hclust_0266 |
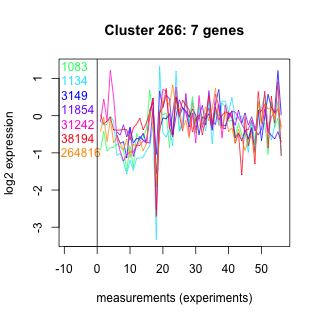 |
 |
0.44 |
17 |
30 |
exponential_vs_stationary_24highlight | 0.026000 | 0.404 |
| Title | Cluster Plot | Dendrogram | e-value | e-value | e-value | Condition | Condition FDR | Condition Difference |
|---|---|---|---|---|---|---|---|---|
| Thaps_hclust_0485 |
 |
 |
0.0012 |
0.0078 |
0.16 |
exponential_vs_stationary_24light | 0.026400 | -0.446 |
| Title | Cluster Plot | Dendrogram | e-value | e-value | e-value | Condition | Condition FDR | Condition Difference |
|---|---|---|---|---|---|---|---|---|
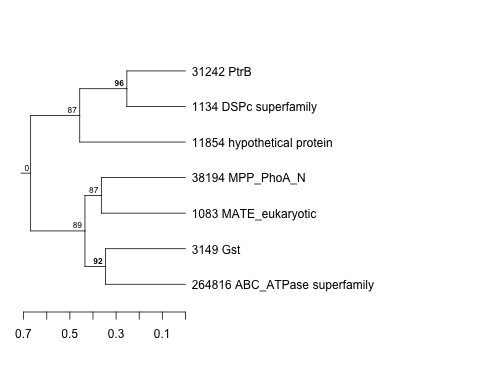
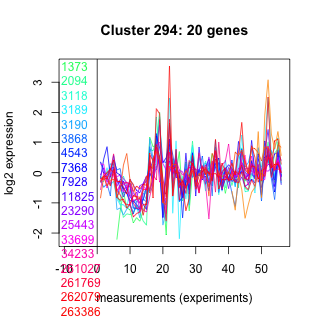
| Thaps_hclust_0294 |
 |
 |
0.0033 |
0.13 |
0.53 |
co2_elevated_stat_arrays | 0.026700 | 0.47 |
| Title | Cluster Plot | Dendrogram | e-value | e-value | e-value | Condition | Condition FDR | Condition Difference |
|---|---|---|---|---|---|---|---|---|
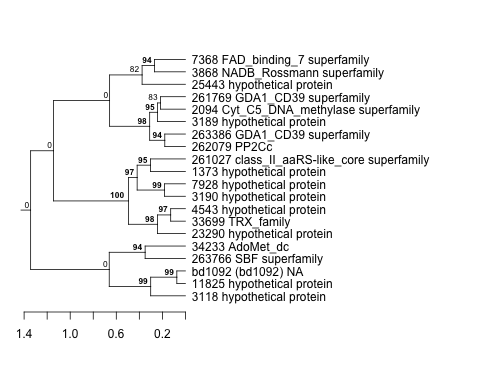
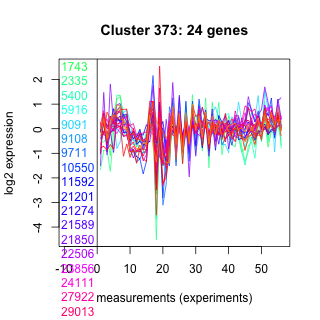
| Thaps_hclust_0373 |
 |
 |
0.00017 |
0.001 |
0.066 |
highlight_arrays | 0.026700 | -0.319 |
| Title | Cluster Plot | Dendrogram | e-value | e-value | e-value | Condition | Condition FDR | Condition Difference |
|---|---|---|---|---|---|---|---|---|
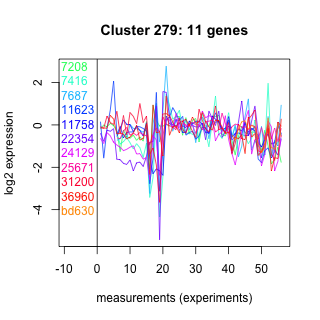
| Thaps_hclust_0279 |
 |
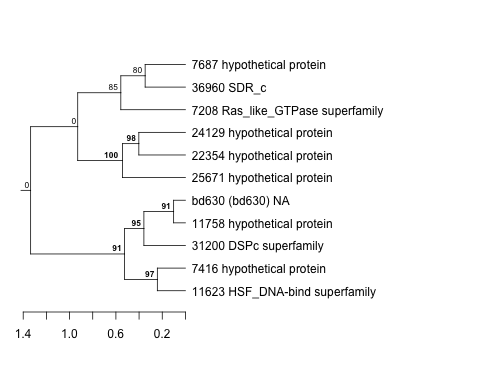 |
2.7 |
22 |
38 |
highlight_arrays | 0.026700 | 0.467 |
| Thaps_hclust_0279 |
|
|
2.7 |
22 |
38 |
co2_elevated_stat_arrays | 0.028700 | 0.6 |
| Title | Cluster Plot | Dendrogram | e-value | e-value | e-value | Condition | Condition FDR | Condition Difference |
|---|---|---|---|---|---|---|---|---|
| Thaps_hclust_0059 |
 |
 |
0.0000000000000026 |
0.000000000024 |
0.0000014 |
highpH_TMEVA | 0.026800 | -0.243 |
| Title | Cluster Plot | Dendrogram | e-value | e-value | e-value | Condition | Condition FDR | Condition Difference |
|---|---|---|---|---|---|---|---|---|
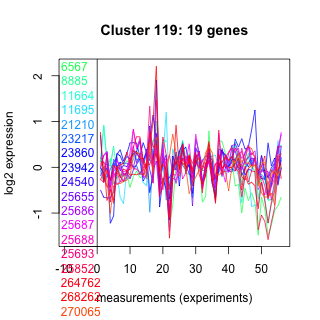
| Thaps_hclust_0119 |
 |
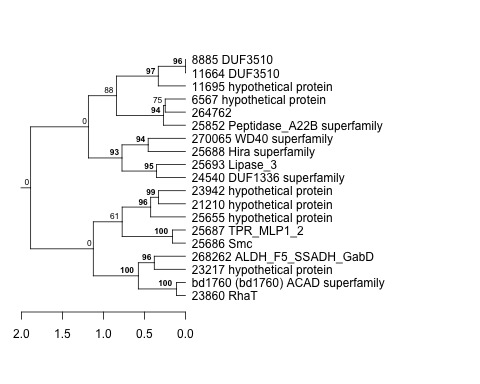 |
0.000017 |
0.0015 |
0.0058 |
highlight_arrays | 0.026800 | 0.349 |
| Title | Cluster Plot | Dendrogram | e-value | e-value | e-value | Condition | Condition FDR | Condition Difference |
|---|---|---|---|---|---|---|---|---|
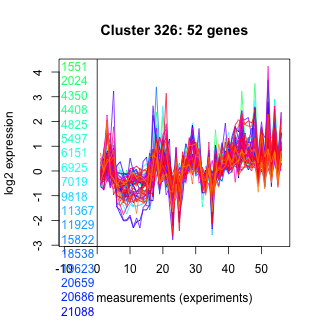
| Thaps_hclust_0326 |
 |
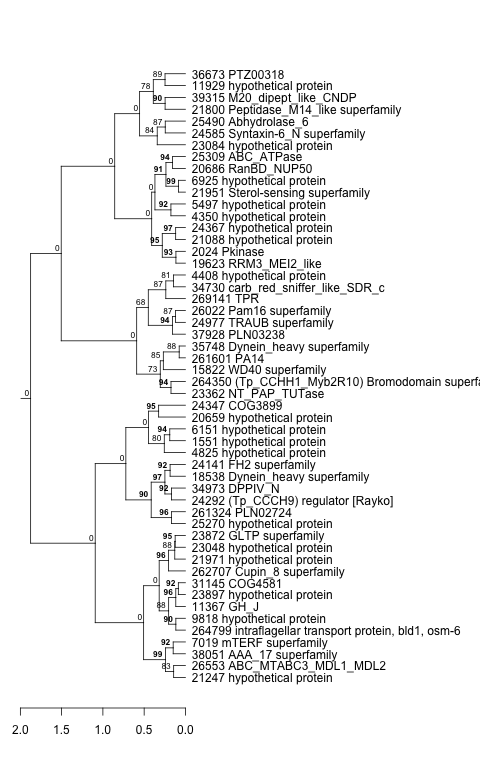 |
0.000000000000042 |
0.00000000011 |
0.00000051 |
lowN_TMEVA | 0.026800 | 0.462 |
| Thaps_hclust_0326 |
|
|
0.000000000000042 |
0.00000000011 |
0.00000051 |
highlight_arrays | 0.031400 | 0.214 |
| Title | Cluster Plot | Dendrogram | e-value | e-value | e-value | Condition | Condition FDR | Condition Difference |
|---|---|---|---|---|---|---|---|---|
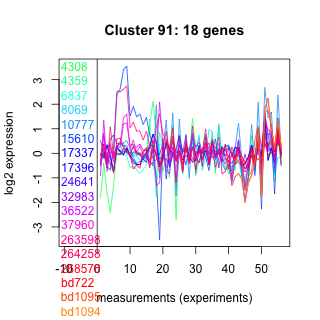
| Thaps_hclust_0091 |
 |
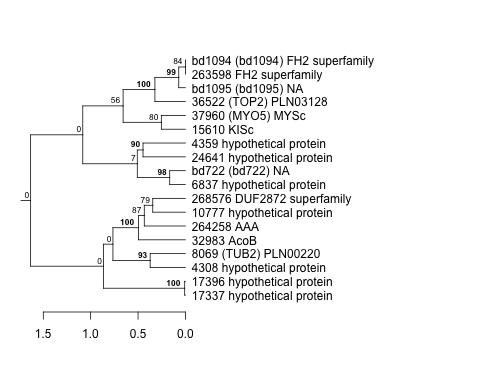 |
0.00000061 |
0.00022 |
0.44 |
highpH_TMEVA | 0.026800 | -0.373 |
| Title | Cluster Plot | Dendrogram | e-value | e-value | e-value | Condition | Condition FDR | Condition Difference |
|---|---|---|---|---|---|---|---|---|
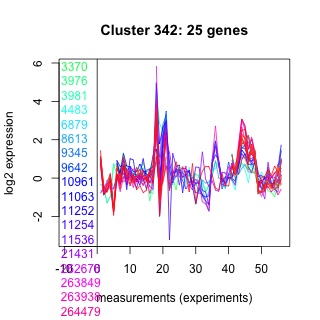
| Thaps_hclust_0342 |
 |
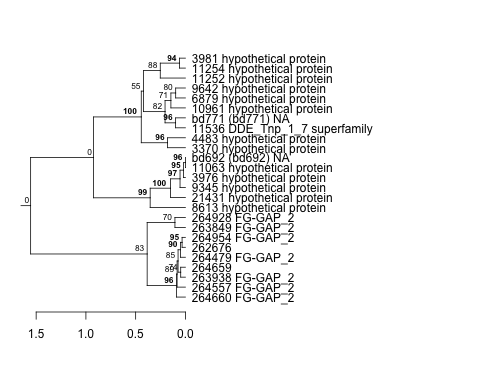 |
5.79997e-41 |
2.7e-33 |
3.1e-31 |
lowN_TMEVA | 0.026800 | -0.609 |
| Title | Cluster Plot | Dendrogram | e-value | e-value | e-value | Condition | Condition FDR | Condition Difference |
|---|---|---|---|---|---|---|---|---|
| Thaps_hclust_0060 |
 |
 |
0.00000047 |
0.00077 |
0.0075 |
lowN_TMEVA | 0.026800 | -0.562 |
| Title | Cluster Plot | Dendrogram | e-value | e-value | e-value | Condition | Condition FDR | Condition Difference |
|---|---|---|---|---|---|---|---|---|
| Thaps_hclust_0343 |
 |
 |
9.7e-16 |
0.000000023 |
0.0000000024 |
BaP | 0.026900 | 0.379 |
| Thaps_hclust_0343 |
|
|
9.7e-16 |
0.000000023 |
0.0000000024 |
lowFe_TMEVA | 0.028000 | -0.447 |
| Title | Cluster Plot | Dendrogram | e-value | e-value | e-value | Condition | Condition FDR | Condition Difference |
|---|---|---|---|---|---|---|---|---|
| Thaps_hclust_0177 |
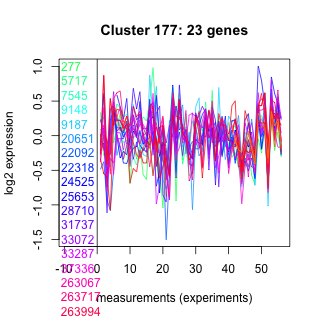 |
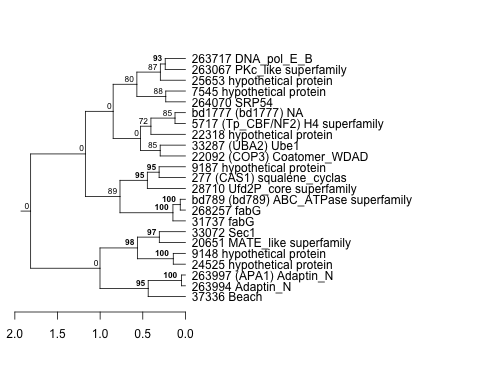 |
0.0000000012 |
0.0000078 |
0.00084 |
highlight_arrays | 0.026900 | -0.32 |
| Thaps_hclust_0177 |
|
|
0.0000000012 |
0.0000078 |
0.00084 |
co2_elevated_stat_arrays | 0.030300 | -0.426 |
| Title | Cluster Plot | Dendrogram | e-value | e-value | e-value | Condition | Condition FDR | Condition Difference |
|---|---|---|---|---|---|---|---|---|
| Thaps_hclust_0364 |
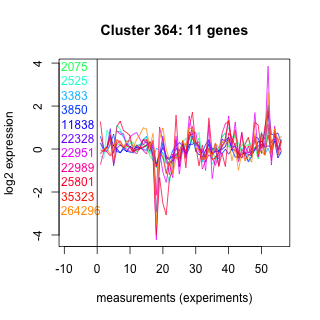 |
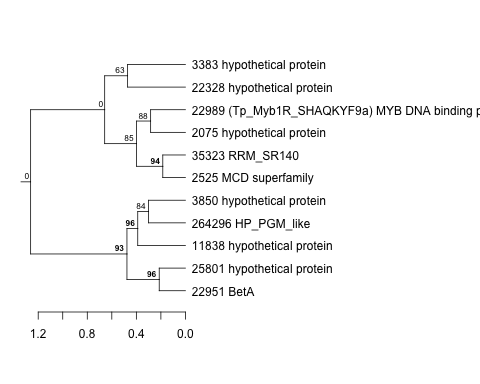 |
4.5 |
28 |
590 |
diel_exponential_vs_stationary | 0.026900 | -0.545 |
| Title | Cluster Plot | Dendrogram | e-value | e-value | e-value | Condition | Condition FDR | Condition Difference |
|---|---|---|---|---|---|---|---|---|
| Thaps_hclust_0288 |
 |
 |
0.032 |
0.0067 |
0.047 |
lowFe_KTKB_Day5 | 0.027000 | 0.485 |
| Title | Cluster Plot | Dendrogram | e-value | e-value | e-value | Condition | Condition FDR | Condition Difference |
|---|---|---|---|---|---|---|---|---|
| Thaps_hclust_0014 |
 |
 |
Not available | Not available | Not available | BaP | 0.027000 | -0.257 |
| Title | Cluster Plot | Dendrogram | e-value | e-value | e-value | Condition | Condition FDR | Condition Difference |
|---|---|---|---|---|---|---|---|---|
| Thaps_hclust_0047 |
 |
 |
3.4e-21 |
3.4e-17 |
5.5e-19 |
lowN_TMEVA | 0.027100 | 0.476 |
| Thaps_hclust_0047 |
|
|
3.4e-21 |
3.4e-17 |
5.5e-19 |
diel_light_vs_dark | 0.027200 | -0.286 |
| Thaps_hclust_0047 |
|
|
3.4e-21 |
3.4e-17 |
5.5e-19 |
lowFe_KTKB_Day5 | 0.028600 | 0.273 |
| Title | Cluster Plot | Dendrogram | e-value | e-value | e-value | Condition | Condition FDR | Condition Difference |
|---|---|---|---|---|---|---|---|---|
| Thaps_hclust_0226 |
 |
 |
0.000000041 |
0.95 |
4.6 |
highpH_TMEVA | 0.027300 | -0.323 |
| Title | Cluster Plot | Dendrogram | e-value | e-value | e-value | Condition | Condition FDR | Condition Difference |
|---|---|---|---|---|---|---|---|---|
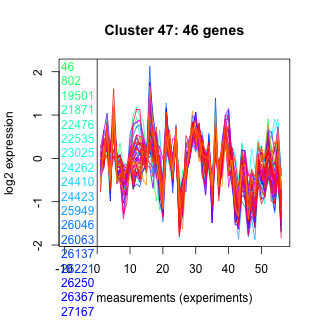
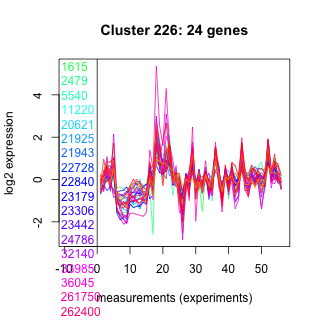
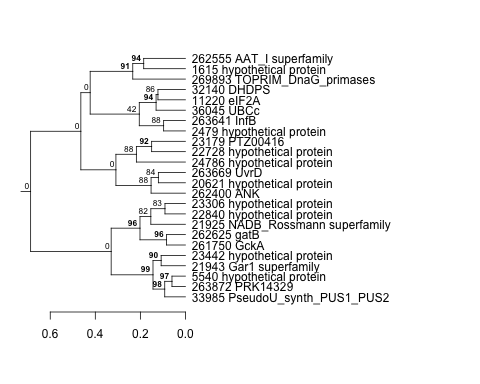
| Thaps_hclust_0393 |
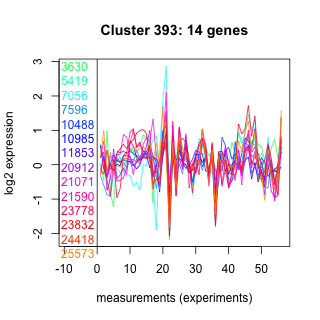 |
 |
2 |
16 |
16 |
highlight_arrays | 0.027300 | 0.404 |
| Title | Cluster Plot | Dendrogram | e-value | e-value | e-value | Condition | Condition FDR | Condition Difference |
|---|---|---|---|---|---|---|---|---|
| Thaps_hclust_0006 |
 |
 |
0.0000000000025 |
0.000000092 |
0.000086 |
highpH_TMEVA | 0.027300 | 0.245 |
| Title | Cluster Plot | Dendrogram | e-value | e-value | e-value | Condition | Condition FDR | Condition Difference |
|---|---|---|---|---|---|---|---|---|
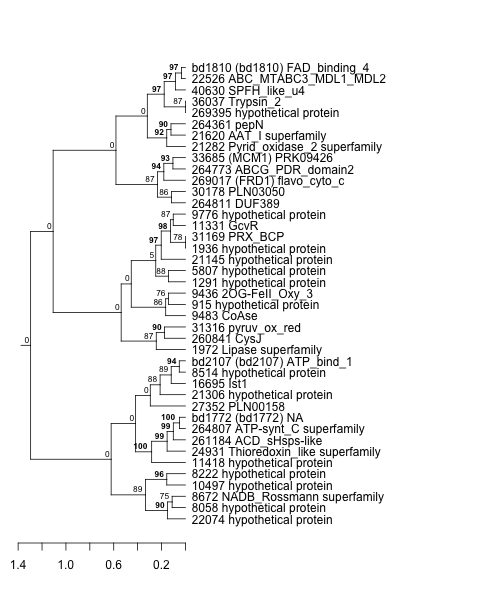
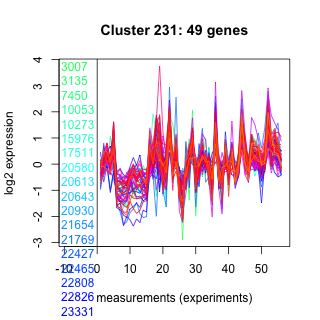
| Thaps_hclust_0231 |
 |
 |
9.5e-23 |
0.000000000000034 |
0.00000039 |
highpH_TMEVA | 0.027300 | -0.234 |
| Title | Cluster Plot | Dendrogram | e-value | e-value | e-value | Condition | Condition FDR | Condition Difference |
|---|---|---|---|---|---|---|---|---|
| Thaps_hclust_0099 |
 |
 |
0.0000000000000032 |
0.000000000000013 |
0.000000000000025 |
lowN_TMEVA | 0.027400 | -1.48 |
| Title | Cluster Plot | Dendrogram | e-value | e-value | e-value | Condition | Condition FDR | Condition Difference |
|---|---|---|---|---|---|---|---|---|
| Thaps_hclust_0339 |
 |
 |
0.000016 |
0.00038 |
0.0017 |
highlight_arrays | 0.027500 | 0.34 |
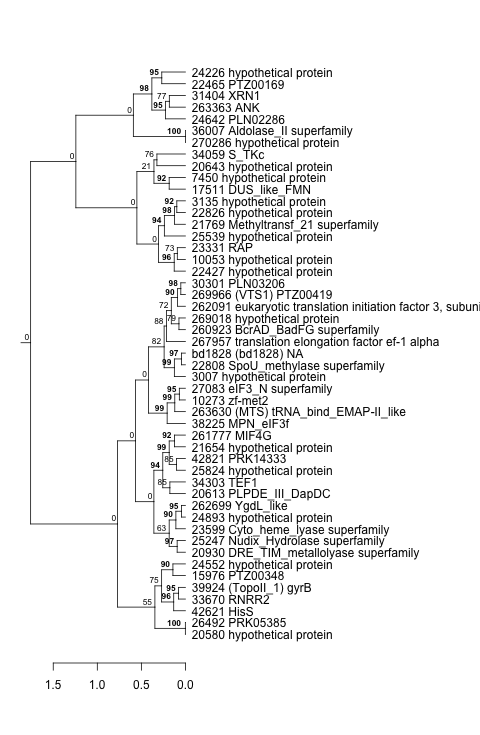
| Title | Cluster Plot | Dendrogram | e-value | e-value | e-value | Condition | Condition FDR | Condition Difference |
|---|---|---|---|---|---|---|---|---|
| Thaps_hclust_0263 |
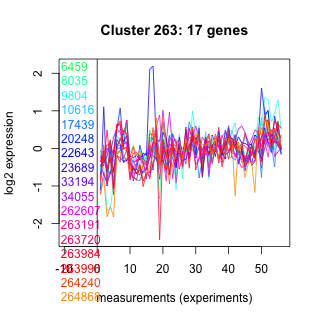 |
 |
0.15 |
0.25 |
1.4 |
highlight_arrays | 0.027600 | -0.378 |
| Title | Cluster Plot | Dendrogram | e-value | e-value | e-value | Condition | Condition FDR | Condition Difference |
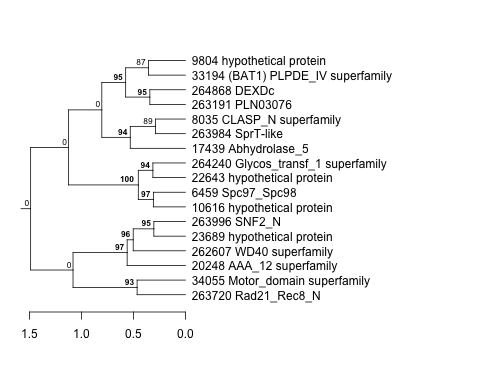
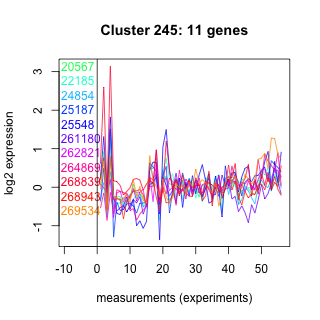
|---|---|---|---|---|---|---|---|---|
| Thaps_hclust_0245 |
 |
 |
0.52 |
100 |
150 |
lowFe_TMEVA | 0.027700 | 0.752 |
| Title | Cluster Plot | Dendrogram | e-value | e-value | e-value | Condition | Condition FDR | Condition Difference |
|---|---|---|---|---|---|---|---|---|
| Thaps_hclust_0031 |
 |
 |
0.00000077 |
0.000041 |
6.3 |
exponential_vs_stationary_24highlight | 0.027700 | 0.2 |
| Title | Cluster Plot | Dendrogram | e-value | e-value | e-value | Condition | Condition FDR | Condition Difference |
|---|---|---|---|---|---|---|---|---|
| Thaps_hclust_0247 |
 |
 |
8.7e-16 |
0.00000000045 |
0.0000019 |
diel_light_vs_dark | 0.028000 | 0.287 |
| Title | Cluster Plot | Dendrogram | e-value | e-value | e-value | Condition | Condition FDR | Condition Difference |
|---|---|---|---|---|---|---|---|---|
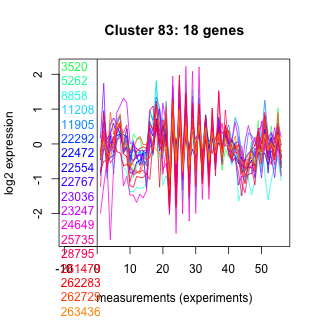
| Thaps_hclust_0083 |
 |
 |
0.0039 |
6.3 |
14 |
highlight_arrays | 0.028100 | -0.355 |
| Title | Cluster Plot | Dendrogram | e-value | e-value | e-value | Condition | Condition FDR | Condition Difference |
|---|---|---|---|---|---|---|---|---|
| Thaps_hclust_0041 |
 |
 |
4.4e-38 |
0.000000011 |
0.0000042 |
highlight_arrays | 0.028100 | -0.217 |
| Title | Cluster Plot | Dendrogram | e-value | e-value | e-value | Condition | Condition FDR | Condition Difference |
|---|---|---|---|---|---|---|---|---|
| Thaps_hclust_0491 |
 |
 |
0.35 |
17 |
52 |
lowFe_KTKB_Day3 | 0.028300 | -0.656 |
| Thaps_hclust_0491 |
|
|
0.35 |
17 |
52 |
diel_exponential_vs_stationary | 0.031400 | 0.496 |
| Title | Cluster Plot | Dendrogram | e-value | e-value | e-value | Condition | Condition FDR | Condition Difference |
|---|---|---|---|---|---|---|---|---|
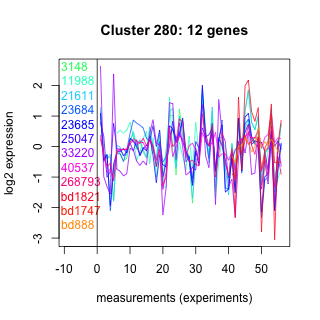
| Thaps_hclust_0280 |
 |
 |
0.75 |
0.64 |
81 |
lowSi_TMEVA | 0.028600 | -1.04 |
| Title | Cluster Plot | Dendrogram | e-value | e-value | e-value | Condition | Condition FDR | Condition Difference |
|---|---|---|---|---|---|---|---|---|
| Thaps_hclust_0124 |
 |
 |
1 |
0.23 |
42 |
diel_exponential_vs_stationary | 0.028700 | -0.434 |
| Title | Cluster Plot | Dendrogram | e-value | e-value | e-value | Condition | Condition FDR | Condition Difference |
|---|---|---|---|---|---|---|---|---|
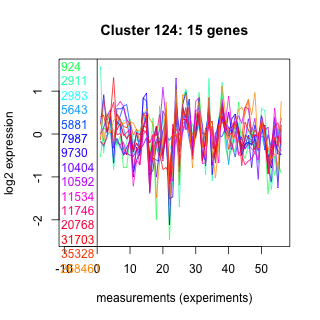
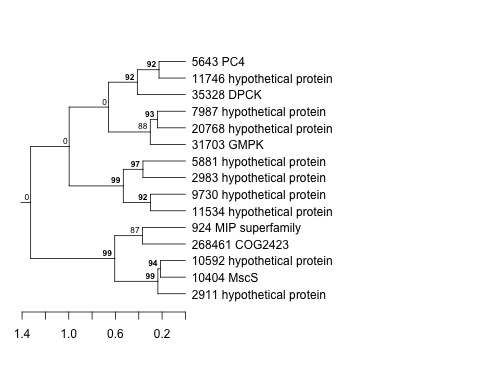
| Thaps_hclust_0292 |
 |
 |
1.4e-30 |
0.00000000000037 |
0.0000067 |
lowtemp_TMEVA | 0.028900 | 0.373 |
| Title | Cluster Plot | Dendrogram | e-value | e-value | e-value | Condition | Condition FDR | Condition Difference |
|---|---|---|---|---|---|---|---|---|
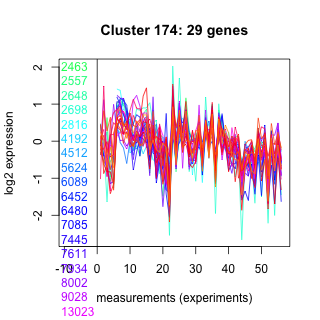
| Thaps_hclust_0174 |
 |
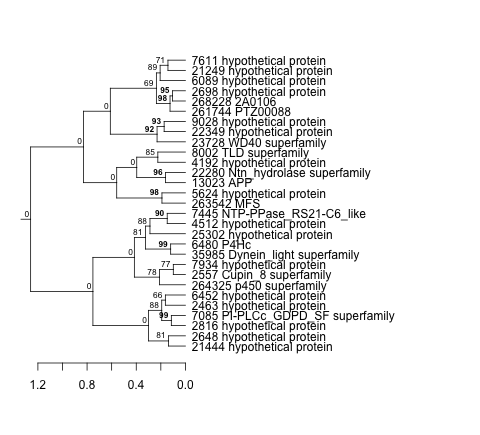 |
1.3 |
0.99 |
2.2 |
BaP | 0.029000 | -0.381 |
| Title | Cluster Plot | Dendrogram | e-value | e-value | e-value | Condition | Condition FDR | Condition Difference |
|---|---|---|---|---|---|---|---|---|
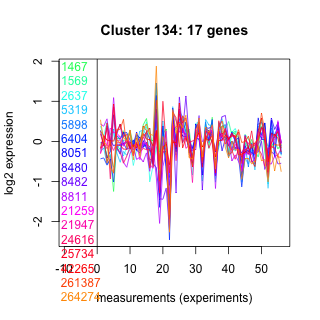
| Thaps_hclust_0134 |
 |
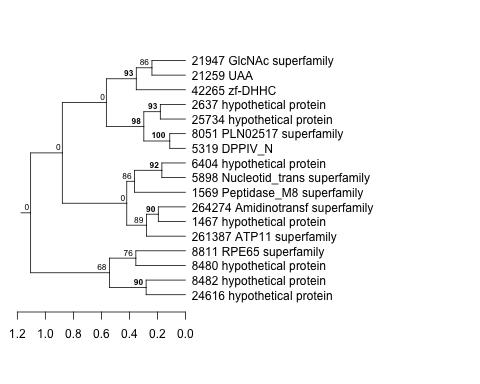 |
0.00013 |
0.55 |
0.0039 |
diel_light_vs_dark | 0.029100 | 0.47 |
| Title | Cluster Plot | Dendrogram | e-value | e-value | e-value | Condition | Condition FDR | Condition Difference |
|---|---|---|---|---|---|---|---|---|
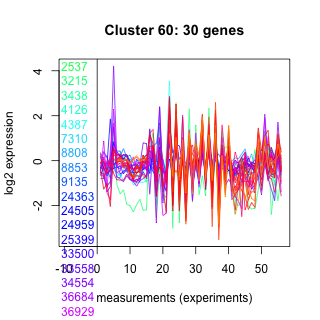
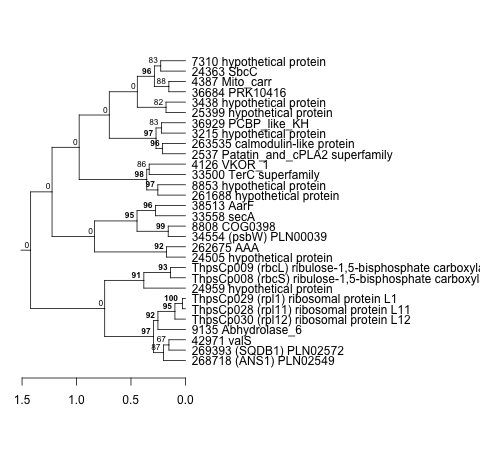
| Thaps_hclust_0370 |
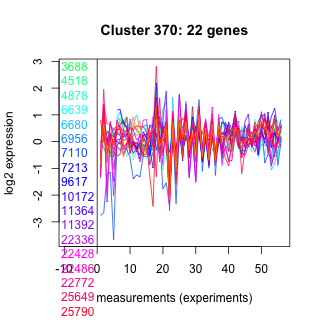 |
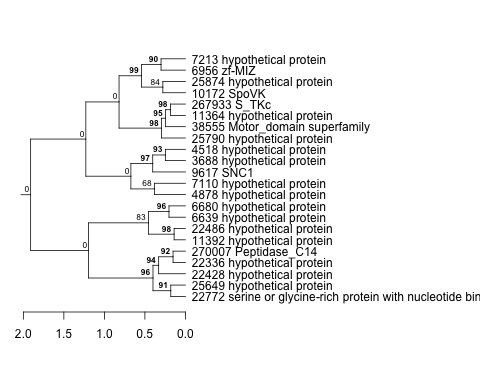 |
0.55 |
1 |
7 |
lowFe_TMEVA | 0.029100 | 0.528 |
| Title | Cluster Plot | Dendrogram | e-value | e-value | e-value | Condition | Condition FDR | Condition Difference |
|---|---|---|---|---|---|---|---|---|
| Thaps_hclust_0317 |
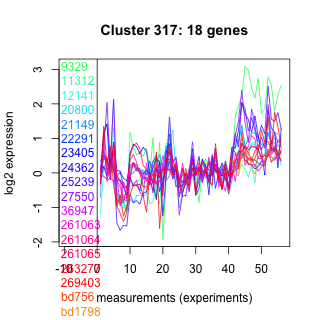 |
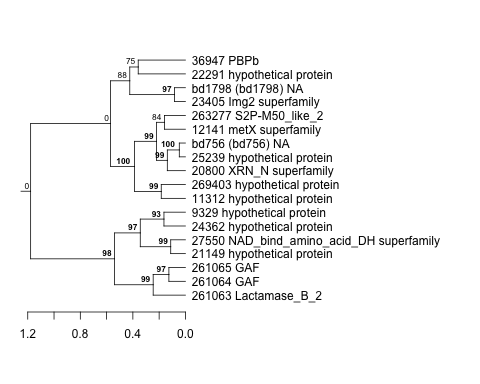 |
0.000000000082 |
0.00000001 |
0.00000042 |
lowFe_TMEVA | 0.029400 | 0.574 |
| Title | Cluster Plot | Dendrogram | e-value | e-value | e-value | Condition | Condition FDR | Condition Difference |
|---|---|---|---|---|---|---|---|---|
| Thaps_hclust_0100 |
 |
 |
0.00000073 |
0.000076 |
2.6 |
diel_light_vs_dark | 0.029500 | 0.447 |
| Title | Cluster Plot | Dendrogram | e-value | e-value | e-value | Condition | Condition FDR | Condition Difference |
|---|---|---|---|---|---|---|---|---|
| Thaps_hclust_0049 |
 |
 |
0.00054 |
0.0063 |
0.03 |
lowSi_TMEVA | 0.029600 | -0.69 |
| Title | Cluster Plot | Dendrogram | e-value | e-value | e-value | Condition | Condition FDR | Condition Difference |
|---|---|---|---|---|---|---|---|---|
| Thaps_hclust_0338 |
 |
 |
0.0000012 |
0.0000014 |
0.000012 |
BaP | 0.029600 | 0.356 |
| Title | Cluster Plot | Dendrogram | e-value | e-value | e-value | Condition | Condition FDR | Condition Difference |
|---|---|---|---|---|---|---|---|---|
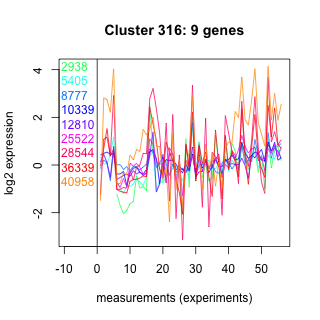
| Thaps_hclust_0316 |
 |
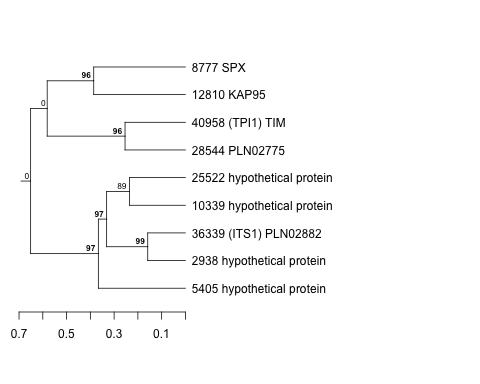 |
0.14 |
2.2 |
4.4 |
lowFe_TMEVA | 0.029700 | 0.824 |
| Title | Cluster Plot | Dendrogram | e-value | e-value | e-value | Condition | Condition FDR | Condition Difference |
|---|---|---|---|---|---|---|---|---|
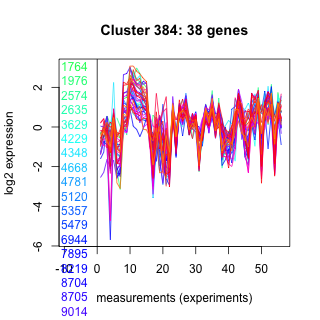
| Thaps_hclust_0384 |
 |
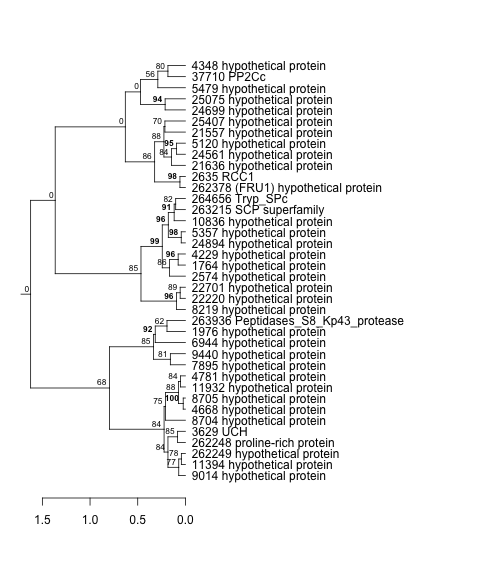 |
0.0000000074 |
0.000000031 |
0.12 |
diel_exponential_vs_stationary | 0.029700 | 0.27 |
| Title | Cluster Plot | Dendrogram | e-value | e-value | e-value | Condition | Condition FDR | Condition Difference |
|---|---|---|---|---|---|---|---|---|
| Thaps_hclust_0311 |
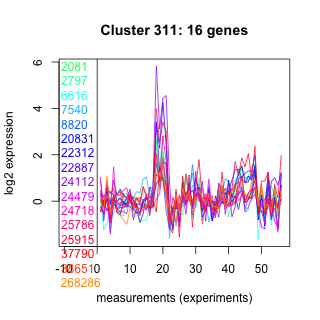 |
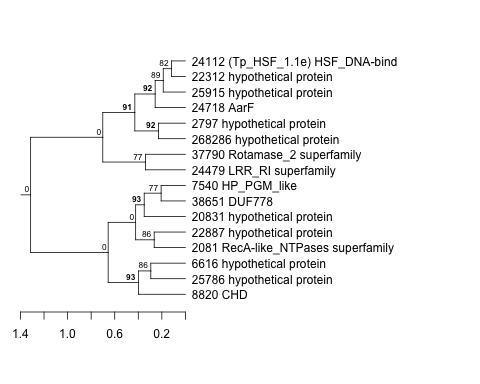 |
4.1 |
0.64 |
12 |
exponential_vs_stationary_24light | 0.029800 | -0.737 |
| Title | Cluster Plot | Dendrogram | e-value | e-value | e-value | Condition | Condition FDR | Condition Difference |
|---|---|---|---|---|---|---|---|---|
| Thaps_hclust_0309 |
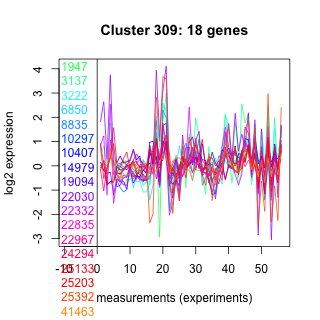 |
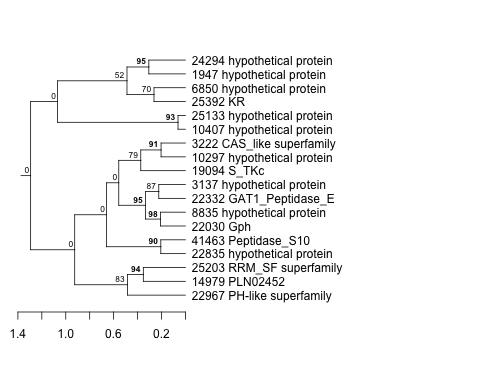 |
0.0000055 |
0.015 |
1.1 |
highlight_arrays | 0.029800 | 0.353 |
| Title | Cluster Plot | Dendrogram | e-value | e-value | e-value | Condition | Condition FDR | Condition Difference |
|---|---|---|---|---|---|---|---|---|
| Thaps_hclust_0154 |
 |
 |
0.00015 |
0.0049 |
0.29 |
BaP | 0.029900 | 0.438 |
| Title | Cluster Plot | Dendrogram | e-value | e-value | e-value | Condition | Condition FDR | Condition Difference |
|---|---|---|---|---|---|---|---|---|
| Thaps_hclust_0385 |
 |
 |
0.000029 |
2.1 |
2.2 |
diel_light_vs_dark | 0.029900 | 0.442 |
| Title | Cluster Plot | Dendrogram | e-value | e-value | e-value | Condition | Condition FDR | Condition Difference |
|---|---|---|---|---|---|---|---|---|
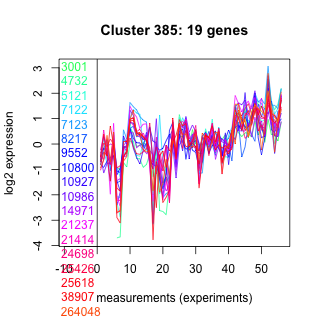
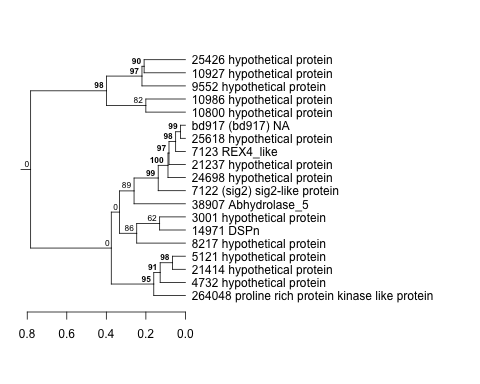
| Thaps_hclust_0441 |
 |
 |
0.00081 |
0.001 |
0.0015 |
BaP | 0.029900 | -0.695 |
| Title | Cluster Plot | Dendrogram | e-value | e-value | e-value | Condition | Condition FDR | Condition Difference |
|---|---|---|---|---|---|---|---|---|
| Thaps_hclust_0196 |
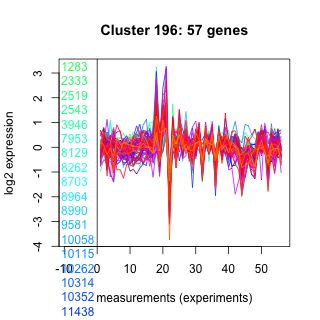 |
 |
0.0000000000000088 |
0.00000034 |
0.000017 |
exponential_vs_stationary_24highlight | 0.030200 | 0.131 |
| Title | Cluster Plot | Dendrogram | e-value | e-value | e-value | Condition | Condition FDR | Condition Difference |
|---|---|---|---|---|---|---|---|---|
| Thaps_hclust_0322 |
 |
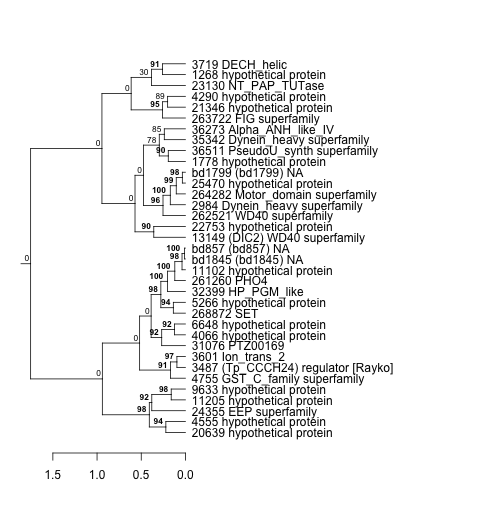 |
0.0000000021 |
0.0000000053 |
0.0051 |
exponential_vs_stationary_24highlight | 0.030300 | -0.168 |
| Title | Cluster Plot | Dendrogram | e-value | e-value | e-value | Condition | Condition FDR | Condition Difference |
|---|---|---|---|---|---|---|---|---|
| Thaps_hclust_0098 |
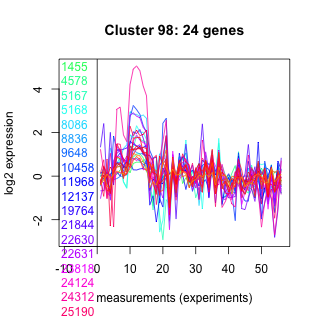 |
 |
0.0000000015 |
0.17 |
19 |
exponential_vs_stationary_24light | 0.030300 | 0.597 |
| Title | Cluster Plot | Dendrogram | e-value | e-value | e-value | Condition | Condition FDR | Condition Difference |
|---|---|---|---|---|---|---|---|---|
| Thaps_hclust_0128 |
 |
 |
0.0000000058 |
0.00033 |
21 |
highpH_TMEVA | 0.030300 | -0.319 |
| Title | Cluster Plot | Dendrogram | e-value | e-value | e-value | Condition | Condition FDR | Condition Difference |
|---|---|---|---|---|---|---|---|---|
| Thaps_hclust_0207 |
 |
 |
0.0000000025 |
0.0000000037 |
0.1 |
co2_elevated_stat_arrays | 0.030400 | -0.393 |
| Title | Cluster Plot | Dendrogram | e-value | e-value | e-value | Condition | Condition FDR | Condition Difference |
|---|---|---|---|---|---|---|---|---|
| Thaps_hclust_0290 |
 |
 |
3e-16 |
0.014 |
0.072 |
highlight_arrays | 0.030500 | -0.32 |
| Title | Cluster Plot | Dendrogram | e-value | e-value | e-value | Condition | Condition FDR | Condition Difference |
|---|---|---|---|---|---|---|---|---|
| Thaps_hclust_0003 |
 |
 |
0.24 |
16 |
240 |
diel_light_vs_dark | 0.030500 | -0.466 |
| Title | Cluster Plot | Dendrogram | e-value | e-value | e-value | Condition | Condition FDR | Condition Difference |
|---|---|---|---|---|---|---|---|---|
| Thaps_hclust_0143 |
 |
 |
0.018 |
0.041 |
0.67 |
diel_light_vs_dark | 0.030500 | 0.374 |
| Title | Cluster Plot | Dendrogram | e-value | e-value | e-value | Condition | Condition FDR | Condition Difference |
|---|---|---|---|---|---|---|---|---|
| Thaps_hclust_0472 |
 |
 |
0.00000011 |
0.000015 |
0.00015 |
diel_light_vs_dark | 0.030600 | -0.432 |
| Title | Cluster Plot | Dendrogram | e-value | e-value | e-value | Condition | Condition FDR | Condition Difference |
|---|---|---|---|---|---|---|---|---|
| Thaps_hclust_0257 |
 |
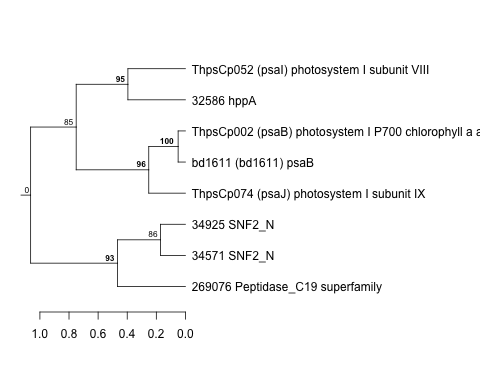 |
Not available | Not available | Not available | lowFe_KTKB_Day5 | 0.031000 | -0.726 |
| Thaps_hclust_0257 |
|
|
Not available | Not available | Not available | lowN_TMEVA | 0.031300 | -1.11 |
| Title | Cluster Plot | Dendrogram | e-value | e-value | e-value | Condition | Condition FDR | Condition Difference |
|---|---|---|---|---|---|---|---|---|
| Thaps_hclust_0235 |
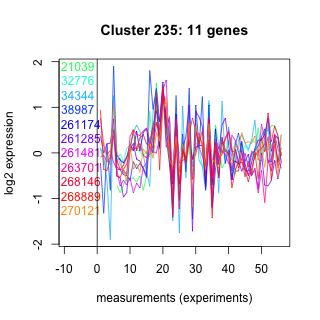 |
 |
0.47 |
5.6 |
74 |
lowtemp_TMEVA | 0.031000 | 0.771 |
| Title | Cluster Plot | Dendrogram | e-value | e-value | e-value | Condition | Condition FDR | Condition Difference |
|---|---|---|---|---|---|---|---|---|
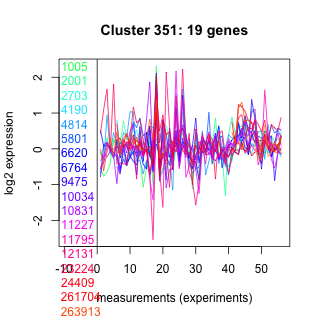
| Thaps_hclust_0351 |
 |
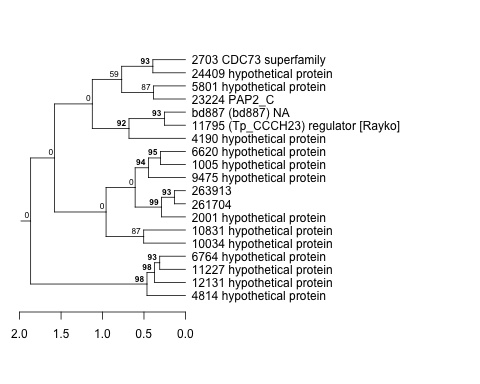 |
0.033 |
0.06 |
50 |
lowFe_KTKB_Day5 | 0.031000 | -0.433 |
| Title | Cluster Plot | Dendrogram | e-value | e-value | e-value | Condition | Condition FDR | Condition Difference |
|---|---|---|---|---|---|---|---|---|
| Thaps_hclust_0256 |
 |
 |
0.0000000000016 |
0.0000000000033 |
0.0000000000017 |
highpH_TMEVA | 0.031100 | -0.505 |
| Title | Cluster Plot | Dendrogram | e-value | e-value | e-value | Condition | Condition FDR | Condition Difference |
|---|---|---|---|---|---|---|---|---|
| Thaps_hclust_0090 |
 |
 |
0.23 |
2.7 |
11 |
BaP | 0.031100 | -0.539 |
| Title | Cluster Plot | Dendrogram | e-value | e-value | e-value | Condition | Condition FDR | Condition Difference |
|---|---|---|---|---|---|---|---|---|
| Thaps_hclust_0377 |
 |
 |
0.00016 |
0.034 |
0.95 |
lowtemp_TMEVA | 0.031200 | 0.445 |
| Title | Cluster Plot | Dendrogram | e-value | e-value | e-value | Condition | Condition FDR | Condition Difference |
|---|---|---|---|---|---|---|---|---|
| Thaps_hclust_0211 |
 |
 |
0.000000055 |
0.00014 |
0.026 |
lowtemp_TMEVA | 0.031300 | -0.436 |
| Title | Cluster Plot | Dendrogram | e-value | e-value | e-value | Condition | Condition FDR | Condition Difference |
|---|---|---|---|---|---|---|---|---|
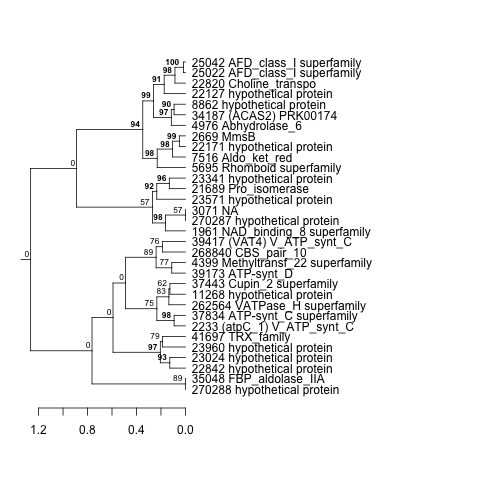
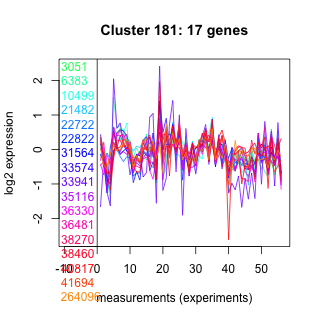
| Thaps_hclust_0181 |
 |
 |
0.000000035 |
0.14 |
0.84 |
lowN_TMEVA | 0.031300 | -0.734 |
| Title | Cluster Plot | Dendrogram | e-value | e-value | e-value | Condition | Condition FDR | Condition Difference |
|---|---|---|---|---|---|---|---|---|
| Thaps_hclust_0246 |
 |
 |
0.0000088 |
0.0034 |
3.7 |
highpH_TMEVA | 0.031300 | -0.297 |
| Title | Cluster Plot | Dendrogram | e-value | e-value | e-value | Condition | Condition FDR | Condition Difference |
|---|---|---|---|---|---|---|---|---|
| Thaps_hclust_0398 |
 |
 |
0.014 |
0.28 |
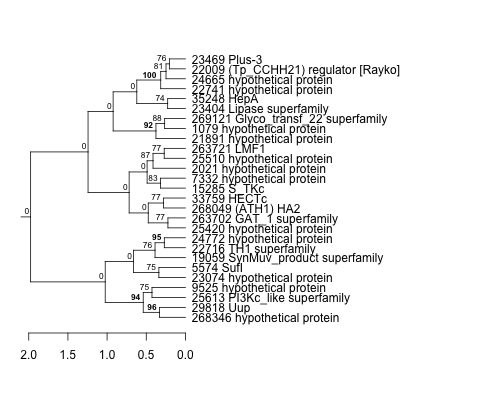
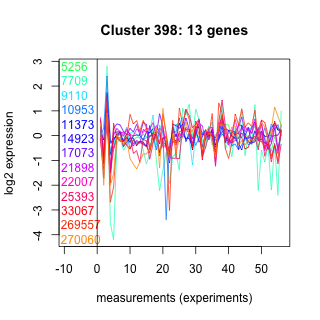
1.2 |
lowtemp_TMEVA | 0.031300 | -0.699 |
| Title | Cluster Plot | Dendrogram | e-value | e-value | e-value | Condition | Condition FDR | Condition Difference |
|---|---|---|---|---|---|---|---|---|
| Thaps_hclust_0013 |
 |
 |
0.000000021 |
0.00018 |
0.025 |
lowSi_TMEVA | 0.031300 | -0.675 |
| Title | Cluster Plot | Dendrogram | e-value | e-value | e-value | Condition | Condition FDR | Condition Difference |
|---|---|---|---|---|---|---|---|---|
| Thaps_hclust_0252 |
 |
 |
0.000053 |
0.0057 |
2.1 |
co2_elevated_stat_arrays | 0.031300 | -0.396 |
| Title | Cluster Plot | Dendrogram | e-value | e-value | e-value | Condition | Condition FDR | Condition Difference |
|---|---|---|---|---|---|---|---|---|
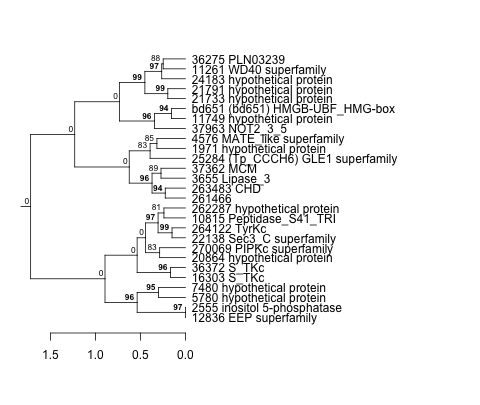
| Thaps_hclust_0269 |
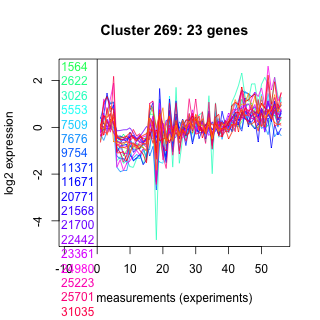 |
 |
0.0025 |
0.032 |
0.077 |
lowtemp_TMEVA | 0.031300 | 0.517 |
| Title | Cluster Plot | Dendrogram | e-value | e-value | e-value | Condition | Condition FDR | Condition Difference |
|---|---|---|---|---|---|---|---|---|
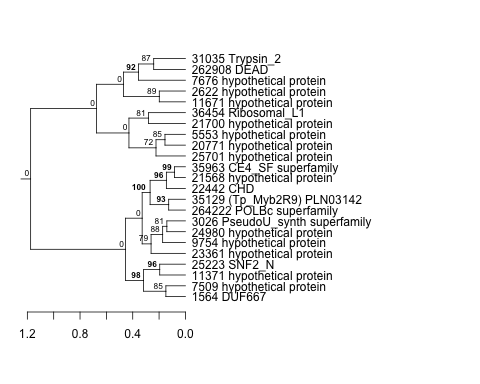
| Thaps_hclust_0465 |
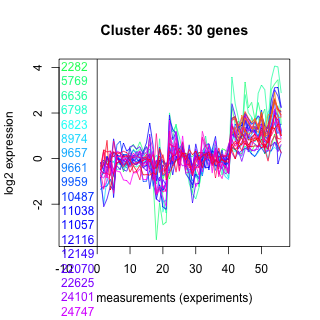 |
 |
0.011 |
0.053 |
0.75 |
highlight_arrays | 0.031500 | -0.269 |