Hierarchical Clusters
Displaying 27701 - 27800 of 28001
| Title | Cluster Plot | Dendrogram | e-value | e-value | e-value | Condition | Condition FDR | Condition Difference |
|---|---|---|---|---|---|---|---|---|
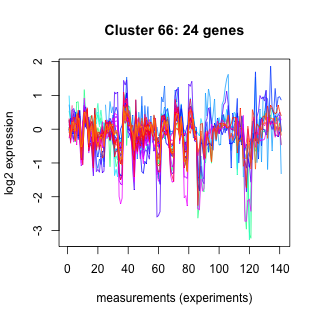
| Phatr_hclust_0066 |
 |
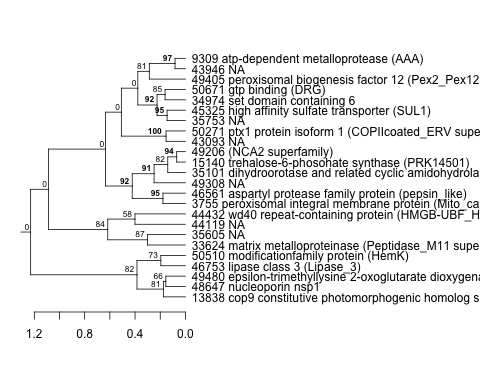 |
0.0000024 |
140 |
1100 |
Cadmium_1.2mg | 1.000000 | -0.000219687 |
| Phatr_hclust_0066 |
|
|
0.0000024 |
140 |
1100 |
light_16hr_dark_7.5hr | 1.000000 | 1.24e-17 |
| Title | Cluster Plot | Dendrogram | e-value | e-value | e-value | Condition | Condition FDR | Condition Difference |
|---|---|---|---|---|---|---|---|---|
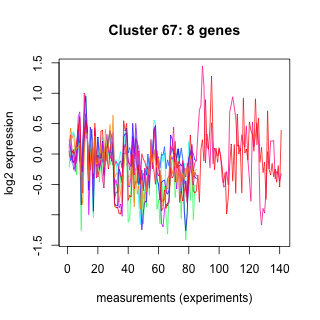
| Phatr_hclust_0067 |
 |
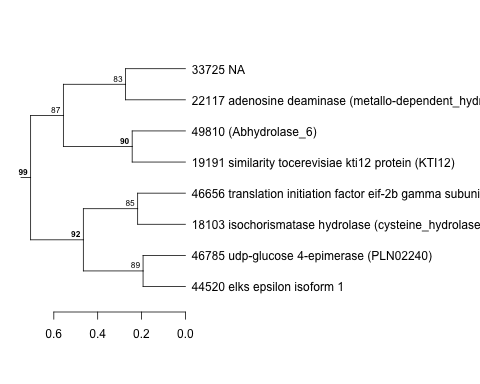 |
10 |
17 |
1200 |
light_16hr_dark_7.5hr | 1.000000 | 0 |
| Title | Cluster Plot | Dendrogram | e-value | e-value | e-value | Condition | Condition FDR | Condition Difference |
|---|---|---|---|---|---|---|---|---|
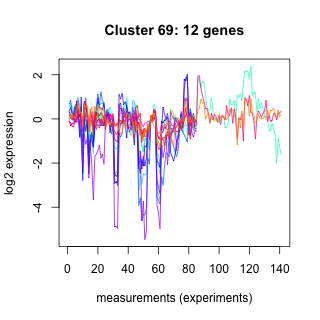
| Phatr_hclust_0069 |
 |
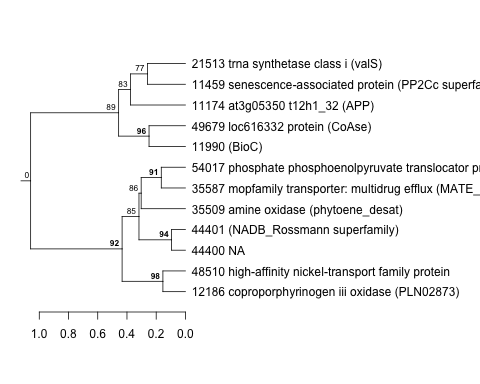 |
20 |
150 |
280 |
light_16hr_dark_7.5hr | 1.000000 | -1.16e-18 |
| Title | Cluster Plot | Dendrogram | e-value | e-value | e-value | Condition | Condition FDR | Condition Difference |
|---|---|---|---|---|---|---|---|---|
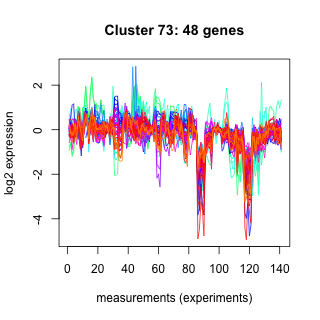
| Phatr_hclust_0073 |
 |
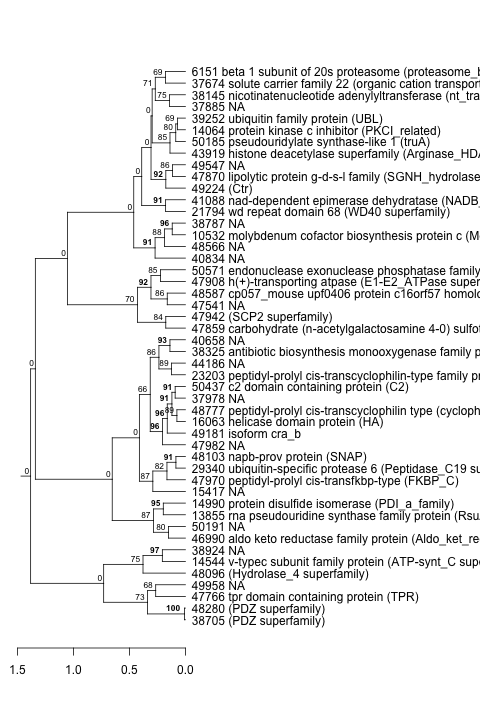 |
0.0000000013 |
5.1 |
150 |
light_16hr_dark_7.5hr | 1.000000 | 1.34e-18 |
| Title | Cluster Plot | Dendrogram | e-value | e-value | e-value | Condition | Condition FDR | Condition Difference |
|---|---|---|---|---|---|---|---|---|
| Phatr_hclust_0075 |
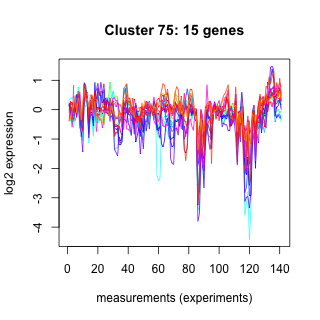 |
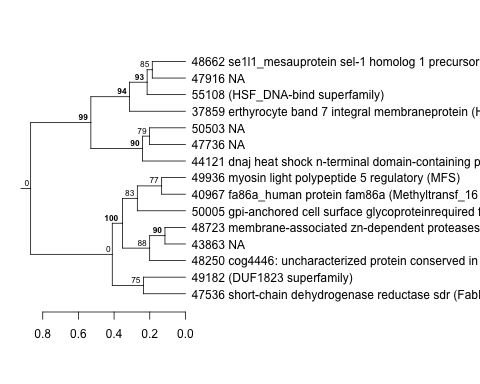 |
53 |
430 |
1800 |
Copper_SH | 1.000000 | -0.000355839 |
| Phatr_hclust_0075 |
|
|
53 |
430 |
1800 |
light_16hr_dark_7.5hr | 1.000000 | -6.86e-19 |
| Title | Cluster Plot | Dendrogram | e-value | e-value | e-value | Condition | Condition FDR | Condition Difference |
|---|---|---|---|---|---|---|---|---|
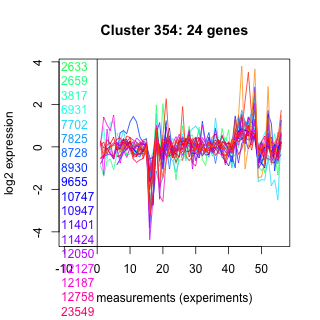
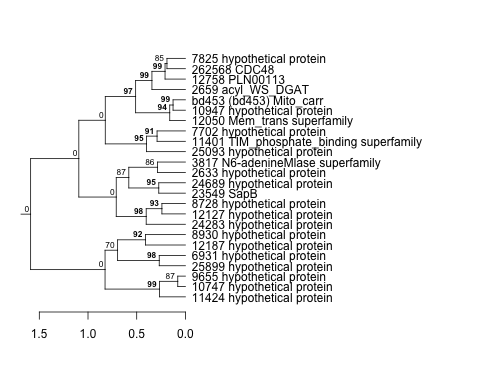
| Thaps_hclust_0353 |
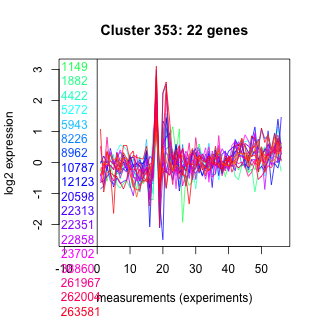 |
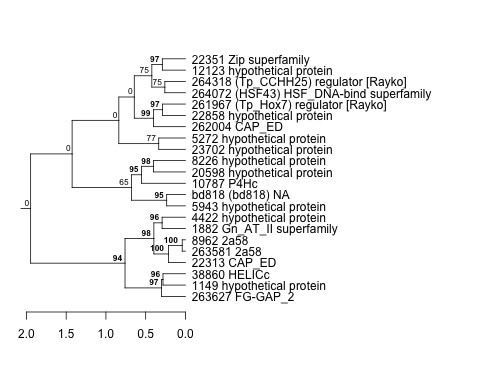 |
0.076 |
1.5 |
0.87 |
lowSi_TMEVA | 1.000000 | -0.0506 |
| Title | Cluster Plot | Dendrogram | e-value | e-value | e-value | Condition | Condition FDR | Condition Difference |
|---|---|---|---|---|---|---|---|---|
| Thaps_hclust_0354 |
 |
 |
0.027 |
0.032 |
0.78 |
lowSi_TMEVA | 1.000000 | 0.0568 |
| Title | Cluster Plot | Dendrogram | e-value | e-value | e-value | Condition | Condition FDR | Condition Difference |
|---|---|---|---|---|---|---|---|---|
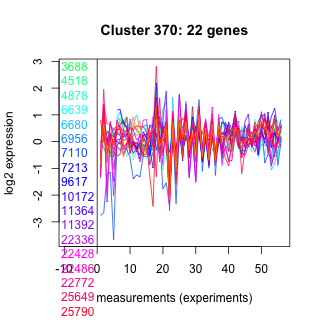
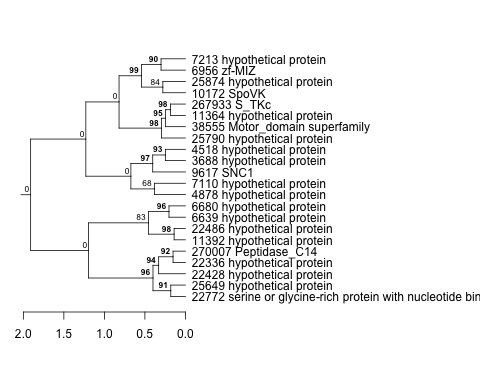
| Thaps_hclust_0370 |
 |
 |
0.55 |
1 |
7 |
lowSi_TMEVA | 1.000000 | 0.0794 |
| Title | Cluster Plot | Dendrogram | e-value | e-value | e-value | Condition | Condition FDR | Condition Difference |
|---|---|---|---|---|---|---|---|---|
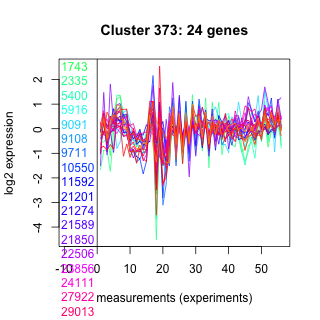
| Thaps_hclust_0373 |
 |
 |
0.00017 |
0.001 |
0.066 |
lowSi_TMEVA | 1.000000 | -0.0116 |
| Title | Cluster Plot | Dendrogram | e-value | e-value | e-value | Condition | Condition FDR | Condition Difference |
|---|---|---|---|---|---|---|---|---|
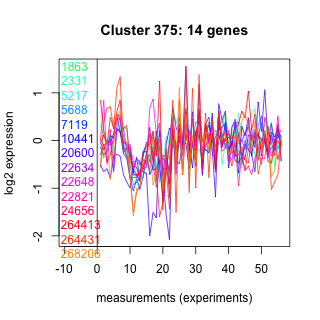
| Thaps_hclust_0375 |
 |
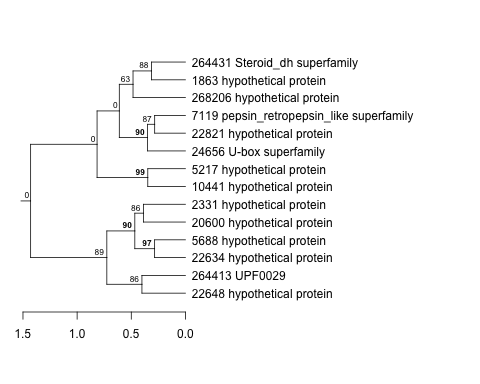 |
1.8 |
2.9 |
40 |
lowSi_TMEVA | 1.000000 | -0.0459 |
| Title | Cluster Plot | Dendrogram | e-value | e-value | e-value | Condition | Condition FDR | Condition Difference |
|---|---|---|---|---|---|---|---|---|
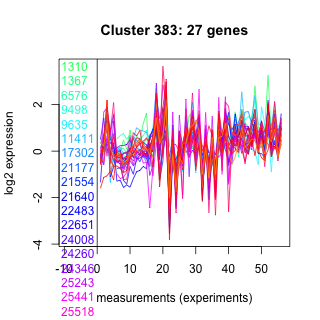
| Thaps_hclust_0383 |
 |
 |
0.00049 |
0.088 |
0.58 |
lowSi_TMEVA | 1.000000 | -0.0621 |
| Title | Cluster Plot | Dendrogram | e-value | e-value | e-value | Condition | Condition FDR | Condition Difference |
|---|---|---|---|---|---|---|---|---|
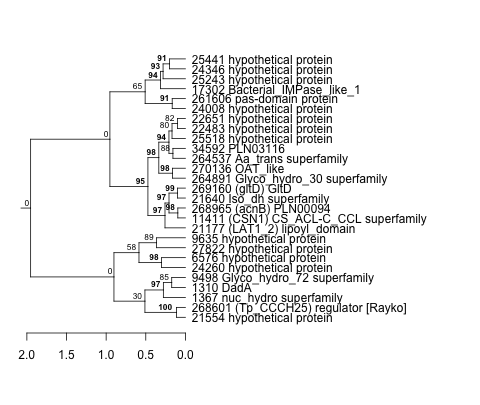
| Thaps_hclust_0401 |
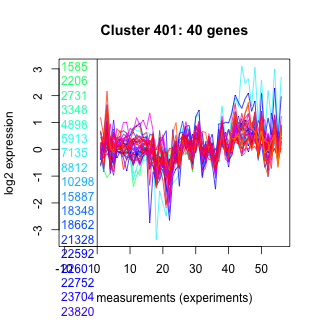 |
 |
3.5e-16 |
0.000000000077 |
0.000000012 |
lowtemp_TMEVA | 1.000000 | 0.0000689 |
| Title | Cluster Plot | Dendrogram | e-value | e-value | e-value | Condition | Condition FDR | Condition Difference |
|---|---|---|---|---|---|---|---|---|
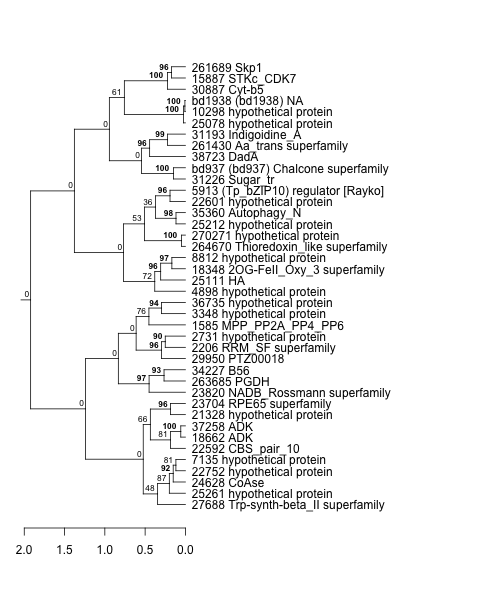
| Thaps_hclust_0403 |
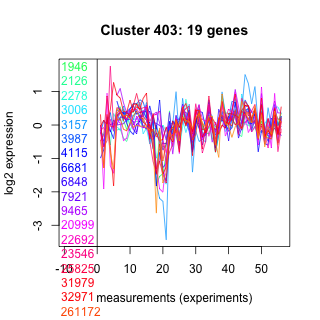 |
 |
0.83 |
0.015 |
0.016 |
lowSi_TMEVA | 1.000000 | -0.077 |
| Title | Cluster Plot | Dendrogram | e-value | e-value | e-value | Condition | Condition FDR | Condition Difference |
|---|---|---|---|---|---|---|---|---|
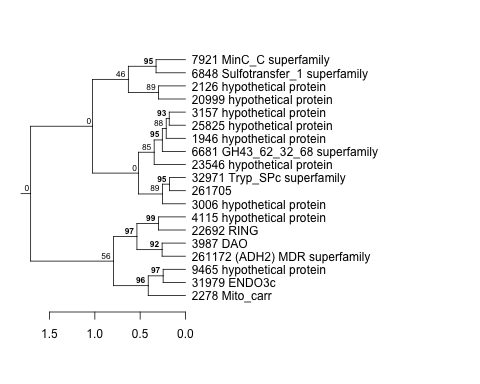
| Thaps_hclust_0410 |
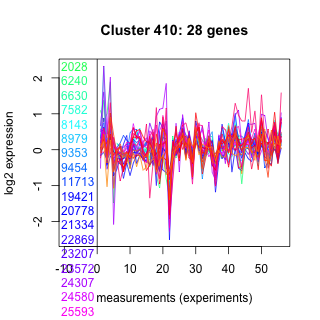 |
 |
0.065 |
0.56 |
0.36 |
co2_elevated_expo_arrays | 1.000000 | 0.000102 |
| Title | Cluster Plot | Dendrogram | e-value | e-value | e-value | Condition | Condition FDR | Condition Difference |
|---|---|---|---|---|---|---|---|---|
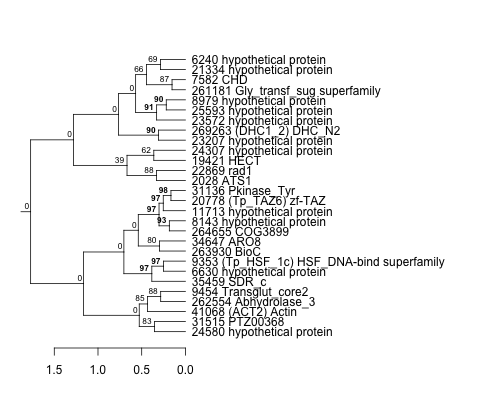
| Thaps_hclust_0414 |
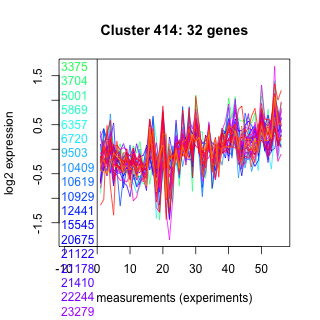 |
 |
0.0000000000028 |
0.00000026 |
0.000019 |
lowSi_TMEVA | 1.000000 | 0.065 |
| Title | Cluster Plot | Dendrogram | e-value | e-value | e-value | Condition | Condition FDR | Condition Difference |
|---|---|---|---|---|---|---|---|---|
| Thaps_hclust_0420 |
 |
 |
0.000009 |
0.00077 |
0.53 |
lowSi_TMEVA | 1.000000 | -0.0413 |
| Title | Cluster Plot | Dendrogram | e-value | e-value | e-value | Condition | Condition FDR | Condition Difference |
|---|---|---|---|---|---|---|---|---|
| Thaps_hclust_0422 |
 |
 |
1.9 |
15 |
0.0027 |
lowSi_TMEVA | 1.000000 | 0.0343 |
| Title | Cluster Plot | Dendrogram | e-value | e-value | e-value | Condition | Condition FDR | Condition Difference |
|---|---|---|---|---|---|---|---|---|
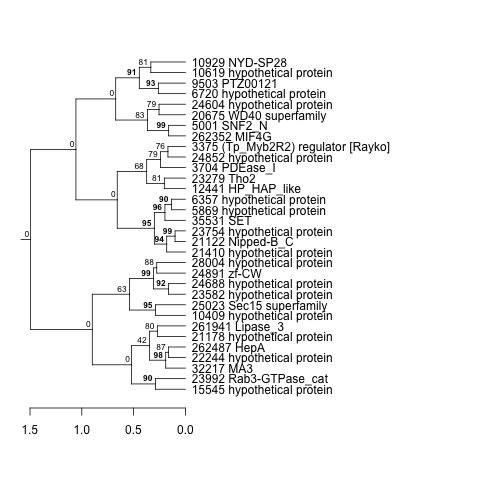
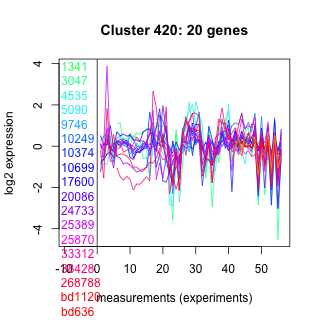
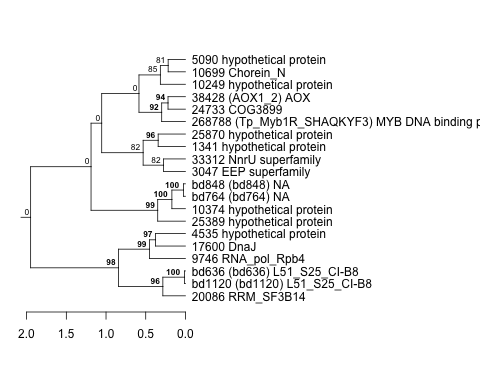
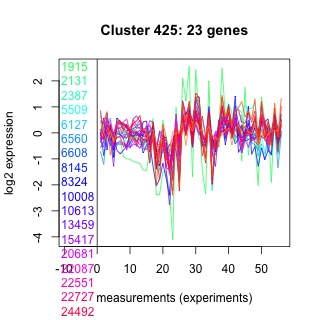
| Thaps_hclust_0425 |
 |
 |
0.017 |
1.1 |
140 |
lowSi_TMEVA | 1.000000 | -0.025 |
| Title | Cluster Plot | Dendrogram | e-value | e-value | e-value | Condition | Condition FDR | Condition Difference |
|---|---|---|---|---|---|---|---|---|
| Thaps_hclust_0427 |
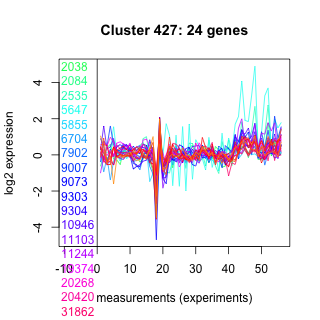 |
 |
0.0000022 |
8.8 |
40 |
lowSi_TMEVA | 1.000000 | 0.0889 |
| Title | Cluster Plot | Dendrogram | e-value | e-value | e-value | Condition | Condition FDR | Condition Difference |
|---|---|---|---|---|---|---|---|---|
| Thaps_hclust_0430 |
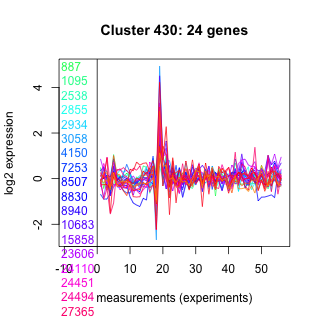 |
 |
0.0000088 |
0.0043 |
0.22 |
highpH_TMEVA | 1.000000 | -0.00175 |
| Title | Cluster Plot | Dendrogram | e-value | e-value | e-value | Condition | Condition FDR | Condition Difference |
|---|---|---|---|---|---|---|---|---|
| Thaps_hclust_0433 |
 |
 |
14 |
54 |
440 |
lowSi_TMEVA | 1.000000 | -0.0409 |
| Title | Cluster Plot | Dendrogram | e-value | e-value | e-value | Condition | Condition FDR | Condition Difference |
|---|---|---|---|---|---|---|---|---|
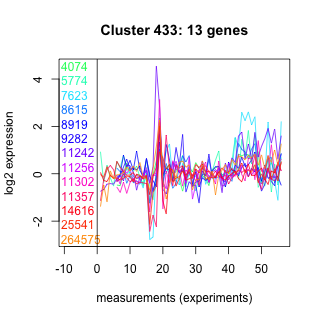
| Thaps_hclust_0434 |
 |
 |
0.011 |
17 |
57 |
lowSi_TMEVA | 1.000000 | 0.0404 |
| Title | Cluster Plot | Dendrogram | e-value | e-value | e-value | Condition | Condition FDR | Condition Difference |
|---|---|---|---|---|---|---|---|---|
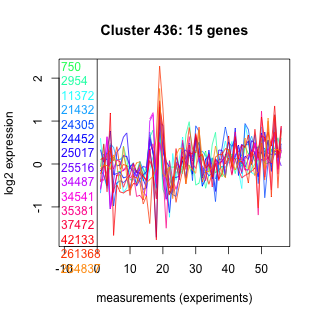
| Thaps_hclust_0436 |
 |
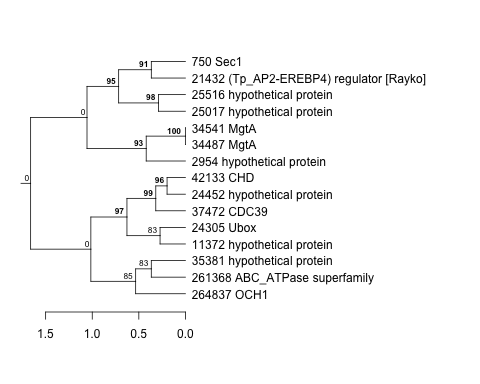 |
0.067 |
0.93 |
0.55 |
lowSi_TMEVA | 1.000000 | 0.0422 |
| Title | Cluster Plot | Dendrogram | e-value | e-value | e-value | Condition | Condition FDR | Condition Difference |
|---|---|---|---|---|---|---|---|---|
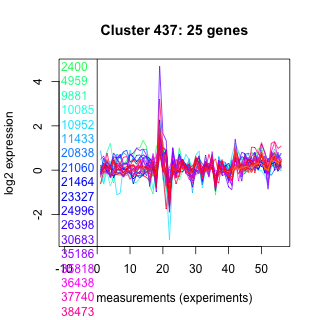
| Thaps_hclust_0437 |
 |
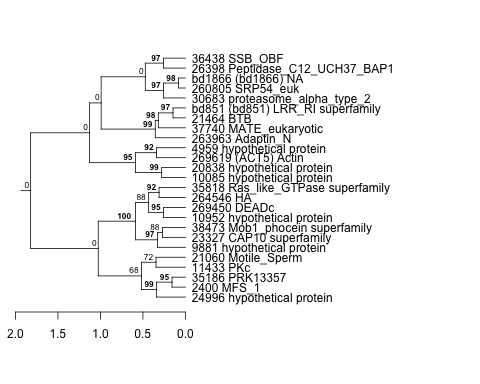 |
0.000000016 |
0.0023 |
3.3 |
lowSi_TMEVA | 1.000000 | 0.00799 |
| Title | Cluster Plot | Dendrogram | e-value | e-value | e-value | Condition | Condition FDR | Condition Difference |
|---|---|---|---|---|---|---|---|---|
| Thaps_hclust_0448 |
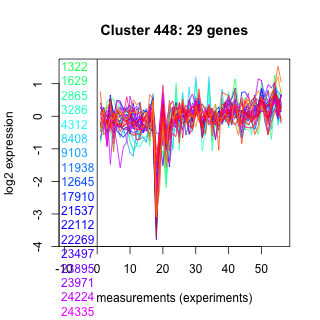 |
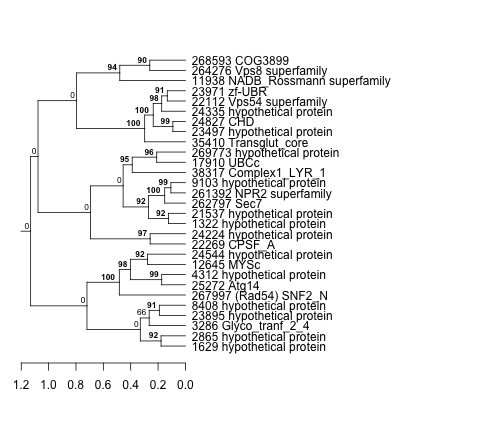 |
0.0000000026 |
0.00021 |
8.2 |
lowSi_TMEVA | 1.000000 | -0.00491 |
| Title | Cluster Plot | Dendrogram | e-value | e-value | e-value | Condition | Condition FDR | Condition Difference |
|---|---|---|---|---|---|---|---|---|
| Thaps_hclust_0449 |
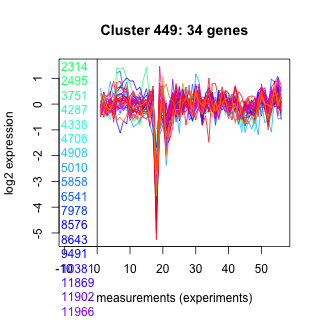 |
 |
0.0000000011 |
0.012 |
3.5 |
lowSi_TMEVA | 1.000000 | -0.0133 |
| Title | Cluster Plot | Dendrogram | e-value | e-value | e-value | Condition | Condition FDR | Condition Difference |
|---|---|---|---|---|---|---|---|---|
| Thaps_hclust_0451 |
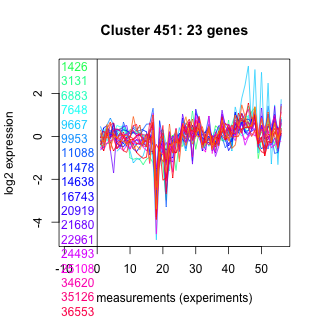 |
 |
10 |
0.0026 |
160 |
lowSi_TMEVA | 1.000000 | 0.00553 |
| Title | Cluster Plot | Dendrogram | e-value | e-value | e-value | Condition | Condition FDR | Condition Difference |
|---|---|---|---|---|---|---|---|---|
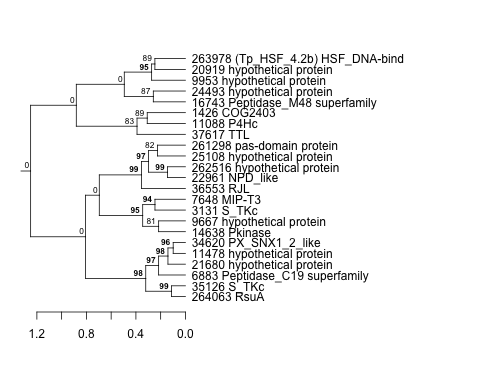
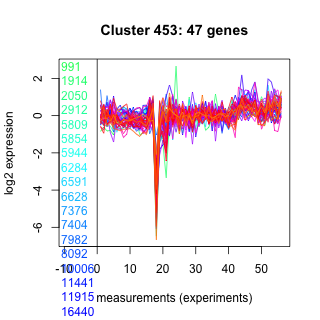
| Thaps_hclust_0453 |
 |
 |
0.000000000093 |
0.000000041 |
0.00016 |
lowSi_TMEVA | 1.000000 | -0.00447 |
| Title | Cluster Plot | Dendrogram | e-value | e-value | e-value | Condition | Condition FDR | Condition Difference |
|---|---|---|---|---|---|---|---|---|
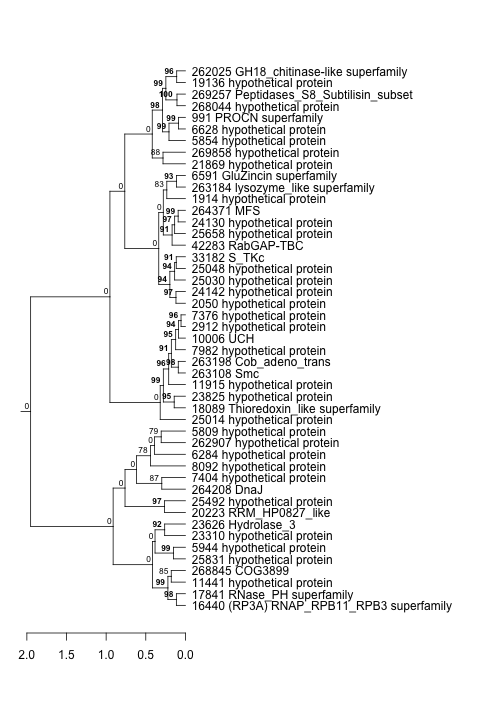
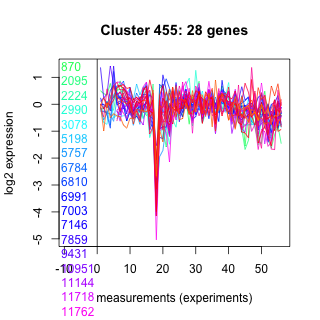
| Thaps_hclust_0455 |
 |
 |
0.00038 |
0.18 |
0.01 |
lowSi_TMEVA | 1.000000 | 0.00972 |
| Title | Cluster Plot | Dendrogram | e-value | e-value | e-value | Condition | Condition FDR | Condition Difference |
|---|---|---|---|---|---|---|---|---|
| Thaps_hclust_0461 |
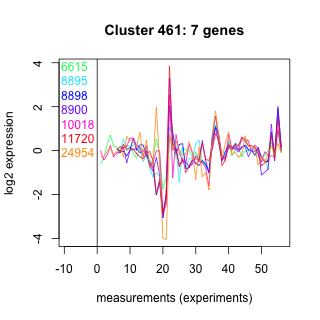 |
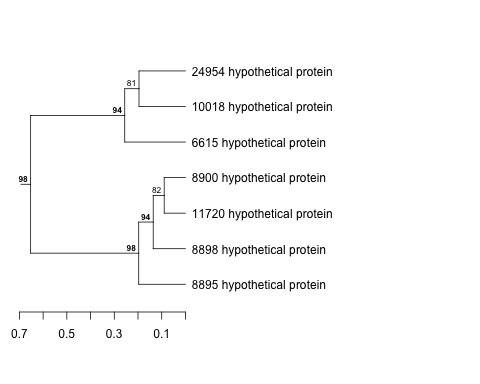 |
0.00000000082 |
0.01 |
0.079 |
lowN_TMEVA | 1.000000 | -0.0032 |
| Title | Cluster Plot | Dendrogram | e-value | e-value | e-value | Condition | Condition FDR | Condition Difference |
|---|---|---|---|---|---|---|---|---|
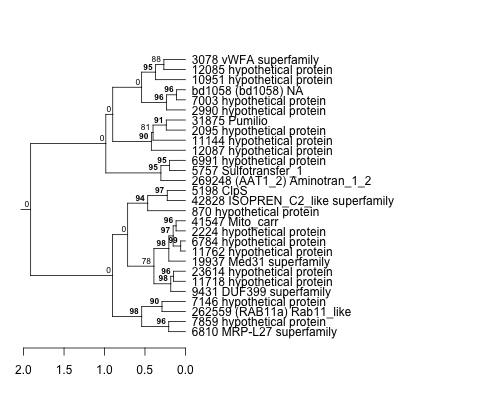
| Thaps_hclust_0467 |
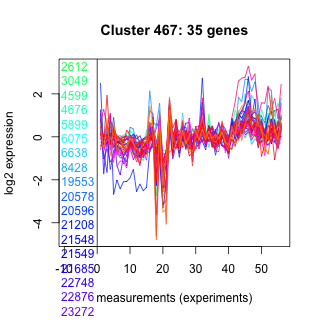 |
 |
0.000000000002 |
0.0000014 |
0.035 |
lowSi_TMEVA | 1.000000 | -0.0909 |
| Title | Cluster Plot | Dendrogram | e-value | e-value | e-value | Condition | Condition FDR | Condition Difference |
|---|---|---|---|---|---|---|---|---|
| Thaps_hclust_0468 |
 |
 |
0.0023 |
0.08 |
2.3 |
lowSi_TMEVA | 1.000000 | 0.0786 |
| Title | Cluster Plot | Dendrogram | e-value | e-value | e-value | Condition | Condition FDR | Condition Difference |
|---|---|---|---|---|---|---|---|---|
| Thaps_hclust_0469 |
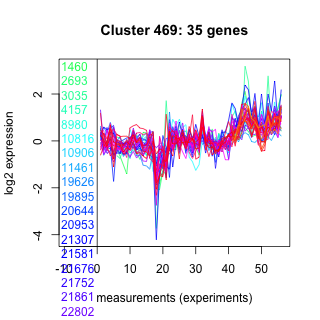 |
 |
0.000013 |
0.00011 |
0.00029 |
lowSi_TMEVA | 1.000000 | 0.092 |
| Title | Cluster Plot | Dendrogram | e-value | e-value | e-value | Condition | Condition FDR | Condition Difference |
|---|---|---|---|---|---|---|---|---|
| Thaps_hclust_0471 |
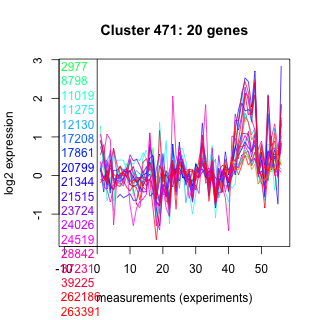 |
 |
0.0086 |
0.14 |
2.6 |
lowSi_TMEVA | 1.000000 | 0.0402 |
| Title | Cluster Plot | Dendrogram | e-value | e-value | e-value | Condition | Condition FDR | Condition Difference |
|---|---|---|---|---|---|---|---|---|
| Thaps_hclust_0473 |
 |
 |
0.00036 |
0.0036 |
0.68 |
highpH_TMEVA | 1.000000 | 0.00139 |
| Title | Cluster Plot | Dendrogram | e-value | e-value | e-value | Condition | Condition FDR | Condition Difference |
|---|---|---|---|---|---|---|---|---|
| Thaps_hclust_0474 |
 |
 |
0.0078 |
0.000018 |
0.003 |
lowSi_TMEVA | 1.000000 | -0.0645 |
| Title | Cluster Plot | Dendrogram | e-value | e-value | e-value | Condition | Condition FDR | Condition Difference |
|---|---|---|---|---|---|---|---|---|
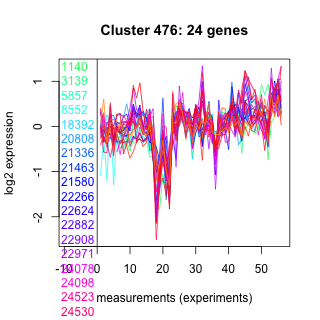
| Thaps_hclust_0476 |
 |
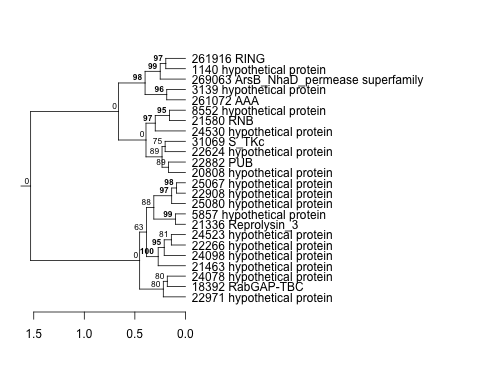 |
0.0015 |
0.56 |
2.4 |
lowSi_TMEVA | 1.000000 | 0.049 |
| Title | Cluster Plot | Dendrogram | e-value | e-value | e-value | Condition | Condition FDR | Condition Difference |
|---|---|---|---|---|---|---|---|---|
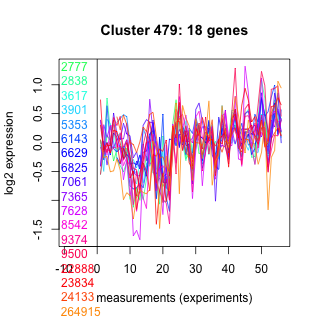
| Thaps_hclust_0479 |
 |
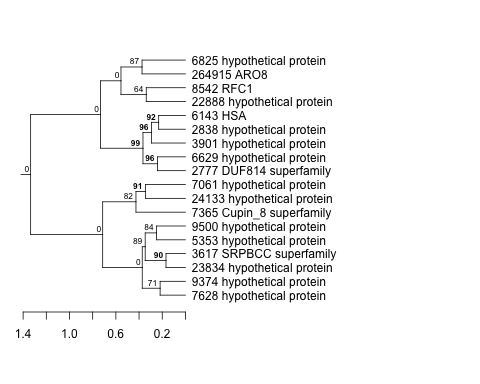 |
0.11 |
0.2 |
1.5 |
lowFe_KTKB_Day5 | 1.000000 | 0.000526 |
| Thaps_hclust_0479 |
|
|
0.11 |
0.2 |
1.5 |
lowSi_TMEVA | 1.000000 | -0.00149 |
| Title | Cluster Plot | Dendrogram | e-value | e-value | e-value | Condition | Condition FDR | Condition Difference |
|---|---|---|---|---|---|---|---|---|
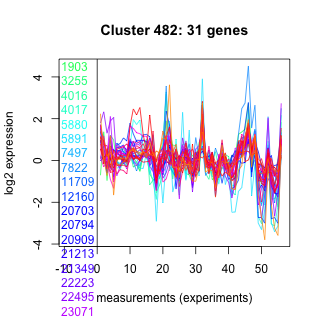
| Thaps_hclust_0482 |
 |
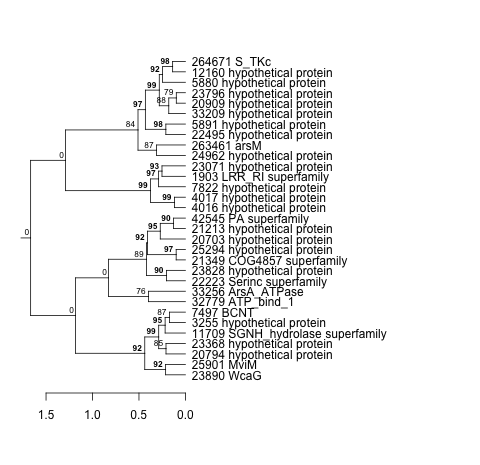 |
0.29 |
0.69 |
2.1 |
co2_elevated_expo_arrays | 1.000000 | -0.00161 |
| Title | Cluster Plot | Dendrogram | e-value | e-value | e-value | Condition | Condition FDR | Condition Difference |
|---|---|---|---|---|---|---|---|---|
| Thaps_hclust_0483 |
 |
 |
0.7 |
5 |
0.096 |
lowSi_TMEVA | 1.000000 | 0.0299 |
| Title | Cluster Plot | Dendrogram | e-value | e-value | e-value | Condition | Condition FDR | Condition Difference |
|---|---|---|---|---|---|---|---|---|
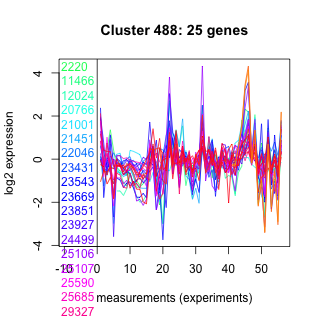
| Thaps_hclust_0488 |
 |
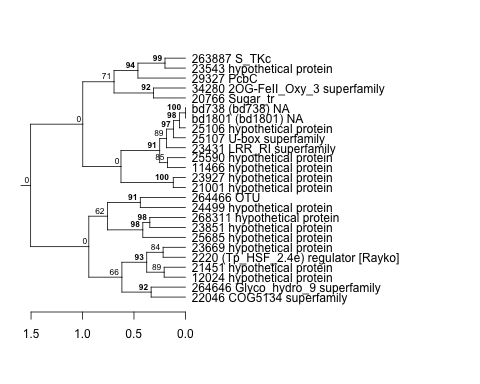 |
0.15 |
0.012 |
0.2 |
lowSi_TMEVA | 1.000000 | -0.0657 |
| Title | Cluster Plot | Dendrogram | e-value | e-value | e-value | Condition | Condition FDR | Condition Difference |
|---|---|---|---|---|---|---|---|---|
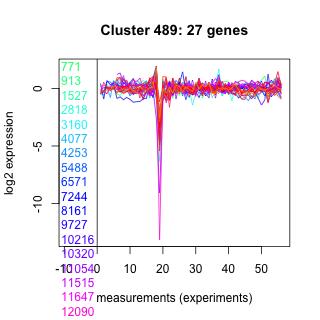
| Thaps_hclust_0489 |
 |
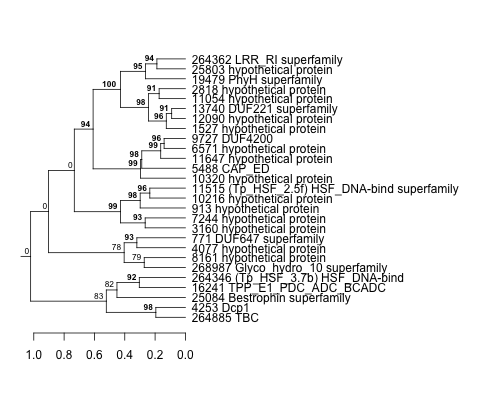 |
0.00024 |
0.0048 |
0.027 |
lowSi_TMEVA | 1.000000 | -0.0149 |
| Title | Cluster Plot | Dendrogram | e-value | e-value | e-value | Condition | Condition FDR | Condition Difference |
|---|---|---|---|---|---|---|---|---|
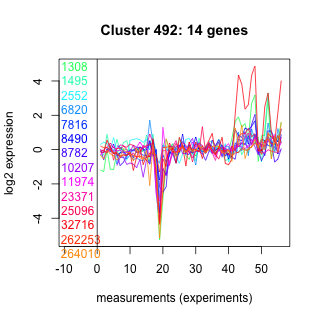
| Thaps_hclust_0492 |
 |
 |
0.29 |
0.47 |
23 |
lowSi_TMEVA | 1.000000 | -0.0745 |
| Title | Cluster Plot | Dendrogram | e-value | e-value | e-value | Condition | Condition FDR | Condition Difference |
|---|---|---|---|---|---|---|---|---|
| Phatr_hclust_0002 |
 |
 |
0.24 |
35 |
1100 |
light_16hr_dark_7.5hr | 1.000000 | -1.16e-18 |
| Title | Cluster Plot | Dendrogram | e-value | e-value | e-value | Condition | Condition FDR | Condition Difference |
|---|---|---|---|---|---|---|---|---|
| Phatr_hclust_0003 |
 |
 |
7.8 |
22 |
24 |
light_16hr_dark_7.5hr | 1.000000 | -4.86e-18 |
| Title | Cluster Plot | Dendrogram | e-value | e-value | e-value | Condition | Condition FDR | Condition Difference |
|---|---|---|---|---|---|---|---|---|
| Phatr_hclust_0006 |
 |
 |
15 |
530 |
1100 |
light_16hr_dark_7.5hr | 1.000000 | 0 |
| Title | Cluster Plot | Dendrogram | e-value | e-value | e-value | Condition | Condition FDR | Condition Difference |
|---|---|---|---|---|---|---|---|---|
| Phatr_hclust_0008 |
 |
 |
0.024 |
0.73 |
0.81 |
Simazine_SH | 1.000000 | 0.000392939 |
| Title | Cluster Plot | Dendrogram | e-value | e-value | e-value | Condition | Condition FDR | Condition Difference |
|---|---|---|---|---|---|---|---|---|
| Phatr_hclust_0010 |
 |
 |
20 |
66 |
620 |
light_16hr_dark_7.5hr | 1.000000 | 0 |
| Title | Cluster Plot | Dendrogram | e-value | e-value | e-value | Condition | Condition FDR | Condition Difference |
|---|---|---|---|---|---|---|---|---|
| Thaps_hclust_0004 |
 |
 |
0.000000074 |
0.0000031 |
0.0000044 |
lowSi_TMEVA | 1.000000 | -0.000448 |
| Title | Cluster Plot | Dendrogram | e-value | e-value | e-value | Condition | Condition FDR | Condition Difference |
|---|---|---|---|---|---|---|---|---|
| Thaps_hclust_0008 |
 |
 |
0.000000000000034 |
0.0000000000037 |
0.0000000000018 |
highpH_TMEVA | 1.000000 | -0.00133 |
| Thaps_hclust_0008 |
|
|
0.000000000000034 |
0.0000000000037 |
0.0000000000018 |
co2_elevated_expo_arrays | 1.000000 | 0.00183 |
| Title | Cluster Plot | Dendrogram | e-value | e-value | e-value | Condition | Condition FDR | Condition Difference |
|---|---|---|---|---|---|---|---|---|
| Thaps_hclust_0013 |
 |
 |
0.000000021 |
0.00018 |
0.025 |
co2_elevated_expo_arrays | 1.000000 | -0.00107 |
| Title | Cluster Plot | Dendrogram | e-value | e-value | e-value | Condition | Condition FDR | Condition Difference |
|---|---|---|---|---|---|---|---|---|
| Thaps_hclust_0025 |
 |
 |
0.14 |
0.45 |
4.6 |
lowSi_TMEVA | 1.000000 | -0.0202 |
| Title | Cluster Plot | Dendrogram | e-value | e-value | e-value | Condition | Condition FDR | Condition Difference |
|---|---|---|---|---|---|---|---|---|
| Thaps_hclust_0028 |
 |
|
1.6e-27 |
6.8e-18 |
0.0000000000000078 |
co2_elevated_expo_arrays | 1.000000 | 0.00454 |
| Title | Cluster Plot | Dendrogram | e-value | e-value | e-value | Condition | Condition FDR | Condition Difference |
|---|---|---|---|---|---|---|---|---|
| Thaps_hclust_0037 |
 |
 |
0.23 |
0.79 |
340 |
lowSi_TMEVA | 1.000000 | -0.0214 |
| Title | Cluster Plot | Dendrogram | e-value | e-value | e-value | Condition | Condition FDR | Condition Difference |
|---|---|---|---|---|---|---|---|---|
| Thaps_hclust_0040 |
 |
 |
1.8e-29 |
0.000000000042 |
0.00000000063 |
lowFe_KTKB_Day3 | 1.000000 | |
| Thaps_hclust_0040 |
|
|
1.8e-29 |
0.000000000042 |
0.00000000063 |
lowFe_KTKB_Day5 | 1.000000 | |
| Thaps_hclust_0040 |
|
|
1.8e-29 |
0.000000000042 |
0.00000000063 |
BaP | 1.000000 | |
| Thaps_hclust_0040 |
|
|
1.8e-29 |
0.000000000042 |
0.00000000063 |
lowtemp_TMEVA | 1.000000 | |
| Thaps_hclust_0040 |
|
|
1.8e-29 |
0.000000000042 |
0.00000000063 |
highpH_TMEVA | 1.000000 | |
| Thaps_hclust_0040 |
|
|
1.8e-29 |
0.000000000042 |
0.00000000063 |
lowFe_TMEVA | 1.000000 | |
| Thaps_hclust_0040 |
|
|
1.8e-29 |
0.000000000042 |
0.00000000063 |
lowN_TMEVA | 1.000000 | |
| Thaps_hclust_0040 |
|
|
1.8e-29 |
0.000000000042 |
0.00000000063 |
lowSi_TMEVA | 1.000000 |
| Title | Cluster Plot | Dendrogram | e-value | e-value | e-value | Condition | Condition FDR | Condition Difference |
|---|---|---|---|---|---|---|---|---|
| Thaps_hclust_0042 |
 |
 |
0.26 |
5.9 |
0.46 |
lowSi_TMEVA | 1.000000 | 0.0000692 |
| Title | Cluster Plot | Dendrogram | e-value | e-value | e-value | Condition | Condition FDR | Condition Difference |
|---|---|---|---|---|---|---|---|---|
| Thaps_hclust_0044 |
 |
 |
0.27 |
2.6 |
4.2 |
co2_elevated_expo_arrays | 1.000000 | 0.00173 |
| Title | Cluster Plot | Dendrogram | e-value | e-value | e-value | Condition | Condition FDR | Condition Difference |
|---|---|---|---|---|---|---|---|---|
| Thaps_hclust_0048 |
 |
 |
4.8e-17 |
0.000000018 |
0.0000097 |
BaP | 1.000000 | 0.000608 |
| Title | Cluster Plot | Dendrogram | e-value | e-value | e-value | Condition | Condition FDR | Condition Difference |
|---|---|---|---|---|---|---|---|---|
| Thaps_hclust_0050 |
 |
 |
0.0000000011 |
0.0000042 |
0.00021 |
co2_elevated_expo_arrays | 1.000000 | -0.00401 |
| Title | Cluster Plot | Dendrogram | e-value | e-value | e-value | Condition | Condition FDR | Condition Difference |
|---|---|---|---|---|---|---|---|---|
| Thaps_hclust_0051 |
 |
 |
0.012 |
0.033 |
0.41 |
highpH_TMEVA | 1.000000 | 0.00166 |
| Title | Cluster Plot | Dendrogram | e-value | e-value | e-value | Condition | Condition FDR | Condition Difference |
|---|---|---|---|---|---|---|---|---|
| Thaps_hclust_0052 |
 |
 |
1.4e-22 |
3.3e-19 |
0.0000000000037 |
co2_elevated_expo_arrays | 1.000000 | 0.00058 |
| Title | Cluster Plot | Dendrogram | e-value | e-value | e-value | Condition | Condition FDR | Condition Difference |
|---|---|---|---|---|---|---|---|---|
| Thaps_hclust_0057 |
 |
 |
1.5 |
1.7 |
12 |
diel_light_vs_dark | 1.000000 | |
| Thaps_hclust_0057 |
|
|
1.5 |
1.7 |
12 |
diel_exponential_vs_stationary | 1.000000 |
| Title | Cluster Plot | Dendrogram | e-value | e-value | e-value | Condition | Condition FDR | Condition Difference |
|---|---|---|---|---|---|---|---|---|
| Thaps_hclust_0062 |
 |
 |
0.000000026 |
0.000000021 |
0.000000000021 |
lowFe_KTKB_Day3 | 1.000000 | |
| Thaps_hclust_0062 |
|
|
0.000000026 |
0.000000021 |
0.000000000021 |
lowFe_KTKB_Day5 | 1.000000 | |
| Thaps_hclust_0062 |
|
|
0.000000026 |
0.000000021 |
0.000000000021 |
BaP | 1.000000 | |
| Thaps_hclust_0062 |
|
|
0.000000026 |
0.000000021 |
0.000000000021 |
lowtemp_TMEVA | 1.000000 | |
| Thaps_hclust_0062 |
|
|
0.000000026 |
0.000000021 |
0.000000000021 |
highpH_TMEVA | 1.000000 | |
| Thaps_hclust_0062 |
|
|
0.000000026 |
0.000000021 |
0.000000000021 |
lowFe_TMEVA | 1.000000 | |
| Thaps_hclust_0062 |
|
|
0.000000026 |
0.000000021 |
0.000000000021 |
lowN_TMEVA | 1.000000 | |
| Thaps_hclust_0062 |
|
|
0.000000026 |
0.000000021 |
0.000000000021 |
lowSi_TMEVA | 1.000000 |
| Title | Cluster Plot | Dendrogram | e-value | e-value | e-value | Condition | Condition FDR | Condition Difference |
|---|---|---|---|---|---|---|---|---|
| Thaps_hclust_0064 |
 |
 |
0.000000012 |
0.00000073 |
0.0000002 |
lowSi_TMEVA | 1.000000 | -0.0228 |
| Title | Cluster Plot | Dendrogram | e-value | e-value | e-value | Condition | Condition FDR | Condition Difference |
|---|---|---|---|---|---|---|---|---|
| Thaps_hclust_0082 |
 |
|
8.89825e-43 |
2e-27 |
1.3e-16 |
lowtemp_TMEVA | 1.000000 | -0.000692 |
| Title | Cluster Plot | Dendrogram | e-value | e-value | e-value | Condition | Condition FDR | Condition Difference |
|---|---|---|---|---|---|---|---|---|
| Thaps_hclust_0084 |
 |
 |
0.0000000000035 |
0.00000025 |
0.12 |
lowSi_TMEVA | 1.000000 | -0.0169 |
| Title | Cluster Plot | Dendrogram | e-value | e-value | e-value | Condition | Condition FDR | Condition Difference |
|---|---|---|---|---|---|---|---|---|
| Thaps_hclust_0087 |
 |
 |
0.00000000000011 |
0.000026 |
0.028 |
lowSi_TMEVA | 1.000000 | -0.071 |
| Title | Cluster Plot | Dendrogram | e-value | e-value | e-value | Condition | Condition FDR | Condition Difference |
|---|---|---|---|---|---|---|---|---|
| Thaps_hclust_0088 |
 |
 |
0.036 |
27 |
18 |
lowSi_TMEVA | 1.000000 | 0.00955 |
| Title | Cluster Plot | Dendrogram | e-value | e-value | e-value | Condition | Condition FDR | Condition Difference |
|---|---|---|---|---|---|---|---|---|
| Thaps_hclust_0096 |
 |
 |
0.0000028 |
0.9 |
0.38 |
lowSi_TMEVA | 1.000000 | -0.038 |
| Title | Cluster Plot | Dendrogram | e-value | e-value | e-value | Condition | Condition FDR | Condition Difference |
|---|---|---|---|---|---|---|---|---|
| Thaps_hclust_0099 |
 |
 |
0.0000000000000032 |
0.000000000000013 |
0.000000000000025 |
co2_elevated_expo_arrays | 1.000000 | -0.00337 |
| Title | Cluster Plot | Dendrogram | e-value | e-value | e-value | Condition | Condition FDR | Condition Difference |
|---|---|---|---|---|---|---|---|---|
| Thaps_hclust_0109 |
 |
 |
17 |
32 |
5.5 |
lowSi_TMEVA | 1.000000 | -0.0551 |
| Title | Cluster Plot | Dendrogram | e-value | e-value | e-value | Condition | Condition FDR | Condition Difference |
|---|---|---|---|---|---|---|---|---|
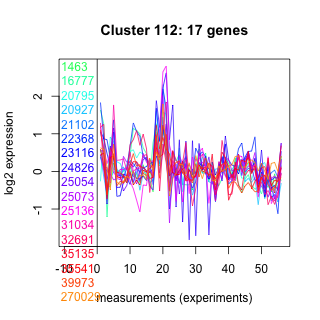
| Thaps_hclust_0112 |
 |
 |
0.00000035 |
0.017 |
0.34 |
lowFe_KTKB_Day5 | 1.000000 | -0.00139 |
| Title | Cluster Plot | Dendrogram | e-value | e-value | e-value | Condition | Condition FDR | Condition Difference |
|---|---|---|---|---|---|---|---|---|
| Thaps_hclust_0120 |
 |
 |
0.00000098 |
0.000000076 |
0.001 |
lowSi_TMEVA | 1.000000 | -0.0371 |
| Title | Cluster Plot | Dendrogram | e-value | e-value | e-value | Condition | Condition FDR | Condition Difference |
|---|---|---|---|---|---|---|---|---|
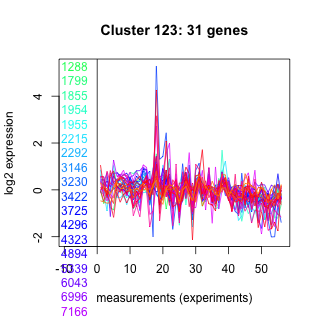
| Thaps_hclust_0123 |
 |
 |
0.000073 |
0.05 |
0.076 |
lowSi_TMEVA | 1.000000 | -0.0551 |
| Title | Cluster Plot | Dendrogram | e-value | e-value | e-value | Condition | Condition FDR | Condition Difference |
|---|---|---|---|---|---|---|---|---|
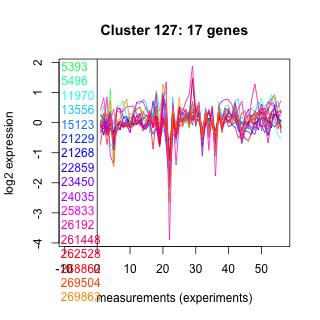
| Thaps_hclust_0127 |
 |
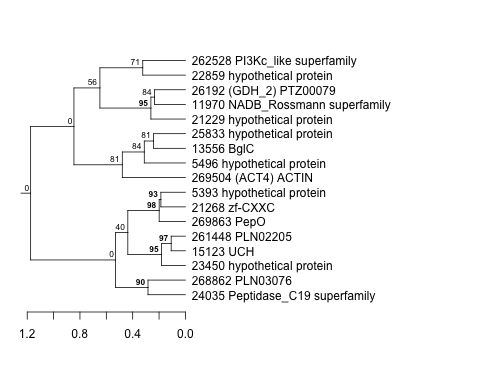 |
2.6 |
32 |
48 |
lowSi_TMEVA | 1.000000 | 0.0642 |
| Title | Cluster Plot | Dendrogram | e-value | e-value | e-value | Condition | Condition FDR | Condition Difference |
|---|---|---|---|---|---|---|---|---|
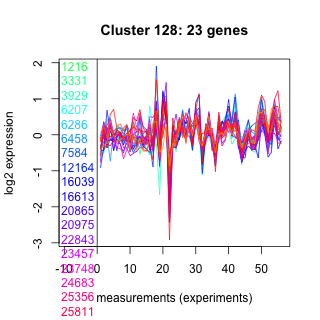
| Thaps_hclust_0128 |
 |
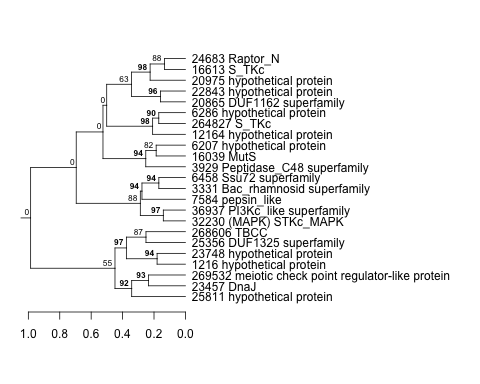 |
0.0000000058 |
0.00033 |
21 |
co2_elevated_expo_arrays | 1.000000 | 0.00246 |
| Title | Cluster Plot | Dendrogram | e-value | e-value | e-value | Condition | Condition FDR | Condition Difference |
|---|---|---|---|---|---|---|---|---|
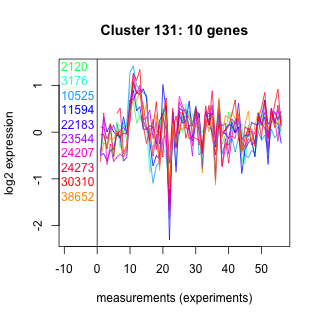
| Thaps_hclust_0131 |
 |
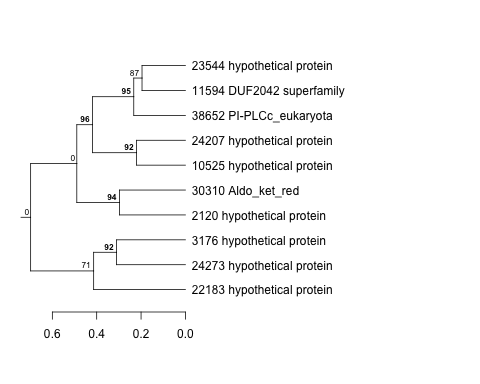 |
260 |
48 |
370 |
lowSi_TMEVA | 1.000000 | -0.0511 |
| Title | Cluster Plot | Dendrogram | e-value | e-value | e-value | Condition | Condition FDR | Condition Difference |
|---|---|---|---|---|---|---|---|---|
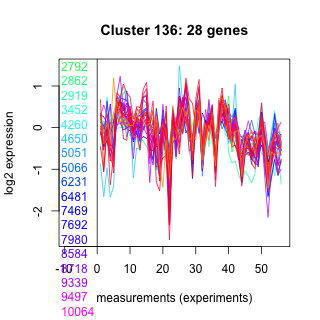
| Thaps_hclust_0136 |
 |
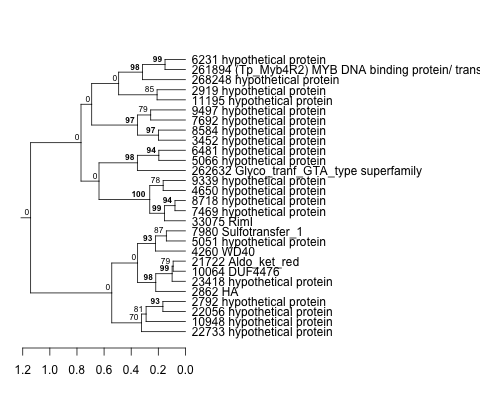 |
0.0034 |
0.034 |
340 |
lowN_TMEVA | 1.000000 | -0.00111 |
| Title | Cluster Plot | Dendrogram | e-value | e-value | e-value | Condition | Condition FDR | Condition Difference |
|---|---|---|---|---|---|---|---|---|
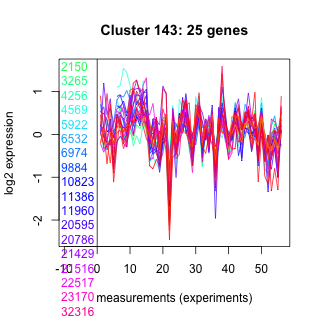
| Thaps_hclust_0143 |
 |
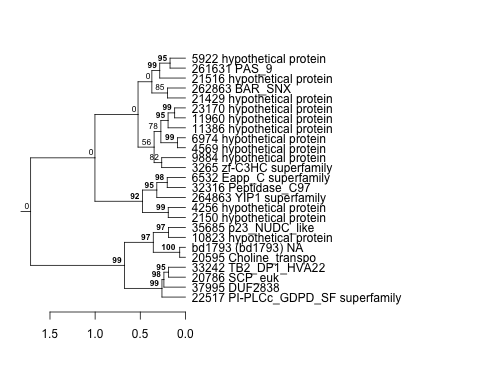 |
0.018 |
0.041 |
0.67 |
lowSi_TMEVA | 1.000000 | 0.0902 |
| Title | Cluster Plot | Dendrogram | e-value | e-value | e-value | Condition | Condition FDR | Condition Difference |
|---|---|---|---|---|---|---|---|---|
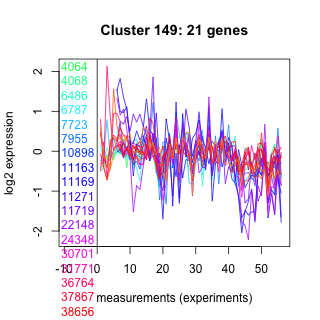
| Thaps_hclust_0149 |
 |
 |
0.00000027 |
0.46 |
3 |
lowSi_TMEVA | 1.000000 | -0.0367 |
| Title | Cluster Plot | Dendrogram | e-value | e-value | e-value | Condition | Condition FDR | Condition Difference |
|---|---|---|---|---|---|---|---|---|
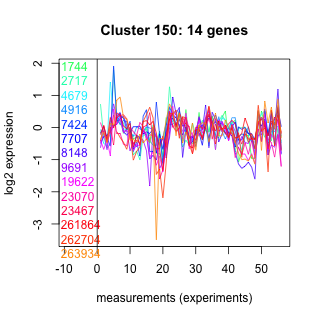
| Thaps_hclust_0150 |
 |
 |
0.16 |
0.73 |
6.8 |
lowSi_TMEVA | 1.000000 | -0.0264 |