Hierarchical Clusters
Displaying 1001 - 1100 of 7500
| Title | Cluster Plot | Dendrogram | e-value | e-value | e-value | Condition | Condition FDR | Condition Difference |
|---|---|---|---|---|---|---|---|---|
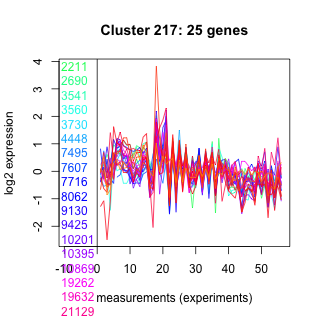
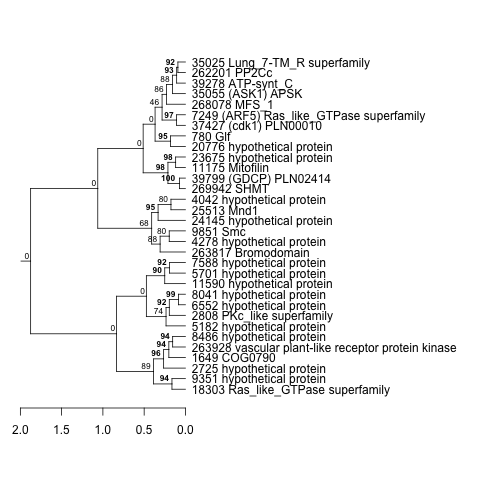
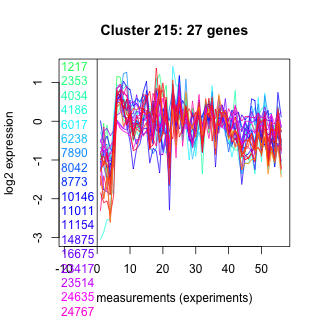
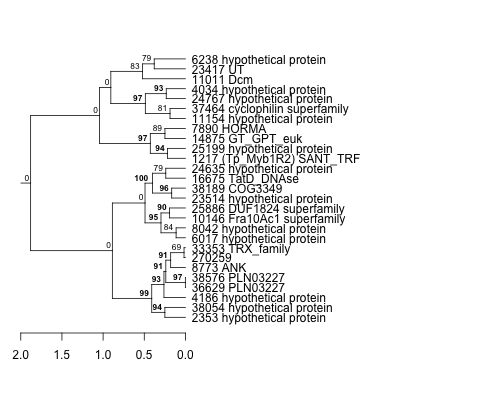
| Thaps_hclust_0217 |
 |
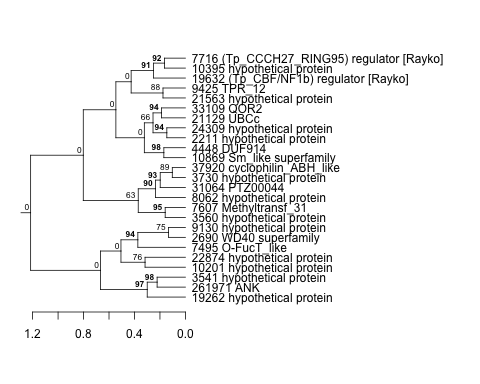 |
0.00000028 |
0.95 |
9.7 |
lowN_TMEVA | 0.362000 | -0.293 |
| Title | Cluster Plot | Dendrogram | e-value | e-value | e-value | Condition | Condition FDR | Condition Difference |
|---|---|---|---|---|---|---|---|---|
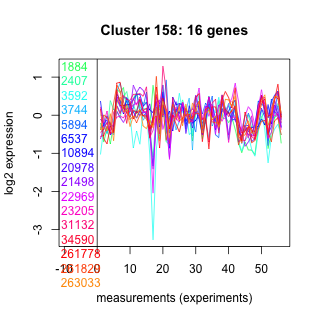
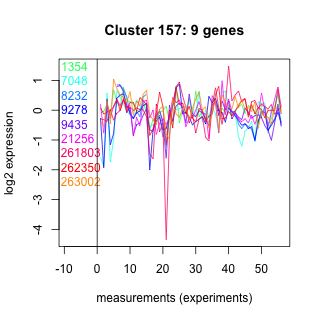
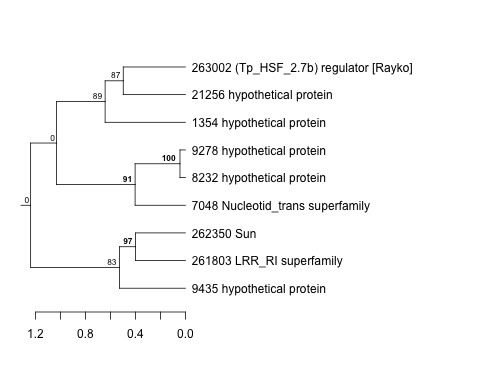
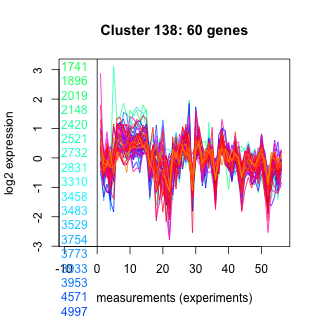
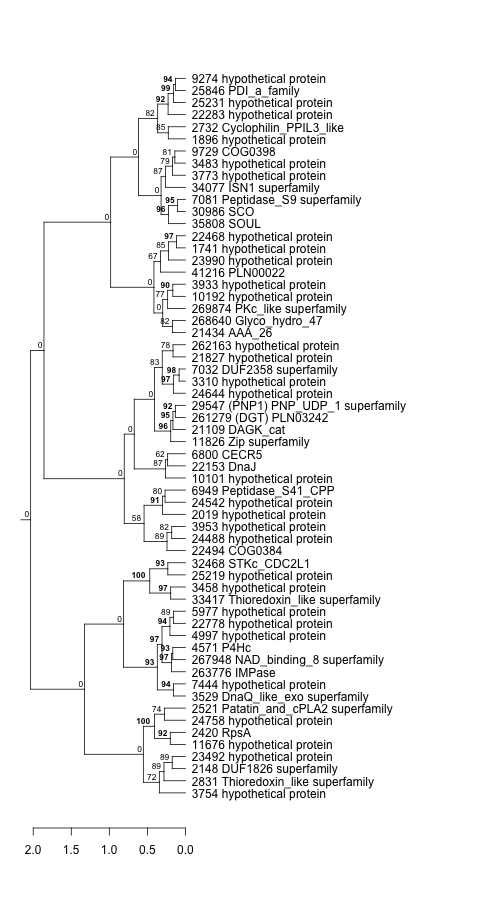
| Thaps_hclust_0158 |
 |
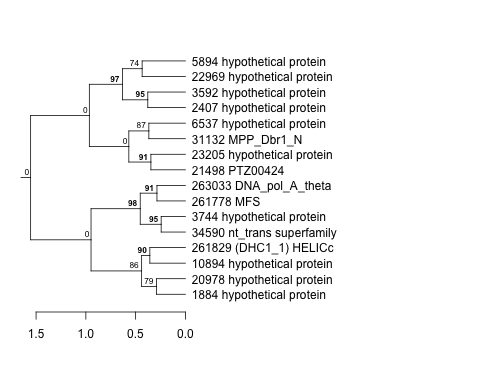 |
0.007 |
0.55 |
1.2 |
lowN_TMEVA | 0.476000 | -0.281 |
| Title | Cluster Plot | Dendrogram | e-value | e-value | e-value | Condition | Condition FDR | Condition Difference |
|---|---|---|---|---|---|---|---|---|
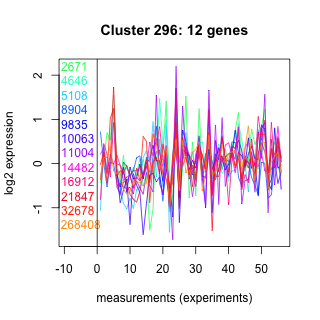
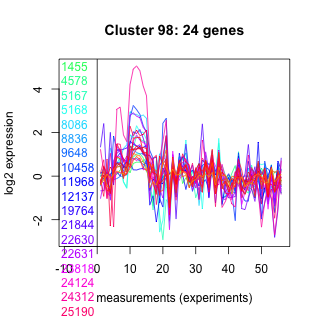
| Thaps_hclust_0296 |
 |
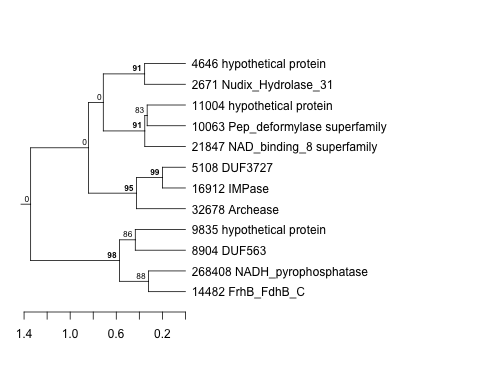 |
0.17 |
1.8 |
0.83 |
lowN_TMEVA | 0.866000 | -0.062 |
| Title | Cluster Plot | Dendrogram | e-value | e-value | e-value | Condition | Condition FDR | Condition Difference |
|---|---|---|---|---|---|---|---|---|
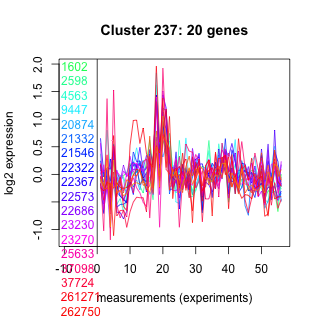
| Thaps_hclust_0237 |
 |
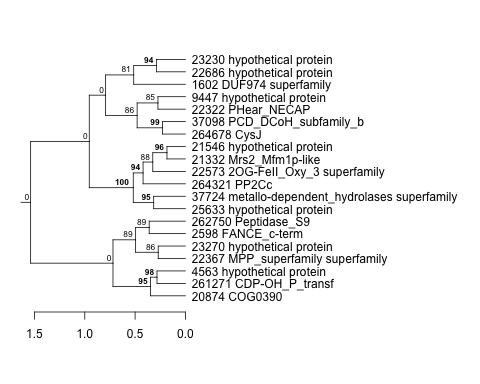 |
0.0000097 |
0.000009 |
0.000056 |
lowN_TMEVA | 0.842000 | 0.0794 |
| Title | Cluster Plot | Dendrogram | e-value | e-value | e-value | Condition | Condition FDR | Condition Difference |
|---|---|---|---|---|---|---|---|---|
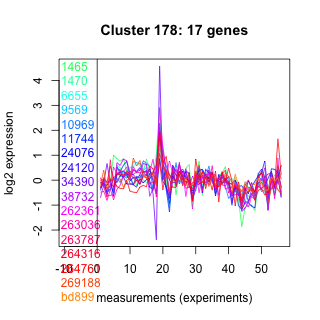
| Thaps_hclust_0178 |
 |
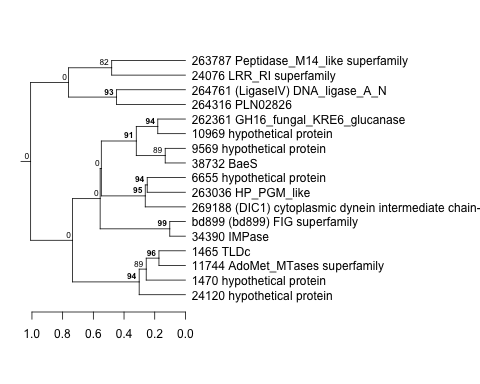 |
0.0000000019 |
0.00000047 |
0.000019 |
lowN_TMEVA | 0.384000 | -0.314 |
| Title | Cluster Plot | Dendrogram | e-value | e-value | e-value | Condition | Condition FDR | Condition Difference |
|---|---|---|---|---|---|---|---|---|
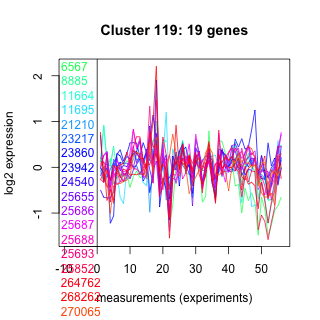
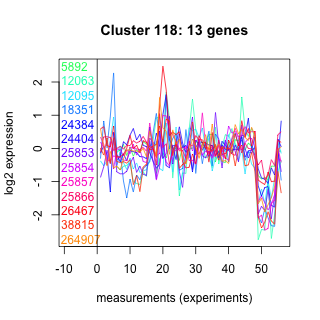
| Thaps_hclust_0119 |
 |
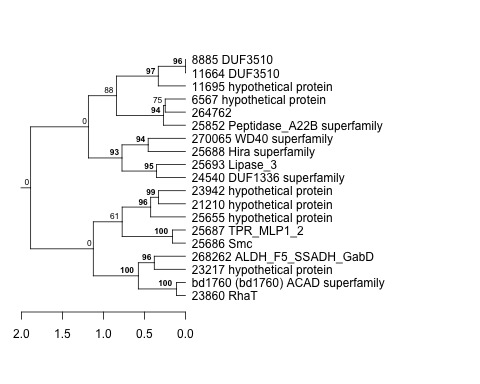 |
0.000017 |
0.0015 |
0.0058 |
lowN_TMEVA | 0.861000 | -0.0611 |
| Title | Cluster Plot | Dendrogram | e-value | e-value | e-value | Condition | Condition FDR | Condition Difference |
|---|---|---|---|---|---|---|---|---|
| Thaps_hclust_0060 |
 |
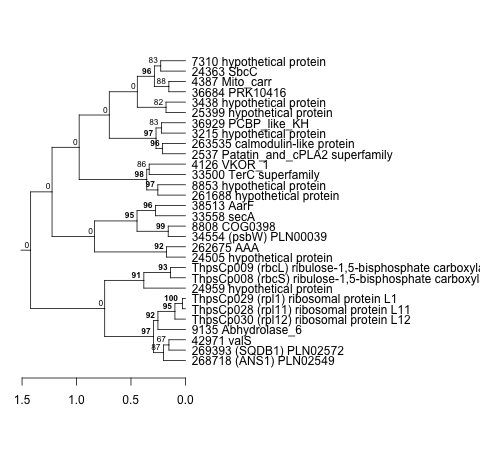 |
0.00000047 |
0.00077 |
0.0075 |
lowN_TMEVA | 0.026800 | -0.562 |
| Title | Cluster Plot | Dendrogram | e-value | e-value | e-value | Condition | Condition FDR | Condition Difference |
|---|---|---|---|---|---|---|---|---|
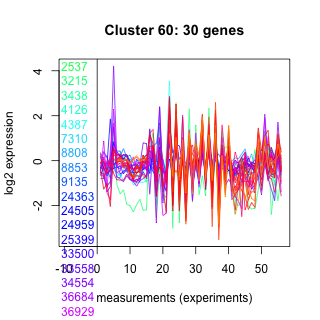
| Thaps_hclust_0198 |
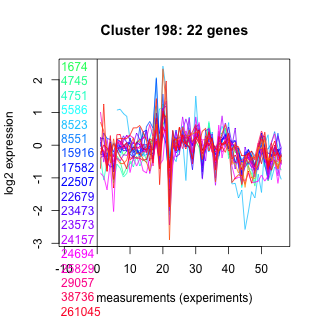 |
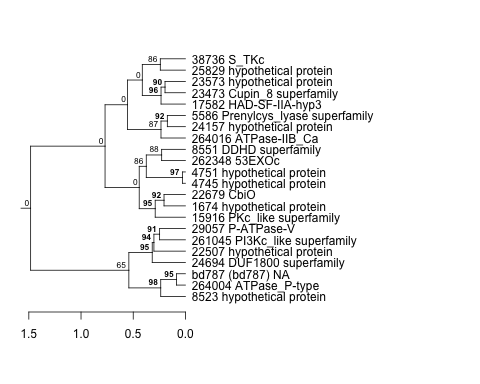 |
0.00091 |
0.017 |
0.0046 |
lowN_TMEVA | 0.194000 | -0.414 |
| Title | Cluster Plot | Dendrogram | e-value | e-value | e-value | Condition | Condition FDR | Condition Difference |
|---|---|---|---|---|---|---|---|---|
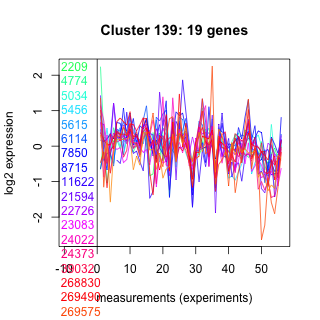
| Thaps_hclust_0139 |
 |
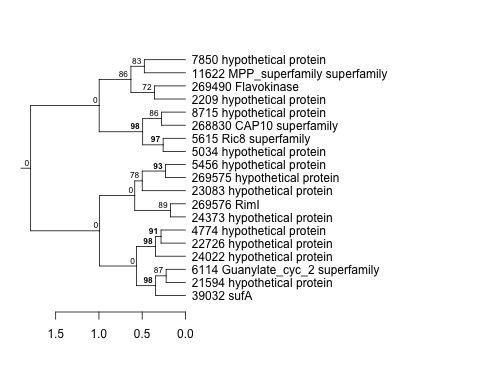 |
0.00014 |
0.00066 |
3 |
lowN_TMEVA | 0.605000 | -0.196 |
| Title | Cluster Plot | Dendrogram | e-value | e-value | e-value | Condition | Condition FDR | Condition Difference |
|---|---|---|---|---|---|---|---|---|
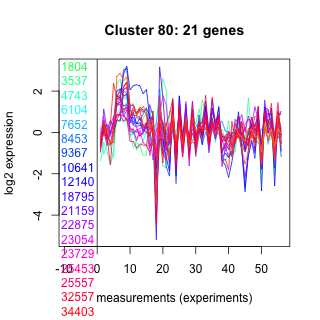
| Thaps_hclust_0080 |
 |
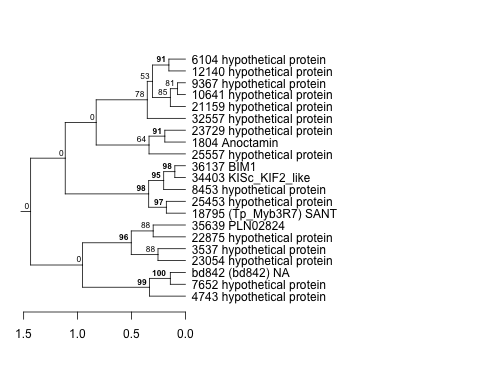 |
0.000037 |
0.000075 |
0.96 |
lowN_TMEVA | 0.614000 | -0.187 |
| Title | Cluster Plot | Dendrogram | e-value | e-value | e-value | Condition | Condition FDR | Condition Difference |
|---|---|---|---|---|---|---|---|---|
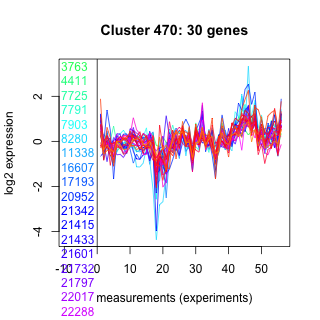
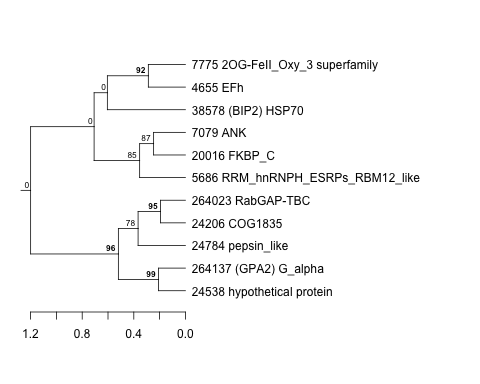
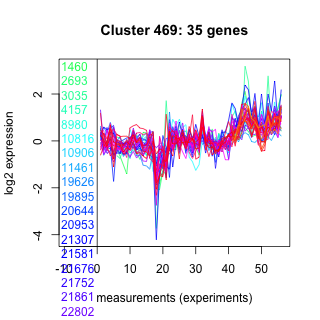
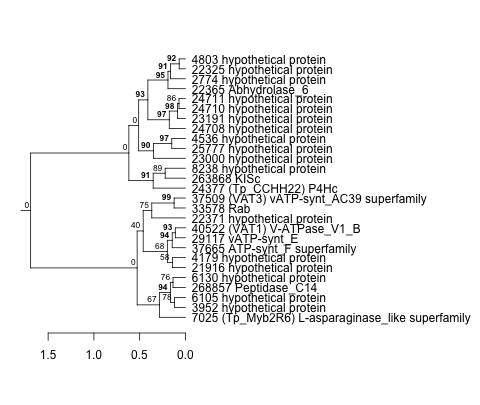
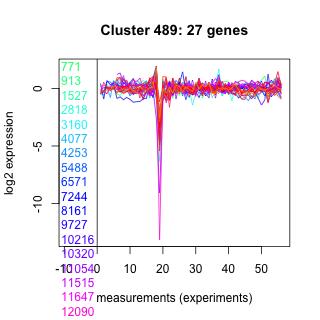
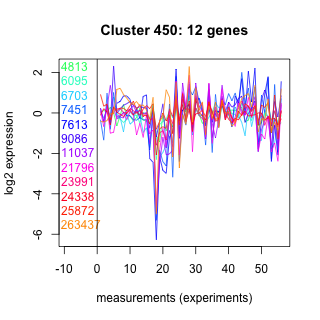
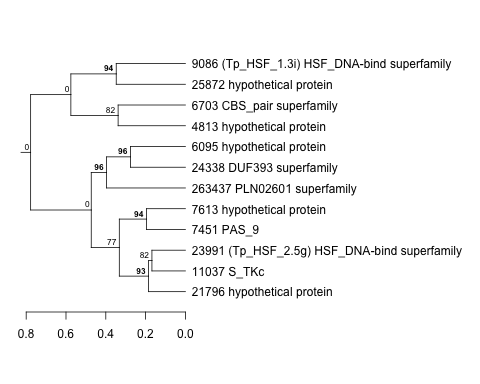
| Thaps_hclust_0491 |
 |
 |
0.35 |
17 |
52 |
lowN_TMEVA | 0.607000 | 0.22 |
| Title | Cluster Plot | Dendrogram | e-value | e-value | e-value | Condition | Condition FDR | Condition Difference |
|---|---|---|---|---|---|---|---|---|
| Thaps_hclust_0021 |
 |
 |
0.00000000002 |
0.0000088 |
0.0012 |
lowN_TMEVA | 0.193000 | -0.342 |
| Title | Cluster Plot | Dendrogram | e-value | e-value | e-value | Condition | Condition FDR | Condition Difference |
|---|---|---|---|---|---|---|---|---|
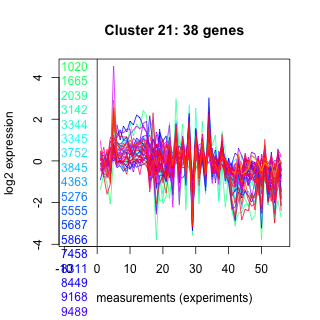
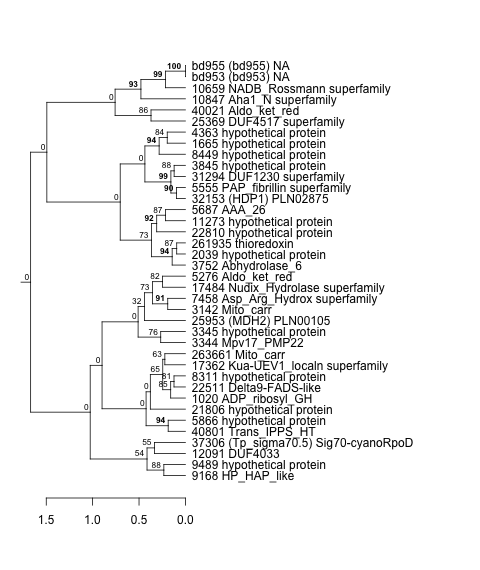
| Thaps_hclust_0432 |
 |
 |
0.011 |
0.06 |
2.4 |
lowN_TMEVA | 0.411000 | -0.287 |
| Title | Cluster Plot | Dendrogram | e-value | e-value | e-value | Condition | Condition FDR | Condition Difference |
|---|---|---|---|---|---|---|---|---|
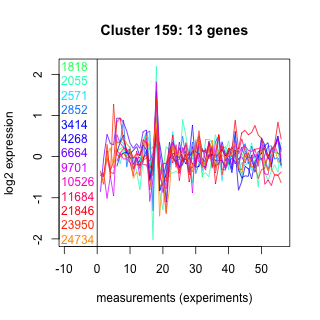
| Thaps_hclust_0159 |
 |
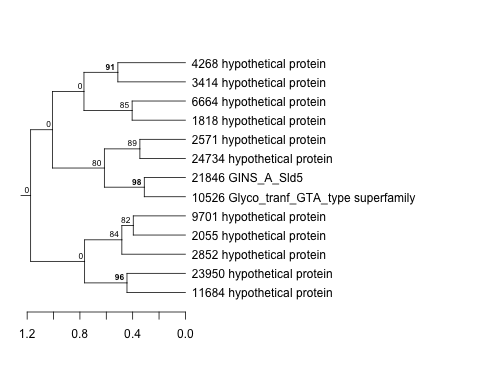 |
0.087 |
1.3 |
3 |
lowN_TMEVA | 0.995000 | -0.00815 |
| Title | Cluster Plot | Dendrogram | e-value | e-value | e-value | Condition | Condition FDR | Condition Difference |
|---|---|---|---|---|---|---|---|---|
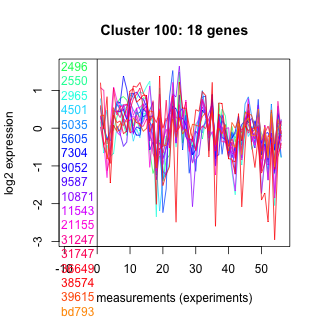
| Thaps_hclust_0100 |
 |
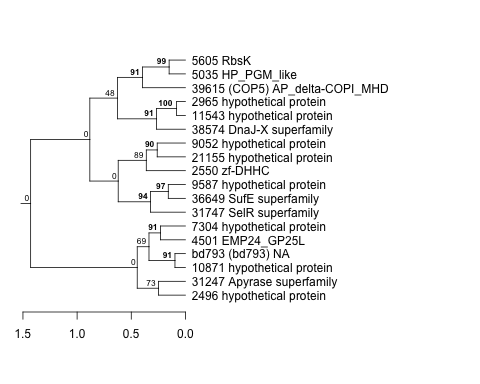 |
0.00000073 |
0.000076 |
2.6 |
lowN_TMEVA | 0.261000 | -0.394 |
| Title | Cluster Plot | Dendrogram | e-value | e-value | e-value | Condition | Condition FDR | Condition Difference |
|---|---|---|---|---|---|---|---|---|
| Thaps_hclust_0041 |
 |
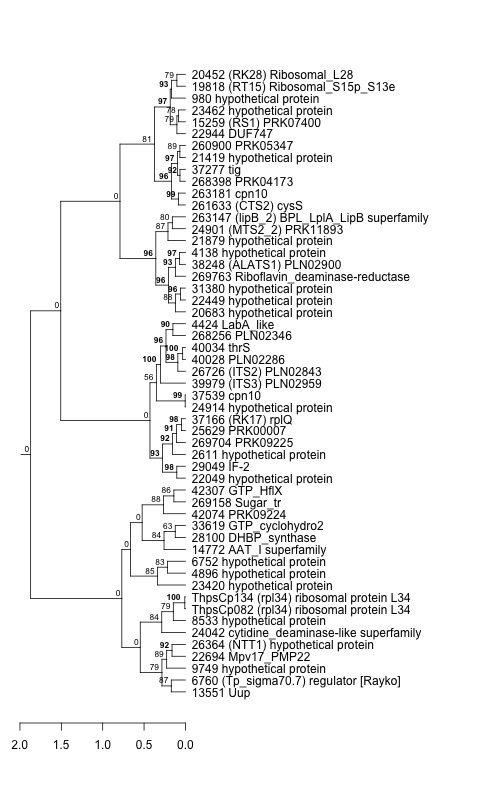 |
4.4e-38 |
0.000000011 |
0.0000042 |
lowN_TMEVA | 0.515000 | -0.194 |
| Title | Cluster Plot | Dendrogram | e-value | e-value | e-value | Condition | Condition FDR | Condition Difference |
|---|---|---|---|---|---|---|---|---|
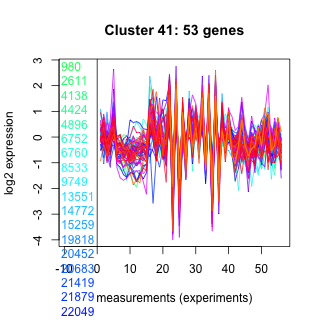
| Thaps_hclust_0452 |
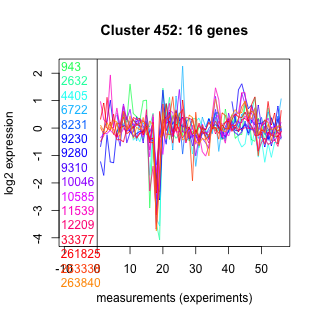 |
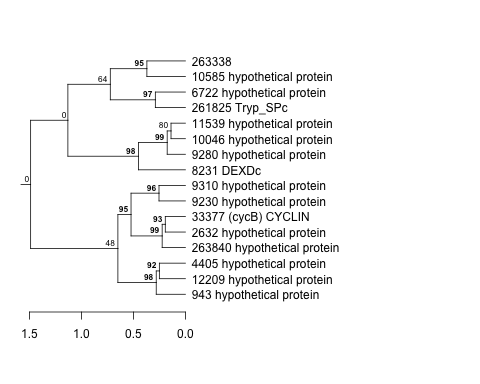 |
84 |
200 |
220 |
lowN_TMEVA | 0.712000 | 0.152 |
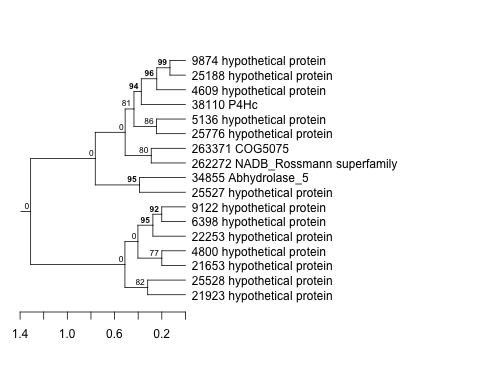
| Title | Cluster Plot | Dendrogram | e-value | e-value | e-value | Condition | Condition FDR | Condition Difference |
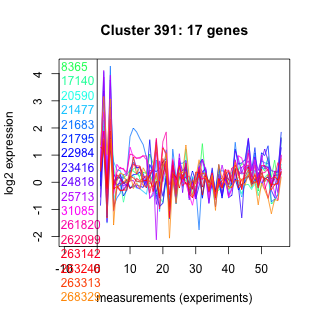
|---|---|---|---|---|---|---|---|---|
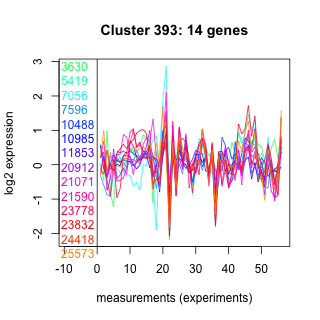
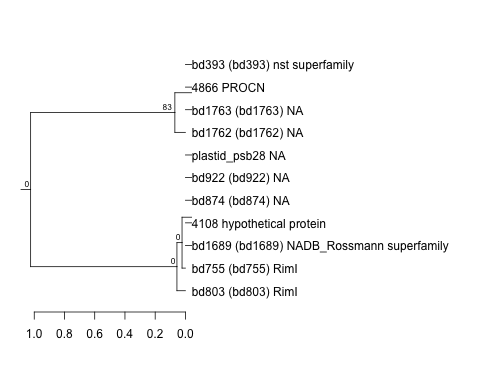
| Thaps_hclust_0393 |
 |
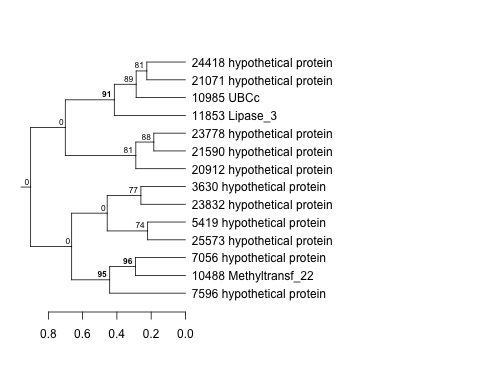 |
2 |
16 |
16 |
lowN_TMEVA | 0.608000 | -0.208 |
| Title | Cluster Plot | Dendrogram | e-value | e-value | e-value | Condition | Condition FDR | Condition Difference |
|---|---|---|---|---|---|---|---|---|
| Thaps_hclust_0061 |
 |
 |
0.000000062 |
0.00063 |
0.032 |
lowN_TMEVA | 0.532000 | -0.25 |
| Title | Cluster Plot | Dendrogram | e-value | e-value | e-value | Condition | Condition FDR | Condition Difference |
|---|---|---|---|---|---|---|---|---|
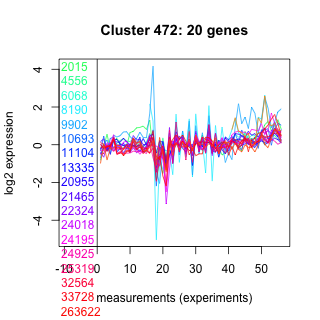
| Thaps_hclust_0472 |
 |
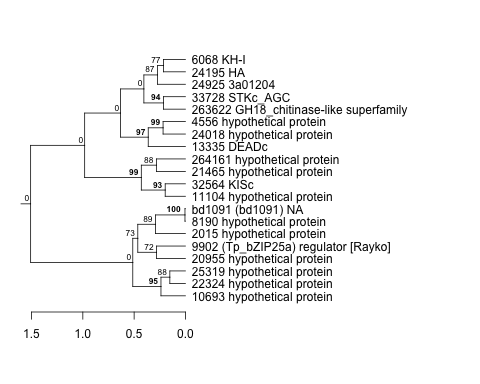 |
0.00000011 |
0.000015 |
0.00015 |
lowN_TMEVA | 0.784000 | -0.106 |
| Title | Cluster Plot | Dendrogram | e-value | e-value | e-value | Condition | Condition FDR | Condition Difference |
|---|---|---|---|---|---|---|---|---|
| Thaps_hclust_0002 |
 |
 |
0.00000029 |
0.000000009 |
0.000055 |
lowN_TMEVA | 0.861000 | -0.0606 |
| Title | Cluster Plot | Dendrogram | e-value | e-value | e-value | Condition | Condition FDR | Condition Difference |
|---|---|---|---|---|---|---|---|---|
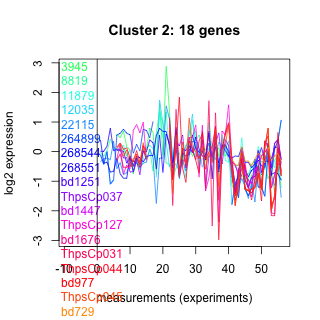
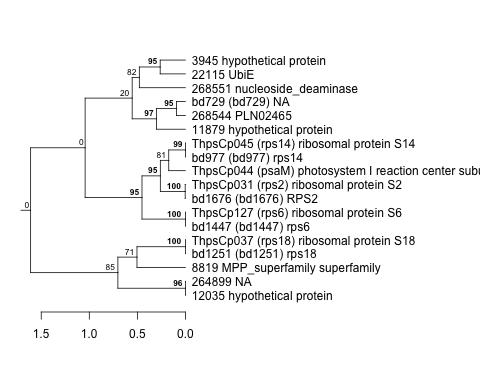
| Thaps_hclust_0413 |
 |
 |
0.000043 |
0.0057 |
0.67 |
lowN_TMEVA | 0.594000 | -0.206 |
| Title | Cluster Plot | Dendrogram | e-value | e-value | e-value | Condition | Condition FDR | Condition Difference |
|---|---|---|---|---|---|---|---|---|
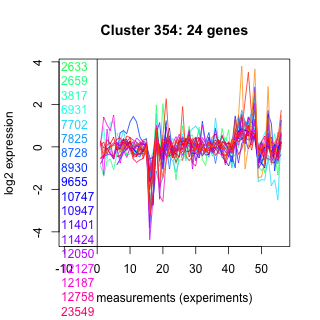
| Thaps_hclust_0354 |
 |
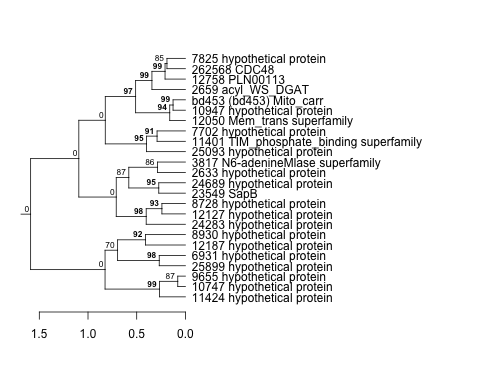 |
0.027 |
0.032 |
0.78 |
lowN_TMEVA | 0.975000 | -0.0128 |
| Title | Cluster Plot | Dendrogram | e-value | e-value | e-value | Condition | Condition FDR | Condition Difference |
|---|---|---|---|---|---|---|---|---|
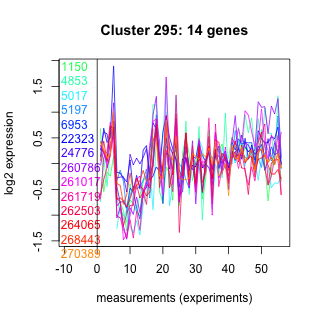
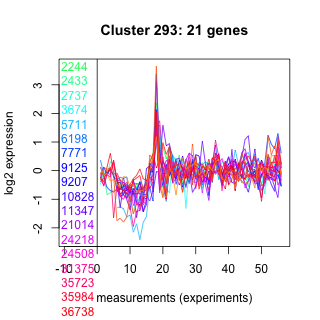
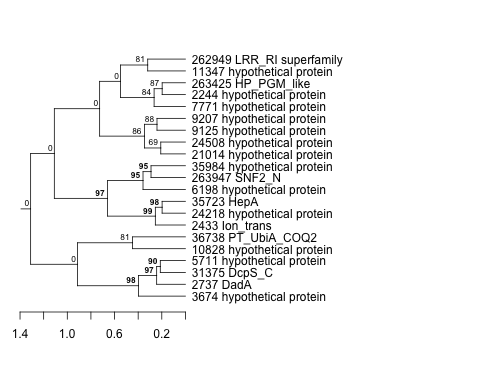
| Thaps_hclust_0295 |
 |
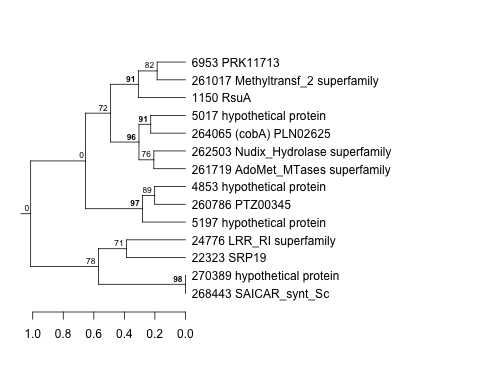 |
0.0000053 |
0.00095 |
0.0005 |
lowN_TMEVA | 0.861000 | 0.0677 |
| Title | Cluster Plot | Dendrogram | e-value | e-value | e-value | Condition | Condition FDR | Condition Difference |
|---|---|---|---|---|---|---|---|---|
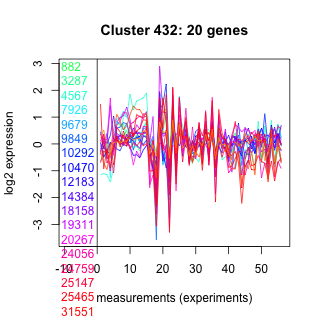
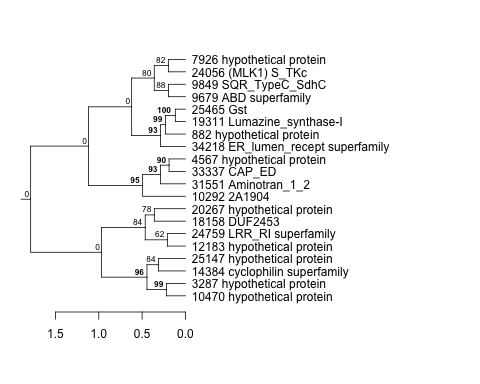
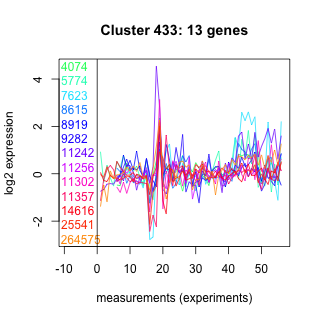
| Thaps_hclust_0433 |
 |
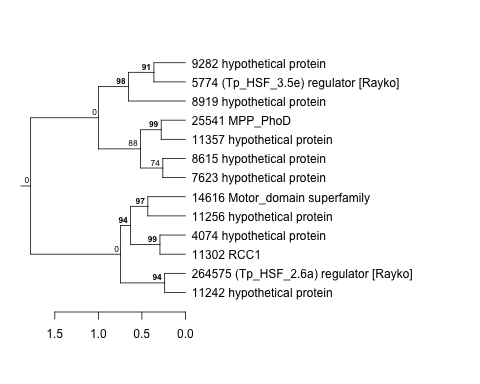 |
14 |
54 |
440 |
lowN_TMEVA | 0.661000 | -0.188 |
| Title | Cluster Plot | Dendrogram | e-value | e-value | e-value | Condition | Condition FDR | Condition Difference |
|---|---|---|---|---|---|---|---|---|
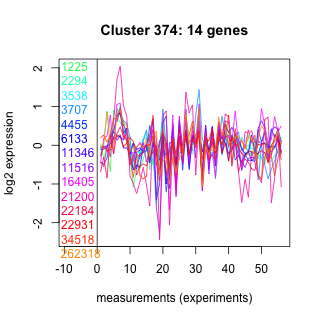
| Thaps_hclust_0374 |
 |
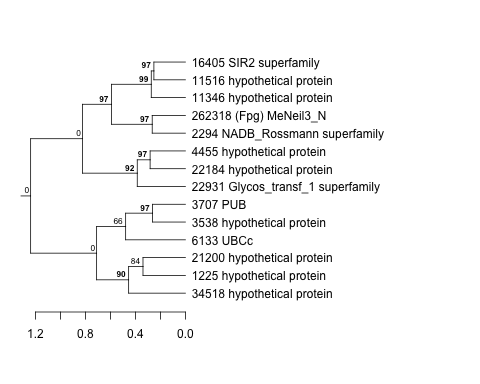 |
1.4 |
19 |
50 |
lowN_TMEVA | 0.874000 | 0.0548 |
| Title | Cluster Plot | Dendrogram | e-value | e-value | e-value | Condition | Condition FDR | Condition Difference |
|---|---|---|---|---|---|---|---|---|
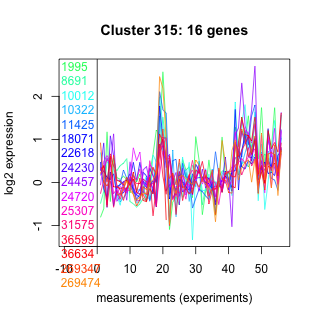
| Thaps_hclust_0315 |
 |
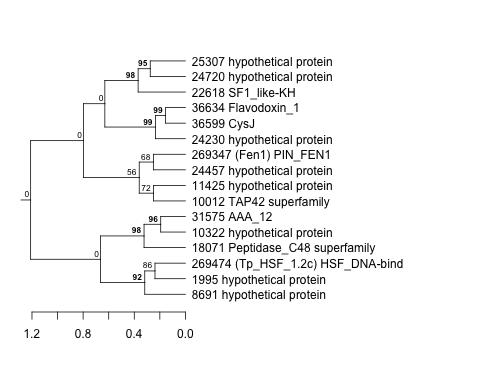 |
0.01 |
0.93 |
0.53 |
lowN_TMEVA | 0.784000 | 0.113 |
| Title | Cluster Plot | Dendrogram | e-value | e-value | e-value | Condition | Condition FDR | Condition Difference |
|---|---|---|---|---|---|---|---|---|
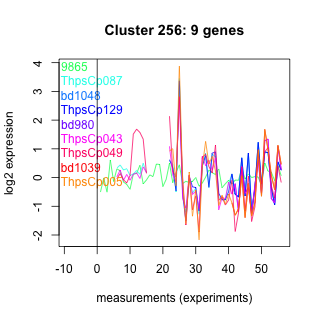
| Thaps_hclust_0256 |
 |
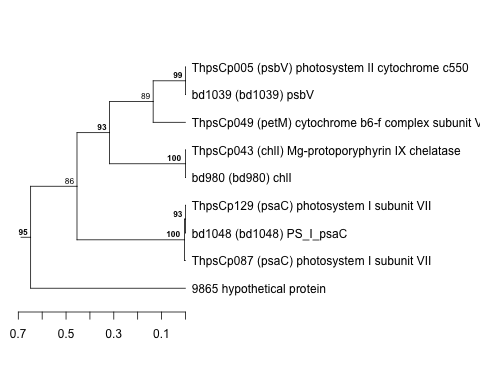 |
0.0000000000016 |
0.0000000000033 |
0.0000000000017 |
lowN_TMEVA | 0.261000 | -0.508 |
| Title | Cluster Plot | Dendrogram | e-value | e-value | e-value | Condition | Condition FDR | Condition Difference |
|---|---|---|---|---|---|---|---|---|
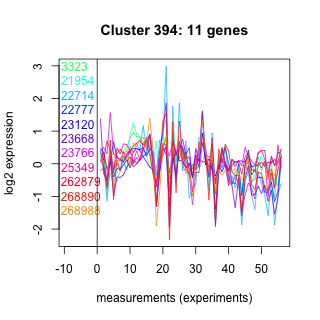
| Thaps_hclust_0394 |
 |
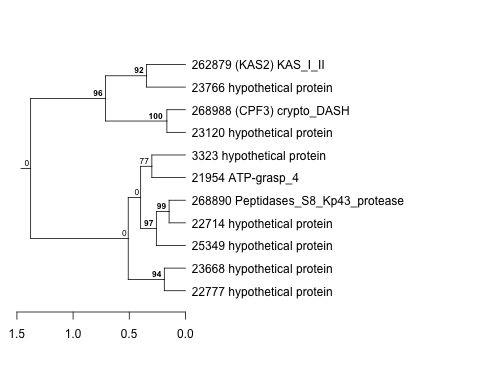 |
0.044 |
0.46 |
610 |
lowN_TMEVA | 0.304000 | -0.433 |
| Title | Cluster Plot | Dendrogram | e-value | e-value | e-value | Condition | Condition FDR | Condition Difference |
|---|---|---|---|---|---|---|---|---|
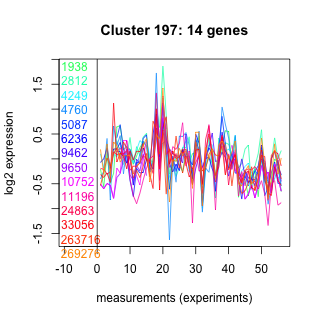
| Thaps_hclust_0197 |
 |
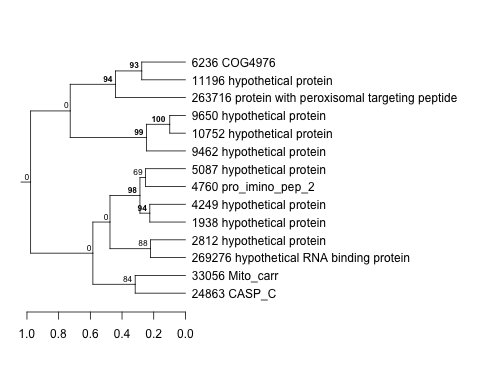 |
0.12 |
0.3 |
0.65 |
lowN_TMEVA | 0.954000 | -0.0253 |
| Title | Cluster Plot | Dendrogram | e-value | e-value | e-value | Condition | Condition FDR | Condition Difference |
|---|---|---|---|---|---|---|---|---|
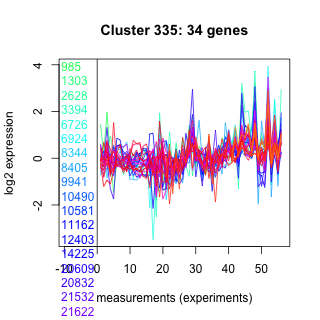
| Thaps_hclust_0335 |
 |
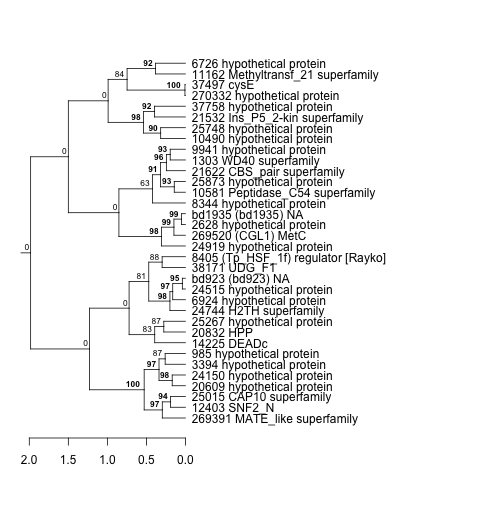 |
0.0000000032 |
0.000001 |
0.019 |
lowN_TMEVA | 0.605000 | 0.18 |
| Title | Cluster Plot | Dendrogram | e-value | e-value | e-value | Condition | Condition FDR | Condition Difference |
|---|---|---|---|---|---|---|---|---|
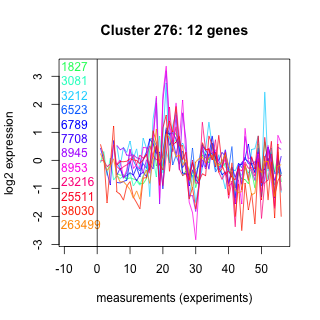
| Thaps_hclust_0276 |
 |
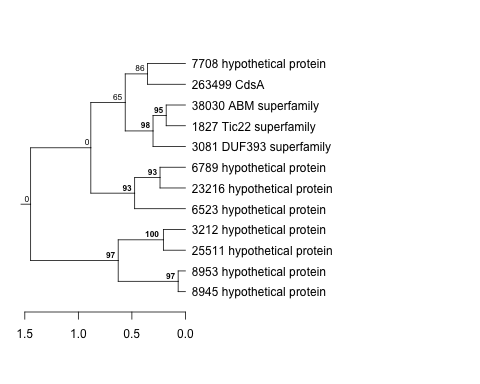 |
0.063 |
39 |
53 |
lowN_TMEVA | 0.128000 | -0.616 |
| Title | Cluster Plot | Dendrogram | e-value | e-value | e-value | Condition | Condition FDR | Condition Difference |
|---|---|---|---|---|---|---|---|---|
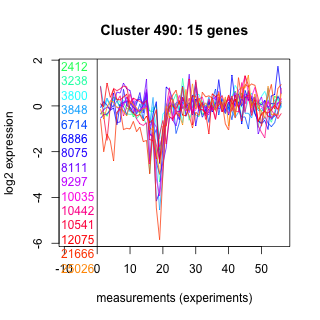
| Thaps_hclust_0490 |
 |
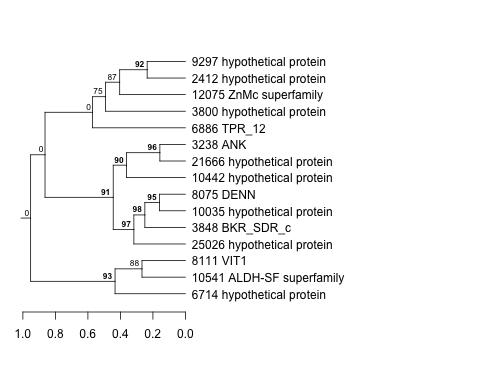 |
0.6 |
9.5 |
74 |
lowN_TMEVA | 0.613000 | -0.203 |
| Title | Cluster Plot | Dendrogram | e-value | e-value | e-value | Condition | Condition FDR | Condition Difference |
|---|---|---|---|---|---|---|---|---|
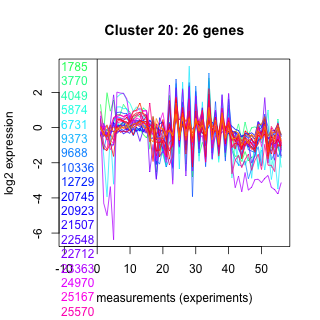
| Thaps_hclust_0020 |
 |
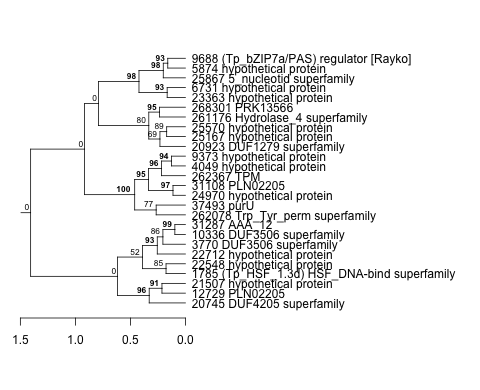 |
0.004 |
0.15 |
3.3 |
lowN_TMEVA | 0.011400 | -0.698 |
| Title | Cluster Plot | Dendrogram | e-value | e-value | e-value | Condition | Condition FDR | Condition Difference |
|---|---|---|---|---|---|---|---|---|
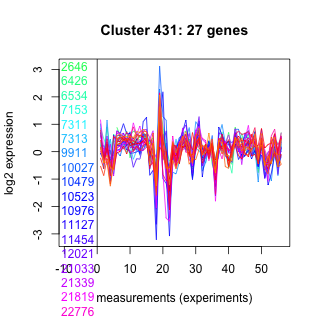
| Thaps_hclust_0431 |
 |
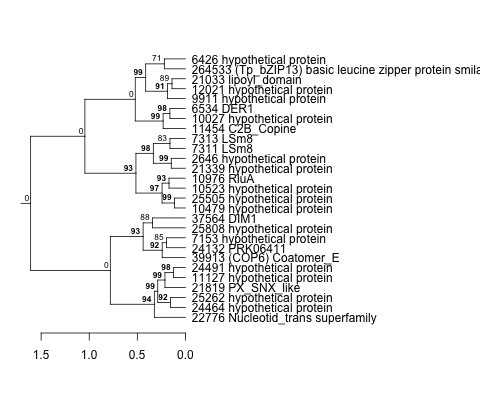 |
0.003 |
0.00095 |
0.0043 |
lowN_TMEVA | 0.695000 | 0.143 |
| Title | Cluster Plot | Dendrogram | e-value | e-value | e-value | Condition | Condition FDR | Condition Difference |
|---|---|---|---|---|---|---|---|---|
| Thaps_hclust_0099 |
 |
 |
0.0000000000000032 |
0.000000000000013 |
0.000000000000025 |
lowN_TMEVA | 0.027400 | -1.48 |
| Title | Cluster Plot | Dendrogram | e-value | e-value | e-value | Condition | Condition FDR | Condition Difference |
|---|---|---|---|---|---|---|---|---|
| Thaps_hclust_0040 |
 |
 |
1.8e-29 |
0.000000000042 |
0.00000000063 |
lowN_TMEVA | 1.000000 |
| Title | Cluster Plot | Dendrogram | e-value | e-value | e-value | Condition | Condition FDR | Condition Difference |
|---|---|---|---|---|---|---|---|---|
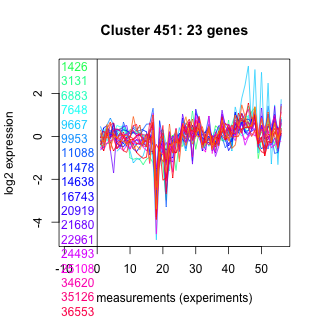
| Thaps_hclust_0451 |
 |
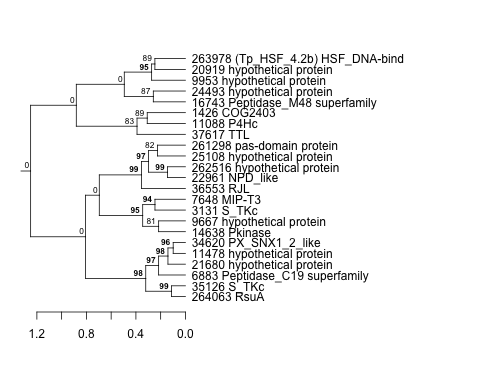 |
10 |
0.0026 |
160 |
lowN_TMEVA | 0.633000 | 0.175 |
| Title | Cluster Plot | Dendrogram | e-value | e-value | e-value | Condition | Condition FDR | Condition Difference |
|---|---|---|---|---|---|---|---|---|
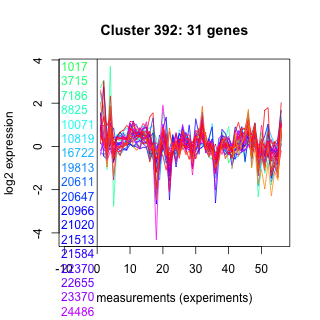
| Thaps_hclust_0392 |
 |
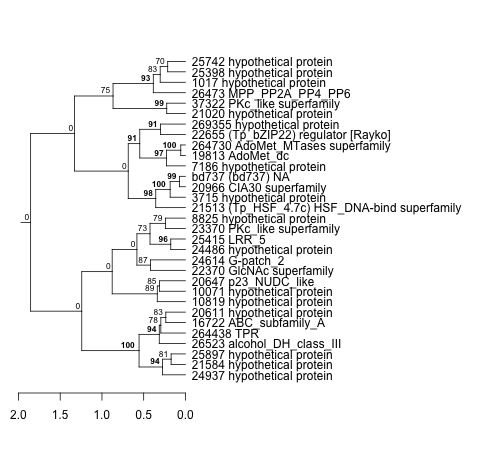 |
0.00055 |
0.0027 |
0.19 |
lowN_TMEVA | 0.621000 | -0.17 |
| Title | Cluster Plot | Dendrogram | e-value | e-value | e-value | Condition | Condition FDR | Condition Difference |
|---|---|---|---|---|---|---|---|---|
| Thaps_hclust_0333 |
 |
 |
0.00062 |
4 |
17 |
lowN_TMEVA | 0.351000 | 0.294 |
| Title | Cluster Plot | Dendrogram | e-value | e-value | e-value | Condition | Condition FDR | Condition Difference |
|---|---|---|---|---|---|---|---|---|
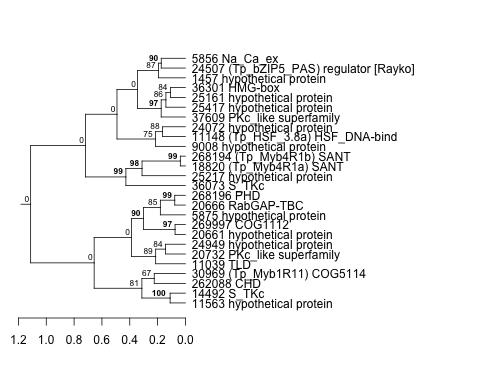
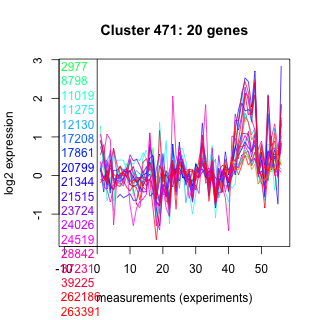
| Thaps_hclust_0471 |
 |
 |
0.0086 |
0.14 |
2.6 |
lowN_TMEVA | 0.963000 | -0.0191 |
| Title | Cluster Plot | Dendrogram | e-value | e-value | e-value | Condition | Condition FDR | Condition Difference |
|---|---|---|---|---|---|---|---|---|
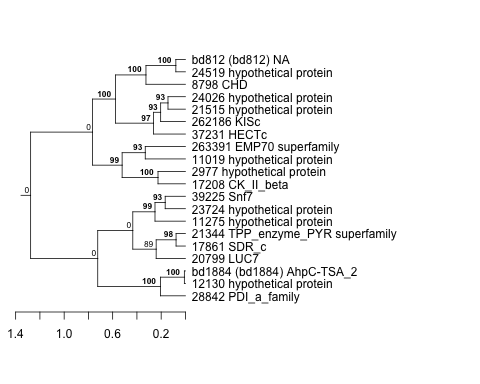
| Thaps_hclust_0001 |
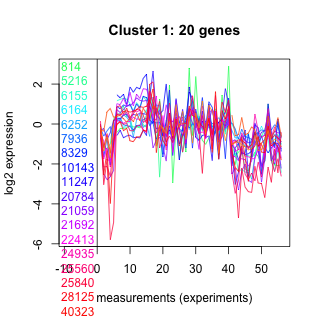 |
 |
0.0033 |
0.052 |
2 |
lowN_TMEVA | 0.001190 | -1.13 |
| Title | Cluster Plot | Dendrogram | e-value | e-value | e-value | Condition | Condition FDR | Condition Difference |
|---|---|---|---|---|---|---|---|---|
| Thaps_hclust_0412 |
 |
 |
0.39 |
17 |
2.9 |
lowN_TMEVA | 0.670000 | -0.181 |
| Title | Cluster Plot | Dendrogram | e-value | e-value | e-value | Condition | Condition FDR | Condition Difference |
|---|---|---|---|---|---|---|---|---|
| Thaps_hclust_0353 |
 |
 |
0.076 |
1.5 |
0.87 |
lowN_TMEVA | 0.861000 | -0.0641 |
| Title | Cluster Plot | Dendrogram | e-value | e-value | e-value | Condition | Condition FDR | Condition Difference |
|---|---|---|---|---|---|---|---|---|
| Thaps_hclust_0294 |
 |
 |
0.0033 |
0.13 |
0.53 |
lowN_TMEVA | 0.761000 | -0.121 |
| Title | Cluster Plot | Dendrogram | e-value | e-value | e-value | Condition | Condition FDR | Condition Difference |
|---|---|---|---|---|---|---|---|---|
| Thaps_hclust_0235 |
 |
 |
0.47 |
5.6 |
74 |
lowN_TMEVA | 0.761000 | -0.132 |
| Title | Cluster Plot | Dendrogram | e-value | e-value | e-value | Condition | Condition FDR | Condition Difference |
|---|---|---|---|---|---|---|---|---|
| Thaps_hclust_0373 |
 |
 |
0.00017 |
0.001 |
0.066 |
lowN_TMEVA | 0.293000 | -0.333 |
| Title | Cluster Plot | Dendrogram | e-value | e-value | e-value | Condition | Condition FDR | Condition Difference |
|---|---|---|---|---|---|---|---|---|
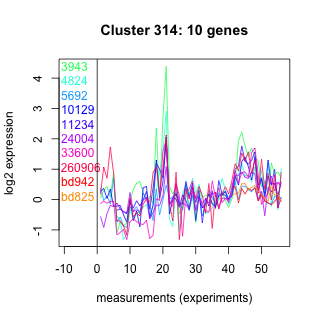
| Thaps_hclust_0314 |
 |
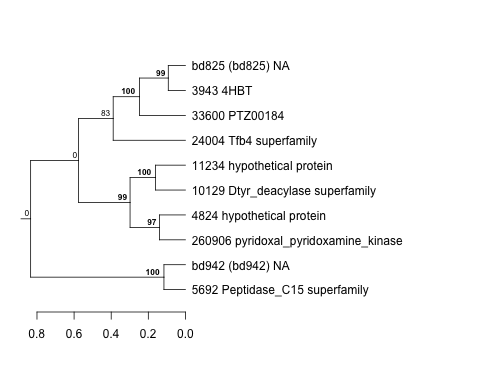 |
0.052 |
1.9 |
8.5 |
lowN_TMEVA | 0.789000 | 0.115 |
| Title | Cluster Plot | Dendrogram | e-value | e-value | e-value | Condition | Condition FDR | Condition Difference |
|---|---|---|---|---|---|---|---|---|
| Thaps_hclust_0255 |
 |
 |
1.4e-28 |
0.0000000000000024 |
0.000000029 |
lowN_TMEVA | 1.000000 |
| Title | Cluster Plot | Dendrogram | e-value | e-value | e-value | Condition | Condition FDR | Condition Difference |
|---|---|---|---|---|---|---|---|---|
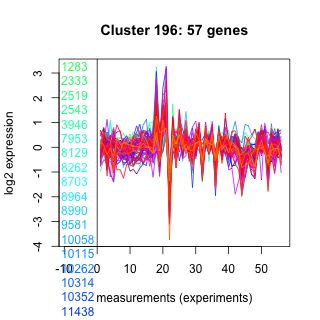
| Thaps_hclust_0196 |
 |
 |
0.0000000000000088 |
0.00000034 |
0.000017 |
lowN_TMEVA | 0.633000 | -0.156 |
| Title | Cluster Plot | Dendrogram | e-value | e-value | e-value | Condition | Condition FDR | Condition Difference |
|---|---|---|---|---|---|---|---|---|
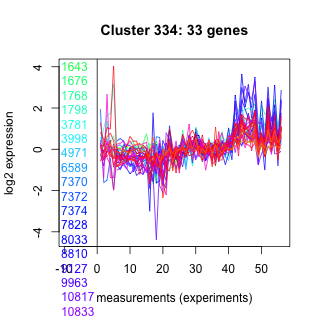
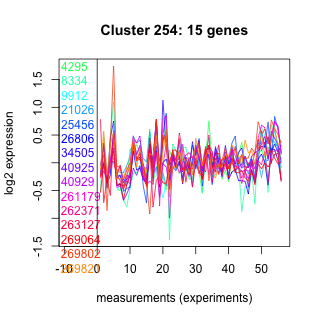
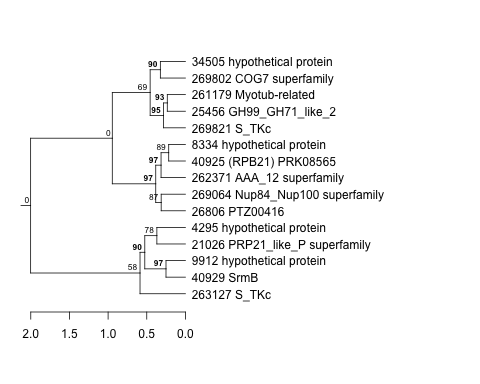
| Thaps_hclust_0334 |
 |
 |
0.51 |
0.00047 |
0.25 |
lowN_TMEVA | 0.262000 | 0.321 |
| Title | Cluster Plot | Dendrogram | e-value | e-value | e-value | Condition | Condition FDR | Condition Difference |
|---|---|---|---|---|---|---|---|---|
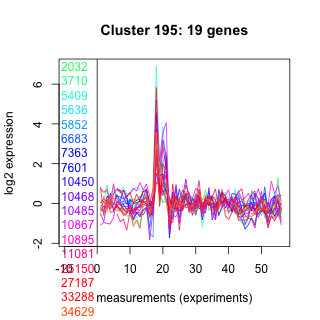
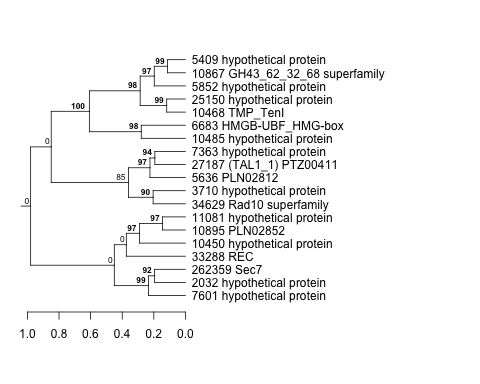
| Thaps_hclust_0275 |
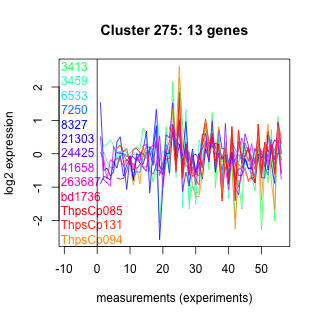 |
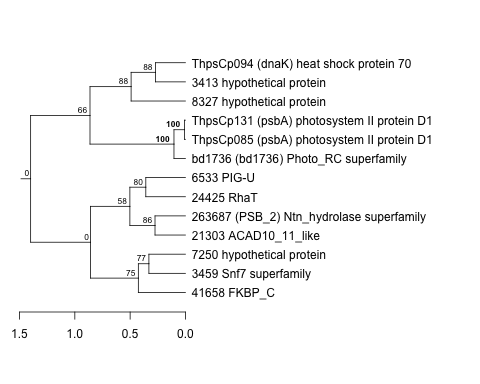 |
Not available | Not available | Not available | lowN_TMEVA | 0.250000 | -0.452 |
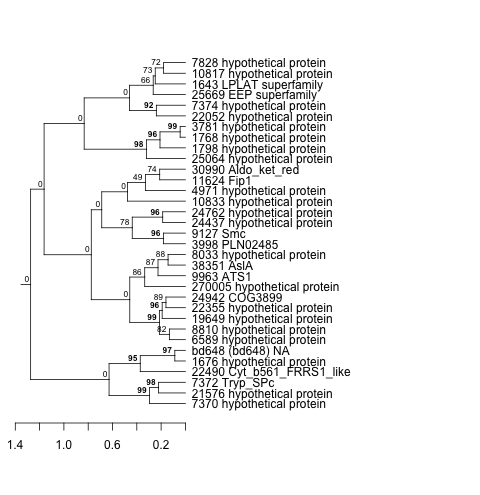
| Title | Cluster Plot | Dendrogram | e-value | e-value | e-value | Condition | Condition FDR | Condition Difference |
|---|---|---|---|---|---|---|---|---|
| Thaps_hclust_0216 |
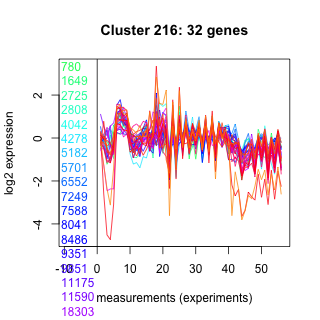 |
 |
0.0000076 |
0.019 |
0.0036 |
lowN_TMEVA | 0.001190 | -0.784 |
| Title | Cluster Plot | Dendrogram | e-value | e-value | e-value | Condition | Condition FDR | Condition Difference |
|---|---|---|---|---|---|---|---|---|
| Thaps_hclust_0157 |
 |
 |
2 |
4.6 |
4.9 |
lowN_TMEVA | 0.699000 | 0.18 |
| Title | Cluster Plot | Dendrogram | e-value | e-value | e-value | Condition | Condition FDR | Condition Difference |
|---|---|---|---|---|---|---|---|---|
| Thaps_hclust_0098 |
 |
 |
0.0000000015 |
0.17 |
19 |
lowN_TMEVA | 0.566000 | -0.205 |
| Title | Cluster Plot | Dendrogram | e-value | e-value | e-value | Condition | Condition FDR | Condition Difference |
|---|---|---|---|---|---|---|---|---|
| Thaps_hclust_0236 |
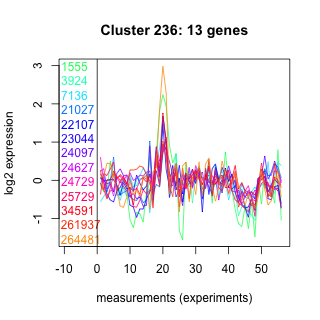 |
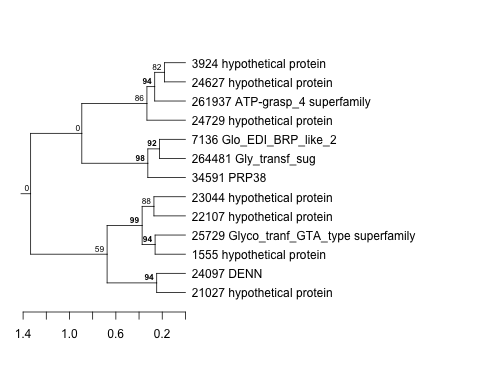 |
0.0078 |
3.3 |
1.1 |
lowN_TMEVA | 0.708000 | -0.158 |
| Title | Cluster Plot | Dendrogram | e-value | e-value | e-value | Condition | Condition FDR | Condition Difference |
|---|---|---|---|---|---|---|---|---|
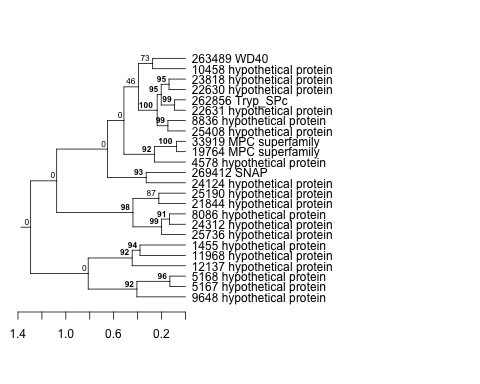
| Thaps_hclust_0177 |
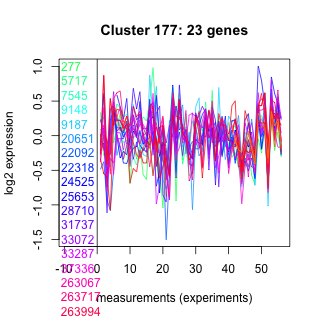 |
 |
0.0000000012 |
0.0000078 |
0.00084 |
lowN_TMEVA | 0.090400 | -0.509 |
| Title | Cluster Plot | Dendrogram | e-value | e-value | e-value | Condition | Condition FDR | Condition Difference |
|---|---|---|---|---|---|---|---|---|
| Thaps_hclust_0118 |
 |
 |
0.0037 |
1.2 |
1.4 |
lowN_TMEVA | 0.761000 | -0.125 |
| Title | Cluster Plot | Dendrogram | e-value | e-value | e-value | Condition | Condition FDR | Condition Difference |
|---|---|---|---|---|---|---|---|---|
| Thaps_hclust_0059 |
 |
 |
0.0000000000000026 |
0.000000000024 |
0.0000014 |
lowN_TMEVA | 0.001190 | -0.856 |
| Title | Cluster Plot | Dendrogram | e-value | e-value | e-value | Condition | Condition FDR | Condition Difference |
|---|---|---|---|---|---|---|---|---|
| Thaps_hclust_0470 |
 |
 |
0.0000048 |
0.00021 |
0.086 |
lowN_TMEVA | 0.959000 | 0.0235 |
| Title | Cluster Plot | Dendrogram | e-value | e-value | e-value | Condition | Condition FDR | Condition Difference |
|---|---|---|---|---|---|---|---|---|
| Thaps_hclust_0138 |
 |
 |
0.00000000000028 |
0.0000000011 |
0.0000065 |
lowN_TMEVA | 0.689000 | -0.138 |
| Title | Cluster Plot | Dendrogram | e-value | e-value | e-value | Condition | Condition FDR | Condition Difference |
|---|---|---|---|---|---|---|---|---|
| Thaps_hclust_0079 |
 |
 |
0.00048 |
0.000048 |
0.27 |
lowN_TMEVA | 0.430000 | -0.271 |
| Title | Cluster Plot | Dendrogram | e-value | e-value | e-value | Condition | Condition FDR | Condition Difference |
|---|---|---|---|---|---|---|---|---|
| Thaps_hclust_0293 |
 |
 |
0.16 |
120 |
360 |
lowN_TMEVA | 0.626000 | -0.182 |
| Title | Cluster Plot | Dendrogram | e-value | e-value | e-value | Condition | Condition FDR | Condition Difference |
|---|---|---|---|---|---|---|---|---|
| Thaps_hclust_0234 |
 |
 |
0.036 |
0.063 |
0.24 |
lowN_TMEVA | 0.920000 | 0.0363 |
| Title | Cluster Plot | Dendrogram | e-value | e-value | e-value | Condition | Condition FDR | Condition Difference |
|---|---|---|---|---|---|---|---|---|
| Thaps_hclust_0372 |
 |
 |
0.0016 |
0.064 |
18 |
lowN_TMEVA | 0.122000 | -0.53 |
| Title | Cluster Plot | Dendrogram | e-value | e-value | e-value | Condition | Condition FDR | Condition Difference |
|---|---|---|---|---|---|---|---|---|
| Thaps_hclust_0175 |
 |
 |
0.00000000000027 |
0.0000042 |
0.58 |
lowN_TMEVA | 0.564000 | -0.188 |
| Title | Cluster Plot | Dendrogram | e-value | e-value | e-value | Condition | Condition FDR | Condition Difference |
|---|---|---|---|---|---|---|---|---|
| Thaps_hclust_0313 |
 |
 |
0.00000043 |
0.00014 |
0.00078 |
lowN_TMEVA | 0.001190 | 1.45 |
| Title | Cluster Plot | Dendrogram | e-value | e-value | e-value | Condition | Condition FDR | Condition Difference |
|---|---|---|---|---|---|---|---|---|
| Thaps_hclust_0254 |
 |
 |
0.00045 |
0.0045 |
5.8 |
lowN_TMEVA | 0.339000 | -0.36 |
| Title | Cluster Plot | Dendrogram | e-value | e-value | e-value | Condition | Condition FDR | Condition Difference |
|---|---|---|---|---|---|---|---|---|
| Thaps_hclust_0195 |
 |
 |
0.0031 |
0.024 |
0.00037 |
lowN_TMEVA | 0.894000 | 0.0444 |
| Title | Cluster Plot | Dendrogram | e-value | e-value | e-value | Condition | Condition FDR | Condition Difference |
|---|---|---|---|---|---|---|---|---|
| Thaps_hclust_0136 |
 |
 |
0.0034 |
0.034 |
340 |
lowN_TMEVA | 1.000000 | -0.00111 |
| Title | Cluster Plot | Dendrogram | e-value | e-value | e-value | Condition | Condition FDR | Condition Difference |
|---|---|---|---|---|---|---|---|---|
| Thaps_hclust_0274 |
 |
 |
0.0000064 |
0.048 |
6.7 |
lowN_TMEVA | 0.619000 | 0.186 |
| Title | Cluster Plot | Dendrogram | e-value | e-value | e-value | Condition | Condition FDR | Condition Difference |
|---|---|---|---|---|---|---|---|---|
| Thaps_hclust_0215 |
 |
 |
0.000036 |
0.0000076 |
0.000057 |
lowN_TMEVA | 0.001190 | -1.15 |
| Title | Cluster Plot | Dendrogram | e-value | e-value | e-value | Condition | Condition FDR | Condition Difference |
|---|---|---|---|---|---|---|---|---|
| Thaps_hclust_0156 |
 |
 |
0.00054 |
0.00071 |
0.0013 |
lowN_TMEVA | 0.281000 | -0.322 |
| Title | Cluster Plot | Dendrogram | e-value | e-value | e-value | Condition | Condition FDR | Condition Difference |
|---|---|---|---|---|---|---|---|---|
| Thaps_hclust_0097 |
 |
 |
0.02 |
1.4 |
3.4 |
lowN_TMEVA | 0.411000 | -0.263 |
| Title | Cluster Plot | Dendrogram | e-value | e-value | e-value | Condition | Condition FDR | Condition Difference |
|---|---|---|---|---|---|---|---|---|
| Thaps_hclust_0038 |
 |
 |
0.0016 |
0.024 |
17 |
lowN_TMEVA | 0.056600 | 0.794 |
| Title | Cluster Plot | Dendrogram | e-value | e-value | e-value | Condition | Condition FDR | Condition Difference |
|---|---|---|---|---|---|---|---|---|
| Thaps_hclust_0176 |
 |
 |
29 |
59 |
110 |
lowN_TMEVA | 0.355000 | -0.383 |
| Title | Cluster Plot | Dendrogram | e-value | e-value | e-value | Condition | Condition FDR | Condition Difference |
|---|---|---|---|---|---|---|---|---|
| Thaps_hclust_0117 |
 |
 |
0.0000000000002 |
0.000000021 |
0.00000045 |
lowN_TMEVA | 0.001190 | 1.73 |
| Title | Cluster Plot | Dendrogram | e-value | e-value | e-value | Condition | Condition FDR | Condition Difference |
|---|---|---|---|---|---|---|---|---|
| Thaps_hclust_0058 |
 |
 |
0.000000037 |
0.000000014 |
0.00000069 |
lowN_TMEVA | 0.013600 | -0.527 |
| Title | Cluster Plot | Dendrogram | e-value | e-value | e-value | Condition | Condition FDR | Condition Difference |
|---|---|---|---|---|---|---|---|---|
| Thaps_hclust_0469 |
 |
 |
0.000013 |
0.00011 |
0.00029 |
lowN_TMEVA | 0.761000 | -0.113 |
| Title | Cluster Plot | Dendrogram | e-value | e-value | e-value | Condition | Condition FDR | Condition Difference |
|---|---|---|---|---|---|---|---|---|
| Thaps_hclust_0410 |
 |
 |
0.065 |
0.56 |
0.36 |
lowN_TMEVA | 0.716000 | -0.131 |
| Title | Cluster Plot | Dendrogram | e-value | e-value | e-value | Condition | Condition FDR | Condition Difference |
|---|---|---|---|---|---|---|---|---|
| Thaps_hclust_0137 |
 |
|
2.3e-18 |
0.00000000000062 |
0.000025 |
lowN_TMEVA | 0.761000 | -0.113 |
| Title | Cluster Plot | Dendrogram | e-value | e-value | e-value | Condition | Condition FDR | Condition Difference |
|---|---|---|---|---|---|---|---|---|
| Thaps_hclust_0078 |
 |
 |
8.1e-17 |
0.00018 |
0.021 |
lowN_TMEVA | 0.761000 | -0.111 |
| Title | Cluster Plot | Dendrogram | e-value | e-value | e-value | Condition | Condition FDR | Condition Difference |
|---|---|---|---|---|---|---|---|---|
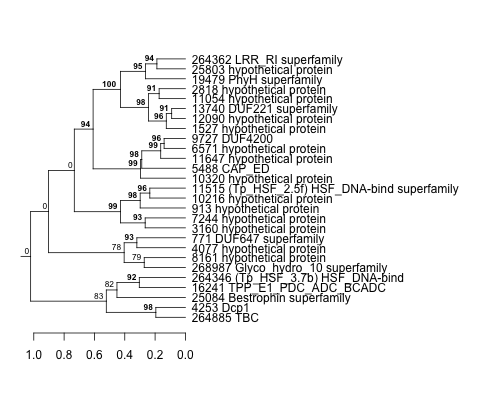
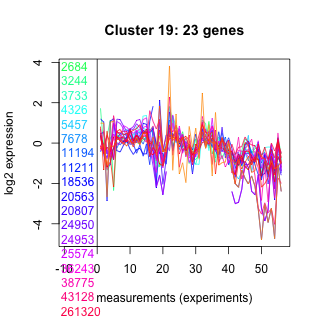
| Thaps_hclust_0489 |
 |
 |
0.00024 |
0.0048 |
0.027 |
lowN_TMEVA | 0.699000 | 0.139 |
| Title | Cluster Plot | Dendrogram | e-value | e-value | e-value | Condition | Condition FDR | Condition Difference |
|---|---|---|---|---|---|---|---|---|
| Thaps_hclust_0019 |
 |
 |
0.0000001 |
0.00000017 |
0.000037 |
lowN_TMEVA | 0.006600 | -0.793 |
| Title | Cluster Plot | Dendrogram | e-value | e-value | e-value | Condition | Condition FDR | Condition Difference |
|---|---|---|---|---|---|---|---|---|
| Thaps_hclust_0430 |
 |
 |
0.0000088 |
0.0043 |
0.22 |
lowN_TMEVA | 0.995000 | -0.00696 |
| Title | Cluster Plot | Dendrogram | e-value | e-value | e-value | Condition | Condition FDR | Condition Difference |
|---|---|---|---|---|---|---|---|---|
| Thaps_hclust_0371 |
 |
 |
0.0051 |
0.11 |
1.1 |
lowN_TMEVA | 0.120000 | -0.533 |
| Title | Cluster Plot | Dendrogram | e-value | e-value | e-value | Condition | Condition FDR | Condition Difference |
|---|---|---|---|---|---|---|---|---|
| Thaps_hclust_0039 |
 |
 |
2.2e-16 |
0.000000000000049 |
0.00083 |
lowN_TMEVA | 0.001190 | -0.622 |
| Title | Cluster Plot | Dendrogram | e-value | e-value | e-value | Condition | Condition FDR | Condition Difference |
|---|---|---|---|---|---|---|---|---|
| Thaps_hclust_0450 |
 |
 |
0.00076 |
0.024 |
0.16 |
lowN_TMEVA | 0.558000 | 0.25 |
| Title | Cluster Plot | Dendrogram | e-value | e-value | e-value | Condition | Condition FDR | Condition Difference |
|---|---|---|---|---|---|---|---|---|
| Thaps_hclust_0391 |
 |
 |
1.9 |
34 |
32 |
lowN_TMEVA | 0.113000 | -0.546 |
| Title | Cluster Plot | Dendrogram | e-value | e-value | e-value | Condition | Condition FDR | Condition Difference |
|---|---|---|---|---|---|---|---|---|
| Thaps_hclust_0332 |
 |
 |
0.000000055 |
0.0000013 |
0.0037 |
lowN_TMEVA | 0.469000 | 0.234 |
| Title | Cluster Plot | Dendrogram | e-value | e-value | e-value | Condition | Condition FDR | Condition Difference |
|---|---|---|---|---|---|---|---|---|
| Thaps_hclust_0273 |
 |
 |
0.052 |
0.27 |
12 |
lowN_TMEVA | 0.523000 | 0.255 |
| Title | Cluster Plot | Dendrogram | e-value | e-value | e-value | Condition | Condition FDR | Condition Difference |
|---|---|---|---|---|---|---|---|---|
| Thaps_hclust_0411 |
 |
 |
0.00079 |
0.0092 |
0.029 |
lowN_TMEVA | 0.061700 | 0.471 |
| Title | Cluster Plot | Dendrogram | e-value | e-value | e-value | Condition | Condition FDR | Condition Difference |
|---|---|---|---|---|---|---|---|---|
| Thaps_hclust_0352 |
 |
 |
8.7 |
78 |
79 |
lowN_TMEVA | 0.861000 | 0.0675 |
| Title | Cluster Plot | Dendrogram | e-value | e-value | e-value | Condition | Condition FDR | Condition Difference |
|---|---|---|---|---|---|---|---|---|
| Thaps_hclust_0096 |
 |
 |
0.0000028 |
0.9 |
0.38 |
lowN_TMEVA | 0.996000 | -0.00685 |
| Title | Cluster Plot | Dendrogram | e-value | e-value | e-value | Condition | Condition FDR | Condition Difference |
|---|---|---|---|---|---|---|---|---|
| Thaps_hclust_0037 |
 |
 |
0.23 |
0.79 |
340 |
lowN_TMEVA | 0.842000 | -0.0796 |
| Title | Cluster Plot | Dendrogram | e-value | e-value | e-value | Condition | Condition FDR | Condition Difference |
|---|---|---|---|---|---|---|---|---|
| Thaps_hclust_0448 |
 |
 |
0.0000000026 |
0.00021 |
8.2 |
lowN_TMEVA | 0.464000 | -0.241 |
| Title | Cluster Plot | Dendrogram | e-value | e-value | e-value | Condition | Condition FDR | Condition Difference |
|---|---|---|---|---|---|---|---|---|
| Thaps_hclust_0116 |
 |
 |
0.74 |
8.1 |
4.9 |
lowN_TMEVA | 0.651000 | 0.185 |
| Title | Cluster Plot | Dendrogram | e-value | e-value | e-value | Condition | Condition FDR | Condition Difference |
|---|---|---|---|---|---|---|---|---|
| Thaps_hclust_0057 |
 |
 |
1.5 |
1.7 |
12 |
lowN_TMEVA | 0.581000 | -0.237 |
| Title | Cluster Plot | Dendrogram | e-value | e-value | e-value | Condition | Condition FDR | Condition Difference |
|---|---|---|---|---|---|---|---|---|
| Thaps_hclust_0468 |
 |
 |
0.0023 |
0.08 |
2.3 |
lowN_TMEVA | 0.808000 | -0.0902 |
| Title | Cluster Plot | Dendrogram | e-value | e-value | e-value | Condition | Condition FDR | Condition Difference |
|---|---|---|---|---|---|---|---|---|
| Thaps_hclust_0409 |
 |
 |
0.0000000066 |
0.0028 |
0.21 |
lowN_TMEVA | 0.803000 | 0.0939 |