Hierarchical Clusters
Displaying 1101 - 1200 of 7500
| Title | Cluster Plot | Dendrogram | e-value | e-value | e-value | Condition | Condition FDR | Condition Difference |
|---|---|---|---|---|---|---|---|---|
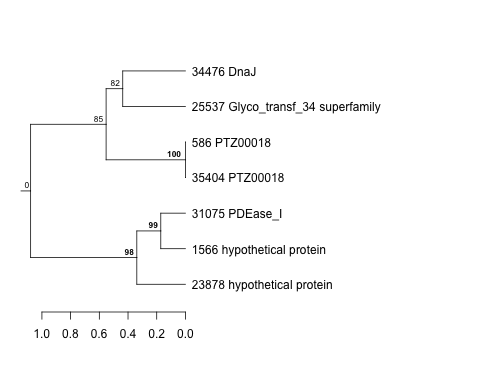
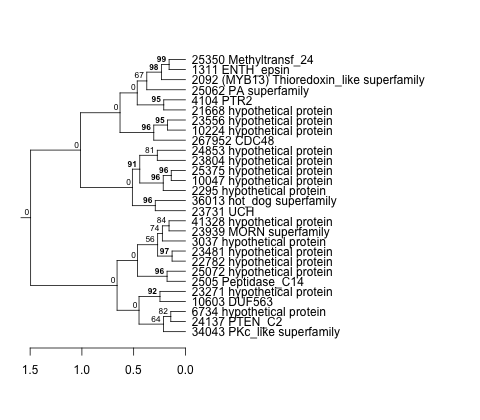
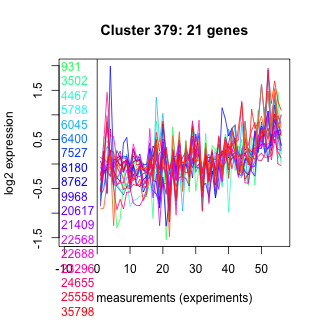
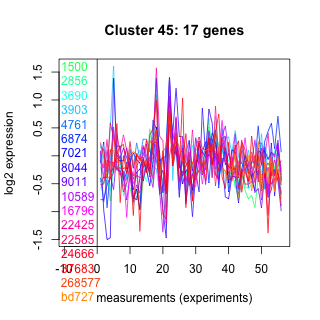
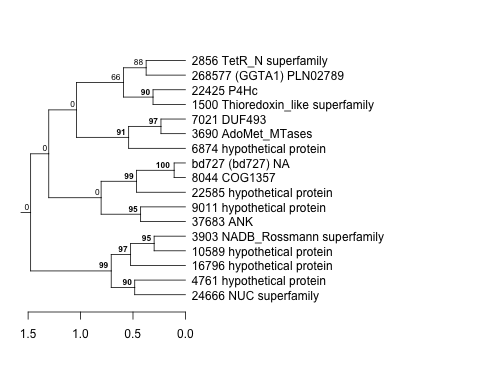
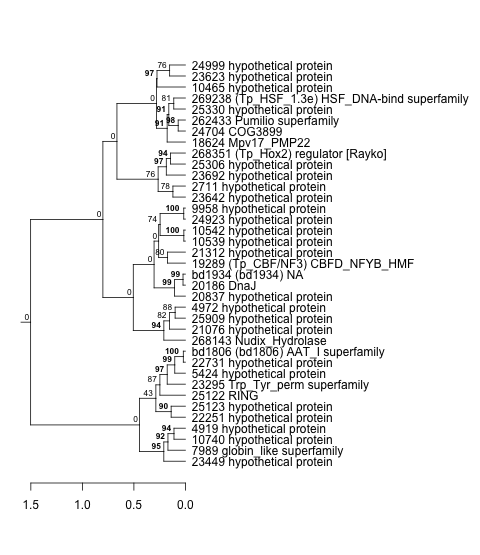
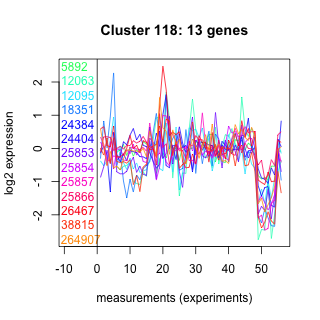
| Thaps_hclust_0324 |
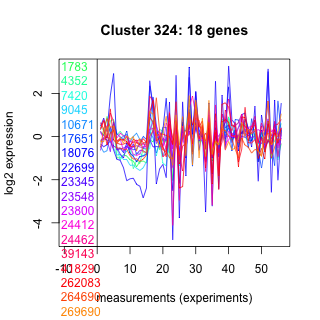 |
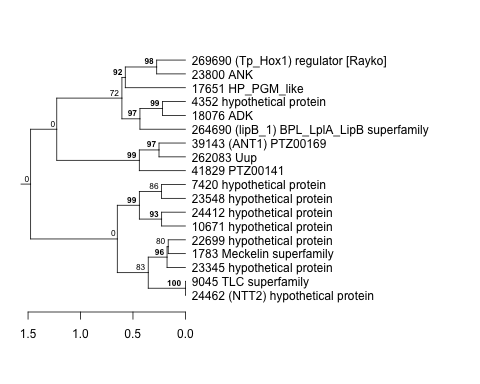 |
0.0023 |
2.4 |
5.1 |
lowN_TMEVA | 0.842000 | 0.0849 |
| Title | Cluster Plot | Dendrogram | e-value | e-value | e-value | Condition | Condition FDR | Condition Difference |
|---|---|---|---|---|---|---|---|---|
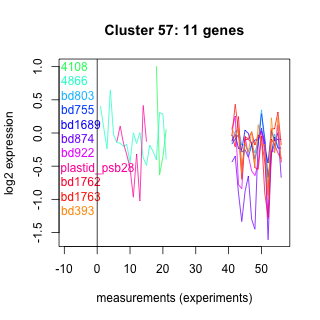
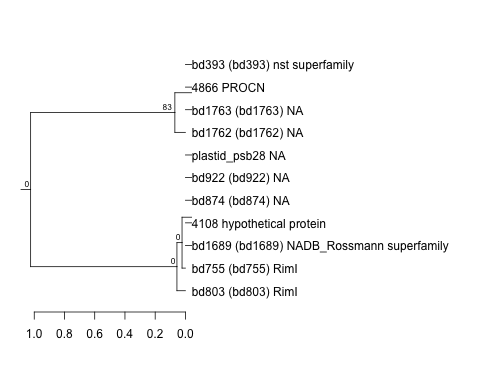
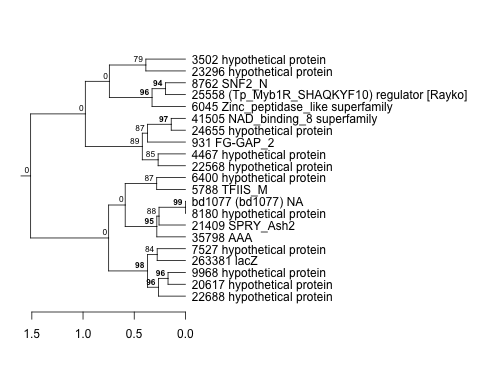
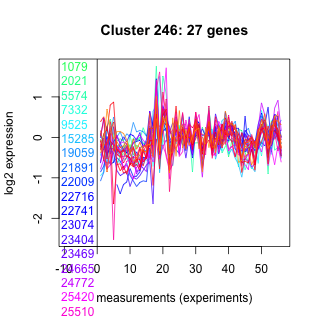
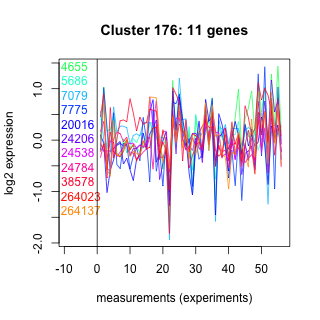
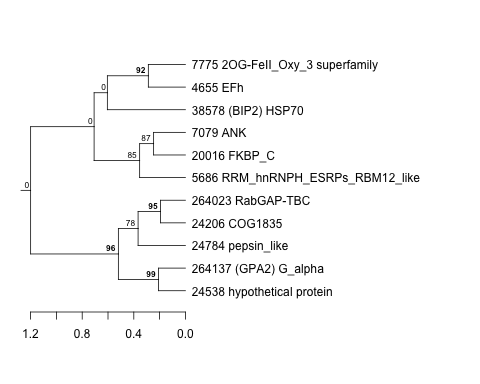
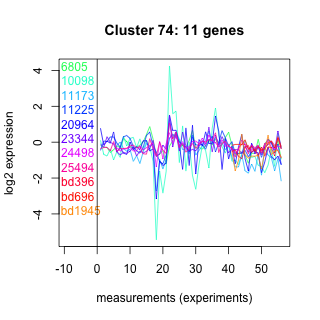
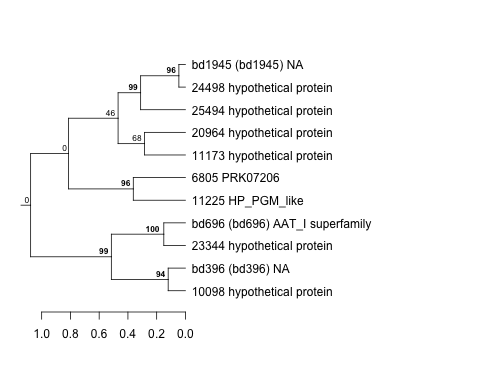
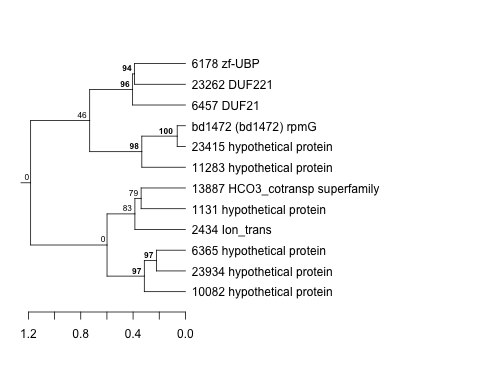
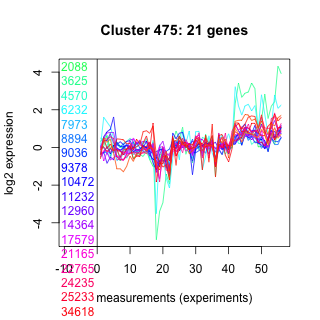
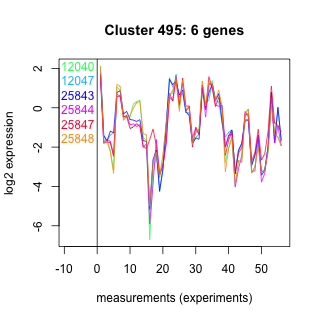
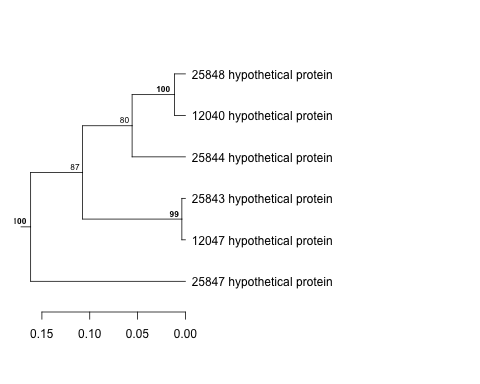
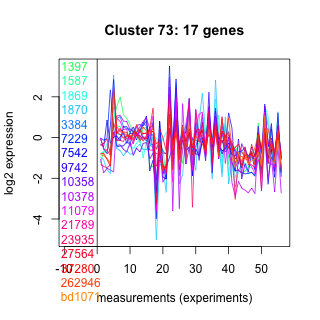
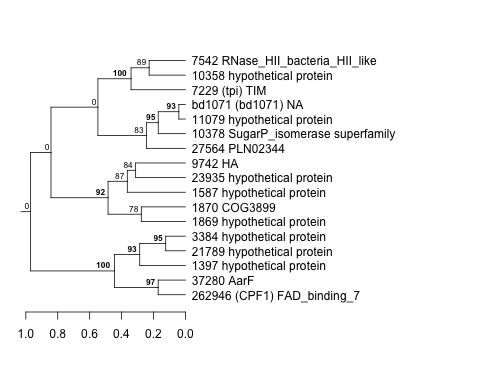
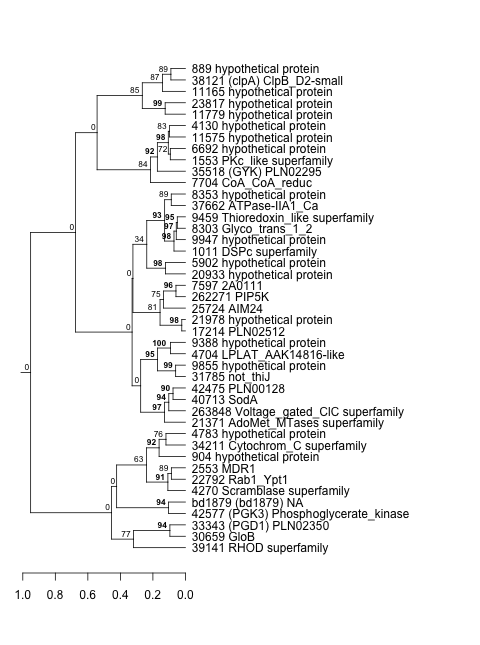
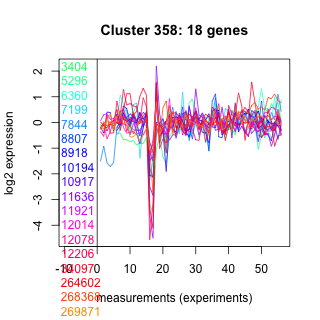
| Thaps_hclust_0497 |
 |
 |
0.1 |
5.2 |
29 |
lowN_TMEVA | 0.605000 | 0.223 |
| Title | Cluster Plot | Dendrogram | e-value | e-value | e-value | Condition | Condition FDR | Condition Difference |
|---|---|---|---|---|---|---|---|---|
| Thaps_hclust_0285 |
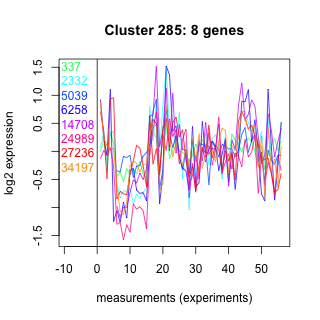 |
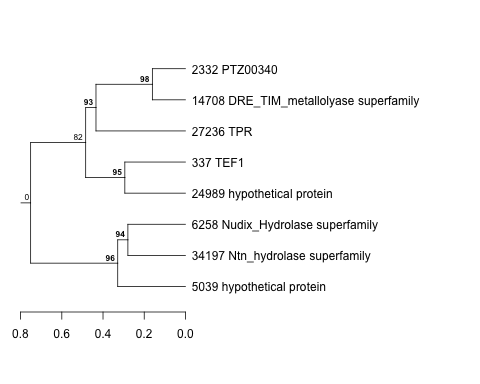 |
0.00019 |
0.057 |
5.9 |
lowN_TMEVA | 0.700000 | -0.182 |
| Title | Cluster Plot | Dendrogram | e-value | e-value | e-value | Condition | Condition FDR | Condition Difference |
|---|---|---|---|---|---|---|---|---|
| Thaps_hclust_0075 |
 |
 |
0.069 |
53 |
33 |
lowN_TMEVA | 0.187000 | -0.535 |
| Title | Cluster Plot | Dendrogram | e-value | e-value | e-value | Condition | Condition FDR | Condition Difference |
|---|---|---|---|---|---|---|---|---|
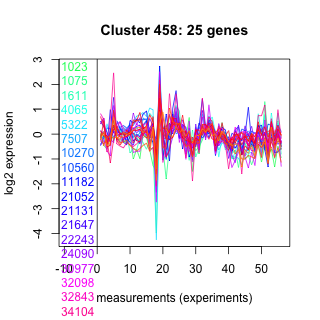
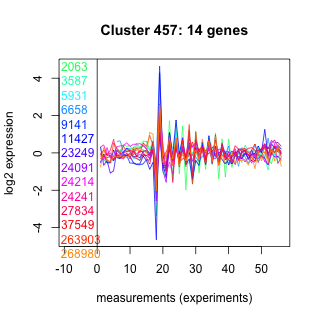
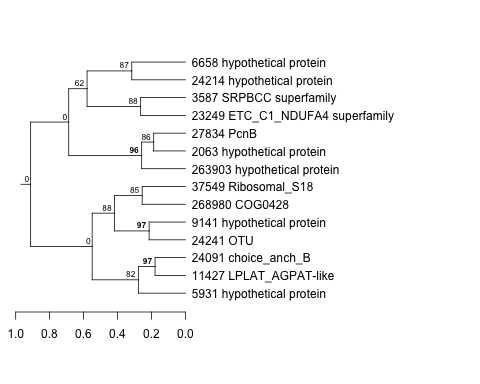
| Thaps_hclust_0458 |
 |
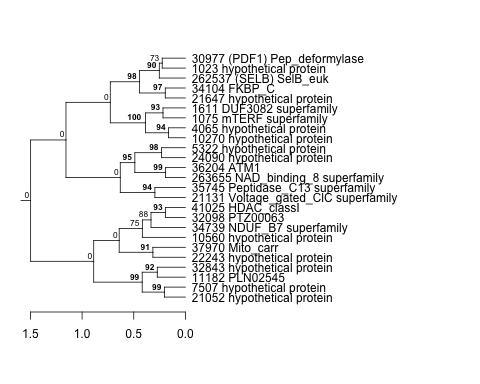 |
0.0000000041 |
0.000000022 |
0.0024 |
lowN_TMEVA | 0.392000 | -0.282 |
| Title | Cluster Plot | Dendrogram | e-value | e-value | e-value | Condition | Condition FDR | Condition Difference |
|---|---|---|---|---|---|---|---|---|
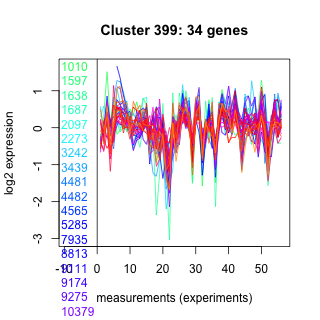
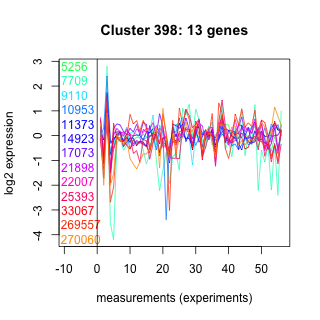
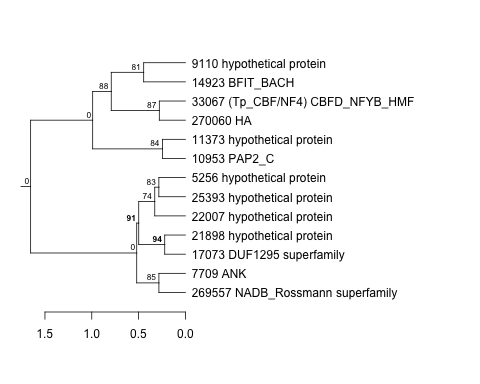
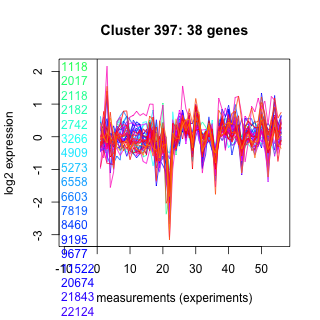
| Thaps_hclust_0399 |
 |
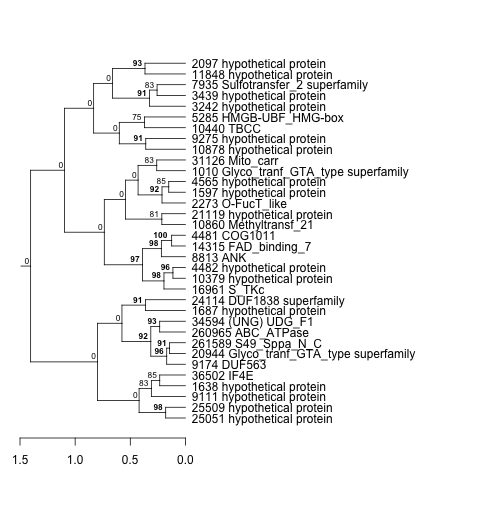 |
0.0039 |
0.16 |
0.0016 |
lowN_TMEVA | 0.255000 | 0.321 |
| Title | Cluster Plot | Dendrogram | e-value | e-value | e-value | Condition | Condition FDR | Condition Difference |
|---|---|---|---|---|---|---|---|---|
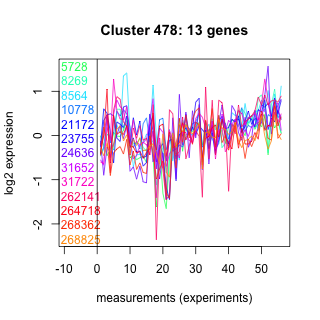
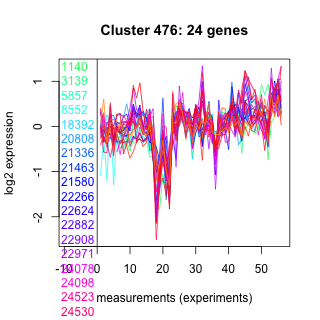
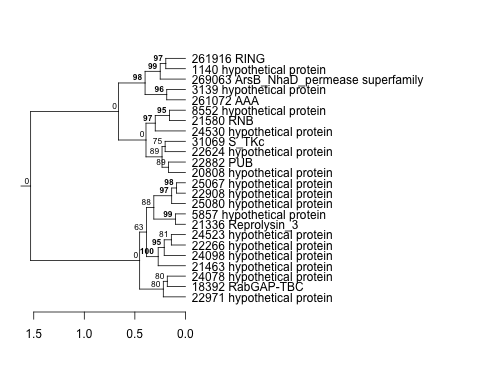
| Thaps_hclust_0478 |
 |
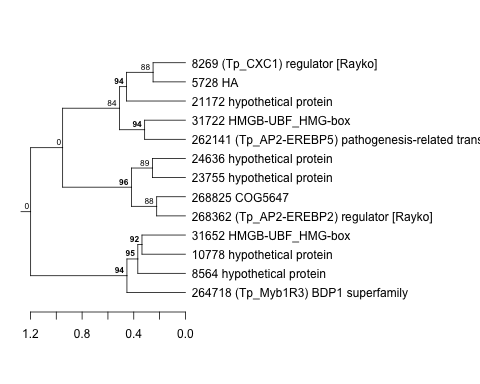 |
0.1 |
0.0096 |
3.5 |
lowN_TMEVA | 0.607000 | 0.212 |
| Title | Cluster Plot | Dendrogram | e-value | e-value | e-value | Condition | Condition FDR | Condition Difference |
|---|---|---|---|---|---|---|---|---|
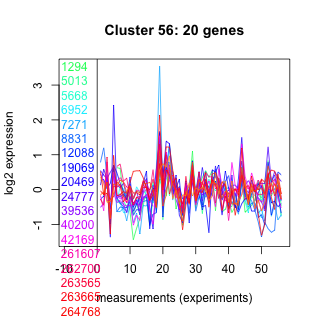
| Thaps_hclust_0058 |
 |
 |
0.000000037 |
0.000000014 |
0.00000069 |
lowN_TMEVA | 0.013600 | -0.527 |
| Title | Cluster Plot | Dendrogram | e-value | e-value | e-value | Condition | Condition FDR | Condition Difference |
|---|---|---|---|---|---|---|---|---|
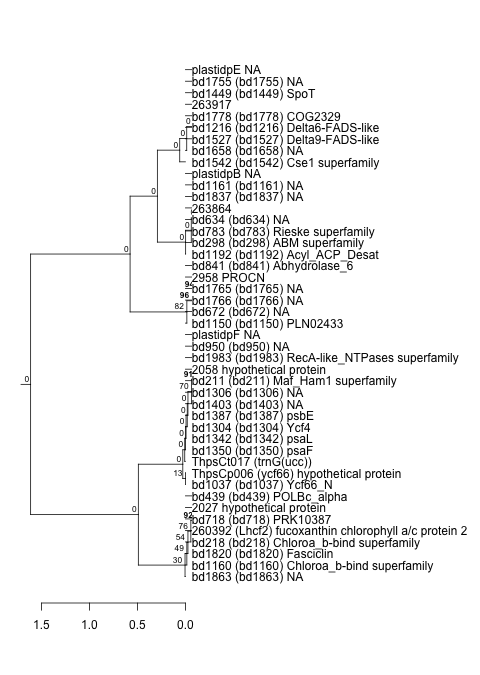
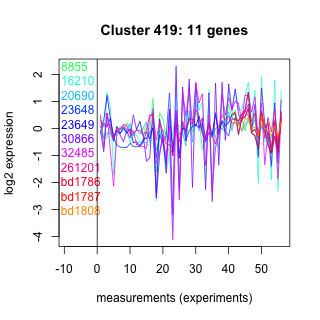
| Thaps_hclust_0419 |
 |
 |
0.0014 |
0.00031 |
0.0014 |
lowN_TMEVA | 0.310000 | 0.427 |
| Title | Cluster Plot | Dendrogram | e-value | e-value | e-value | Condition | Condition FDR | Condition Difference |
|---|---|---|---|---|---|---|---|---|
| Thaps_hclust_0120 |
 |
 |
0.00000098 |
0.000000076 |
0.001 |
lowN_TMEVA | 0.605000 | 0.189 |
| Title | Cluster Plot | Dendrogram | e-value | e-value | e-value | Condition | Condition FDR | Condition Difference |
|---|---|---|---|---|---|---|---|---|
| Thaps_hclust_0360 |
 |
 |
0.0000000013 |
0.0000000052 |
0.0000016 |
lowN_TMEVA | 0.015300 | 0.599 |
| Title | Cluster Plot | Dendrogram | e-value | e-value | e-value | Condition | Condition FDR | Condition Difference |
|---|---|---|---|---|---|---|---|---|
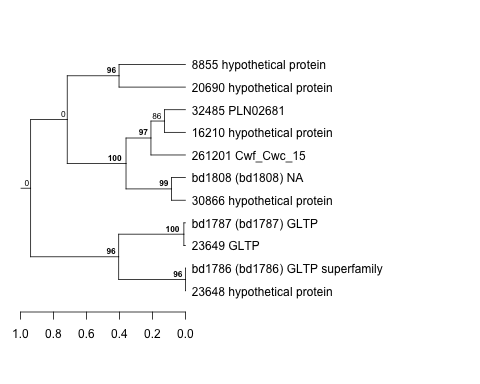
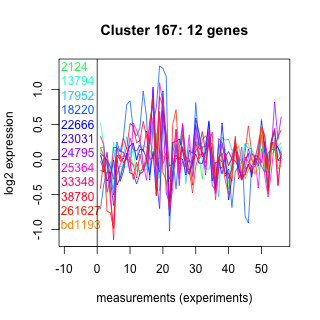
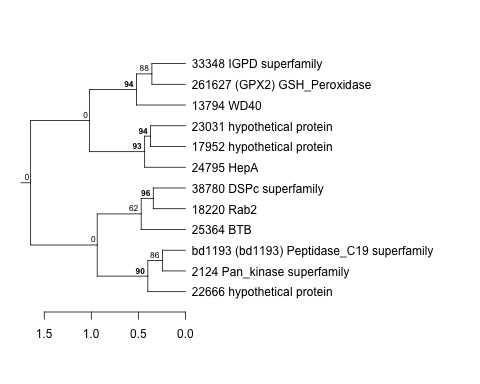
| Thaps_hclust_0167 |
 |
 |
1 |
15 |
160 |
lowN_TMEVA | 0.605000 | -0.222 |
| Title | Cluster Plot | Dendrogram | e-value | e-value | e-value | Condition | Condition FDR | Condition Difference |
|---|---|---|---|---|---|---|---|---|
| Thaps_hclust_0498 |
 |
 |
1.3 |
1.8 |
1.8 |
lowN_TMEVA | 0.663000 | 0.179 |
| Title | Cluster Plot | Dendrogram | e-value | e-value | e-value | Condition | Condition FDR | Condition Difference |
|---|---|---|---|---|---|---|---|---|
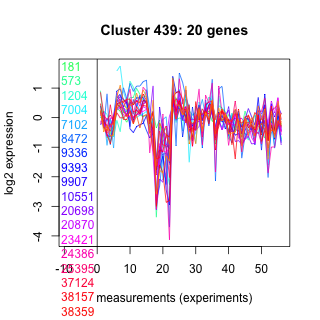
| Thaps_hclust_0439 |
 |
 |
0.00085 |
0.014 |
0.032 |
lowN_TMEVA | 0.341000 | -0.328 |
| Title | Cluster Plot | Dendrogram | e-value | e-value | e-value | Condition | Condition FDR | Condition Difference |
|---|---|---|---|---|---|---|---|---|
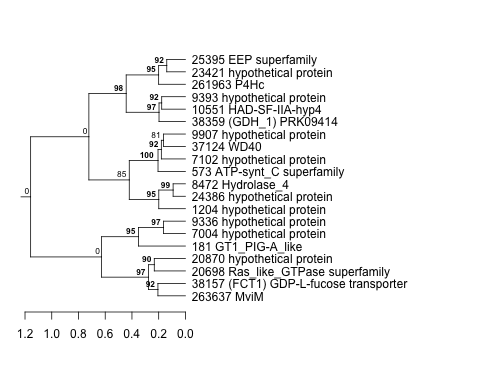
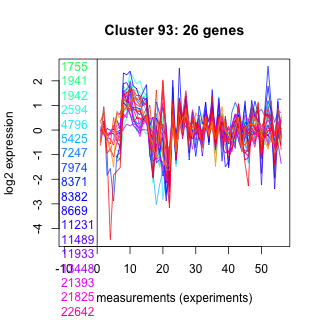
| Thaps_hclust_0093 |
 |
 |
0.0000082 |
0.022 |
0.0012 |
lowN_TMEVA | 0.077300 | -0.5 |
| Title | Cluster Plot | Dendrogram | e-value | e-value | e-value | Condition | Condition FDR | Condition Difference |
|---|---|---|---|---|---|---|---|---|
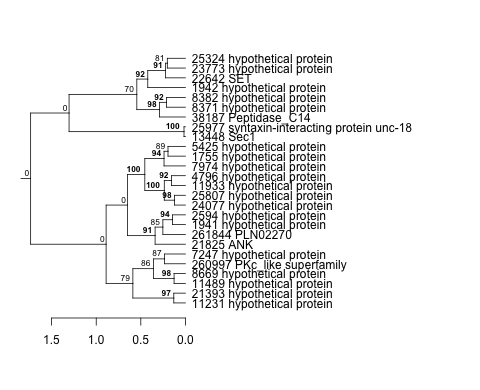
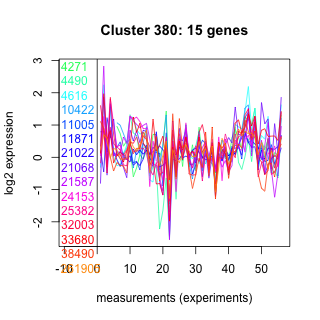
| Thaps_hclust_0380 |
 |
 |
1.1 |
5 |
8.7 |
lowN_TMEVA | 0.761000 | 0.125 |
| Title | Cluster Plot | Dendrogram | e-value | e-value | e-value | Condition | Condition FDR | Condition Difference |
|---|---|---|---|---|---|---|---|---|
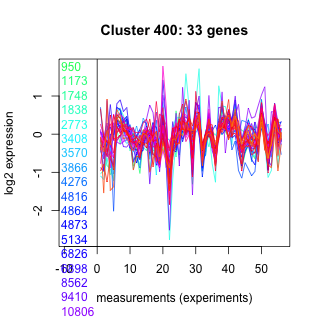
| Thaps_hclust_0400 |
 |
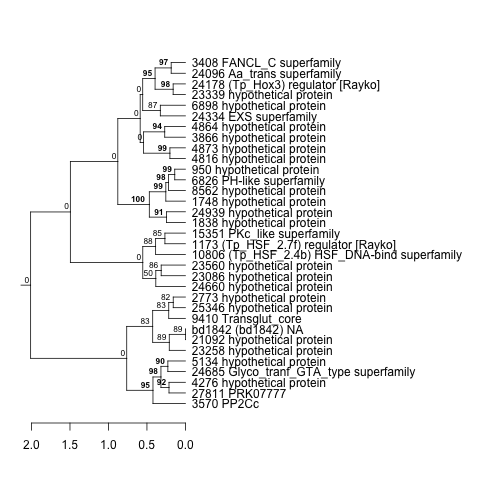 |
Not available | Not available | Not available | lowN_TMEVA | 0.542000 | -0.196 |
| Title | Cluster Plot | Dendrogram | e-value | e-value | e-value | Condition | Condition FDR | Condition Difference |
|---|---|---|---|---|---|---|---|---|
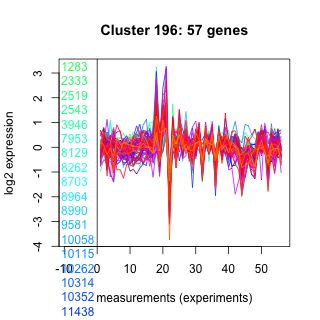
| Thaps_hclust_0196 |
 |
 |
0.0000000000000088 |
0.00000034 |
0.000017 |
lowN_TMEVA | 0.633000 | -0.156 |
| Title | Cluster Plot | Dendrogram | e-value | e-value | e-value | Condition | Condition FDR | Condition Difference |
|---|---|---|---|---|---|---|---|---|
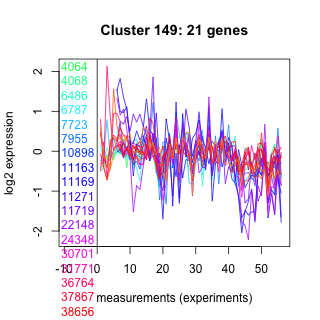
| Thaps_hclust_0149 |
 |
 |
0.00000027 |
0.46 |
3 |
lowN_TMEVA | 0.963000 | -0.0171 |
| Title | Cluster Plot | Dendrogram | e-value | e-value | e-value | Condition | Condition FDR | Condition Difference |
|---|---|---|---|---|---|---|---|---|
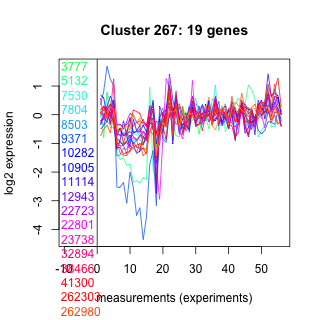
| Thaps_hclust_0267 |
 |
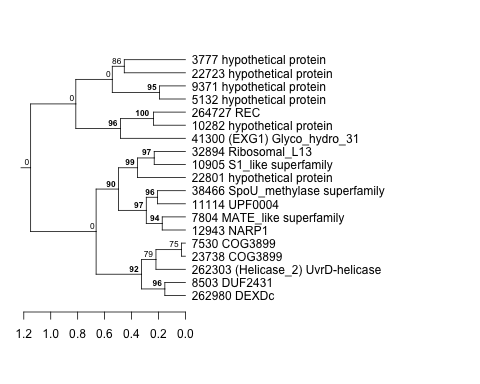 |
0.00000003 |
0.39 |
0.58 |
lowN_TMEVA | 0.670000 | 0.165 |
| Title | Cluster Plot | Dendrogram | e-value | e-value | e-value | Condition | Condition FDR | Condition Difference |
|---|---|---|---|---|---|---|---|---|
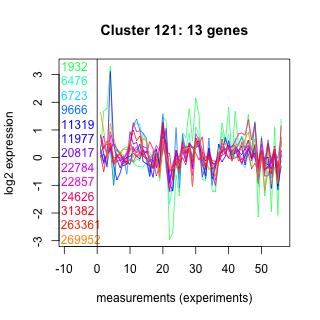
| Thaps_hclust_0121 |
 |
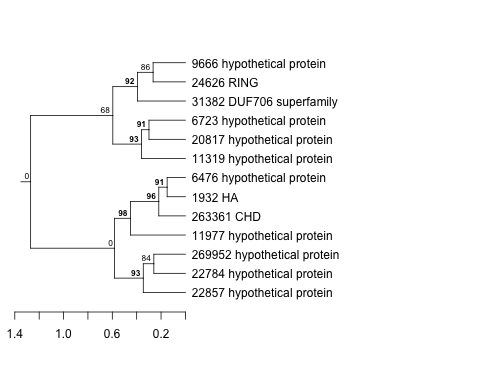 |
0.00021 |
0.77 |
30 |
lowN_TMEVA | 0.509000 | 0.264 |
| Title | Cluster Plot | Dendrogram | e-value | e-value | e-value | Condition | Condition FDR | Condition Difference |
|---|---|---|---|---|---|---|---|---|
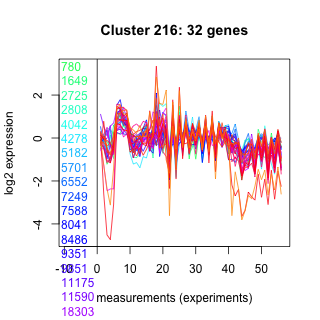
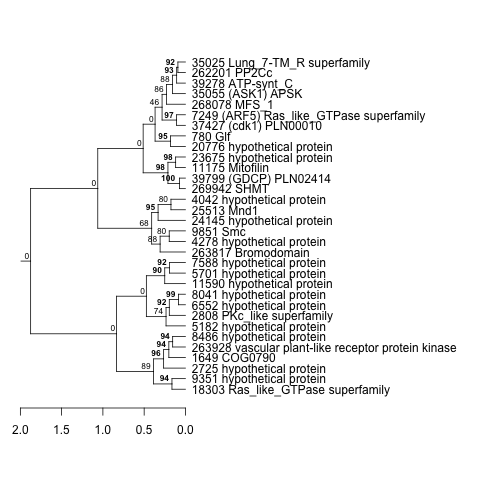
| Thaps_hclust_0216 |
 |
 |
0.0000076 |
0.019 |
0.0036 |
lowN_TMEVA | 0.001190 | -0.784 |
| Title | Cluster Plot | Dendrogram | e-value | e-value | e-value | Condition | Condition FDR | Condition Difference |
|---|---|---|---|---|---|---|---|---|
| Thaps_hclust_0343 |
 |
 |
9.7e-16 |
0.000000023 |
0.0000000024 |
lowN_TMEVA | 1.000000 | 0.00376 |
| Title | Cluster Plot | Dendrogram | e-value | e-value | e-value | Condition | Condition FDR | Condition Difference |
|---|---|---|---|---|---|---|---|---|
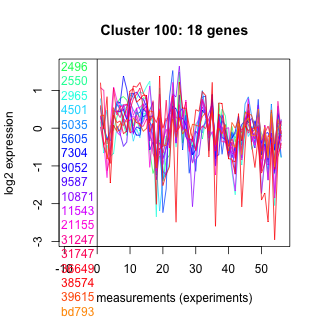
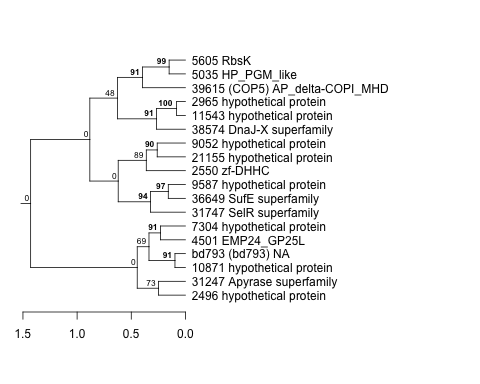
| Thaps_hclust_0100 |
 |
 |
0.00000073 |
0.000076 |
2.6 |
lowN_TMEVA | 0.261000 | -0.394 |
| Title | Cluster Plot | Dendrogram | e-value | e-value | e-value | Condition | Condition FDR | Condition Difference |
|---|---|---|---|---|---|---|---|---|
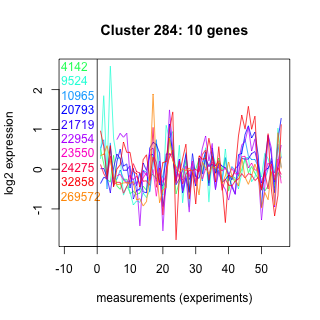
| Thaps_hclust_0284 |
 |
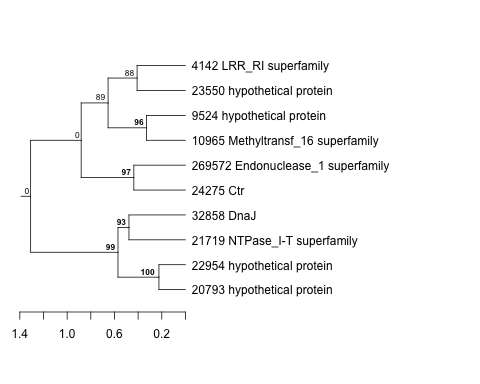 |
0.0011 |
0.067 |
0.038 |
lowN_TMEVA | 0.740000 | -0.153 |
| Title | Cluster Plot | Dendrogram | e-value | e-value | e-value | Condition | Condition FDR | Condition Difference |
|---|---|---|---|---|---|---|---|---|
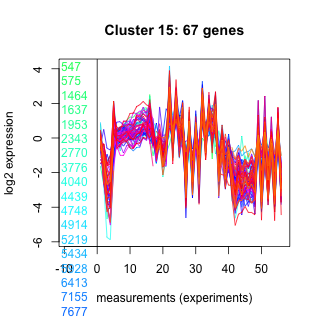
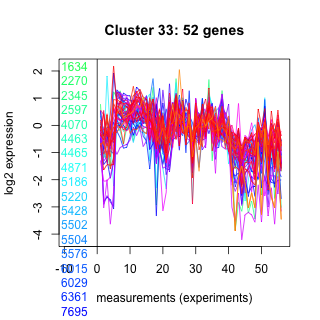
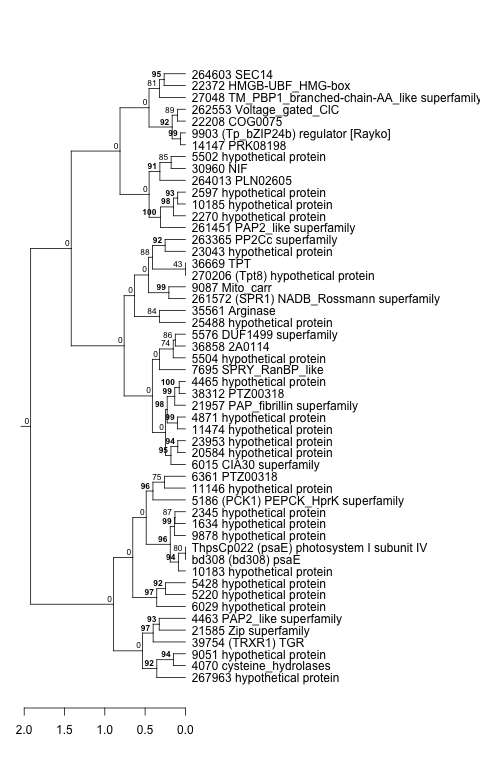
| Thaps_hclust_0015 |
 |
|
2.5e-25 |
7.4e-21 |
0.0000000011 |
lowN_TMEVA | 0.001190 | -2.83 |
| Title | Cluster Plot | Dendrogram | e-value | e-value | e-value | Condition | Condition FDR | Condition Difference |
|---|---|---|---|---|---|---|---|---|
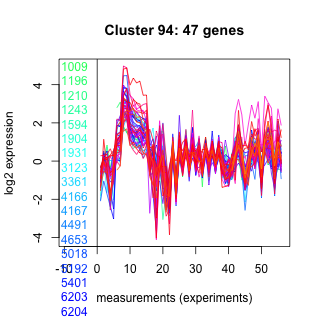
| Thaps_hclust_0094 |
 |
 |
0.0000000025 |
0.000014 |
0.0000045 |
lowN_TMEVA | 0.310000 | -0.266 |
| Title | Cluster Plot | Dendrogram | e-value | e-value | e-value | Condition | Condition FDR | Condition Difference |
|---|---|---|---|---|---|---|---|---|
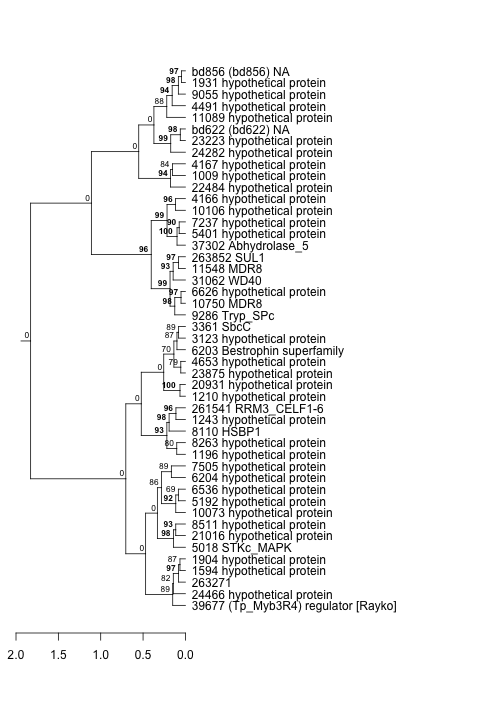
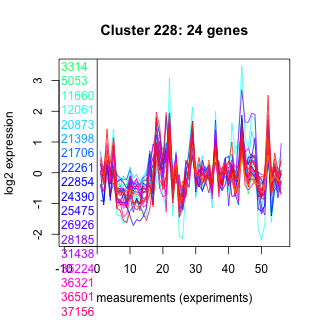
| Thaps_hclust_0228 |
 |
 |
0.00000000000028 |
0.0027 |
0.016 |
lowN_TMEVA | 0.182000 | 0.41 |
| Title | Cluster Plot | Dendrogram | e-value | e-value | e-value | Condition | Condition FDR | Condition Difference |
|---|---|---|---|---|---|---|---|---|
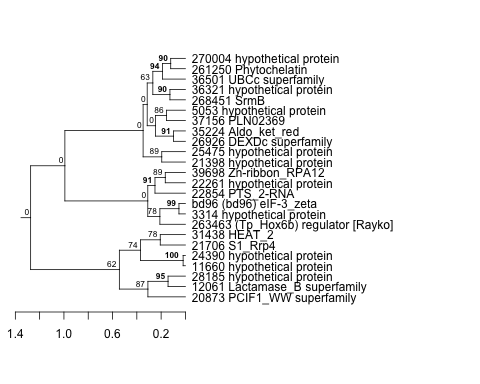
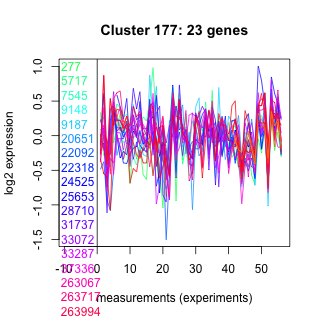
| Thaps_hclust_0177 |
 |
 |
0.0000000012 |
0.0000078 |
0.00084 |
lowN_TMEVA | 0.090400 | -0.509 |
| Title | Cluster Plot | Dendrogram | e-value | e-value | e-value | Condition | Condition FDR | Condition Difference |
|---|---|---|---|---|---|---|---|---|
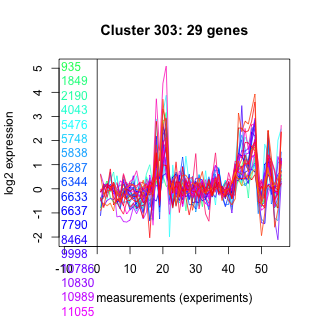
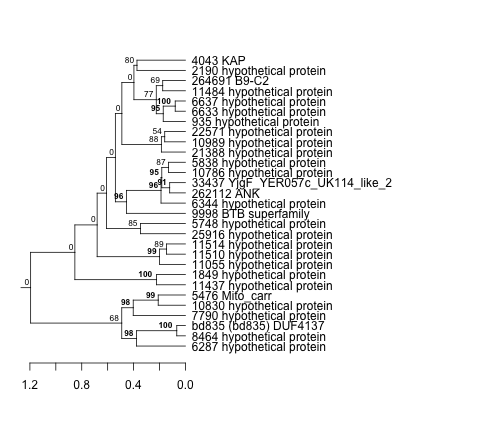
| Thaps_hclust_0304 |
 |
 |
0.16 |
1.3 |
16 |
lowN_TMEVA | 0.509000 | -0.207 |
| Title | Cluster Plot | Dendrogram | e-value | e-value | e-value | Condition | Condition FDR | Condition Difference |
|---|---|---|---|---|---|---|---|---|
| Thaps_hclust_0046 |
 |
 |
0.00000051 |
0.000067 |
0.29 |
lowN_TMEVA | 0.123000 | 0.452 |
| Title | Cluster Plot | Dendrogram | e-value | e-value | e-value | Condition | Condition FDR | Condition Difference |
|---|---|---|---|---|---|---|---|---|
| Thaps_hclust_0477 |
 |
 |
0.02 |
0.011 |
0.071 |
lowN_TMEVA | 0.855000 | 0.0905 |
| Title | Cluster Plot | Dendrogram | e-value | e-value | e-value | Condition | Condition FDR | Condition Difference |
|---|---|---|---|---|---|---|---|---|
| Thaps_hclust_0057 |
 |
 |
1.5 |
1.7 |
12 |
lowN_TMEVA | 0.581000 | -0.237 |
| Title | Cluster Plot | Dendrogram | e-value | e-value | e-value | Condition | Condition FDR | Condition Difference |
|---|---|---|---|---|---|---|---|---|
| Thaps_hclust_0147 |
 |
 |
0.0000023 |
0.000053 |
1.9 |
lowN_TMEVA | 0.761000 | -0.117 |
| Title | Cluster Plot | Dendrogram | e-value | e-value | e-value | Condition | Condition FDR | Condition Difference |
|---|---|---|---|---|---|---|---|---|
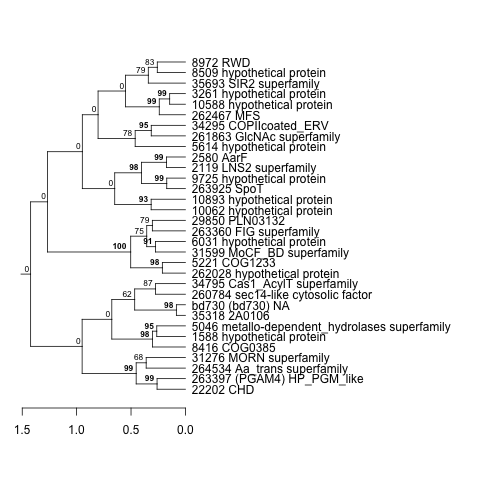
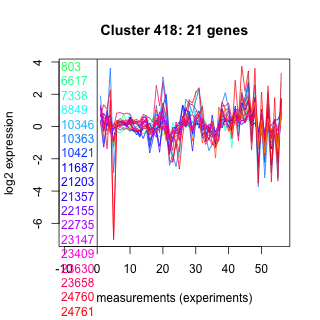
| Thaps_hclust_0418 |
 |
 |
0.00074 |
0.0098 |
0.29 |
lowN_TMEVA | 0.368000 | 0.305 |
| Title | Cluster Plot | Dendrogram | e-value | e-value | e-value | Condition | Condition FDR | Condition Difference |
|---|---|---|---|---|---|---|---|---|
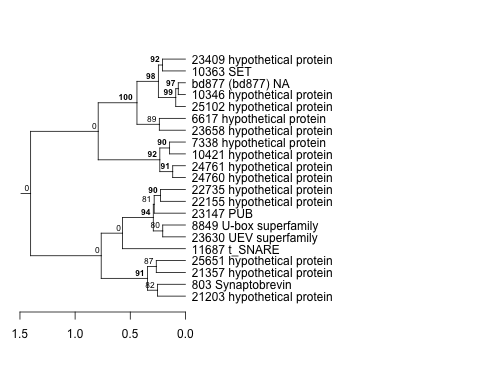
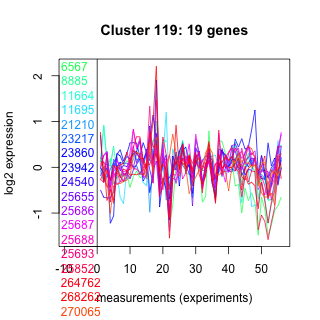
| Thaps_hclust_0119 |
 |
 |
0.000017 |
0.0015 |
0.0058 |
lowN_TMEVA | 0.861000 | -0.0611 |
| Title | Cluster Plot | Dendrogram | e-value | e-value | e-value | Condition | Condition FDR | Condition Difference |
|---|---|---|---|---|---|---|---|---|
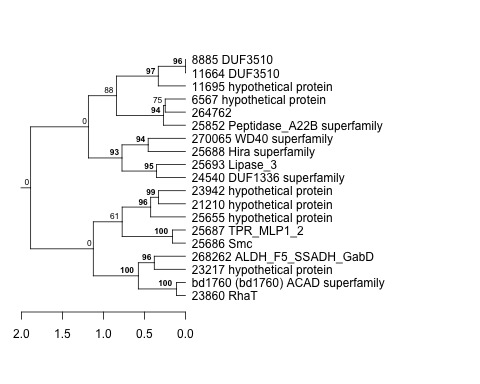
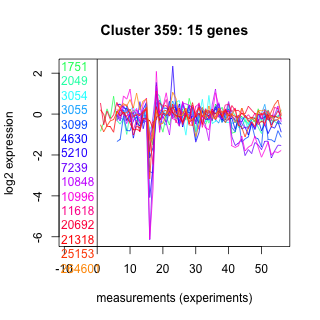
| Thaps_hclust_0359 |
 |
 |
0.5 |
11 |
31 |
lowN_TMEVA | 0.643000 | -0.189 |
| Title | Cluster Plot | Dendrogram | e-value | e-value | e-value | Condition | Condition FDR | Condition Difference |
|---|---|---|---|---|---|---|---|---|
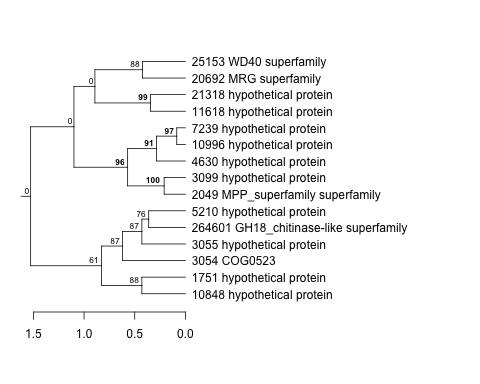
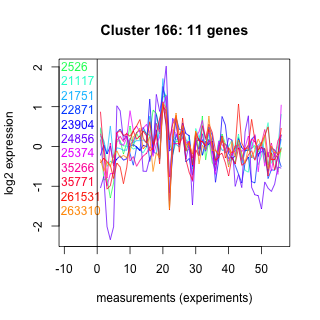
| Thaps_hclust_0166 |
 |
 |
0.001 |
5.3 |
63 |
lowN_TMEVA | 0.077500 | -0.733 |
| Title | Cluster Plot | Dendrogram | e-value | e-value | e-value | Condition | Condition FDR | Condition Difference |
|---|---|---|---|---|---|---|---|---|
| Thaps_hclust_0011 |
 |
 |
0.000023 |
10 |
1.3 |
lowN_TMEVA | 0.335000 | -0.342 |
| Title | Cluster Plot | Dendrogram | e-value | e-value | e-value | Condition | Condition FDR | Condition Difference |
|---|---|---|---|---|---|---|---|---|
| Thaps_hclust_0438 |
 |
 |
0.0024 |
1.5 |
3.6 |
lowN_TMEVA | 0.176000 | -0.382 |
| Title | Cluster Plot | Dendrogram | e-value | e-value | e-value | Condition | Condition FDR | Condition Difference |
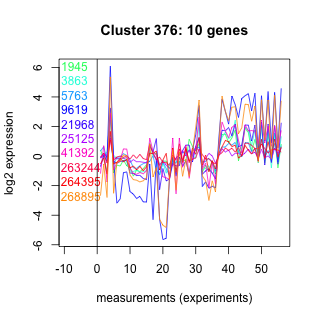
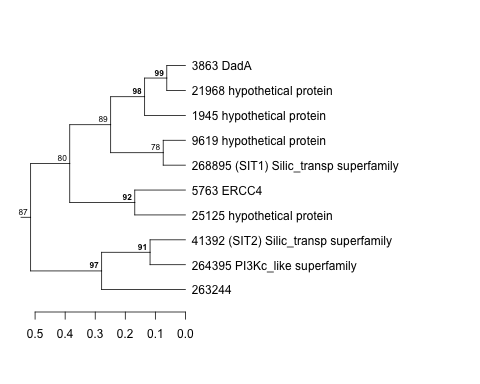
|---|---|---|---|---|---|---|---|---|
| Thaps_hclust_0092 |
 |
|
1.3e-37 |
4.2e-20 |
0.0000000000000013 |
lowN_TMEVA | 0.001190 | -0.464 |
| Title | Cluster Plot | Dendrogram | e-value | e-value | e-value | Condition | Condition FDR | Condition Difference |
|---|---|---|---|---|---|---|---|---|
| Thaps_hclust_0379 |
 |
 |
0.00013 |
0.012 |
0.26 |
lowN_TMEVA | 0.699000 | 0.15 |
| Title | Cluster Plot | Dendrogram | e-value | e-value | e-value | Condition | Condition FDR | Condition Difference |
|---|---|---|---|---|---|---|---|---|
| Thaps_hclust_0246 |
 |
 |
0.0000088 |
0.0034 |
3.7 |
lowN_TMEVA | 0.430000 | -0.254 |
| Title | Cluster Plot | Dendrogram | e-value | e-value | e-value | Condition | Condition FDR | Condition Difference |
|---|---|---|---|---|---|---|---|---|
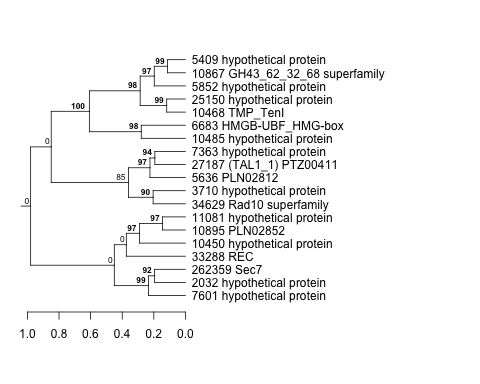
| Thaps_hclust_0195 |
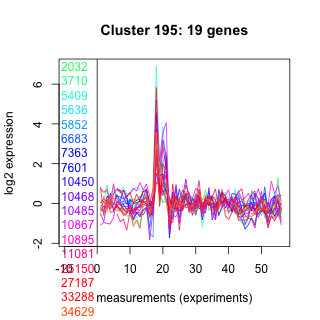 |
 |
0.0031 |
0.024 |
0.00037 |
lowN_TMEVA | 0.894000 | 0.0444 |
| Title | Cluster Plot | Dendrogram | e-value | e-value | e-value | Condition | Condition FDR | Condition Difference |
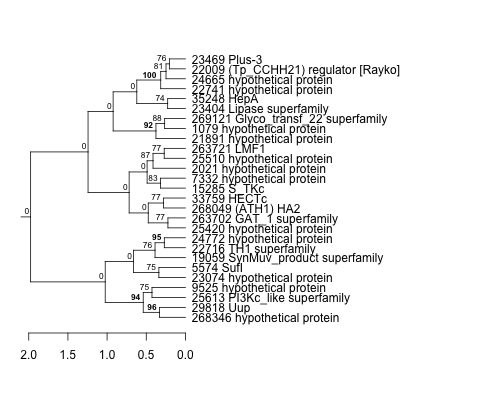
|---|---|---|---|---|---|---|---|---|
| Thaps_hclust_0322 |
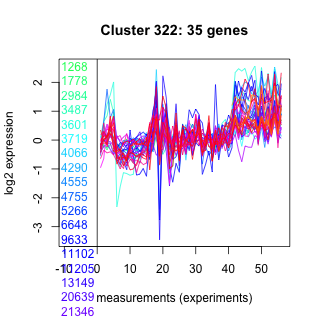 |
 |
0.0000000021 |
0.0000000053 |
0.0051 |
lowN_TMEVA | 0.659000 | 0.155 |
| Title | Cluster Plot | Dendrogram | e-value | e-value | e-value | Condition | Condition FDR | Condition Difference |
|---|---|---|---|---|---|---|---|---|
| Thaps_hclust_0148 |
 |
 |
4.7 |
39 |
51 |
lowN_TMEVA | 0.505000 | -0.241 |
| Title | Cluster Plot | Dendrogram | e-value | e-value | e-value | Condition | Condition FDR | Condition Difference |
|---|---|---|---|---|---|---|---|---|
| Thaps_hclust_0266 |
 |
 |
0.44 |
17 |
30 |
lowN_TMEVA | 0.362000 | -0.431 |
| Title | Cluster Plot | Dendrogram | e-value | e-value | e-value | Condition | Condition FDR | Condition Difference |
|---|---|---|---|---|---|---|---|---|
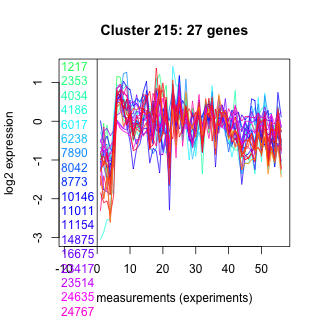
| Thaps_hclust_0215 |
 |
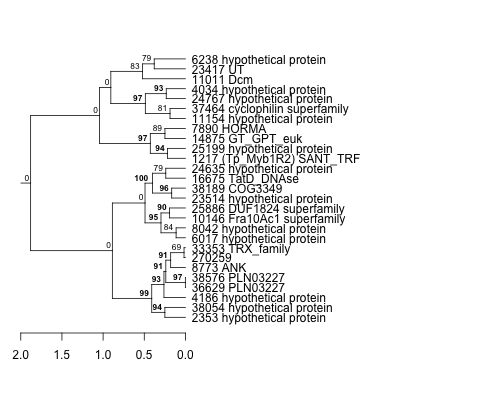 |
0.000036 |
0.0000076 |
0.000057 |
lowN_TMEVA | 0.001190 | -1.15 |
| Title | Cluster Plot | Dendrogram | e-value | e-value | e-value | Condition | Condition FDR | Condition Difference |
|---|---|---|---|---|---|---|---|---|
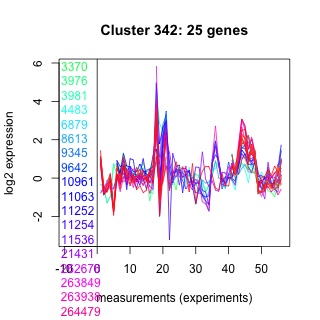
| Thaps_hclust_0342 |
 |
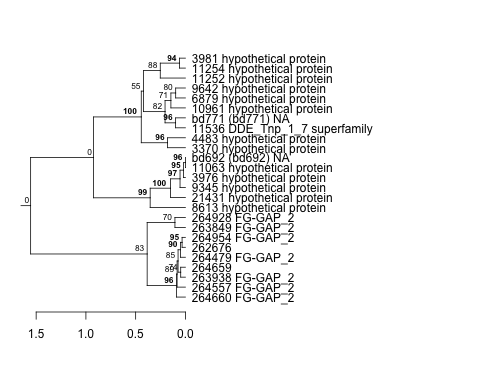 |
5.79997e-41 |
2.7e-33 |
3.1e-31 |
lowN_TMEVA | 0.026800 | -0.609 |
| Title | Cluster Plot | Dendrogram | e-value | e-value | e-value | Condition | Condition FDR | Condition Difference |
|---|---|---|---|---|---|---|---|---|
| Thaps_hclust_0099 |
 |
 |
0.0000000000000032 |
0.000000000000013 |
0.000000000000025 |
lowN_TMEVA | 0.027400 | -1.48 |
| Title | Cluster Plot | Dendrogram | e-value | e-value | e-value | Condition | Condition FDR | Condition Difference |
|---|---|---|---|---|---|---|---|---|
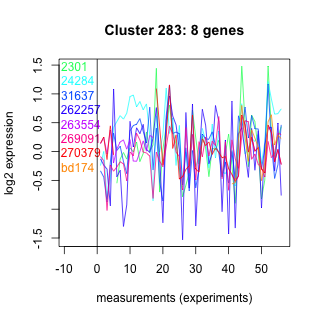
| Thaps_hclust_0283 |
 |
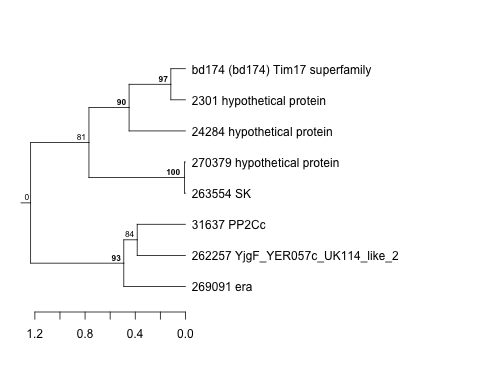 |
0.0022 |
0.0079 |
0.019 |
lowN_TMEVA | 0.261000 | -0.534 |
| Title | Cluster Plot | Dendrogram | e-value | e-value | e-value | Condition | Condition FDR | Condition Difference |
|---|---|---|---|---|---|---|---|---|
| Thaps_hclust_0014 |
 |
 |
Not available | Not available | Not available | lowN_TMEVA | 0.001190 | -1.29 |
| Title | Cluster Plot | Dendrogram | e-value | e-value | e-value | Condition | Condition FDR | Condition Difference |
|---|---|---|---|---|---|---|---|---|
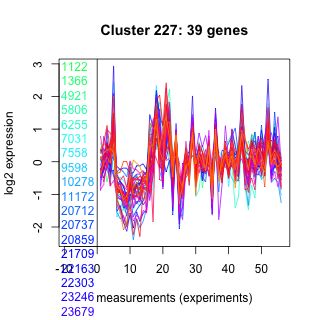
| Thaps_hclust_0227 |
 |
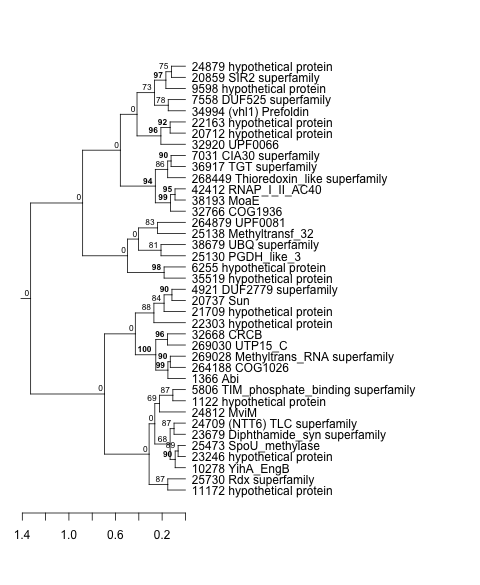 |
1.2e-22 |
0.0000000098 |
0.0018 |
lowN_TMEVA | 0.356000 | 0.263 |
| Title | Cluster Plot | Dendrogram | e-value | e-value | e-value | Condition | Condition FDR | Condition Difference |
|---|---|---|---|---|---|---|---|---|
| Thaps_hclust_0176 |
 |
 |
29 |
59 |
110 |
lowN_TMEVA | 0.355000 | -0.383 |
| Title | Cluster Plot | Dendrogram | e-value | e-value | e-value | Condition | Condition FDR | Condition Difference |
|---|---|---|---|---|---|---|---|---|
| Thaps_hclust_0303 |
 |
 |
0.00096 |
0.0021 |
0.0014 |
lowN_TMEVA | 0.861000 | -0.0653 |
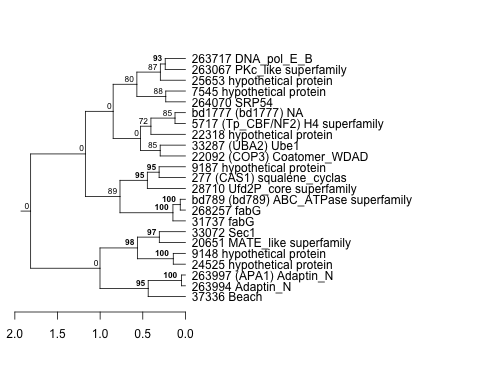
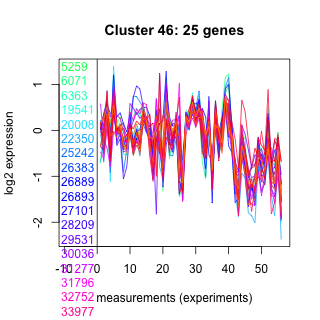
| Title | Cluster Plot | Dendrogram | e-value | e-value | e-value | Condition | Condition FDR | Condition Difference |
|---|---|---|---|---|---|---|---|---|
| Thaps_hclust_0045 |
 |
 |
0.0000000028 |
0.0075 |
5.4 |
lowN_TMEVA | 0.310000 | -0.362 |
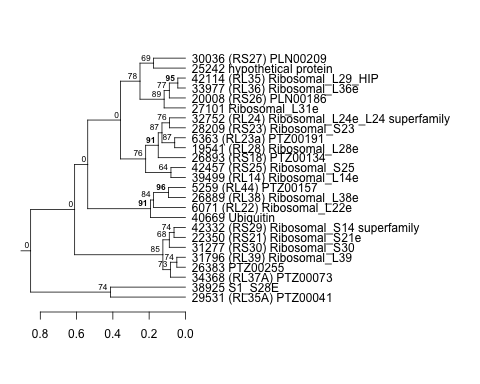
| Title | Cluster Plot | Dendrogram | e-value | e-value | e-value | Condition | Condition FDR | Condition Difference |
|---|---|---|---|---|---|---|---|---|
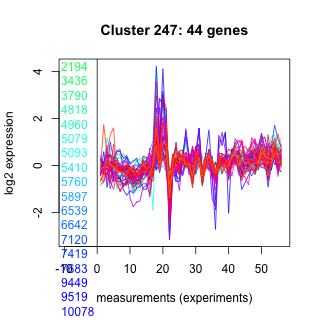
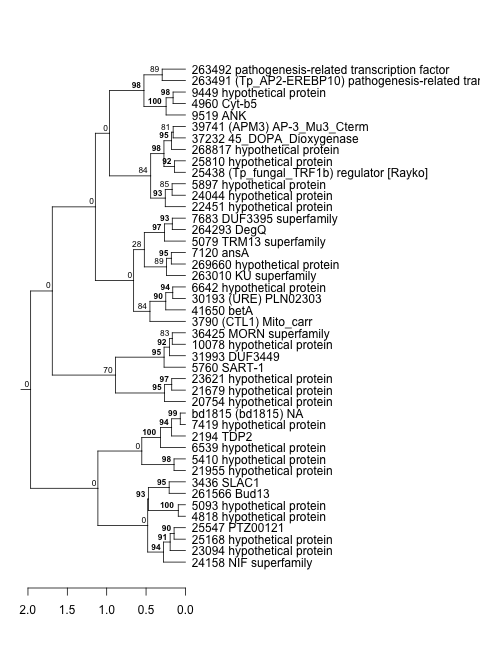
| Thaps_hclust_0247 |
 |
 |
8.7e-16 |
0.00000000045 |
0.0000019 |
lowN_TMEVA | 0.761000 | 0.107 |
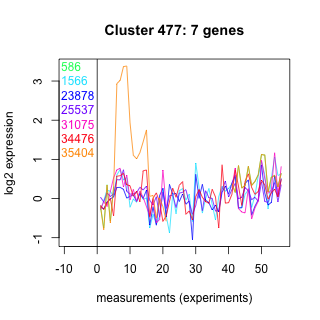
| Title | Cluster Plot | Dendrogram | e-value | e-value | e-value | Condition | Condition FDR | Condition Difference |
|---|---|---|---|---|---|---|---|---|
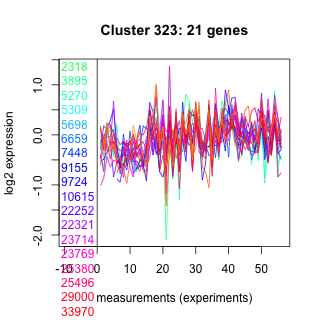
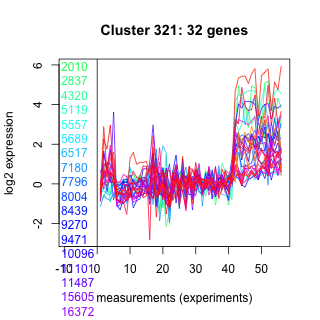
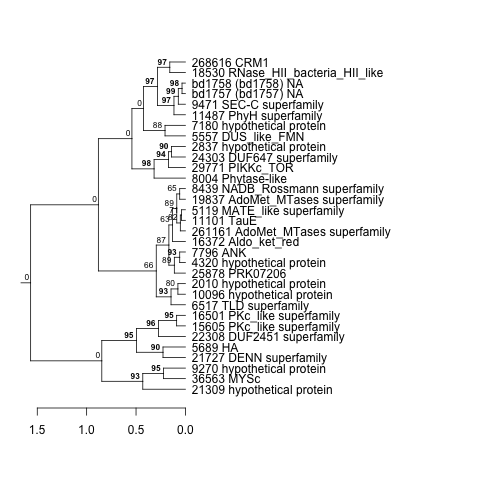
| Thaps_hclust_0323 |
 |
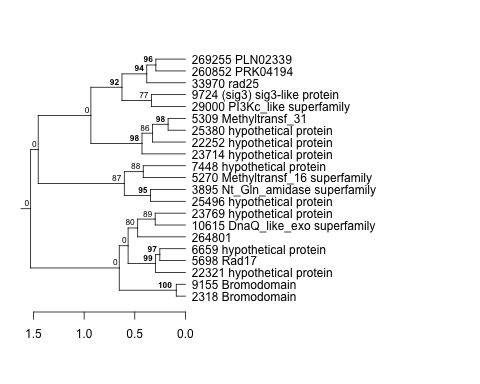 |
0.0011 |
0.014 |
36 |
lowN_TMEVA | 0.861000 | -0.0621 |
| Title | Cluster Plot | Dendrogram | e-value | e-value | e-value | Condition | Condition FDR | Condition Difference |
|---|---|---|---|---|---|---|---|---|
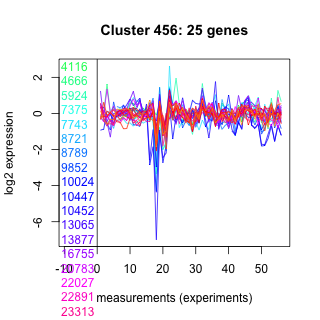
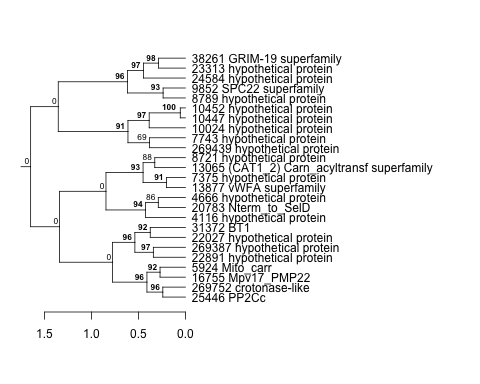
| Thaps_hclust_0496 |
 |
 |
0.00082 |
0.0031 |
0.43 |
lowN_TMEVA | 0.193000 | -0.395 |
| Title | Cluster Plot | Dendrogram | e-value | e-value | e-value | Condition | Condition FDR | Condition Difference |
|---|---|---|---|---|---|---|---|---|
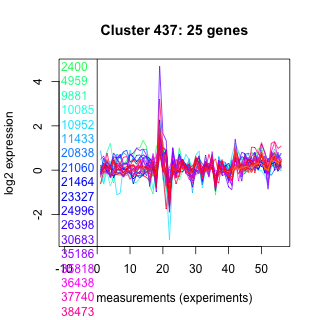
| Thaps_hclust_0437 |
 |
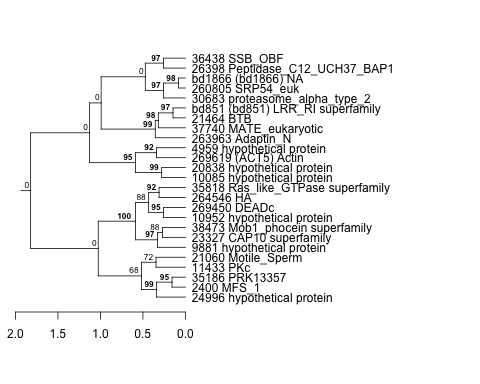 |
0.000000016 |
0.0023 |
3.3 |
lowN_TMEVA | 0.662000 | 0.164 |
| Title | Cluster Plot | Dendrogram | e-value | e-value | e-value | Condition | Condition FDR | Condition Difference |
|---|---|---|---|---|---|---|---|---|
| Thaps_hclust_0074 |
 |
 |
77 |
130 |
300 |
lowN_TMEVA | 0.721000 | -0.158 |
| Title | Cluster Plot | Dendrogram | e-value | e-value | e-value | Condition | Condition FDR | Condition Difference |
|---|---|---|---|---|---|---|---|---|
| Thaps_hclust_0457 |
 |
 |
0.0000081 |
0.1 |
0.53 |
lowN_TMEVA | 0.524000 | -0.252 |
| Title | Cluster Plot | Dendrogram | e-value | e-value | e-value | Condition | Condition FDR | Condition Difference |
|---|---|---|---|---|---|---|---|---|
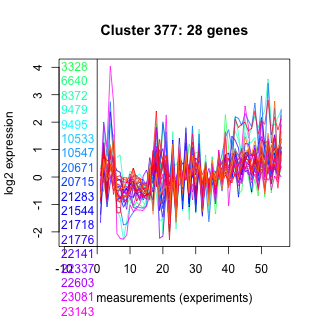
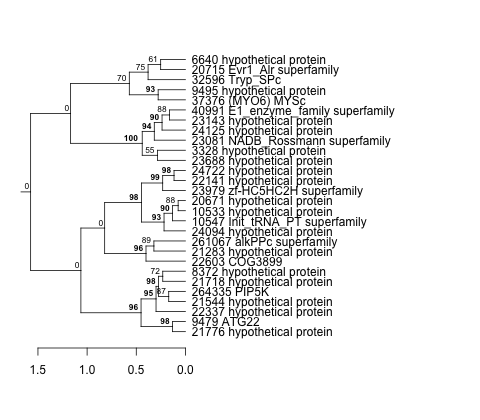
| Thaps_hclust_0398 |
 |
 |
0.014 |
0.28 |
1.2 |
lowN_TMEVA | 0.001190 | 1.25 |
| Title | Cluster Plot | Dendrogram | e-value | e-value | e-value | Condition | Condition FDR | Condition Difference |
|---|---|---|---|---|---|---|---|---|
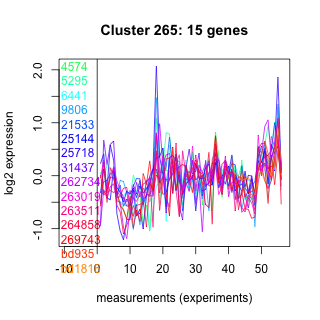
| Thaps_hclust_0265 |
 |
 |
0.02 |
0.000051 |
27 |
lowN_TMEVA | 0.594000 | -0.213 |
| Title | Cluster Plot | Dendrogram | e-value | e-value | e-value | Condition | Condition FDR | Condition Difference |
|---|---|---|---|---|---|---|---|---|
| Thaps_hclust_0214 |
 |
 |
0.00006 |
0.0000000031 |
0.00076 |
lowN_TMEVA | 0.330000 | -0.252 |
| Title | Cluster Plot | Dendrogram | e-value | e-value | e-value | Condition | Condition FDR | Condition Difference |
|---|---|---|---|---|---|---|---|---|
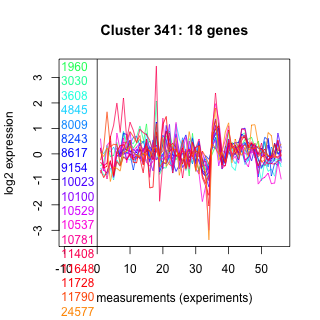
| Thaps_hclust_0341 |
 |
 |
74 |
110 |
130 |
lowN_TMEVA | 0.761000 | -0.12 |
| Title | Cluster Plot | Dendrogram | e-value | e-value | e-value | Condition | Condition FDR | Condition Difference |
|---|---|---|---|---|---|---|---|---|
| Thaps_hclust_0282 |
 |
 |
0.0005 |
0.0059 |
0.15 |
lowN_TMEVA | 0.359000 | 0.303 |
| Title | Cluster Plot | Dendrogram | e-value | e-value | e-value | Condition | Condition FDR | Condition Difference |
|---|---|---|---|---|---|---|---|---|
| Thaps_hclust_0013 |
 |
 |
0.000000021 |
0.00018 |
0.025 |
lowN_TMEVA | 0.053900 | -0.505 |
| Title | Cluster Plot | Dendrogram | e-value | e-value | e-value | Condition | Condition FDR | Condition Difference |
|---|---|---|---|---|---|---|---|---|
| Thaps_hclust_0226 |
 |
 |
0.000000041 |
0.95 |
4.6 |
lowN_TMEVA | 0.345000 | 0.305 |
| Title | Cluster Plot | Dendrogram | e-value | e-value | e-value | Condition | Condition FDR | Condition Difference |
|---|---|---|---|---|---|---|---|---|
| Thaps_hclust_0302 |
 |
 |
0.000000015 |
0.00000024 |
0.00000000039 |
lowN_TMEVA | 0.789000 | 0.0956 |
| Title | Cluster Plot | Dendrogram | e-value | e-value | e-value | Condition | Condition FDR | Condition Difference |
|---|---|---|---|---|---|---|---|---|
| Thaps_hclust_0044 |
 |
 |
0.27 |
2.6 |
4.2 |
lowN_TMEVA | 0.090400 | -0.689 |
| Title | Cluster Plot | Dendrogram | e-value | e-value | e-value | Condition | Condition FDR | Condition Difference |
|---|---|---|---|---|---|---|---|---|
| Thaps_hclust_0475 |
 |
 |
0.011 |
0.95 |
0.77 |
lowN_TMEVA | 0.614000 | 0.187 |
| Title | Cluster Plot | Dendrogram | e-value | e-value | e-value | Condition | Condition FDR | Condition Difference |
|---|---|---|---|---|---|---|---|---|
| Thaps_hclust_0164 |
 |
 |
13 |
58 |
65 |
lowN_TMEVA | 0.219000 | -0.509 |
| Title | Cluster Plot | Dendrogram | e-value | e-value | e-value | Condition | Condition FDR | Condition Difference |
|---|---|---|---|---|---|---|---|---|
| Thaps_hclust_0495 |
 |
 |
0.0000000031 |
0.00000049 |
0.0000038 |
lowN_TMEVA | 0.008330 | -1.69 |
| Title | Cluster Plot | Dendrogram | e-value | e-value | e-value | Condition | Condition FDR | Condition Difference |
|---|---|---|---|---|---|---|---|---|
| Thaps_hclust_0436 |
 |
 |
0.067 |
0.93 |
0.55 |
lowN_TMEVA | 0.861000 | -0.0707 |
| Title | Cluster Plot | Dendrogram | e-value | e-value | e-value | Condition | Condition FDR | Condition Difference |
|---|---|---|---|---|---|---|---|---|
| Thaps_hclust_0033 |
 |
 |
0.000000000000011 |
0.0012 |
0.0073 |
lowN_TMEVA | 0.001190 | -0.738 |
| Title | Cluster Plot | Dendrogram | e-value | e-value | e-value | Condition | Condition FDR | Condition Difference |
|---|---|---|---|---|---|---|---|---|
| Thaps_hclust_0377 |
 |
 |
0.00016 |
0.034 |
0.95 |
lowN_TMEVA | 0.921000 | -0.0329 |
| Title | Cluster Plot | Dendrogram | e-value | e-value | e-value | Condition | Condition FDR | Condition Difference |
|---|---|---|---|---|---|---|---|---|
| Thaps_hclust_0073 |
 |
 |
0.013 |
0.043 |
210 |
lowN_TMEVA | 0.038000 | -0.701 |
| Title | Cluster Plot | Dendrogram | e-value | e-value | e-value | Condition | Condition FDR | Condition Difference |
|---|---|---|---|---|---|---|---|---|
| Thaps_hclust_0456 |
 |
 |
0.0000000043 |
0.047 |
6.5 |
lowN_TMEVA | 0.789000 | -0.101 |
| Title | Cluster Plot | Dendrogram | e-value | e-value | e-value | Condition | Condition FDR | Condition Difference |
|---|---|---|---|---|---|---|---|---|
| Thaps_hclust_0397 |
 |
 |
0.00003 |
0.00016 |
0.0062 |
lowN_TMEVA | 0.880000 | 0.0494 |
| Title | Cluster Plot | Dendrogram | e-value | e-value | e-value | Condition | Condition FDR | Condition Difference |
|---|---|---|---|---|---|---|---|---|
| Thaps_hclust_0476 |
 |
 |
0.0015 |
0.56 |
2.4 |
lowN_TMEVA | 0.440000 | -0.261 |
| Title | Cluster Plot | Dendrogram | e-value | e-value | e-value | Condition | Condition FDR | Condition Difference |
|---|---|---|---|---|---|---|---|---|
| Thaps_hclust_0056 |
 |
 |
0.0000000078 |
0.077 |
1 |
lowN_TMEVA | 0.505000 | 0.242 |
| Title | Cluster Plot | Dendrogram | e-value | e-value | e-value | Condition | Condition FDR | Condition Difference |
|---|---|---|---|---|---|---|---|---|
| Thaps_hclust_0146 |
 |
 |
0.00000000081 |
0.000016 |
0.0025 |
lowN_TMEVA | 0.130000 | 0.424 |
| Title | Cluster Plot | Dendrogram | e-value | e-value | e-value | Condition | Condition FDR | Condition Difference |
|---|---|---|---|---|---|---|---|---|
| Thaps_hclust_0417 |
 |
 |
0.0000000018 |
0.00013 |
0.00029 |
lowN_TMEVA | 0.001190 | 1.91 |
| Title | Cluster Plot | Dendrogram | e-value | e-value | e-value | Condition | Condition FDR | Condition Difference |
|---|---|---|---|---|---|---|---|---|
| Thaps_hclust_0118 |
 |
 |
0.0037 |
1.2 |
1.4 |
lowN_TMEVA | 0.761000 | -0.125 |
| Title | Cluster Plot | Dendrogram | e-value | e-value | e-value | Condition | Condition FDR | Condition Difference |
|---|---|---|---|---|---|---|---|---|
| Thaps_hclust_0213 |
 |
 |
0.0000045 |
0.075 |
0.54 |
lowN_TMEVA | 0.861000 | -0.0585 |
| Title | Cluster Plot | Dendrogram | e-value | e-value | e-value | Condition | Condition FDR | Condition Difference |
|---|---|---|---|---|---|---|---|---|
| Thaps_hclust_0358 |
 |
 |
0.18 |
390 |
1700 |
lowN_TMEVA | 0.666000 | -0.171 |
| Title | Cluster Plot | Dendrogram | e-value | e-value | e-value | Condition | Condition FDR | Condition Difference |
|---|---|---|---|---|---|---|---|---|
| Thaps_hclust_0165 |
 |
 |
0.00011 |
2.3 |
3.9 |
lowN_TMEVA | 0.564000 | -0.227 |
| Title | Cluster Plot | Dendrogram | e-value | e-value | e-value | Condition | Condition FDR | Condition Difference |
|---|---|---|---|---|---|---|---|---|
| Thaps_hclust_0010 |
 |
 |
0.0000000000019 |
0.000000000035 |
0.013 |
lowN_TMEVA | 0.001190 | -2.76 |
| Title | Cluster Plot | Dendrogram | e-value | e-value | e-value | Condition | Condition FDR | Condition Difference |
|---|---|---|---|---|---|---|---|---|
| Thaps_hclust_0091 |
 |
 |
0.00000061 |
0.00022 |
0.44 |
lowN_TMEVA | 0.349000 | -0.33 |
| Title | Cluster Plot | Dendrogram | e-value | e-value | e-value | Condition | Condition FDR | Condition Difference |
|---|---|---|---|---|---|---|---|---|
| Thaps_hclust_0378 |
 |
 |
0.0003 |
210 |
10 |
lowN_TMEVA | 0.695000 | 0.176 |
| Title | Cluster Plot | Dendrogram | e-value | e-value | e-value | Condition | Condition FDR | Condition Difference |
|---|---|---|---|---|---|---|---|---|
| Thaps_hclust_0245 |
 |
 |
0.52 |
100 |
150 |
lowN_TMEVA | 0.339000 | -0.403 |
| Title | Cluster Plot | Dendrogram | e-value | e-value | e-value | Condition | Condition FDR | Condition Difference |
|---|---|---|---|---|---|---|---|---|
| Thaps_hclust_0194 |
 |
 |
0.27 |
0.6 |
1.5 |
lowN_TMEVA | 0.542000 | -0.226 |
| Title | Cluster Plot | Dendrogram | e-value | e-value | e-value | Condition | Condition FDR | Condition Difference |
|---|---|---|---|---|---|---|---|---|
| Thaps_hclust_0321 |
 |
 |
0.000000086 |
0.0000000042 |
0.0000028 |
lowN_TMEVA | 0.209000 | 0.352 |
| Title | Cluster Plot | Dendrogram | e-value | e-value | e-value | Condition | Condition FDR | Condition Difference |
|---|---|---|---|---|---|---|---|---|
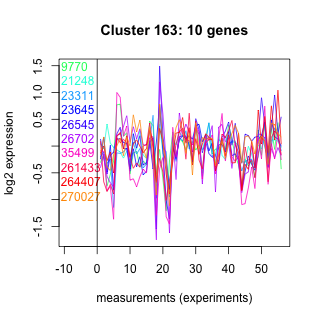
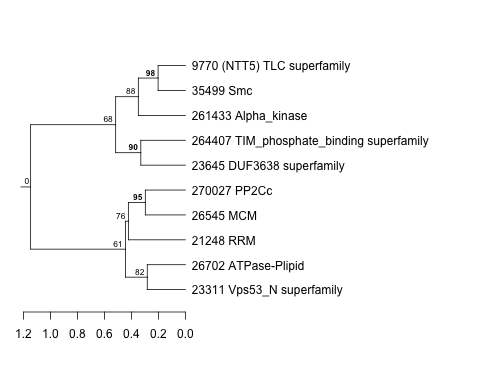
| Thaps_hclust_0163 |
 |
 |
2.5 |
63 |
210 |
lowN_TMEVA | 0.293000 | -0.458 |
| Title | Cluster Plot | Dendrogram | e-value | e-value | e-value | Condition | Condition FDR | Condition Difference |
|---|---|---|---|---|---|---|---|---|
| Thaps_hclust_0494 |
 |
 |
6.7 |
15 |
60 |
lowN_TMEVA | 0.842000 | 0.08 |
| Title | Cluster Plot | Dendrogram | e-value | e-value | e-value | Condition | Condition FDR | Condition Difference |
|---|---|---|---|---|---|---|---|---|
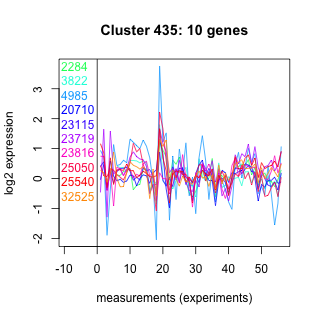
| Thaps_hclust_0435 |
 |
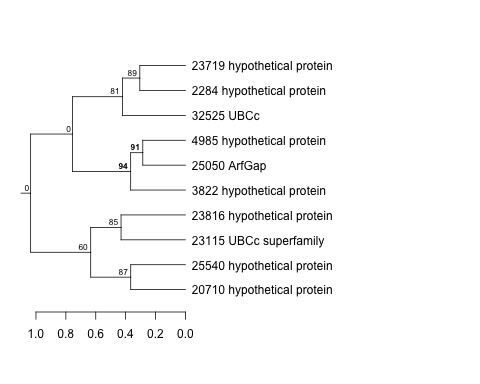 |
0.17 |
0.24 |
1.5 |
lowN_TMEVA | 0.182000 | -0.587 |
| Title | Cluster Plot | Dendrogram | e-value | e-value | e-value | Condition | Condition FDR | Condition Difference |
|---|---|---|---|---|---|---|---|---|
| Thaps_hclust_0032 |
 |
 |
1.3e-16 |
0.00000035 |
0.00012 |
lowN_TMEVA | 0.023100 | -0.585 |
| Title | Cluster Plot | Dendrogram | e-value | e-value | e-value | Condition | Condition FDR | Condition Difference |
|---|---|---|---|---|---|---|---|---|
| Thaps_hclust_0376 |
 |
 |
0.42 |
3.3 |
2.4 |
lowN_TMEVA | 0.093300 | -0.756 |
| Title | Cluster Plot | Dendrogram | e-value | e-value | e-value | Condition | Condition FDR | Condition Difference |
|---|---|---|---|---|---|---|---|---|
| Thaps_hclust_0072 |
 |
 |
1.2e-22 |
1.1e-16 |
0.000000000000011 |
lowN_TMEVA | 0.120000 | 0.766 |