Hierarchical Clusters
Displaying 1201 - 1300 of 7500
| Title | Cluster Plot | Dendrogram | e-value | e-value | e-value | Condition | Condition FDR | Condition Difference |
|---|---|---|---|---|---|---|---|---|
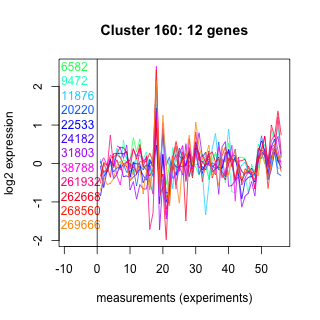
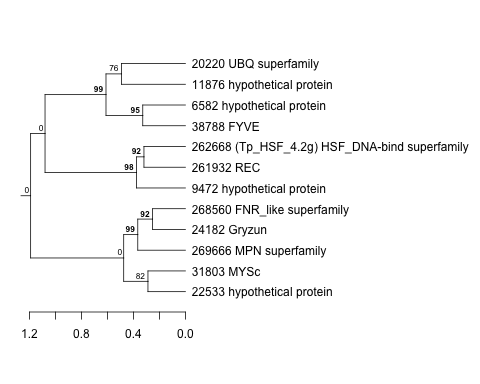
| Thaps_hclust_0162 |
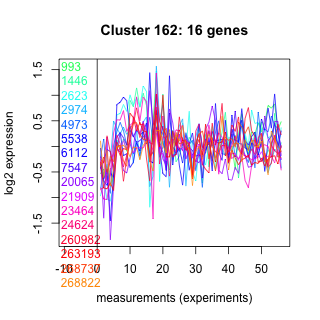 |
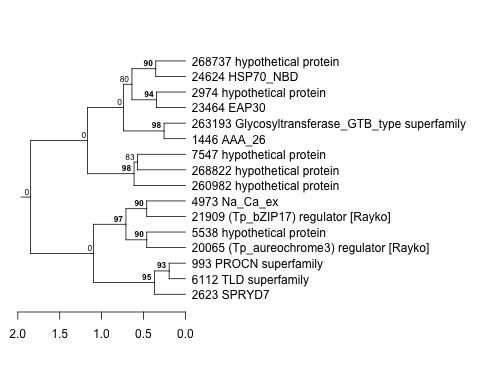 |
0.032 |
3.2 |
58 |
co2_elevated_stat_arrays | 0.831000 | -0.0639 |
| Title | Cluster Plot | Dendrogram | e-value | e-value | e-value | Condition | Condition FDR | Condition Difference |
|---|---|---|---|---|---|---|---|---|
| Thaps_hclust_0103 |
 |
 |
3.4 |
4.8 |
21 |
co2_elevated_stat_arrays | 0.229000 | -0.309 |
| Title | Cluster Plot | Dendrogram | e-value | e-value | e-value | Condition | Condition FDR | Condition Difference |
|---|---|---|---|---|---|---|---|---|
| Thaps_hclust_0044 |
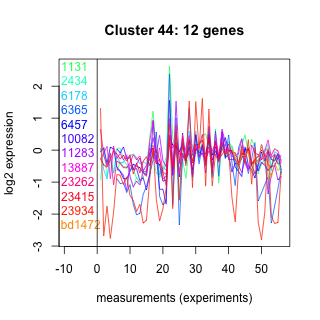 |
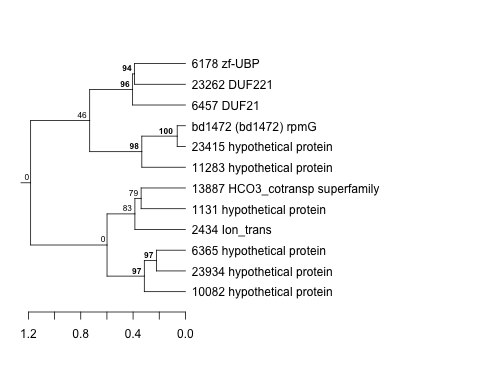 |
0.27 |
2.6 |
4.2 |
co2_elevated_stat_arrays | 0.694000 | 0.122 |
| Title | Cluster Plot | Dendrogram | e-value | e-value | e-value | Condition | Condition FDR | Condition Difference |
|---|---|---|---|---|---|---|---|---|
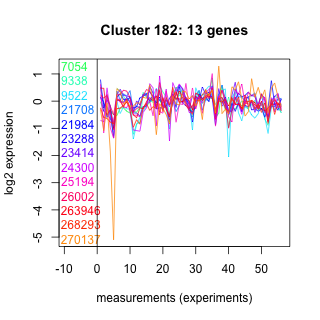
| Thaps_hclust_0182 |
 |
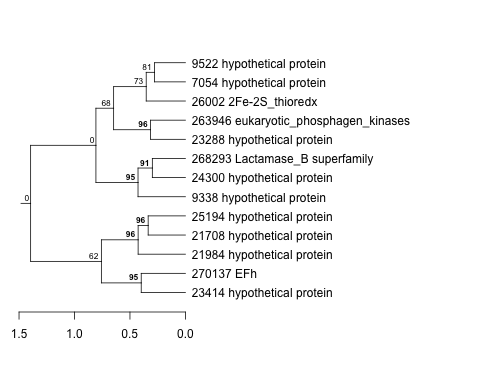 |
0.13 |
130 |
0.14 |
co2_elevated_stat_arrays | 0.315000 | -0.264 |
| Title | Cluster Plot | Dendrogram | e-value | e-value | e-value | Condition | Condition FDR | Condition Difference |
|---|---|---|---|---|---|---|---|---|
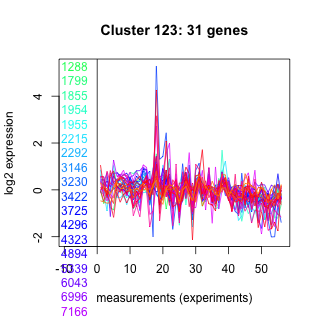
| Thaps_hclust_0123 |
 |
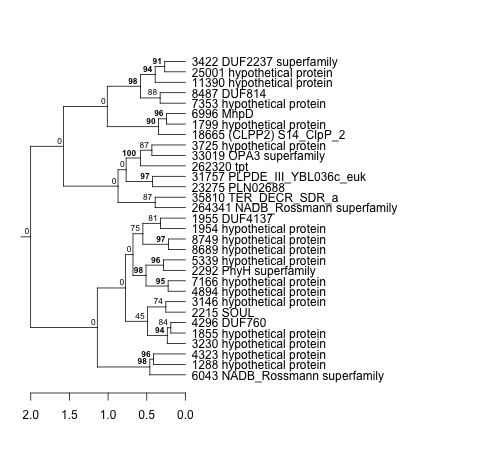 |
0.000073 |
0.05 |
0.076 |
co2_elevated_stat_arrays | 0.774000 | -0.0782 |
| Title | Cluster Plot | Dendrogram | e-value | e-value | e-value | Condition | Condition FDR | Condition Difference |
|---|---|---|---|---|---|---|---|---|
| Thaps_hclust_0064 |
 |
 |
0.000000012 |
0.00000073 |
0.0000002 |
co2_elevated_stat_arrays | 0.665000 | 0.124 |
| Title | Cluster Plot | Dendrogram | e-value | e-value | e-value | Condition | Condition FDR | Condition Difference |
|---|---|---|---|---|---|---|---|---|
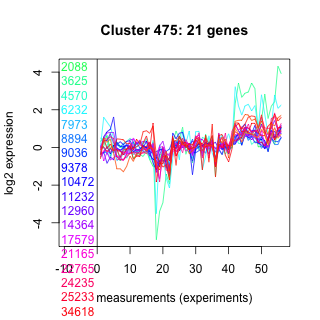
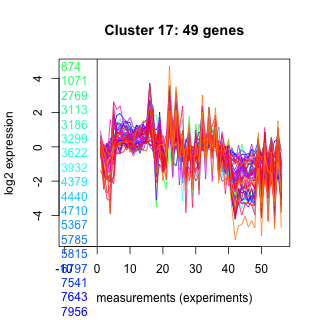
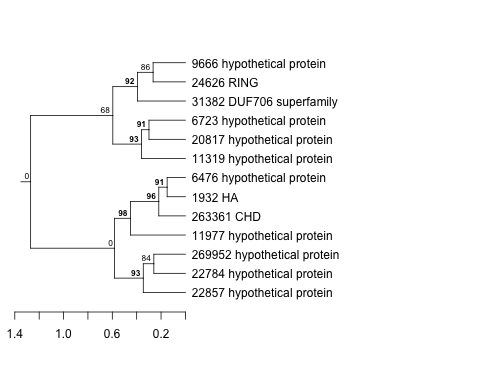
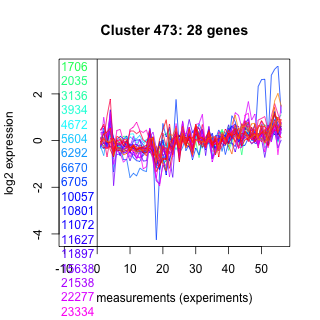
| Thaps_hclust_0475 |
 |
 |
0.011 |
0.95 |
0.77 |
co2_elevated_stat_arrays | 0.707000 | -0.1 |
| Title | Cluster Plot | Dendrogram | e-value | e-value | e-value | Condition | Condition FDR | Condition Difference |
|---|---|---|---|---|---|---|---|---|
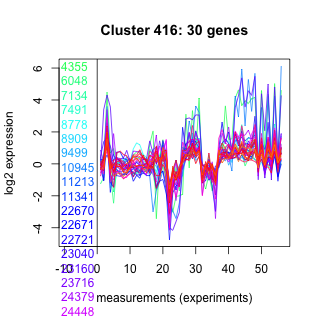
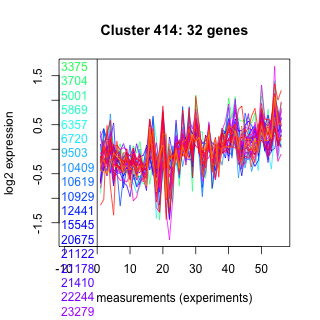
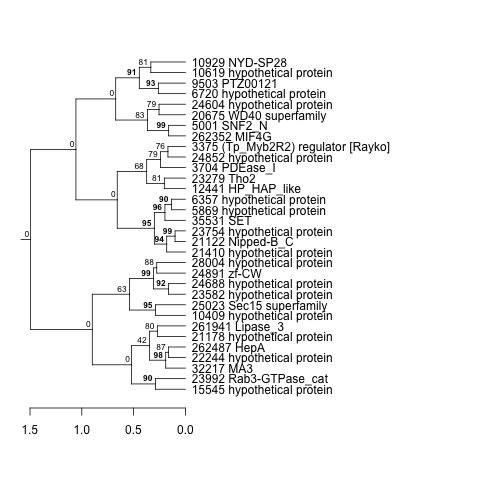
| Thaps_hclust_0416 |
 |
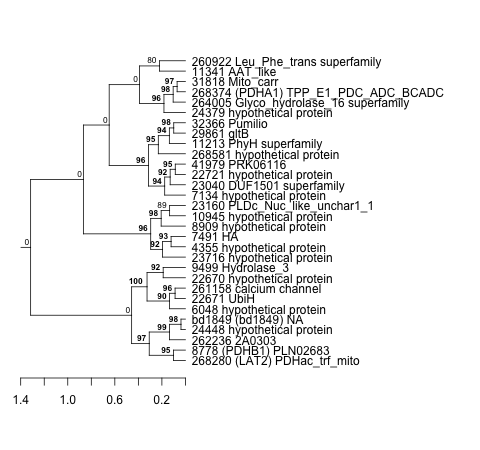 |
0.00000015 |
0.00000035 |
0.7 |
co2_elevated_stat_arrays | 0.801000 | 0.0707 |
| Title | Cluster Plot | Dendrogram | e-value | e-value | e-value | Condition | Condition FDR | Condition Difference |
|---|---|---|---|---|---|---|---|---|
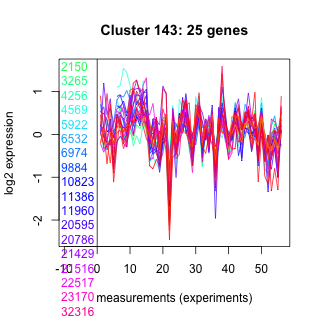
| Thaps_hclust_0143 |
 |
 |
0.018 |
0.041 |
0.67 |
co2_elevated_stat_arrays | 0.146000 | -0.307 |
| Title | Cluster Plot | Dendrogram | e-value | e-value | e-value | Condition | Condition FDR | Condition Difference |
|---|---|---|---|---|---|---|---|---|
| Thaps_hclust_0084 |
 |
 |
0.0000000000035 |
0.00000025 |
0.12 |
co2_elevated_stat_arrays | 0.599000 | 0.132 |
| Title | Cluster Plot | Dendrogram | e-value | e-value | e-value | Condition | Condition FDR | Condition Difference |
|---|---|---|---|---|---|---|---|---|
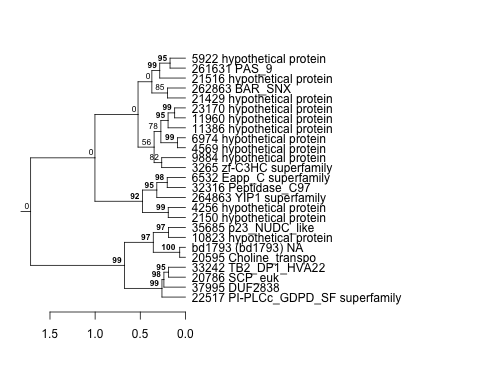
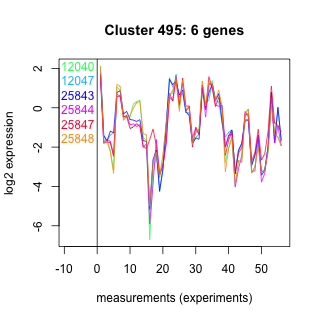
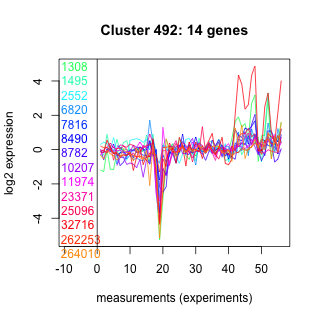
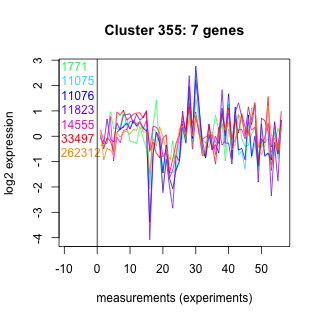
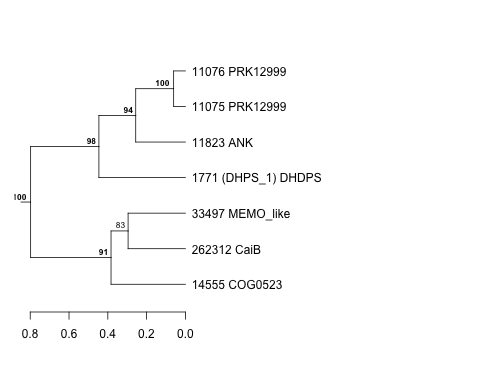
| Thaps_hclust_0495 |
 |
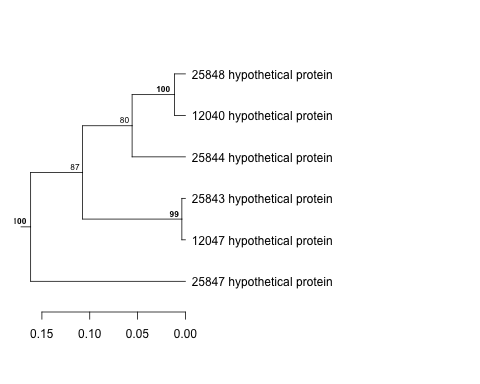 |
0.0000000031 |
0.00000049 |
0.0000038 |
co2_elevated_stat_arrays | 0.954000 | 0.02 |
| Title | Cluster Plot | Dendrogram | e-value | e-value | e-value | Condition | Condition FDR | Condition Difference |
|---|---|---|---|---|---|---|---|---|
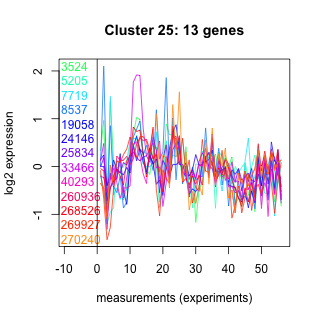
| Thaps_hclust_0025 |
 |
 |
0.14 |
0.45 |
4.6 |
co2_elevated_stat_arrays | 0.993000 | -0.00271 |
| Title | Cluster Plot | Dendrogram | e-value | e-value | e-value | Condition | Condition FDR | Condition Difference |
|---|---|---|---|---|---|---|---|---|
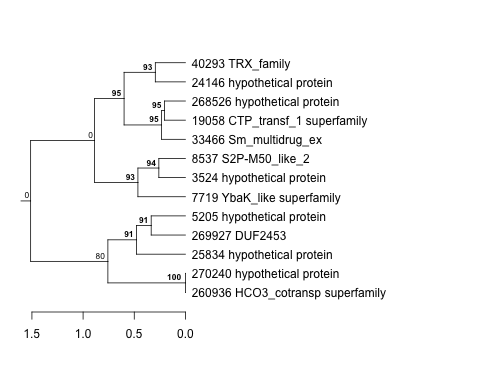
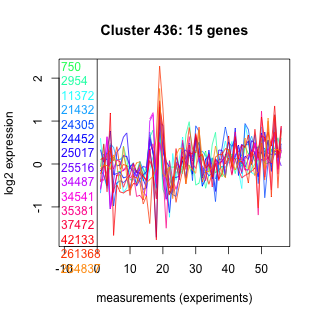
| Thaps_hclust_0436 |
 |
 |
0.067 |
0.93 |
0.55 |
co2_elevated_stat_arrays | 0.557000 | -0.158 |
| Title | Cluster Plot | Dendrogram | e-value | e-value | e-value | Condition | Condition FDR | Condition Difference |
|---|---|---|---|---|---|---|---|---|
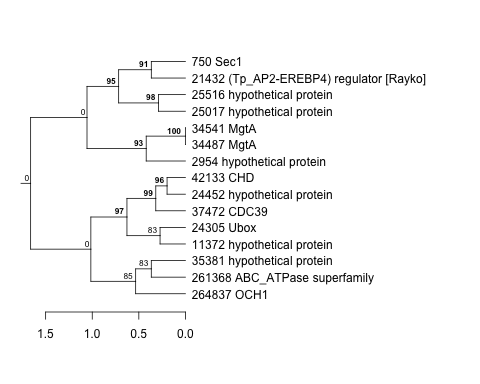
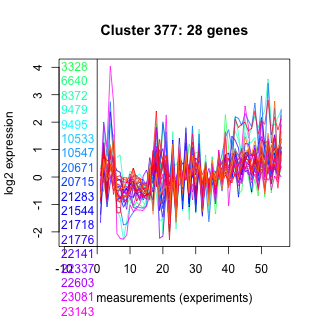
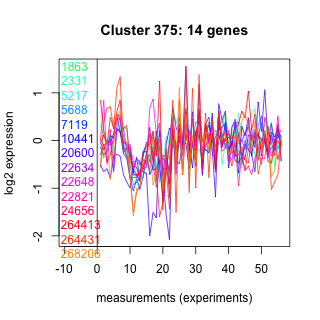
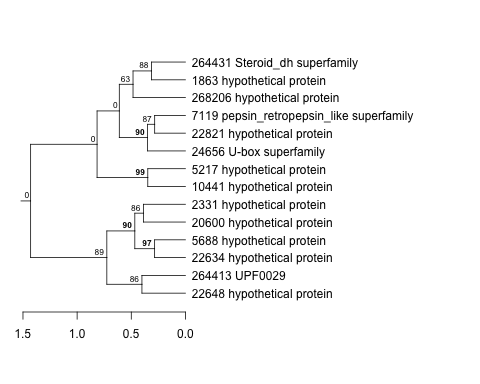
| Thaps_hclust_0377 |
 |
 |
0.00016 |
0.034 |
0.95 |
co2_elevated_stat_arrays | 0.876000 | -0.0448 |
| Title | Cluster Plot | Dendrogram | e-value | e-value | e-value | Condition | Condition FDR | Condition Difference |
|---|---|---|---|---|---|---|---|---|
| Thaps_hclust_0045 |
 |
 |
0.0000000028 |
0.0075 |
5.4 |
co2_elevated_stat_arrays | 0.732000 | -0.0947 |
| Title | Cluster Plot | Dendrogram | e-value | e-value | e-value | Condition | Condition FDR | Condition Difference |
|---|---|---|---|---|---|---|---|---|
| Thaps_hclust_0022 |
 |
|
1.9e-31 |
2.4e-22 |
6.4e-20 |
co2_elevated_stat_arrays | 0.392000 | 0.164 |
| Title | Cluster Plot | Dendrogram | e-value | e-value | e-value | Condition | Condition FDR | Condition Difference |
|---|---|---|---|---|---|---|---|---|
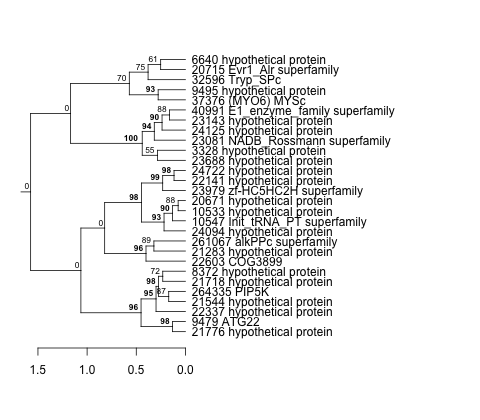
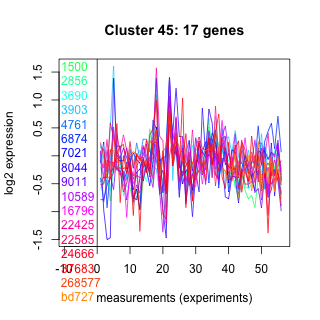
| Thaps_hclust_0456 |
 |
 |
0.0000000043 |
0.047 |
6.5 |
co2_elevated_stat_arrays | 0.695000 | 0.106 |
| Title | Cluster Plot | Dendrogram | e-value | e-value | e-value | Condition | Condition FDR | Condition Difference |
|---|---|---|---|---|---|---|---|---|
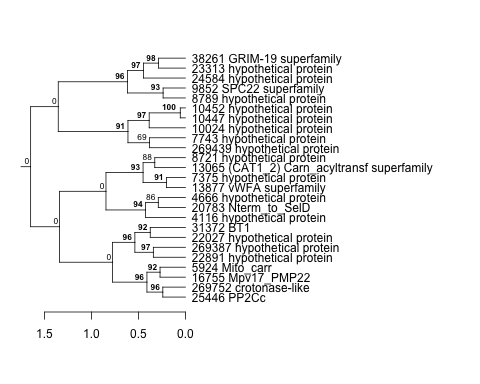
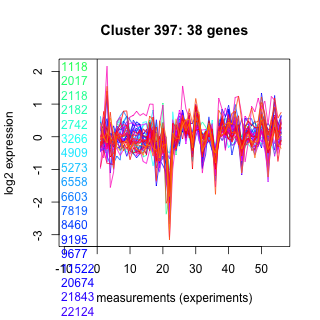
| Thaps_hclust_0397 |
 |
 |
0.00003 |
0.00016 |
0.0062 |
co2_elevated_stat_arrays | 0.000658 | -0.522 |
| Title | Cluster Plot | Dendrogram | e-value | e-value | e-value | Condition | Condition FDR | Condition Difference |
|---|---|---|---|---|---|---|---|---|
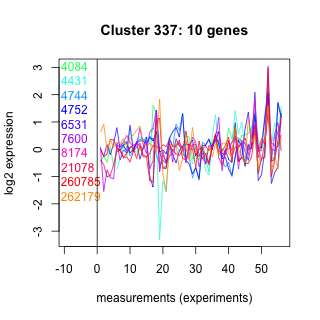
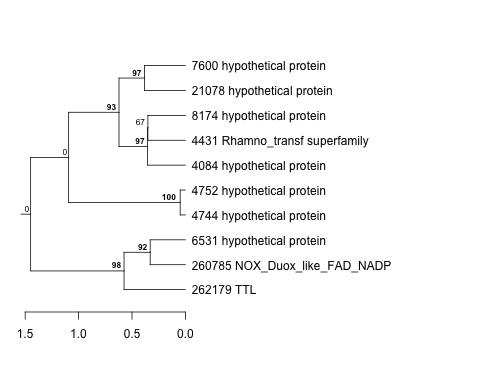
| Thaps_hclust_0338 |
 |
 |
0.0000012 |
0.0000014 |
0.000012 |
co2_elevated_stat_arrays | 0.543000 | 0.143 |
| Title | Cluster Plot | Dendrogram | e-value | e-value | e-value | Condition | Condition FDR | Condition Difference |
|---|---|---|---|---|---|---|---|---|
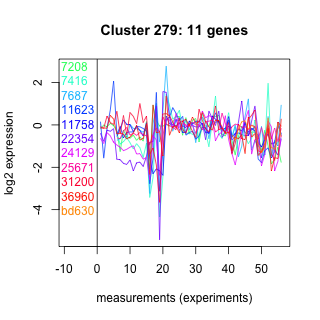
| Thaps_hclust_0279 |
 |
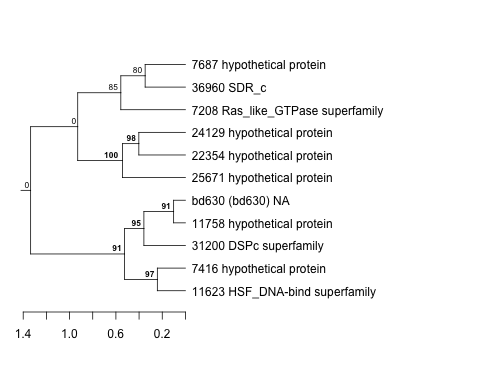 |
2.7 |
22 |
38 |
co2_elevated_stat_arrays | 0.028700 | 0.6 |
| Title | Cluster Plot | Dendrogram | e-value | e-value | e-value | Condition | Condition FDR | Condition Difference |
|---|---|---|---|---|---|---|---|---|
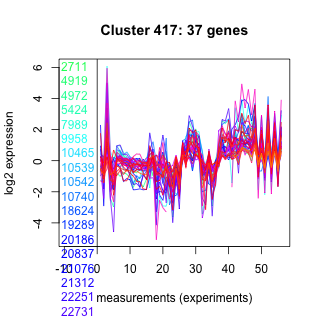
| Thaps_hclust_0417 |
 |
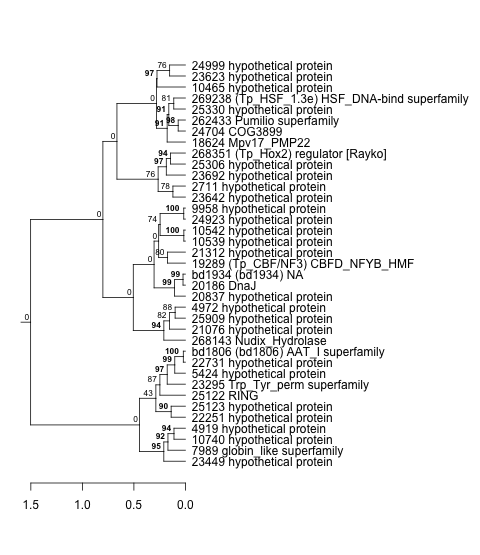 |
0.0000000018 |
0.00013 |
0.00029 |
co2_elevated_stat_arrays | 0.004850 | 0.43 |
| Title | Cluster Plot | Dendrogram | e-value | e-value | e-value | Condition | Condition FDR | Condition Difference |
|---|---|---|---|---|---|---|---|---|
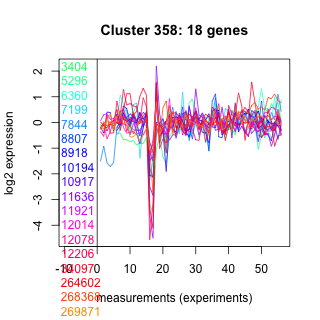
| Thaps_hclust_0358 |
 |
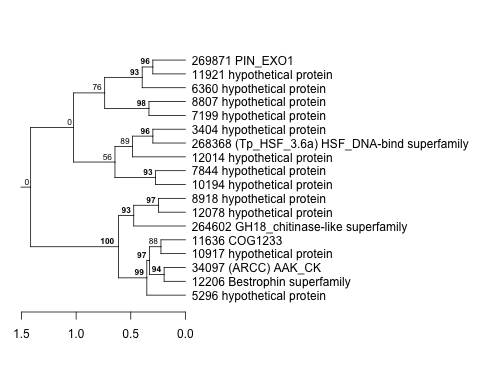 |
0.18 |
390 |
1700 |
co2_elevated_stat_arrays | 0.937000 | 0.0253 |
| Title | Cluster Plot | Dendrogram | e-value | e-value | e-value | Condition | Condition FDR | Condition Difference |
|---|---|---|---|---|---|---|---|---|
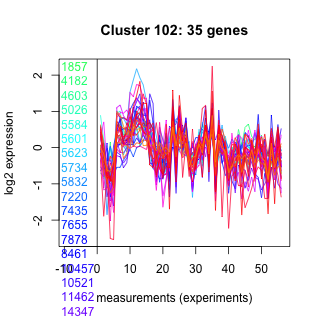
| Thaps_hclust_0102 |
 |
 |
3.2e-16 |
0.00000000002 |
0.0000006 |
co2_elevated_stat_arrays | 0.410000 | -0.178 |
| Title | Cluster Plot | Dendrogram | e-value | e-value | e-value | Condition | Condition FDR | Condition Difference |
|---|---|---|---|---|---|---|---|---|
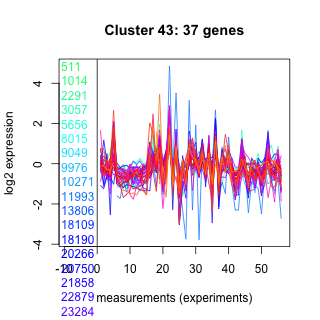
| Thaps_hclust_0043 |
 |
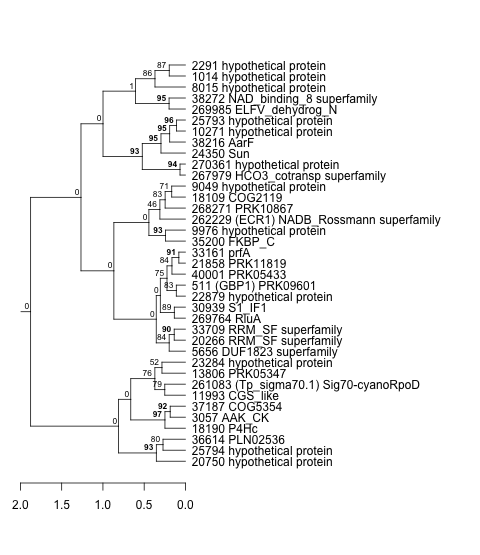 |
3.9e-18 |
0.0000000053 |
2 |
co2_elevated_stat_arrays | 0.000658 | 0.548 |
| Title | Cluster Plot | Dendrogram | e-value | e-value | e-value | Condition | Condition FDR | Condition Difference |
|---|---|---|---|---|---|---|---|---|
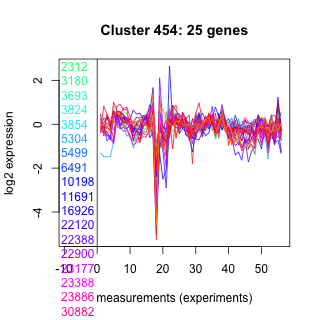
| Thaps_hclust_0454 |
 |
 |
0.0000012 |
0.00054 |
0.21 |
co2_elevated_stat_arrays | 0.534000 | -0.15 |
| Title | Cluster Plot | Dendrogram | e-value | e-value | e-value | Condition | Condition FDR | Condition Difference |
|---|---|---|---|---|---|---|---|---|
| Thaps_hclust_0122 |
 |
 |
0.0000037 |
0.061 |
0.0018 |
co2_elevated_stat_arrays | 0.178000 | -0.273 |
| Title | Cluster Plot | Dendrogram | e-value | e-value | e-value | Condition | Condition FDR | Condition Difference |
|---|---|---|---|---|---|---|---|---|
| Thaps_hclust_0063 |
 |
 |
9.8e-19 |
5.7e-17 |
8.2e-17 |
co2_elevated_stat_arrays | 0.000658 | 0.831 |
| Title | Cluster Plot | Dendrogram | e-value | e-value | e-value | Condition | Condition FDR | Condition Difference |
|---|---|---|---|---|---|---|---|---|
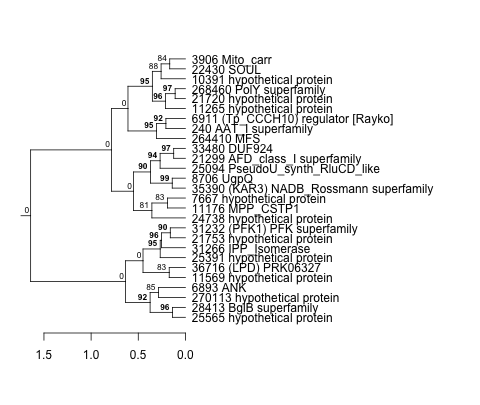
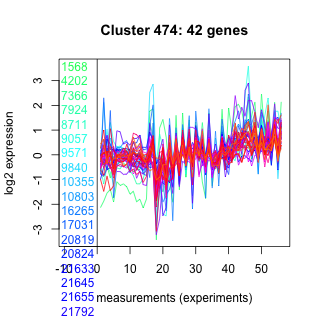
| Thaps_hclust_0474 |
 |
 |
0.0078 |
0.000018 |
0.003 |
co2_elevated_stat_arrays | 0.503000 | -0.147 |
| Title | Cluster Plot | Dendrogram | e-value | e-value | e-value | Condition | Condition FDR | Condition Difference |
|---|---|---|---|---|---|---|---|---|
| Thaps_hclust_0415 |
 |
 |
0.0000000000041 |
0.000000046 |
0.000024 |
co2_elevated_stat_arrays | 0.166000 | -0.245 |
| Title | Cluster Plot | Dendrogram | e-value | e-value | e-value | Condition | Condition FDR | Condition Difference |
|---|---|---|---|---|---|---|---|---|
| Thaps_hclust_0083 |
 |
 |
0.0039 |
6.3 |
14 |
co2_elevated_stat_arrays | 0.361000 | -0.226 |
| Title | Cluster Plot | Dendrogram | e-value | e-value | e-value | Condition | Condition FDR | Condition Difference |
|---|---|---|---|---|---|---|---|---|
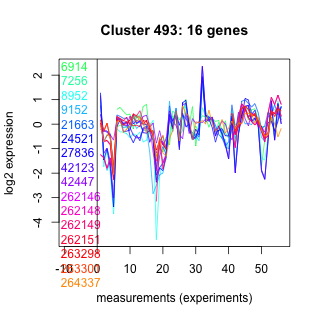
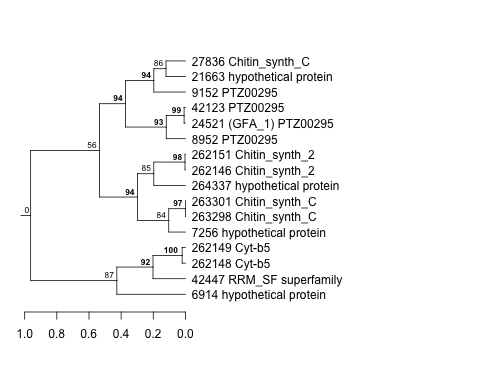
| Thaps_hclust_0494 |
 |
 |
6.7 |
15 |
60 |
co2_elevated_stat_arrays | 0.346000 | 0.222 |
| Title | Cluster Plot | Dendrogram | e-value | e-value | e-value | Condition | Condition FDR | Condition Difference |
|---|---|---|---|---|---|---|---|---|
| Thaps_hclust_0024 |
 |
|
2.8e-19 |
1.2e-20 |
0.00000000000043 |
co2_elevated_stat_arrays | 0.002130 | 0.376 |
| Title | Cluster Plot | Dendrogram | e-value | e-value | e-value | Condition | Condition FDR | Condition Difference |
|---|---|---|---|---|---|---|---|---|
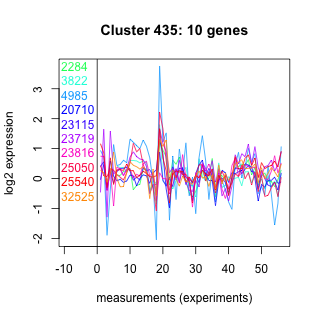
| Thaps_hclust_0435 |
 |
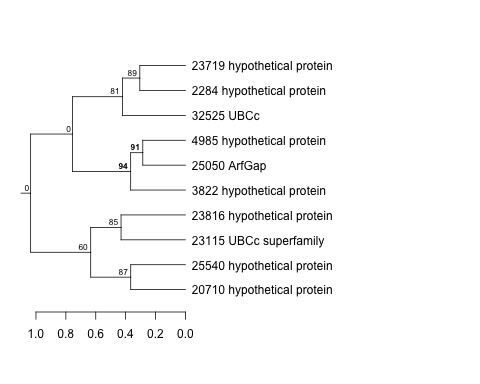 |
0.17 |
0.24 |
1.5 |
co2_elevated_stat_arrays | 0.892000 | 0.0437 |
| Title | Cluster Plot | Dendrogram | e-value | e-value | e-value | Condition | Condition FDR | Condition Difference |
|---|---|---|---|---|---|---|---|---|
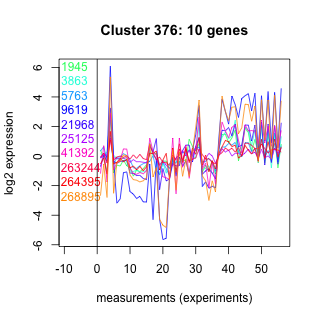
| Thaps_hclust_0376 |
 |
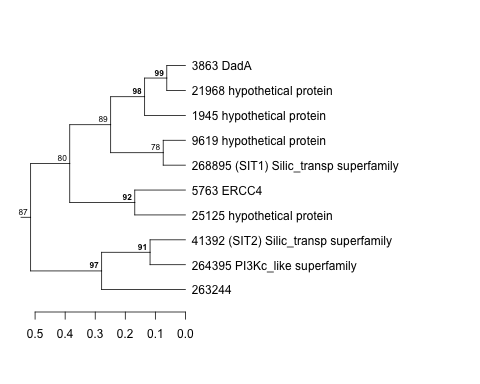 |
0.42 |
3.3 |
2.4 |
co2_elevated_stat_arrays | 0.169000 | -0.388 |
| Title | Cluster Plot | Dendrogram | e-value | e-value | e-value | Condition | Condition FDR | Condition Difference |
|---|---|---|---|---|---|---|---|---|
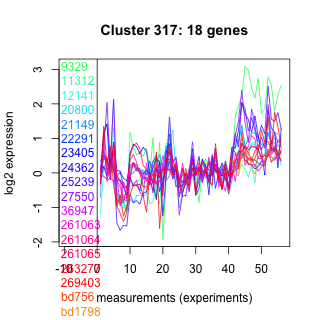
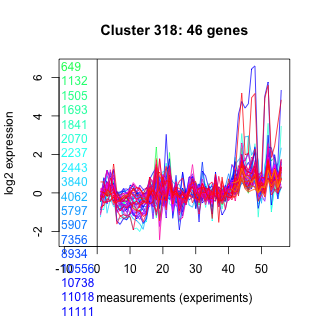
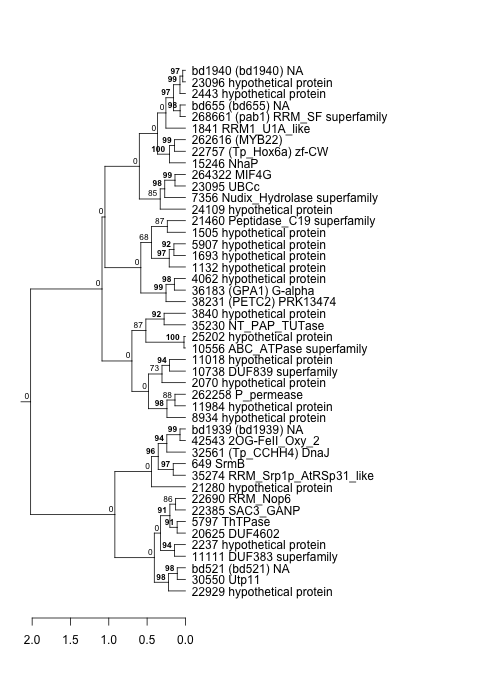
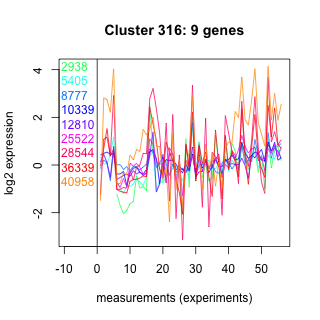
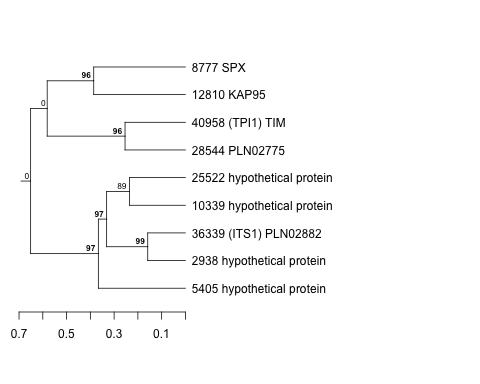
| Thaps_hclust_0317 |
 |
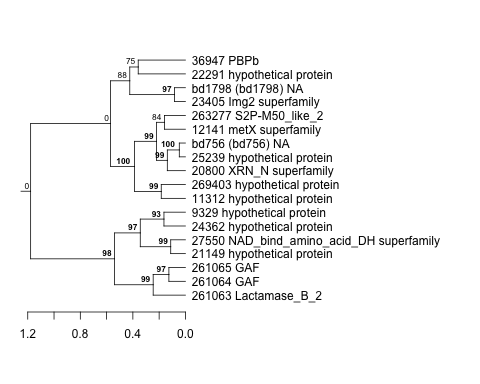 |
0.000000000082 |
0.00000001 |
0.00000042 |
co2_elevated_stat_arrays | 0.299000 | 0.252 |
| Title | Cluster Plot | Dendrogram | e-value | e-value | e-value | Condition | Condition FDR | Condition Difference |
|---|---|---|---|---|---|---|---|---|
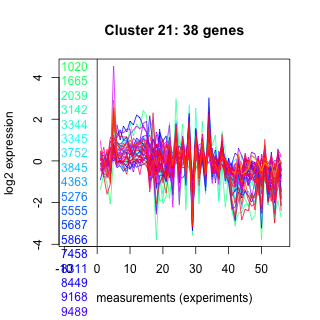
| Thaps_hclust_0021 |
 |
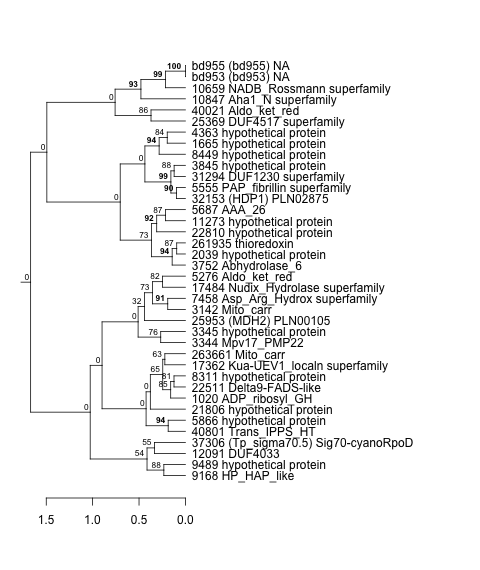 |
0.00000000002 |
0.0000088 |
0.0012 |
co2_elevated_stat_arrays | 0.735000 | 0.0884 |
| Title | Cluster Plot | Dendrogram | e-value | e-value | e-value | Condition | Condition FDR | Condition Difference |
|---|---|---|---|---|---|---|---|---|
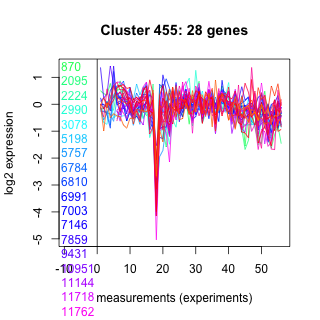
| Thaps_hclust_0455 |
 |
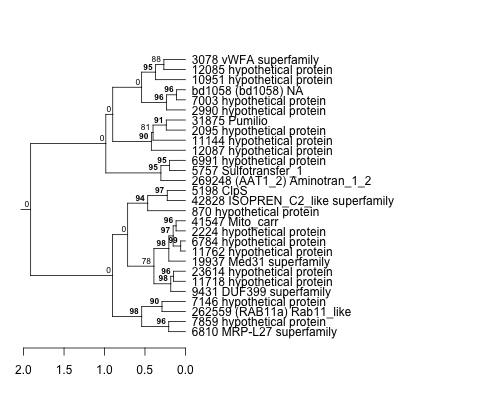 |
0.00038 |
0.18 |
0.01 |
co2_elevated_stat_arrays | 0.398000 | -0.187 |
| Title | Cluster Plot | Dendrogram | e-value | e-value | e-value | Condition | Condition FDR | Condition Difference |
|---|---|---|---|---|---|---|---|---|
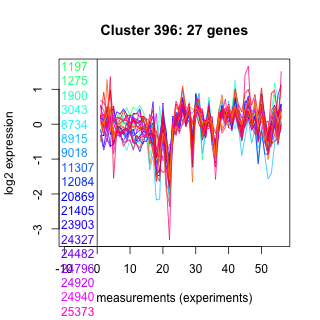
| Thaps_hclust_0396 |
 |
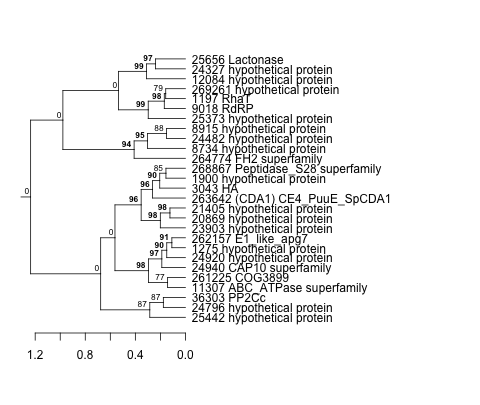 |
0.082 |
10 |
29 |
co2_elevated_stat_arrays | 0.010300 | -0.439 |
| Title | Cluster Plot | Dendrogram | e-value | e-value | e-value | Condition | Condition FDR | Condition Difference |
|---|---|---|---|---|---|---|---|---|
| Thaps_hclust_0337 |
 |
 |
3.5 |
3 |
280 |
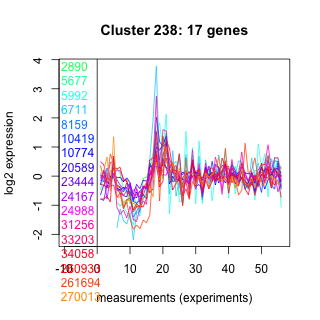
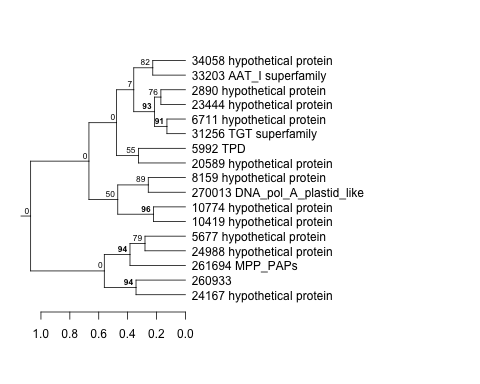
co2_elevated_stat_arrays | 0.001700 | 0.946 |
| Title | Cluster Plot | Dendrogram | e-value | e-value | e-value | Condition | Condition FDR | Condition Difference |
|---|---|---|---|---|---|---|---|---|
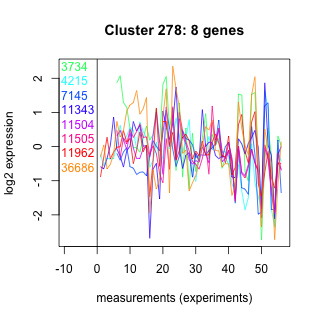
| Thaps_hclust_0278 |
 |
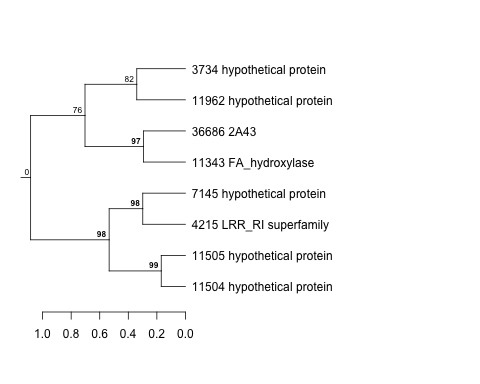 |
0.093 |
0.57 |
39 |
co2_elevated_stat_arrays | 0.000658 | 1.52 |
| Title | Cluster Plot | Dendrogram | e-value | e-value | e-value | Condition | Condition FDR | Condition Difference |
|---|---|---|---|---|---|---|---|---|
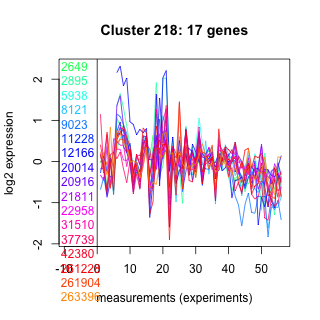
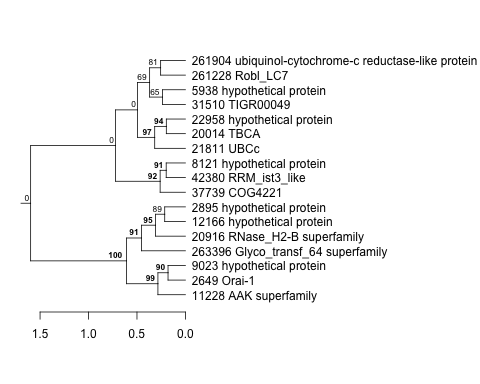
| Thaps_hclust_0219 |
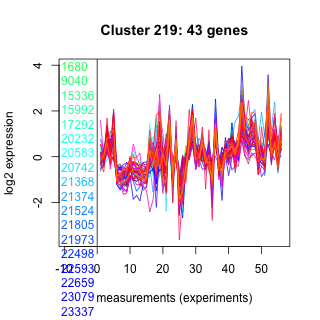 |
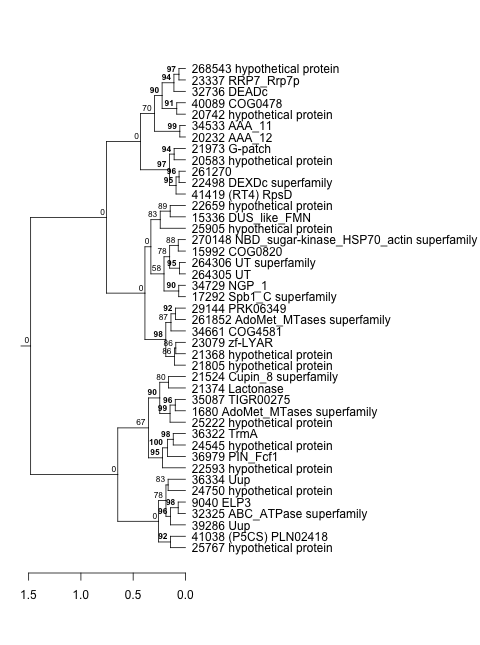 |
2.8e-16 |
0.0000000055 |
0.012 |
co2_elevated_stat_arrays | 0.000658 | 0.994 |
| Title | Cluster Plot | Dendrogram | e-value | e-value | e-value | Condition | Condition FDR | Condition Difference |
|---|---|---|---|---|---|---|---|---|
| Thaps_hclust_0357 |
 |
 |
0.077 |
0.1 |
0.81 |
co2_elevated_stat_arrays | 0.543000 | 0.168 |
| Title | Cluster Plot | Dendrogram | e-value | e-value | e-value | Condition | Condition FDR | Condition Difference |
|---|---|---|---|---|---|---|---|---|
| Thaps_hclust_0298 |
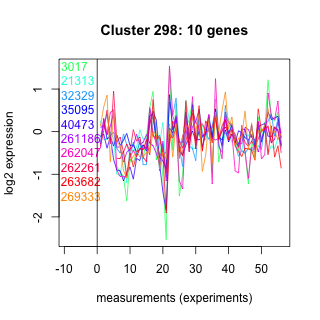 |
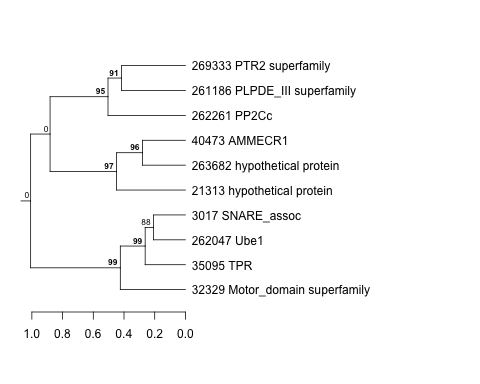 |
0.035 |
0.58 |
41 |
co2_elevated_stat_arrays | 0.857000 | 0.059 |
| Title | Cluster Plot | Dendrogram | e-value | e-value | e-value | Condition | Condition FDR | Condition Difference |
|---|---|---|---|---|---|---|---|---|
| Thaps_hclust_0239 |
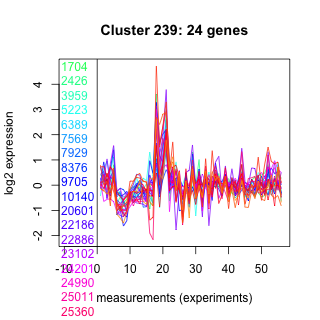 |
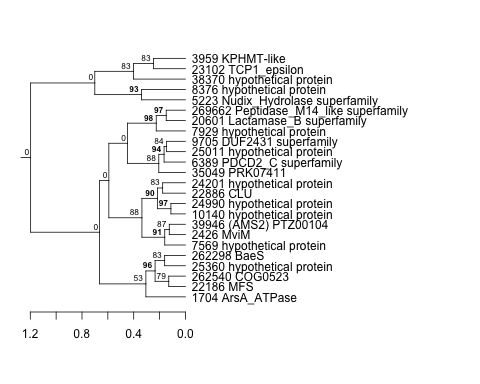 |
0.000019 |
0.001 |
0.06 |
co2_elevated_stat_arrays | 0.381000 | 0.201 |
| Title | Cluster Plot | Dendrogram | e-value | e-value | e-value | Condition | Condition FDR | Condition Difference |
|---|---|---|---|---|---|---|---|---|
| Thaps_hclust_0180 |
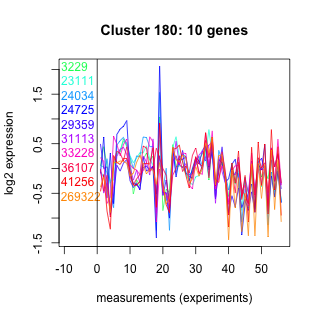 |
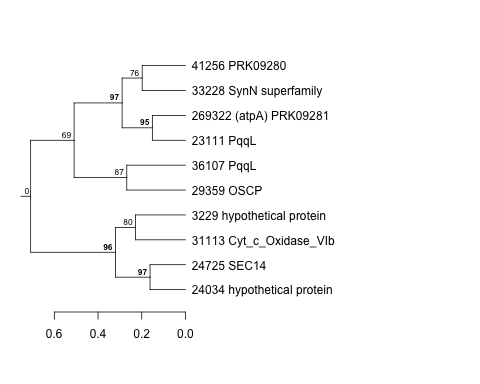 |
1.5 |
1.7 |
12 |
co2_elevated_stat_arrays | 0.213000 | -0.349 |
| Title | Cluster Plot | Dendrogram | e-value | e-value | e-value | Condition | Condition FDR | Condition Difference |
|---|---|---|---|---|---|---|---|---|
| Thaps_hclust_0318 |
 |
 |
1.1e-17 |
0.000000015 |
0.0000081 |
co2_elevated_stat_arrays | 0.000658 | 0.784 |
| Title | Cluster Plot | Dendrogram | e-value | e-value | e-value | Condition | Condition FDR | Condition Difference |
|---|---|---|---|---|---|---|---|---|
| Thaps_hclust_0259 |
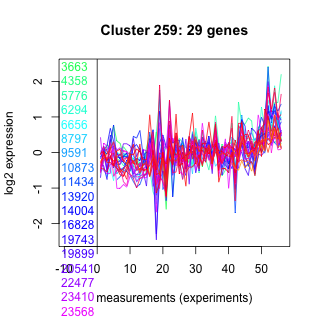 |
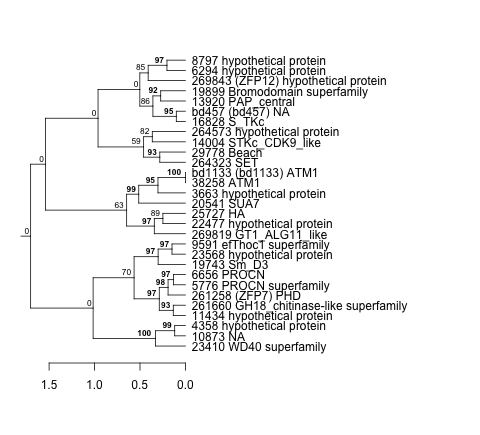 |
0.000051 |
0.026 |
17 |
co2_elevated_stat_arrays | 0.178000 | 0.268 |
| Title | Cluster Plot | Dendrogram | e-value | e-value | e-value | Condition | Condition FDR | Condition Difference |
|---|---|---|---|---|---|---|---|---|
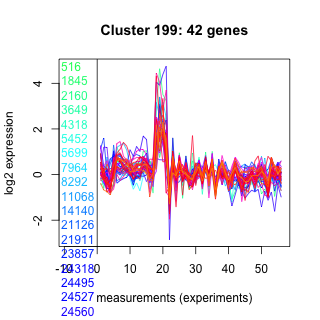
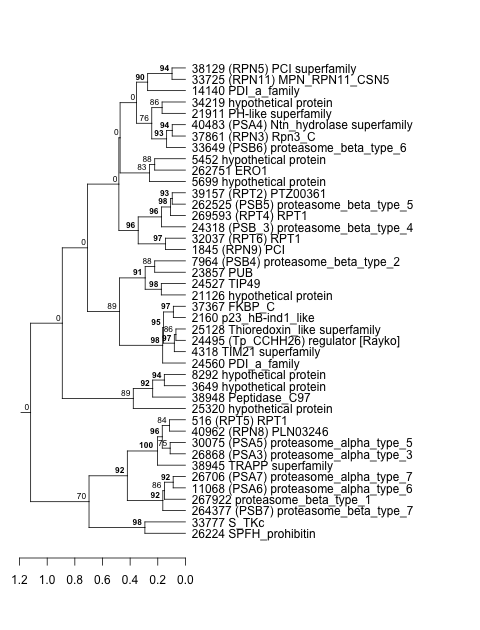
| Thaps_hclust_0200 |
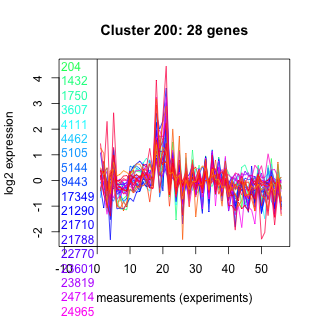 |
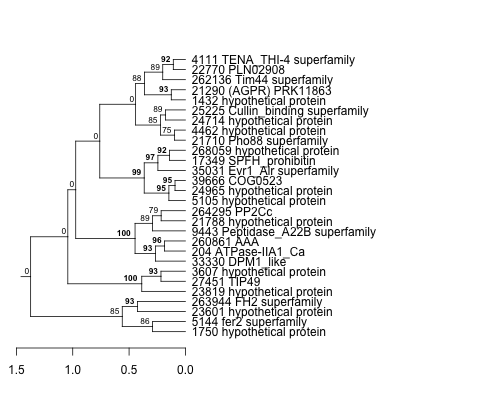 |
0.0000013 |
0.00018 |
0.000045 |
co2_elevated_stat_arrays | 0.475000 | 0.164 |
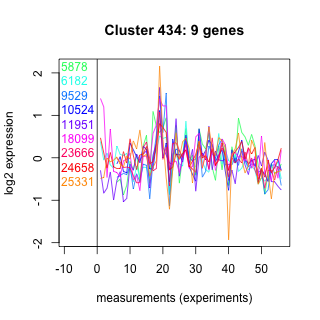
| Title | Cluster Plot | Dendrogram | e-value | e-value | e-value | Condition | Condition FDR | Condition Difference |
|---|---|---|---|---|---|---|---|---|
| Thaps_hclust_0141 |
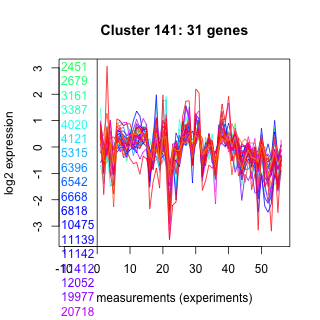 |
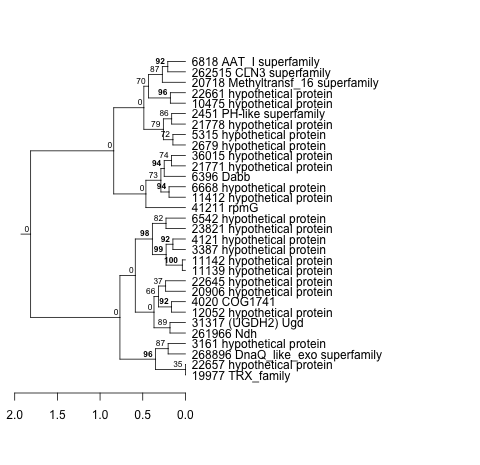 |
0.000021 |
0.0007 |
0.0051 |
co2_elevated_stat_arrays | 0.001190 | -0.549 |
| Title | Cluster Plot | Dendrogram | e-value | e-value | e-value | Condition | Condition FDR | Condition Difference |
|---|---|---|---|---|---|---|---|---|
| Thaps_hclust_0082 |
 |
|
8.89825e-43 |
2e-27 |
1.3e-16 |
co2_elevated_stat_arrays | 0.046800 | 0.253 |
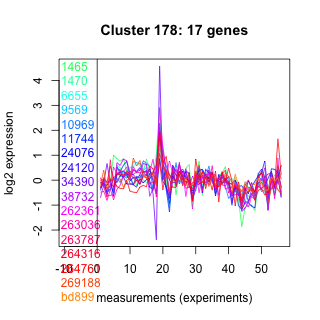
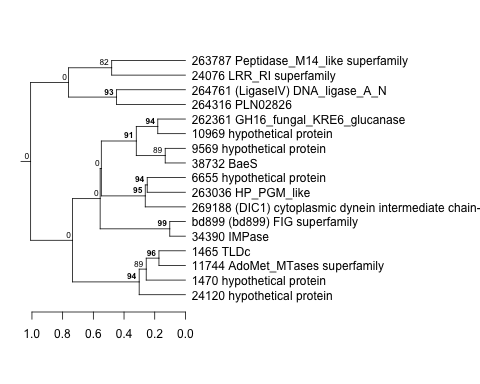
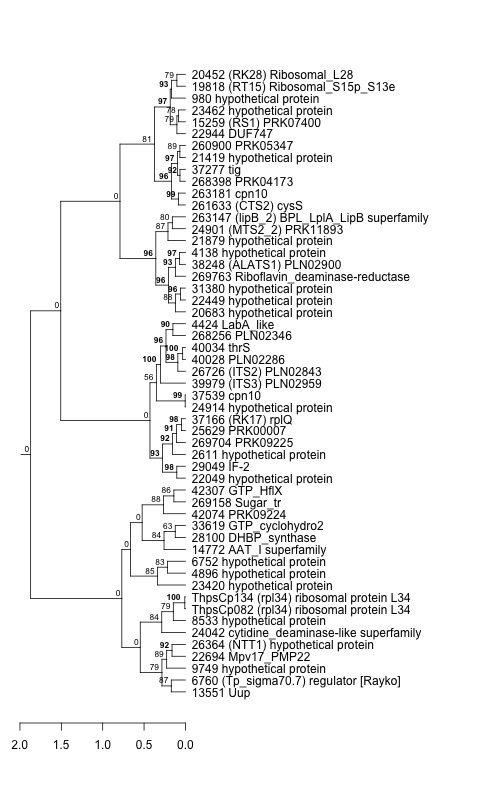
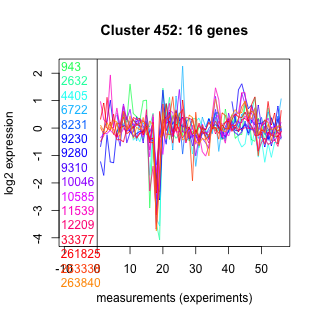
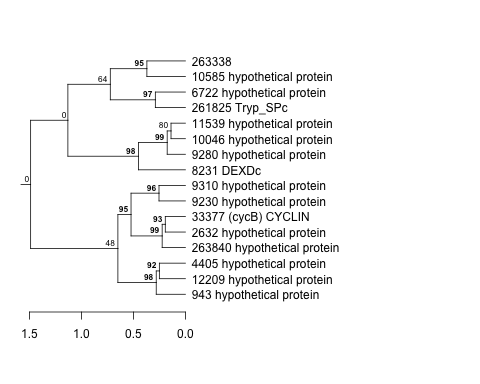
| Title | Cluster Plot | Dendrogram | e-value | e-value | e-value | Condition | Condition FDR | Condition Difference |
|---|---|---|---|---|---|---|---|---|
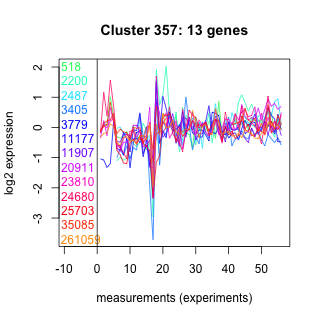
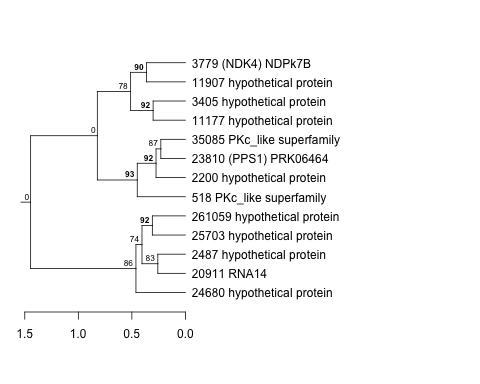
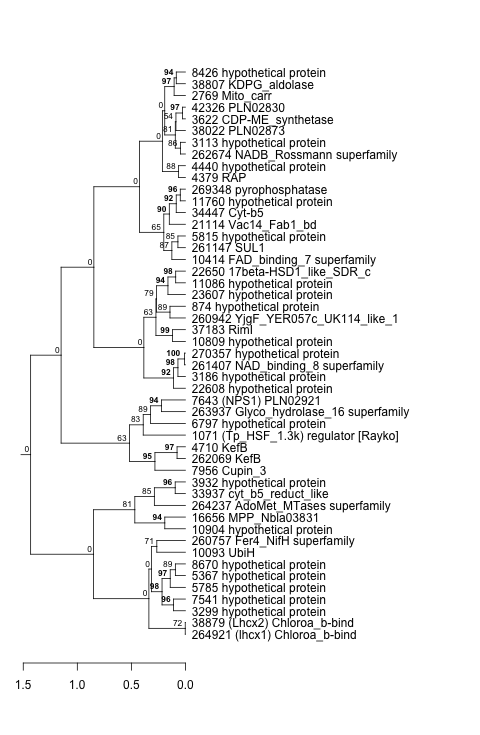
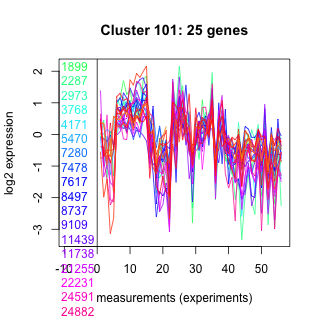
| Thaps_hclust_0220 |
 |
|
|
2.4e-19 |
3.2e-19 |
co2_elevated_stat_arrays | 0.000658 | 1.29 |
| Title | Cluster Plot | Dendrogram | e-value | e-value | e-value | Condition | Condition FDR | Condition Difference |
|---|---|---|---|---|---|---|---|---|
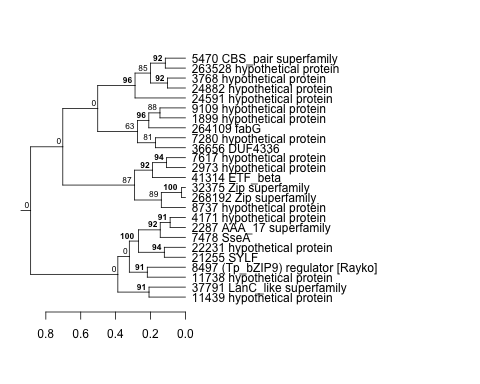
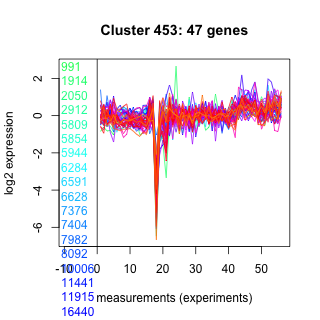
| Thaps_hclust_0161 |
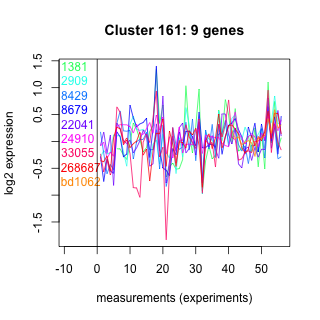 |
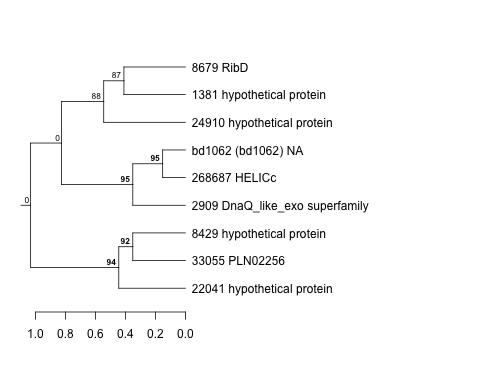 |
1.8 |
13 |
18 |
co2_elevated_stat_arrays | 0.884000 | -0.0521 |
| Title | Cluster Plot | Dendrogram | e-value | e-value | e-value | Condition | Condition FDR | Condition Difference |
|---|---|---|---|---|---|---|---|---|
| Thaps_hclust_0375 |
 |
 |
1.8 |
2.9 |
40 |
co2_elevated_stat_arrays | 0.951000 | -0.0179 |
| Title | Cluster Plot | Dendrogram | e-value | e-value | e-value | Condition | Condition FDR | Condition Difference |
|---|---|---|---|---|---|---|---|---|
| Thaps_hclust_0316 |
 |
 |
0.14 |
2.2 |
4.4 |
co2_elevated_stat_arrays | 0.002130 | 0.872 |
| Title | Cluster Plot | Dendrogram | e-value | e-value | e-value | Condition | Condition FDR | Condition Difference |
|---|---|---|---|---|---|---|---|---|
| Thaps_hclust_0020 |
 |
 |
0.004 |
0.15 |
3.3 |
co2_elevated_stat_arrays | 0.229000 | -0.254 |
| Title | Cluster Plot | Dendrogram | e-value | e-value | e-value | Condition | Condition FDR | Condition Difference |
|---|---|---|---|---|---|---|---|---|
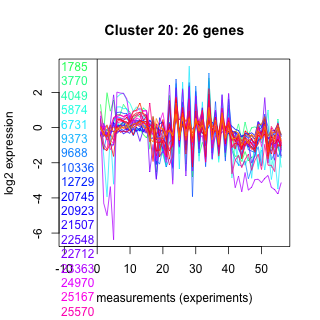
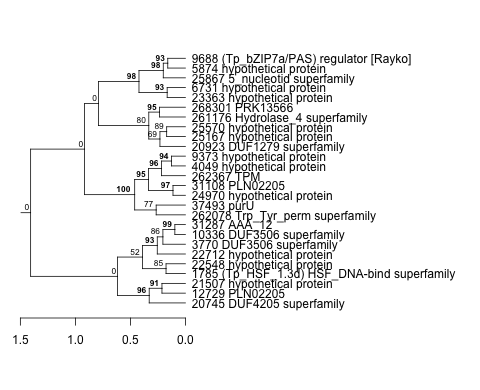
| Thaps_hclust_0257 |
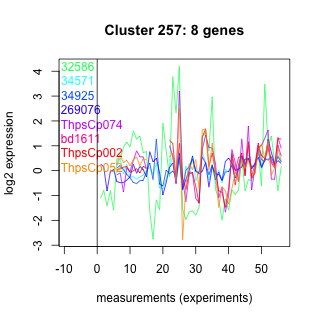 |
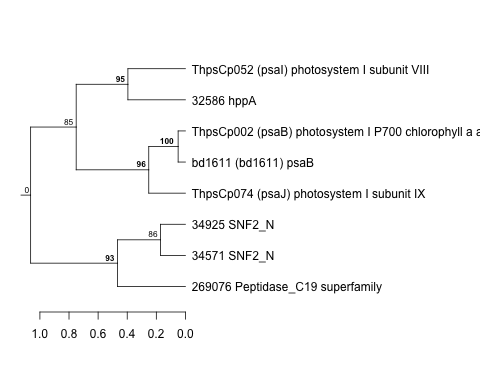 |
Not available | Not available | Not available | co2_elevated_stat_arrays | 0.301000 | 0.316 |
| Title | Cluster Plot | Dendrogram | e-value | e-value | e-value | Condition | Condition FDR | Condition Difference |
|---|---|---|---|---|---|---|---|---|
| Thaps_hclust_0395 |
 |
 |
0.0015 |
0.0018 |
0.48 |
co2_elevated_stat_arrays | 0.005610 | -0.469 |
| Title | Cluster Plot | Dendrogram | e-value | e-value | e-value | Condition | Condition FDR | Condition Difference |
|---|---|---|---|---|---|---|---|---|
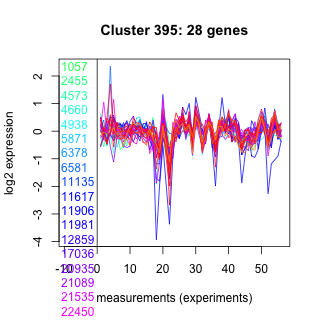
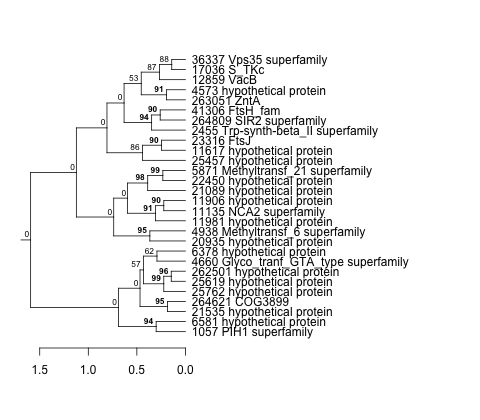
| Thaps_hclust_0336 |
 |
 |
8.7e-23 |
0.00000000000015 |
0.0000000000000032 |
co2_elevated_stat_arrays | 0.001700 | 0.801 |
| Title | Cluster Plot | Dendrogram | e-value | e-value | e-value | Condition | Condition FDR | Condition Difference |
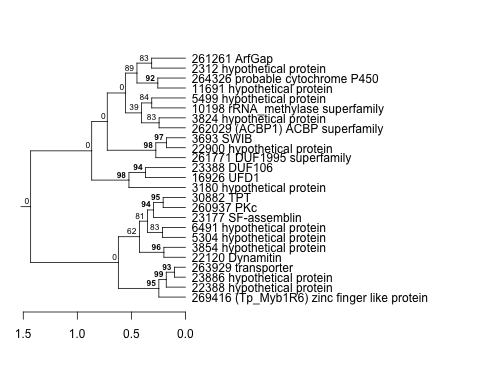
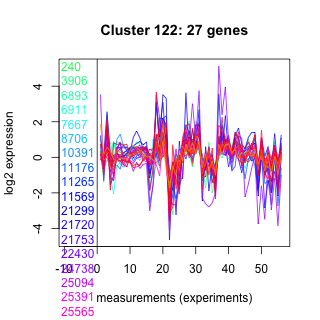
|---|---|---|---|---|---|---|---|---|
| Thaps_hclust_0277 |
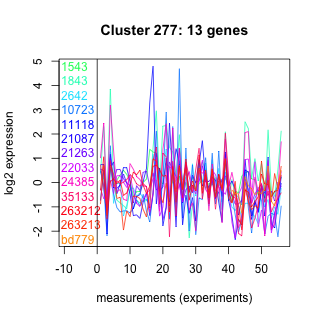 |
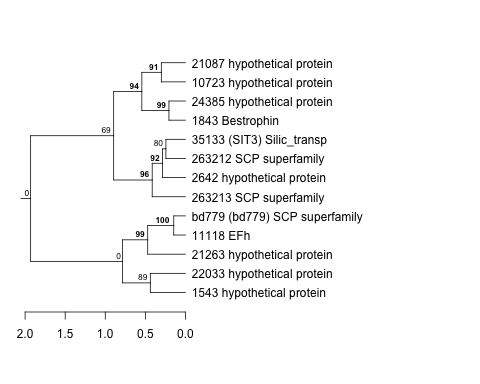 |
0.00036 |
6.6 |
7.6 |
co2_elevated_stat_arrays | 0.517000 | 0.178 |
| Title | Cluster Plot | Dendrogram | e-value | e-value | e-value | Condition | Condition FDR | Condition Difference |
|---|---|---|---|---|---|---|---|---|
| Thaps_hclust_0218 |
 |
 |
0.02 |
0.065 |
7.1 |
co2_elevated_stat_arrays | 0.349000 | -0.233 |
| Title | Cluster Plot | Dendrogram | e-value | e-value | e-value | Condition | Condition FDR | Condition Difference |
|---|---|---|---|---|---|---|---|---|
| Thaps_hclust_0356 |
 |
 |
2.1 |
41 |
71 |
co2_elevated_stat_arrays | 0.626000 | -0.161 |
| Title | Cluster Plot | Dendrogram | e-value | e-value | e-value | Condition | Condition FDR | Condition Difference |
|---|---|---|---|---|---|---|---|---|
| Thaps_hclust_0159 |
 |
 |
0.087 |
1.3 |
3 |
co2_elevated_stat_arrays | 0.435000 | -0.212 |
| Title | Cluster Plot | Dendrogram | e-value | e-value | e-value | Condition | Condition FDR | Condition Difference |
|---|---|---|---|---|---|---|---|---|
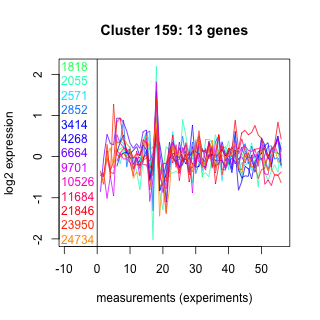
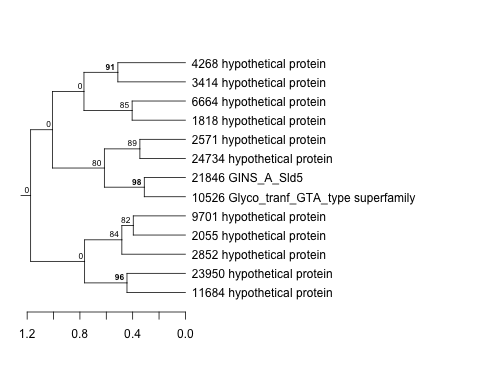
| Thaps_hclust_0297 |
 |
 |
0.018 |
2.5 |
24 |
co2_elevated_stat_arrays | 0.807000 | -0.0761 |
| Title | Cluster Plot | Dendrogram | e-value | e-value | e-value | Condition | Condition FDR | Condition Difference |
|---|---|---|---|---|---|---|---|---|
| Thaps_hclust_0238 |
 |
 |
0.0018 |
0.095 |
0.069 |
co2_elevated_stat_arrays | 0.867000 | 0.0493 |
| Title | Cluster Plot | Dendrogram | e-value | e-value | e-value | Condition | Condition FDR | Condition Difference |
|---|---|---|---|---|---|---|---|---|
| Thaps_hclust_0179 |
 |
 |
0.0000039 |
0.056 |
2.8 |
co2_elevated_stat_arrays | 0.296000 | -0.248 |
| Title | Cluster Plot | Dendrogram | e-value | e-value | e-value | Condition | Condition FDR | Condition Difference |
|---|---|---|---|---|---|---|---|---|
| Thaps_hclust_0120 |
 |
 |
0.00000098 |
0.000000076 |
0.001 |
co2_elevated_stat_arrays | 0.112000 | -0.33 |
| Title | Cluster Plot | Dendrogram | e-value | e-value | e-value | Condition | Condition FDR | Condition Difference |
|---|---|---|---|---|---|---|---|---|
| Thaps_hclust_0258 |
 |
 |
0.027 |
0.021 |
0.036 |
co2_elevated_stat_arrays | 0.248000 | 0.326 |
| Title | Cluster Plot | Dendrogram | e-value | e-value | e-value | Condition | Condition FDR | Condition Difference |
|---|---|---|---|---|---|---|---|---|
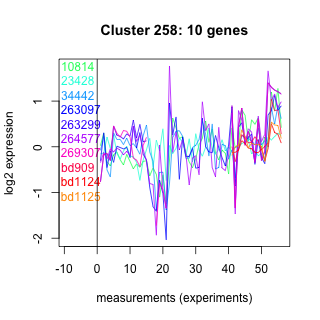
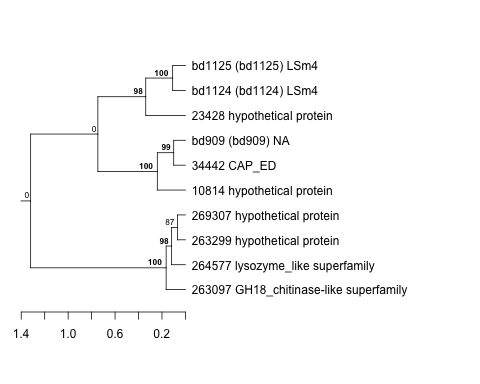
| Thaps_hclust_0199 |
 |
 |
2.7e-19 |
0.000000062 |
0.00000065 |
co2_elevated_stat_arrays | 0.154000 | -0.256 |
| Title | Cluster Plot | Dendrogram | e-value | e-value | e-value | Condition | Condition FDR | Condition Difference |
|---|---|---|---|---|---|---|---|---|
| Thaps_hclust_0140 |
 |
 |
0.0000000084 |
0.000091 |
0.0000072 |
co2_elevated_stat_arrays | 0.288000 | -0.242 |
| Title | Cluster Plot | Dendrogram | e-value | e-value | e-value | Condition | Condition FDR | Condition Difference |
|---|---|---|---|---|---|---|---|---|
| Thaps_hclust_0081 |
 |
 |
0.000000001 |
0.000000000027 |
0.28 |
co2_elevated_stat_arrays | 0.483000 | 0.161 |
| Title | Cluster Plot | Dendrogram | e-value | e-value | e-value | Condition | Condition FDR | Condition Difference |
|---|---|---|---|---|---|---|---|---|
| Thaps_hclust_0492 |
 |
 |
0.29 |
0.47 |
23 |
co2_elevated_stat_arrays | 0.002600 | 0.707 |
| Title | Cluster Plot | Dendrogram | e-value | e-value | e-value | Condition | Condition FDR | Condition Difference |
|---|---|---|---|---|---|---|---|---|
| Thaps_hclust_0160 |
 |
 |
0.35 |
66 |
160 |
co2_elevated_stat_arrays | 0.275000 | -0.301 |
| Title | Cluster Plot | Dendrogram | e-value | e-value | e-value | Condition | Condition FDR | Condition Difference |
|---|---|---|---|---|---|---|---|---|
| Thaps_hclust_0017 |
 |
 |
4.6e-24 |
0.00000000000046 |
0.000000000000098 |
co2_elevated_stat_arrays | 0.064400 | 0.292 |
| Title | Cluster Plot | Dendrogram | e-value | e-value | e-value | Condition | Condition FDR | Condition Difference |
|---|---|---|---|---|---|---|---|---|
| Thaps_hclust_0101 |
 |
 |
0.000000016 |
0.0000038 |
0.014 |
co2_elevated_stat_arrays | 0.506000 | -0.158 |
| Title | Cluster Plot | Dendrogram | e-value | e-value | e-value | Condition | Condition FDR | Condition Difference |
|---|---|---|---|---|---|---|---|---|
| Thaps_hclust_0042 |
 |
 |
0.26 |
5.9 |
0.46 |
co2_elevated_stat_arrays | 0.000658 | 0.898 |
| Title | Cluster Plot | Dendrogram | e-value | e-value | e-value | Condition | Condition FDR | Condition Difference |
|---|---|---|---|---|---|---|---|---|
| Thaps_hclust_0453 |
 |
 |
0.000000000093 |
0.000000041 |
0.00016 |
co2_elevated_stat_arrays | 0.206000 | 0.226 |
| Title | Cluster Plot | Dendrogram | e-value | e-value | e-value | Condition | Condition FDR | Condition Difference |
|---|---|---|---|---|---|---|---|---|
| Thaps_hclust_0394 |
 |
 |
0.044 |
0.46 |
610 |
co2_elevated_stat_arrays | 0.477000 | -0.203 |
| Title | Cluster Plot | Dendrogram | e-value | e-value | e-value | Condition | Condition FDR | Condition Difference |
|---|---|---|---|---|---|---|---|---|
| Thaps_hclust_0121 |
 |
 |
0.00021 |
0.77 |
30 |
co2_elevated_stat_arrays | 0.696000 | -0.115 |
| Title | Cluster Plot | Dendrogram | e-value | e-value | e-value | Condition | Condition FDR | Condition Difference |
|---|---|---|---|---|---|---|---|---|
| Thaps_hclust_0062 |
 |
 |
0.000000026 |
0.000000021 |
0.000000000021 |
co2_elevated_stat_arrays | 0.000658 | 1.37 |
| Title | Cluster Plot | Dendrogram | e-value | e-value | e-value | Condition | Condition FDR | Condition Difference |
|---|---|---|---|---|---|---|---|---|
| Thaps_hclust_0473 |
 |
 |
0.00036 |
0.0036 |
0.68 |
co2_elevated_stat_arrays | 0.254000 | -0.236 |
| Title | Cluster Plot | Dendrogram | e-value | e-value | e-value | Condition | Condition FDR | Condition Difference |
|---|---|---|---|---|---|---|---|---|
| Thaps_hclust_0414 |
 |
 |
0.0000000000028 |
0.00000026 |
0.000019 |
co2_elevated_stat_arrays | 0.125000 | -0.293 |
| Title | Cluster Plot | Dendrogram | e-value | e-value | e-value | Condition | Condition FDR | Condition Difference |
|---|---|---|---|---|---|---|---|---|
| Thaps_hclust_0355 |
 |
 |
0.49 |
16 |
310 |
co2_elevated_stat_arrays | 0.625000 | 0.168 |
| Title | Cluster Plot | Dendrogram | e-value | e-value | e-value | Condition | Condition FDR | Condition Difference |
|---|---|---|---|---|---|---|---|---|
| Thaps_hclust_0493 |
 |
 |
0.00000036 |
0.0000009 |
0.000056 |
co2_elevated_stat_arrays | 0.045100 | 0.463 |
| Title | Cluster Plot | Dendrogram | e-value | e-value | e-value | Condition | Condition FDR | Condition Difference |
|---|---|---|---|---|---|---|---|---|
| Thaps_hclust_0023 |
 |
 |
0.000000000039 |
0.0000072 |
0.002 |
co2_elevated_stat_arrays | 0.697000 | -0.101 |
| Title | Cluster Plot | Dendrogram | e-value | e-value | e-value | Condition | Condition FDR | Condition Difference |
|---|---|---|---|---|---|---|---|---|
| Thaps_hclust_0434 |
 |
 |
0.011 |
17 |
57 |
co2_elevated_stat_arrays | 0.928000 | 0.0314 |
| Title | Cluster Plot | Dendrogram | e-value | e-value | e-value | Condition | Condition FDR | Condition Difference |
|---|---|---|---|---|---|---|---|---|
| Thaps_hclust_0178 |
 |
 |
0.0000000019 |
0.00000047 |
0.000019 |
co2_elevated_stat_arrays | 0.128000 | -0.357 |
| Title | Cluster Plot | Dendrogram | e-value | e-value | e-value | Condition | Condition FDR | Condition Difference |
|---|---|---|---|---|---|---|---|---|
| Thaps_hclust_0119 |
 |
 |
0.000017 |
0.0015 |
0.0058 |
co2_elevated_stat_arrays | 0.795000 | -0.076 |
| Title | Cluster Plot | Dendrogram | e-value | e-value | e-value | Condition | Condition FDR | Condition Difference |
|---|---|---|---|---|---|---|---|---|
| Thaps_hclust_0060 |
 |
 |
0.00000047 |
0.00077 |
0.0075 |
co2_elevated_stat_arrays | 0.481000 | 0.163 |
| Title | Cluster Plot | Dendrogram | e-value | e-value | e-value | Condition | Condition FDR | Condition Difference |
|---|---|---|---|---|---|---|---|---|
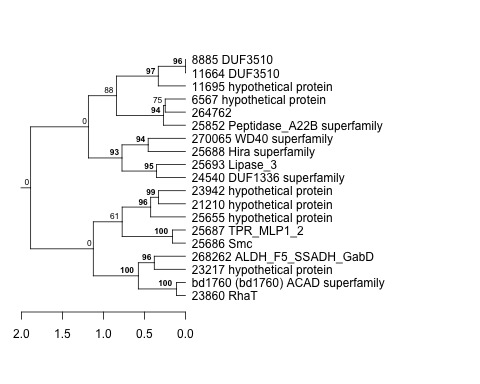
| Thaps_hclust_0198 |
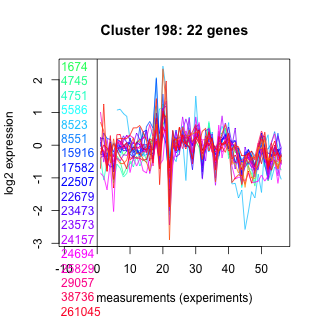 |
 |
0.00091 |
0.017 |
0.0046 |
co2_elevated_stat_arrays | 0.062000 | -0.388 |
| Title | Cluster Plot | Dendrogram | e-value | e-value | e-value | Condition | Condition FDR | Condition Difference |
|---|---|---|---|---|---|---|---|---|
| Thaps_hclust_0139 |
 |
 |
0.00014 |
0.00066 |
3 |
co2_elevated_stat_arrays | 0.892000 | 0.0403 |
| Title | Cluster Plot | Dendrogram | e-value | e-value | e-value | Condition | Condition FDR | Condition Difference |
|---|---|---|---|---|---|---|---|---|
| Thaps_hclust_0080 |
 |
 |
0.000037 |
0.000075 |
0.96 |
co2_elevated_stat_arrays | 0.004460 | 0.528 |
| Title | Cluster Plot | Dendrogram | e-value | e-value | e-value | Condition | Condition FDR | Condition Difference |
|---|---|---|---|---|---|---|---|---|
| Thaps_hclust_0491 |
 |
 |
0.35 |
17 |
52 |
co2_elevated_stat_arrays | 0.009570 | 0.65 |
| Title | Cluster Plot | Dendrogram | e-value | e-value | e-value | Condition | Condition FDR | Condition Difference |
|---|---|---|---|---|---|---|---|---|
| Thaps_hclust_0432 |
 |
 |
0.011 |
0.06 |
2.4 |
co2_elevated_stat_arrays | 0.381000 | -0.211 |
| Title | Cluster Plot | Dendrogram | e-value | e-value | e-value | Condition | Condition FDR | Condition Difference |
|---|---|---|---|---|---|---|---|---|
| Thaps_hclust_0016 |
 |
 |
0.000000000083 |
0.00000025 |
0.00000028 |
co2_elevated_stat_arrays | 0.711000 | -0.095 |
| Title | Cluster Plot | Dendrogram | e-value | e-value | e-value | Condition | Condition FDR | Condition Difference |
|---|---|---|---|---|---|---|---|---|
| Thaps_hclust_0100 |
 |
 |
0.00000073 |
0.000076 |
2.6 |
co2_elevated_stat_arrays | 0.512000 | 0.168 |
| Title | Cluster Plot | Dendrogram | e-value | e-value | e-value | Condition | Condition FDR | Condition Difference |
|---|---|---|---|---|---|---|---|---|
| Thaps_hclust_0041 |
 |
 |
4.4e-38 |
0.000000011 |
0.0000042 |
co2_elevated_stat_arrays | 0.113000 | 0.258 |
| Title | Cluster Plot | Dendrogram | e-value | e-value | e-value | Condition | Condition FDR | Condition Difference |
|---|---|---|---|---|---|---|---|---|
| Thaps_hclust_0452 |
 |
 |
84 |
200 |
220 |
co2_elevated_stat_arrays | 0.741000 | 0.094 |
| Title | Cluster Plot | Dendrogram | e-value | e-value | e-value | Condition | Condition FDR | Condition Difference |
|---|---|---|---|---|---|---|---|---|
| Thaps_hclust_0393 |
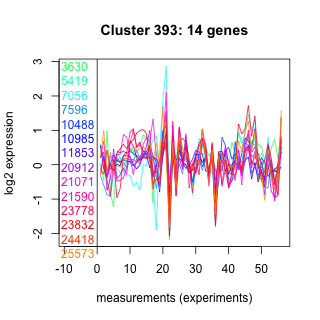 |
 |
2 |
16 |
16 |
co2_elevated_stat_arrays | 0.209000 | 0.319 |
| Title | Cluster Plot | Dendrogram | e-value | e-value | e-value | Condition | Condition FDR | Condition Difference |
|---|---|---|---|---|---|---|---|---|
| Thaps_hclust_0334 |
 |
 |
0.51 |
0.00047 |
0.25 |
co2_elevated_stat_arrays | 0.154000 | 0.272 |
| Title | Cluster Plot | Dendrogram | e-value | e-value | e-value | Condition | Condition FDR | Condition Difference |
|---|---|---|---|---|---|---|---|---|
| Thaps_hclust_0061 |
 |
 |
0.000000062 |
0.00063 |
0.032 |
co2_elevated_stat_arrays | 0.122000 | 0.398 |