Hierarchical Clusters
Displaying 2001 - 2100 of 7500
| Title | Cluster Plot | Dendrogram | e-value | e-value | e-value | Condition | Condition FDR | Condition Difference |
|---|---|---|---|---|---|---|---|---|
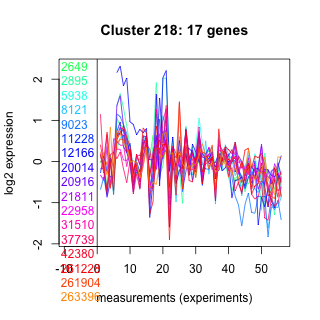
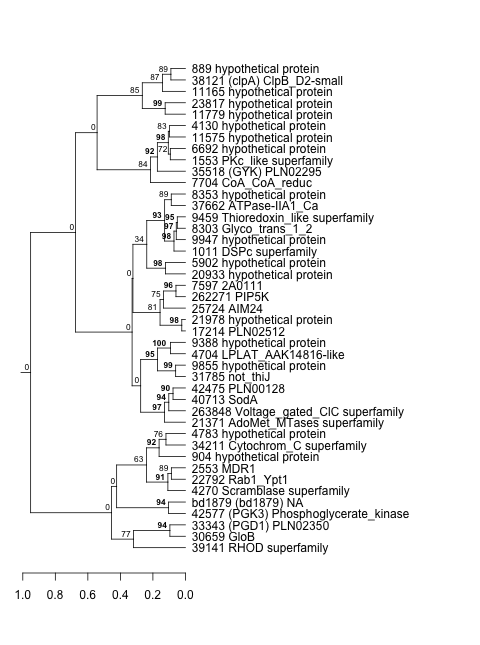
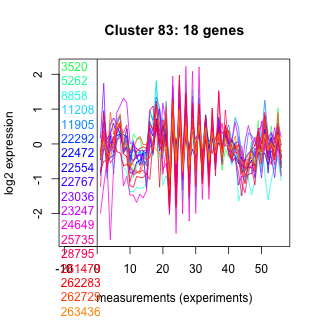
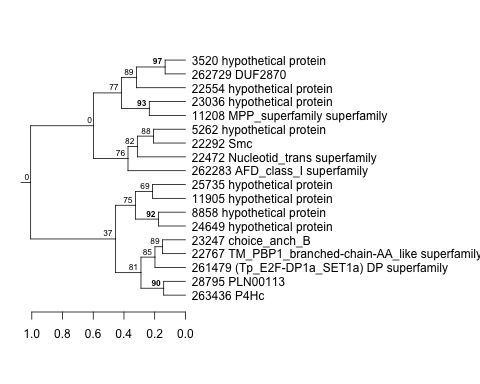
| Thaps_hclust_0218 |
 |
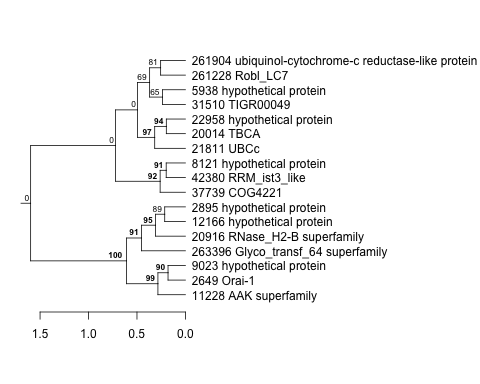 |
0.02 |
0.065 |
7.1 |
lowN_TMEVA | 0.515000 | -0.239 |
| Thaps_hclust_0218 |
|
|
0.02 |
0.065 |
7.1 |
co2_elevated_stat_arrays | 0.349000 | -0.233 |
| Thaps_hclust_0218 |
|
|
0.02 |
0.065 |
7.1 |
lowFe_KTKB_Day5 | 0.296000 | -0.23 |
| Title | Cluster Plot | Dendrogram | e-value | e-value | e-value | Condition | Condition FDR | Condition Difference |
|---|---|---|---|---|---|---|---|---|
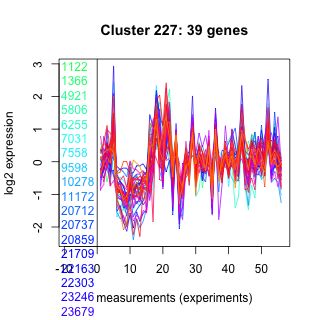
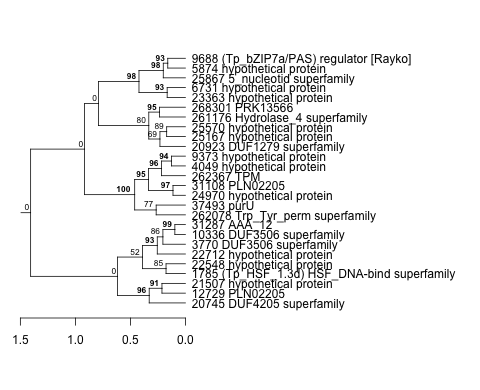
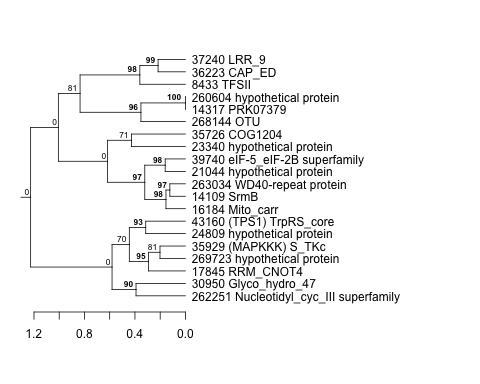
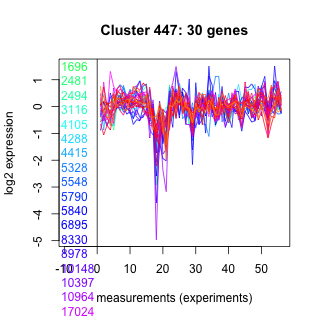
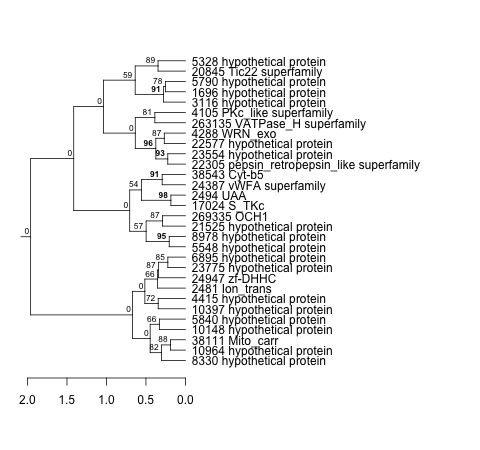
| Thaps_hclust_0227 |
 |
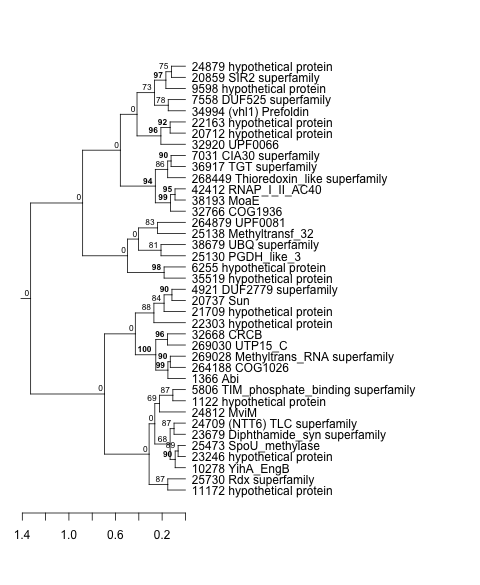 |
1.2e-22 |
0.0000000098 |
0.0018 |
exponential_vs_stationary_24light | 0.365000 | -0.238 |
| Title | Cluster Plot | Dendrogram | e-value | e-value | e-value | Condition | Condition FDR | Condition Difference |
|---|---|---|---|---|---|---|---|---|
| Thaps_hclust_0381 |
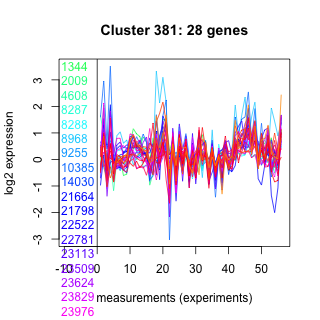 |
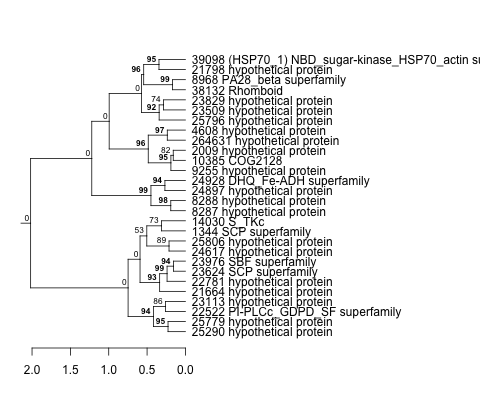 |
0.0001 |
0.0035 |
0.061 |
lowtemp_TMEVA | 0.269000 | -0.238 |
| Title | Cluster Plot | Dendrogram | e-value | e-value | e-value | Condition | Condition FDR | Condition Difference |
|---|---|---|---|---|---|---|---|---|
| Thaps_hclust_0304 |
 |
 |
0.16 |
1.3 |
16 |
lowFe_KTKB_Day3 | 0.157000 | -0.238 |
| Title | Cluster Plot | Dendrogram | e-value | e-value | e-value | Condition | Condition FDR | Condition Difference |
|---|---|---|---|---|---|---|---|---|
| Thaps_hclust_0303 |
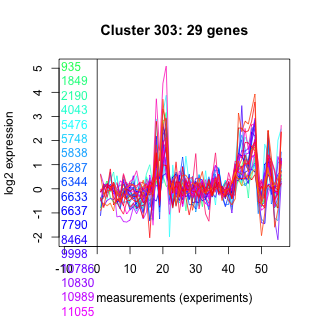 |
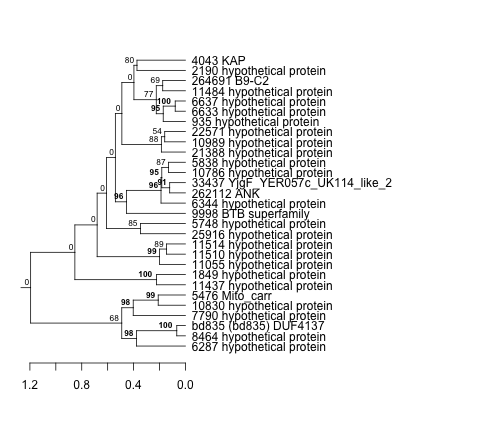 |
0.00096 |
0.0021 |
0.0014 |
lowFe_KTKB_Day5 | 0.152000 | -0.238 |
| Title | Cluster Plot | Dendrogram | e-value | e-value | e-value | Condition | Condition FDR | Condition Difference |
|---|---|---|---|---|---|---|---|---|
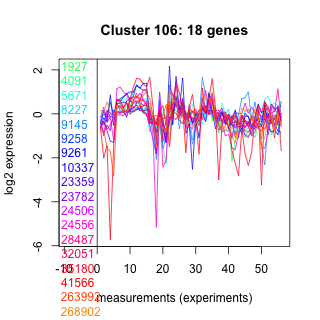
| Thaps_hclust_0106 |
 |
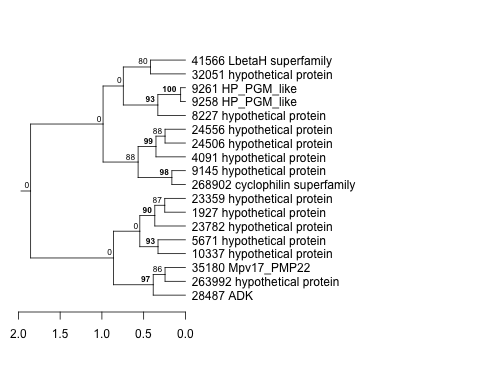 |
0.48 |
3.7 |
8.9 |
diel_light_vs_dark | 0.298000 | -0.238 |
| Title | Cluster Plot | Dendrogram | e-value | e-value | e-value | Condition | Condition FDR | Condition Difference |
|---|---|---|---|---|---|---|---|---|
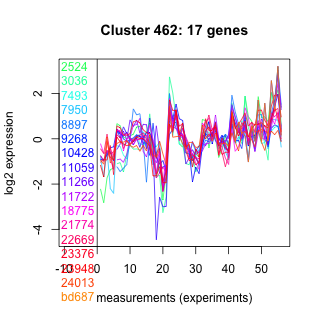
| Thaps_hclust_0462 |
 |
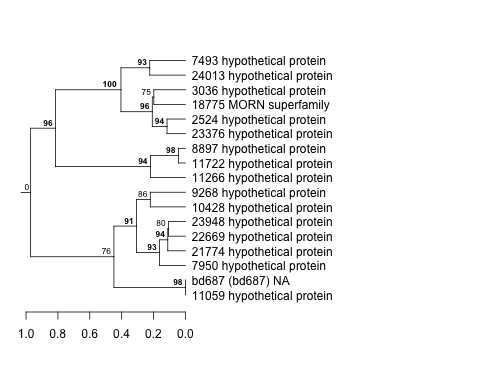 |
0.0000000094 |
0.0000011 |
0.000046 |
co2_elevated_expo_arrays | 0.129000 | -0.238 |
| Title | Cluster Plot | Dendrogram | e-value | e-value | e-value | Condition | Condition FDR | Condition Difference |
|---|---|---|---|---|---|---|---|---|
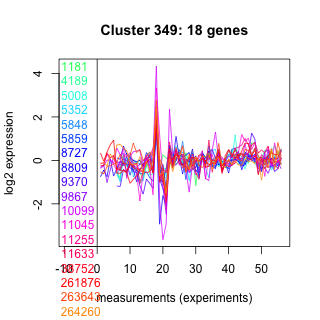
| Thaps_hclust_0349 |
 |
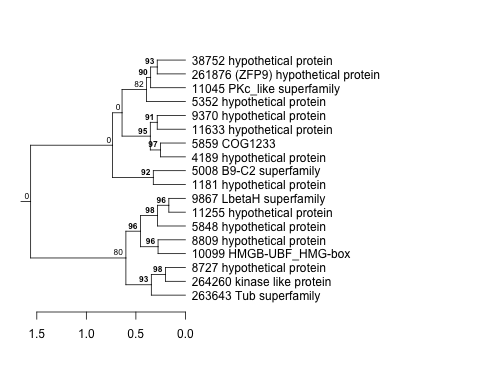 |
360 |
5.4 |
67 |
BaP | 0.318000 | -0.238 |
| Title | Cluster Plot | Dendrogram | e-value | e-value | e-value | Condition | Condition FDR | Condition Difference |
|---|---|---|---|---|---|---|---|---|
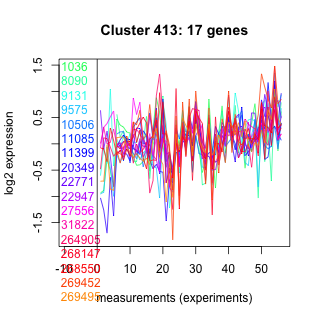
| Thaps_hclust_0413 |
 |
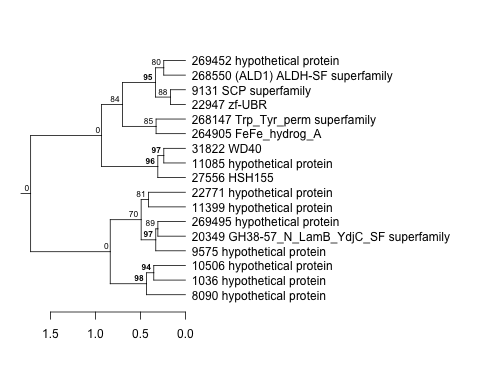 |
0.000043 |
0.0057 |
0.67 |
highlight_arrays | 0.165000 | -0.238 |
| Title | Cluster Plot | Dendrogram | e-value | e-value | e-value | Condition | Condition FDR | Condition Difference |
|---|---|---|---|---|---|---|---|---|
| Thaps_hclust_0057 |
 |
 |
1.5 |
1.7 |
12 |
lowN_TMEVA | 0.581000 | -0.237 |
| Title | Cluster Plot | Dendrogram | e-value | e-value | e-value | Condition | Condition FDR | Condition Difference |
|---|---|---|---|---|---|---|---|---|
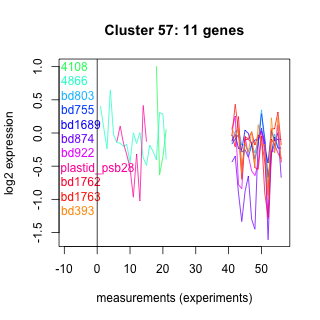
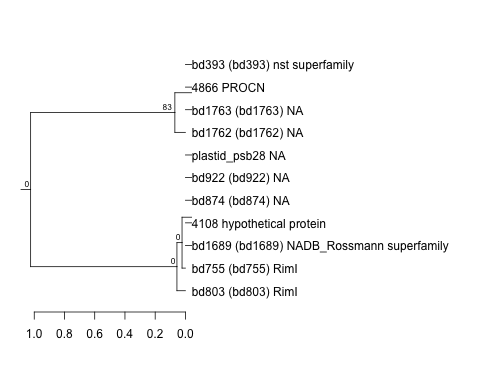
| Thaps_hclust_0385 |
 |
 |
0.000029 |
2.1 |
2.2 |
lowFe_TMEVA | 0.420000 | -0.237 |
| Thaps_hclust_0385 |
|
|
0.000029 |
2.1 |
2.2 |
highlight_arrays | 0.154000 | -0.229 |
| Thaps_hclust_0385 |
|
|
0.000029 |
2.1 |
2.2 |
exponential_vs_stationary_24highlight | 0.034100 | -0.226 |
| Title | Cluster Plot | Dendrogram | e-value | e-value | e-value | Condition | Condition FDR | Condition Difference |
|---|---|---|---|---|---|---|---|---|
| Thaps_hclust_0213 |
 |
 |
0.0000045 |
0.075 |
0.54 |
lowFe_KTKB_Day3 | 0.125000 | -0.237 |
| Title | Cluster Plot | Dendrogram | e-value | e-value | e-value | Condition | Condition FDR | Condition Difference |
|---|---|---|---|---|---|---|---|---|
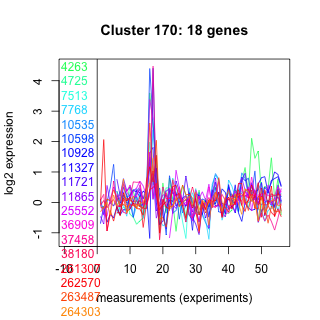
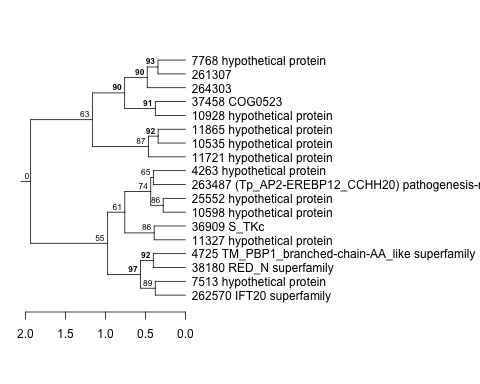
| Thaps_hclust_0170 |
 |
 |
0.028 |
1.8 |
150 |
lowN_TMEVA | 0.519000 | -0.237 |
| Title | Cluster Plot | Dendrogram | e-value | e-value | e-value | Condition | Condition FDR | Condition Difference |
|---|---|---|---|---|---|---|---|---|
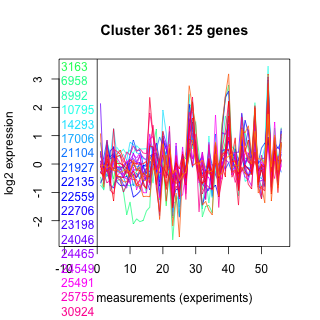
| Thaps_hclust_0361 |
 |
 |
0.00000000081 |
0.14 |
2.1 |
lowSi_TMEVA | 0.820000 | -0.237 |
| Title | Cluster Plot | Dendrogram | e-value | e-value | e-value | Condition | Condition FDR | Condition Difference |
|---|---|---|---|---|---|---|---|---|
| Thaps_hclust_0485 |
 |
 |
0.0012 |
0.0078 |
0.16 |
diel_light_vs_dark | 0.055300 | -0.237 |
| Title | Cluster Plot | Dendrogram | e-value | e-value | e-value | Condition | Condition FDR | Condition Difference |
|---|---|---|---|---|---|---|---|---|
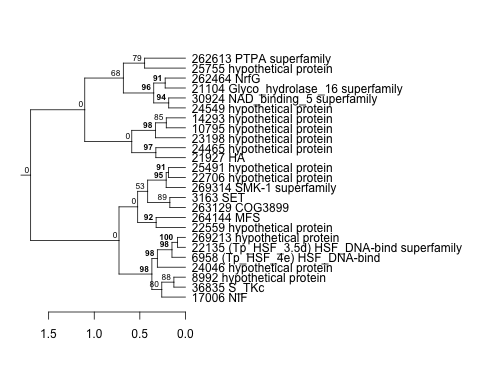
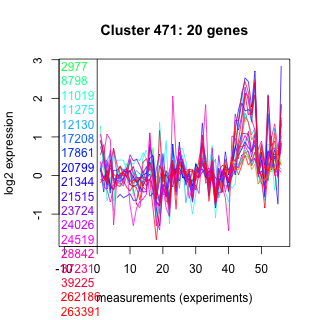
| Thaps_hclust_0471 |
 |
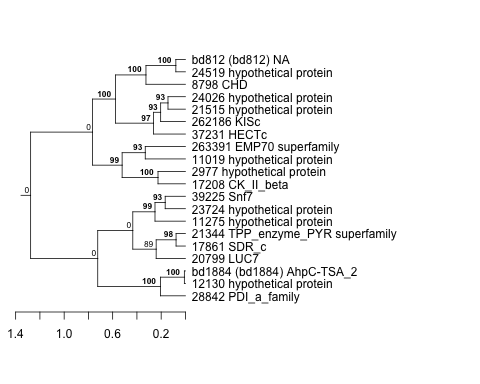 |
0.0086 |
0.14 |
2.6 |
exponential_vs_stationary_24highlight | 0.024200 | -0.237 |
| Title | Cluster Plot | Dendrogram | e-value | e-value | e-value | Condition | Condition FDR | Condition Difference |
|---|---|---|---|---|---|---|---|---|
| Thaps_hclust_0004 |
 |
 |
0.000000074 |
0.0000031 |
0.0000044 |
lowFe_TMEVA | 0.313000 | -0.237 |
| Title | Cluster Plot | Dendrogram | e-value | e-value | e-value | Condition | Condition FDR | Condition Difference |
|---|---|---|---|---|---|---|---|---|
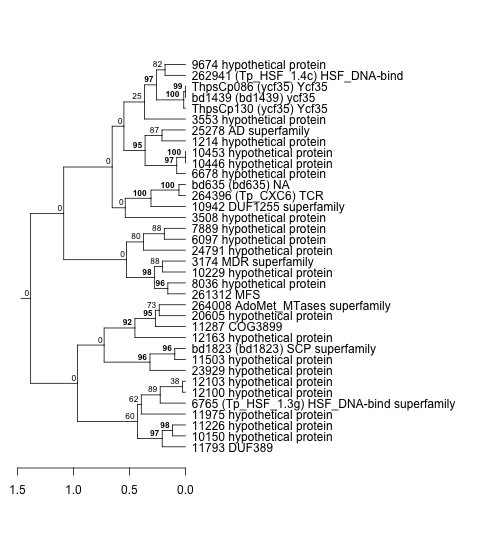
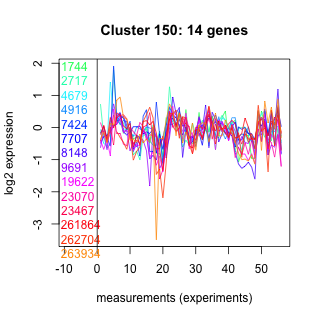
| Thaps_hclust_0150 |
 |
 |
0.16 |
0.73 |
6.8 |
lowFe_KTKB_Day5 | 0.337000 | -0.236 |
| Title | Cluster Plot | Dendrogram | e-value | e-value | e-value | Condition | Condition FDR | Condition Difference |
|---|---|---|---|---|---|---|---|---|
| Thaps_hclust_0116 |
 |
 |
0.74 |
8.1 |
4.9 |
highpH_TMEVA | 0.174000 | -0.236 |
| Title | Cluster Plot | Dendrogram | e-value | e-value | e-value | Condition | Condition FDR | Condition Difference |
|---|---|---|---|---|---|---|---|---|
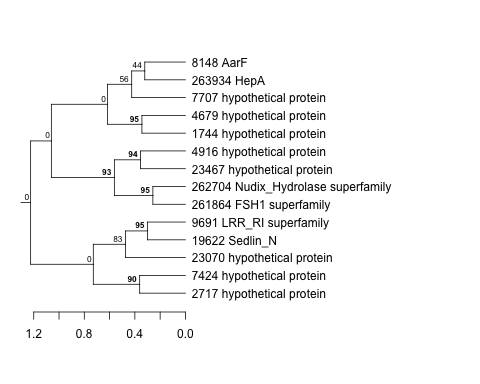
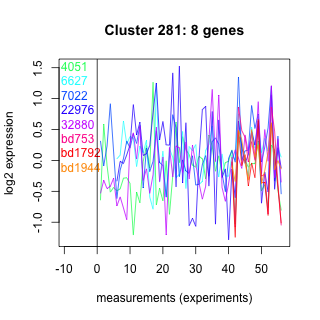
| Thaps_hclust_0281 |
 |
 |
0.0000064 |
0.00064 |
0.03 |
lowFe_KTKB_Day3 | 0.564000 | -0.236 |
| Title | Cluster Plot | Dendrogram | e-value | e-value | e-value | Condition | Condition FDR | Condition Difference |
|---|---|---|---|---|---|---|---|---|
| Thaps_hclust_0036 |
 |
 |
0.0000003 |
0.00016 |
110 |
co2_elevated_stat_arrays | 0.234000 | -0.236 |
| Title | Cluster Plot | Dendrogram | e-value | e-value | e-value | Condition | Condition FDR | Condition Difference |
|---|---|---|---|---|---|---|---|---|
| Thaps_hclust_0473 |
 |
 |
0.00036 |
0.0036 |
0.68 |
co2_elevated_stat_arrays | 0.254000 | -0.236 |
| Title | Cluster Plot | Dendrogram | e-value | e-value | e-value | Condition | Condition FDR | Condition Difference |
|---|---|---|---|---|---|---|---|---|
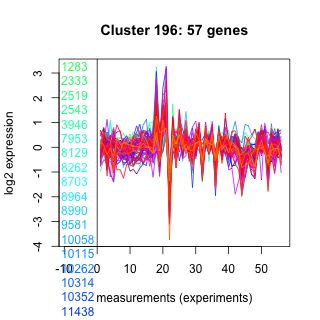
| Thaps_hclust_0196 |
 |
 |
0.0000000000000088 |
0.00000034 |
0.000017 |
diel_exponential_vs_stationary | 0.017700 | -0.235 |
| Title | Cluster Plot | Dendrogram | e-value | e-value | e-value | Condition | Condition FDR | Condition Difference |
|---|---|---|---|---|---|---|---|---|
| Thaps_hclust_0288 |
 |
 |
0.032 |
0.0067 |
0.047 |
diel_light_vs_dark | 0.357000 | -0.235 |
| Title | Cluster Plot | Dendrogram | e-value | e-value | e-value | Condition | Condition FDR | Condition Difference |
|---|---|---|---|---|---|---|---|---|
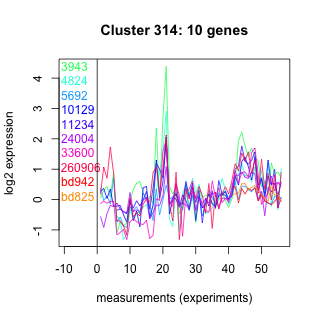
| Thaps_hclust_0314 |
 |
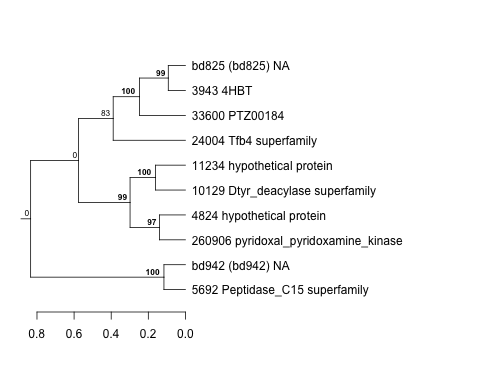 |
0.052 |
1.9 |
8.5 |
exponential_vs_stationary_24light | 0.614000 | -0.235 |
| Thaps_hclust_0314 |
|
|
0.052 |
1.9 |
8.5 |
diel_exponential_vs_stationary | 0.389000 | -0.225 |
| Title | Cluster Plot | Dendrogram | e-value | e-value | e-value | Condition | Condition FDR | Condition Difference |
|---|---|---|---|---|---|---|---|---|
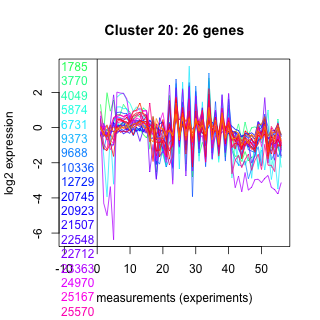
| Thaps_hclust_0020 |
 |
 |
0.004 |
0.15 |
3.3 |
lowFe_KTKB_Day3 | 0.272000 | -0.235 |
| Title | Cluster Plot | Dendrogram | e-value | e-value | e-value | Condition | Condition FDR | Condition Difference |
|---|---|---|---|---|---|---|---|---|
| Thaps_hclust_0005 |
 |
 |
0.00013 |
0.0027 |
2 |
lowtemp_TMEVA | 0.380000 | -0.235 |
| Title | Cluster Plot | Dendrogram | e-value | e-value | e-value | Condition | Condition FDR | Condition Difference |
|---|---|---|---|---|---|---|---|---|
| Thaps_hclust_0273 |
 |
 |
0.052 |
0.27 |
12 |
lowFe_KTKB_Day3 | 0.453000 | -0.234 |
| Thaps_hclust_0273 |
|
|
0.052 |
0.27 |
12 |
lowFe_KTKB_Day5 | 0.354000 | -0.234 |
| Title | Cluster Plot | Dendrogram | e-value | e-value | e-value | Condition | Condition FDR | Condition Difference |
|---|---|---|---|---|---|---|---|---|
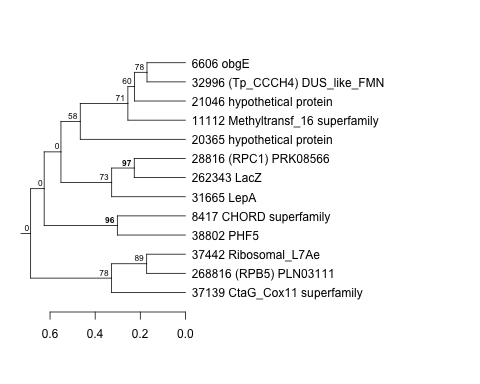
| Thaps_hclust_0445 |
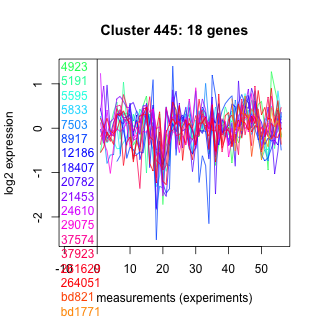 |
 |
0.000046 |
6.9 |
33 |
lowSi_TMEVA | 0.832000 | -0.234 |
| Title | Cluster Plot | Dendrogram | e-value | e-value | e-value | Condition | Condition FDR | Condition Difference |
|---|---|---|---|---|---|---|---|---|
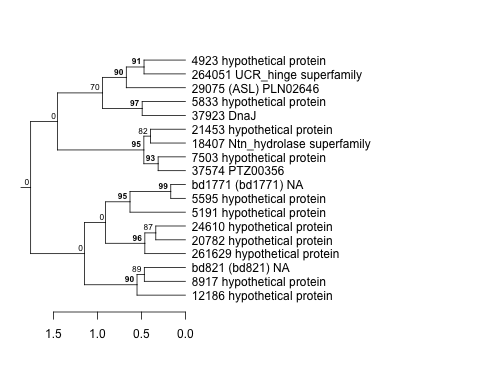
| Thaps_hclust_0400 |
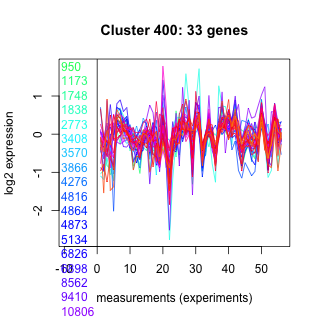 |
 |
Not available | Not available | Not available | highpH_TMEVA | 0.066100 | -0.234 |
| Title | Cluster Plot | Dendrogram | e-value | e-value | e-value | Condition | Condition FDR | Condition Difference |
|---|---|---|---|---|---|---|---|---|
| Thaps_hclust_0293 |
 |
 |
0.16 |
120 |
360 |
lowtemp_TMEVA | 0.363000 | -0.234 |
| Title | Cluster Plot | Dendrogram | e-value | e-value | e-value | Condition | Condition FDR | Condition Difference |
|---|---|---|---|---|---|---|---|---|
| Thaps_hclust_0336 |
 |
 |
8.7e-23 |
0.00000000000015 |
0.0000000000000032 |
highlight_arrays | 0.276000 | -0.234 |
| Title | Cluster Plot | Dendrogram | e-value | e-value | e-value | Condition | Condition FDR | Condition Difference |
|---|---|---|---|---|---|---|---|---|
| Thaps_hclust_0399 |
 |
 |
0.0039 |
0.16 |
0.0016 |
lowSi_TMEVA | 0.824000 | -0.234 |
| Title | Cluster Plot | Dendrogram | e-value | e-value | e-value | Condition | Condition FDR | Condition Difference |
|---|---|---|---|---|---|---|---|---|
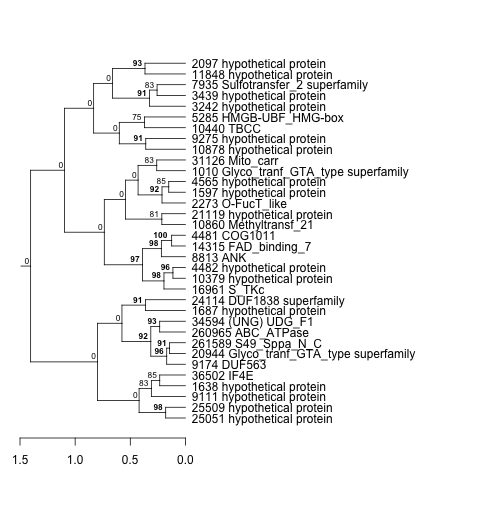
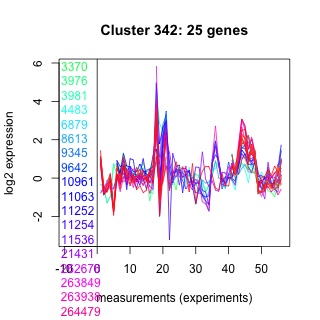
| Thaps_hclust_0342 |
 |
 |
5.79997e-41 |
2.7e-33 |
3.1e-31 |
exponential_vs_stationary_24light | 0.457000 | -0.234 |
| Thaps_hclust_0342 |
|
|
5.79997e-41 |
2.7e-33 |
3.1e-31 |
lowSi_TMEVA | 0.832000 | -0.226 |
| Title | Cluster Plot | Dendrogram | e-value | e-value | e-value | Condition | Condition FDR | Condition Difference |
|---|---|---|---|---|---|---|---|---|
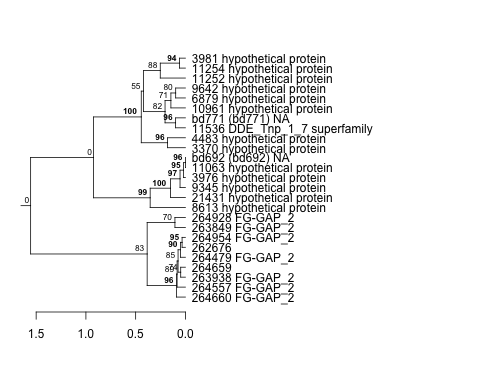
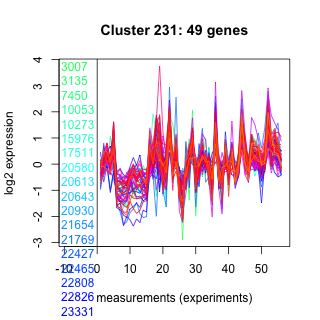
| Thaps_hclust_0231 |
 |
 |
9.5e-23 |
0.000000000000034 |
0.00000039 |
highpH_TMEVA | 0.027300 | -0.234 |
| Title | Cluster Plot | Dendrogram | e-value | e-value | e-value | Condition | Condition FDR | Condition Difference |
|---|---|---|---|---|---|---|---|---|
| Thaps_hclust_0156 |
 |
 |
0.00054 |
0.00071 |
0.0013 |
lowFe_TMEVA | 0.349000 | -0.233 |
| Title | Cluster Plot | Dendrogram | e-value | e-value | e-value | Condition | Condition FDR | Condition Difference |
|---|---|---|---|---|---|---|---|---|
| Thaps_hclust_0366 |
 |
 |
0.000011 |
0.054 |
0.47 |
lowSi_TMEVA | 0.827000 | -0.233 |
| Title | Cluster Plot | Dendrogram | e-value | e-value | e-value | Condition | Condition FDR | Condition Difference |
|---|---|---|---|---|---|---|---|---|
| Thaps_hclust_0258 |
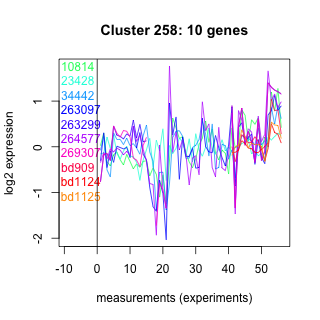 |
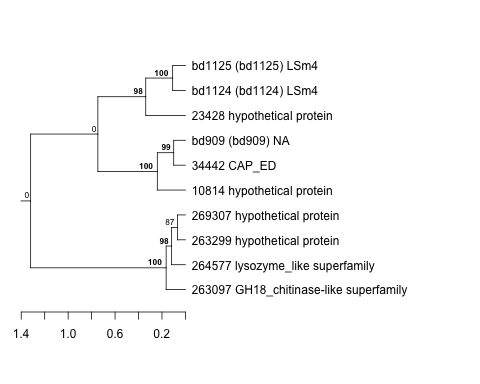 |
0.027 |
0.021 |
0.036 |
lowN_TMEVA | 0.605000 | -0.233 |
| Title | Cluster Plot | Dendrogram | e-value | e-value | e-value | Condition | Condition FDR | Condition Difference |
|---|---|---|---|---|---|---|---|---|
| Thaps_hclust_0426 |
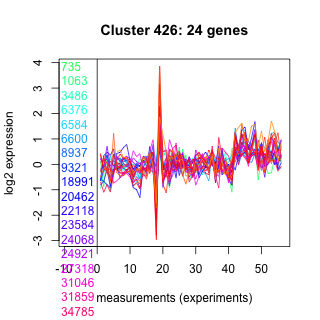 |
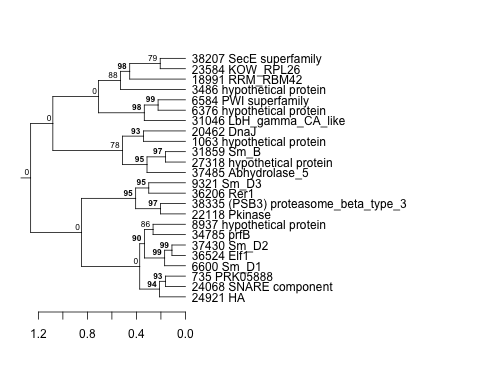 |
0.0000000000000021 |
0.00000000000026 |
0.000025 |
lowFe_TMEVA | 0.383000 | -0.233 |
| Title | Cluster Plot | Dendrogram | e-value | e-value | e-value | Condition | Condition FDR | Condition Difference |
|---|---|---|---|---|---|---|---|---|
| Thaps_hclust_0061 |
 |
 |
0.000000062 |
0.00063 |
0.032 |
lowSi_TMEVA | 0.838000 | -0.233 |
| Title | Cluster Plot | Dendrogram | e-value | e-value | e-value | Condition | Condition FDR | Condition Difference |
|---|---|---|---|---|---|---|---|---|
| Thaps_hclust_0405 |
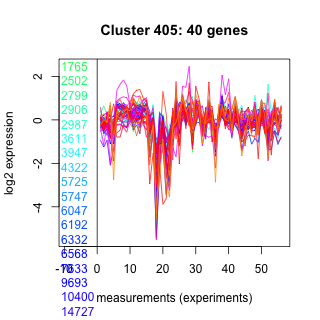 |
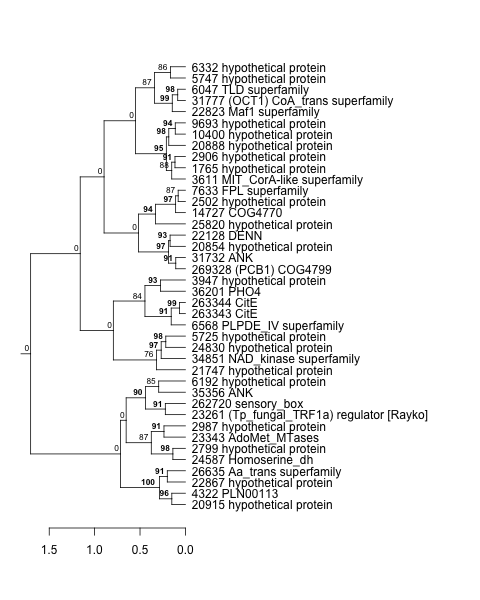 |
0.00000000036 |
0.0000000063 |
0.005 |
exponential_vs_stationary_24light | 0.365000 | -0.232 |
| Title | Cluster Plot | Dendrogram | e-value | e-value | e-value | Condition | Condition FDR | Condition Difference |
|---|---|---|---|---|---|---|---|---|
| Thaps_hclust_0337 |
 |
 |
3.5 |
3 |
280 |
lowSi_TMEVA | 0.839000 | -0.232 |
| Title | Cluster Plot | Dendrogram | e-value | e-value | e-value | Condition | Condition FDR | Condition Difference |
|---|---|---|---|---|---|---|---|---|
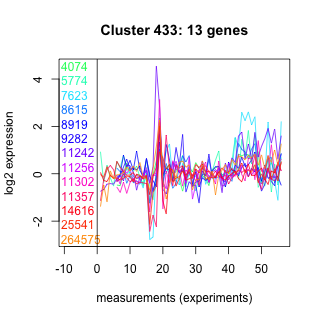
| Thaps_hclust_0433 |
 |
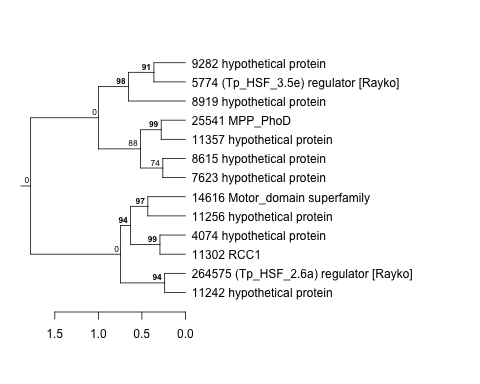 |
14 |
54 |
440 |
lowtemp_TMEVA | 0.455000 | -0.232 |
| Thaps_hclust_0433 |
|
|
14 |
54 |
440 |
exponential_vs_stationary_24light | 0.604000 | -0.226 |
| Title | Cluster Plot | Dendrogram | e-value | e-value | e-value | Condition | Condition FDR | Condition Difference |
|---|---|---|---|---|---|---|---|---|
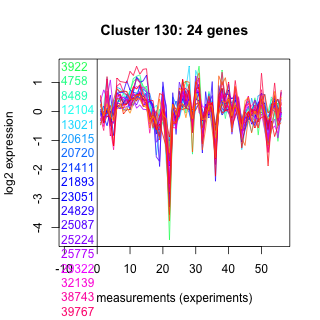
| Thaps_hclust_0130 |
 |
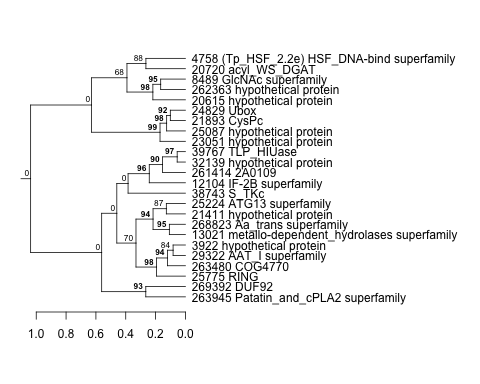 |
0.64 |
15 |
13 |
lowtemp_TMEVA | 0.336000 | -0.232 |
| Title | Cluster Plot | Dendrogram | e-value | e-value | e-value | Condition | Condition FDR | Condition Difference |
|---|---|---|---|---|---|---|---|---|
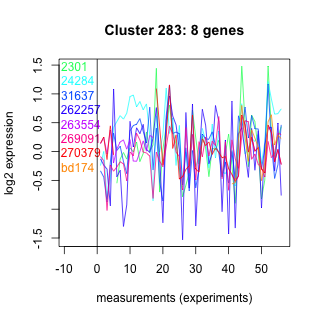
| Thaps_hclust_0283 |
 |
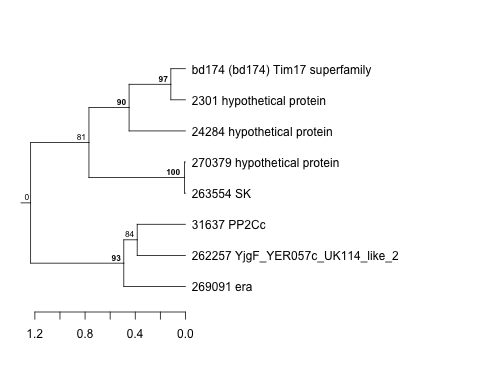 |
0.0022 |
0.0079 |
0.019 |
lowFe_KTKB_Day5 | 0.477000 | -0.232 |
| Title | Cluster Plot | Dendrogram | e-value | e-value | e-value | Condition | Condition FDR | Condition Difference |
|---|---|---|---|---|---|---|---|---|
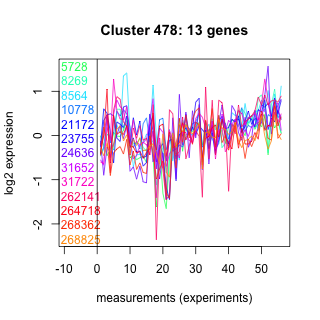
| Thaps_hclust_0478 |
 |
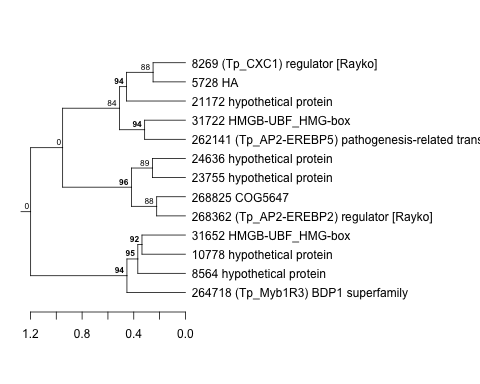 |
0.1 |
0.0096 |
3.5 |
highlight_arrays | 0.241000 | -0.231 |
| Title | Cluster Plot | Dendrogram | e-value | e-value | e-value | Condition | Condition FDR | Condition Difference |
|---|---|---|---|---|---|---|---|---|
| Thaps_hclust_0409 |
 |
 |
0.0000000066 |
0.0028 |
0.21 |
BaP | 0.245000 | -0.231 |
| Title | Cluster Plot | Dendrogram | e-value | e-value | e-value | Condition | Condition FDR | Condition Difference |
|---|---|---|---|---|---|---|---|---|
| Thaps_hclust_0214 |
 |
 |
0.00006 |
0.0000000031 |
0.00076 |
highlight_arrays | 0.018200 | -0.23 |
| Thaps_hclust_0214 |
|
|
0.00006 |
0.0000000031 |
0.00076 |
lowFe_KTKB_Day3 | 0.096300 | -0.227 |
| Title | Cluster Plot | Dendrogram | e-value | e-value | e-value | Condition | Condition FDR | Condition Difference |
|---|---|---|---|---|---|---|---|---|
| Thaps_hclust_0003 |
 |
 |
0.24 |
16 |
240 |
exponential_vs_stationary_24highlight | 0.042300 | -0.23 |
| Title | Cluster Plot | Dendrogram | e-value | e-value | e-value | Condition | Condition FDR | Condition Difference |
|---|---|---|---|---|---|---|---|---|
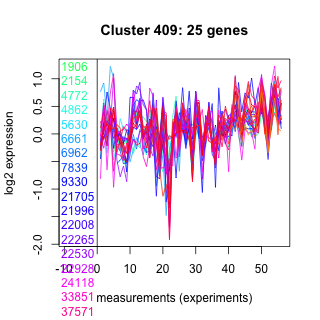
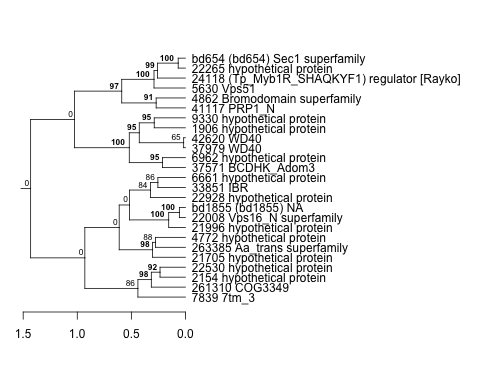
| Thaps_hclust_0370 |
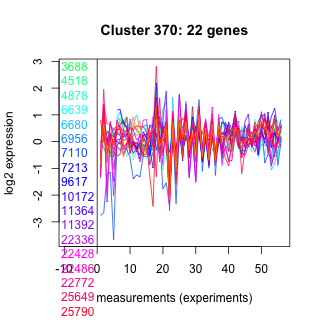 |
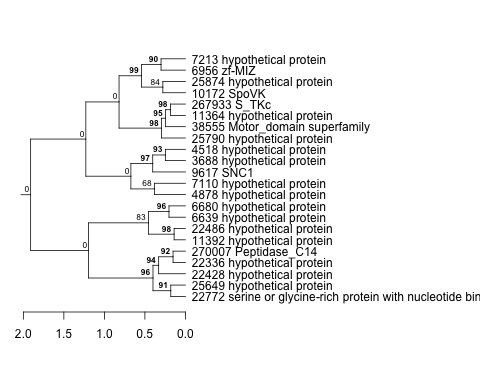 |
0.55 |
1 |
7 |
exponential_vs_stationary_24highlight | 0.021800 | -0.23 |
| Thaps_hclust_0370 |
|
|
0.55 |
1 |
7 |
co2_elevated_stat_arrays | 0.316000 | -0.227 |
| Title | Cluster Plot | Dendrogram | e-value | e-value | e-value | Condition | Condition FDR | Condition Difference |
|---|---|---|---|---|---|---|---|---|
| Thaps_hclust_0432 |
 |
 |
0.011 |
0.06 |
2.4 |
lowSi_TMEVA | 0.832000 | -0.23 |
| Title | Cluster Plot | Dendrogram | e-value | e-value | e-value | Condition | Condition FDR | Condition Difference |
|---|---|---|---|---|---|---|---|---|
| Thaps_hclust_0330 |
 |
 |
0.0000058 |
0.00000085 |
0.000041 |
lowFe_KTKB_Day5 | 0.156000 | -0.23 |
| Title | Cluster Plot | Dendrogram | e-value | e-value | e-value | Condition | Condition FDR | Condition Difference |
|---|---|---|---|---|---|---|---|---|
| Thaps_hclust_0285 |
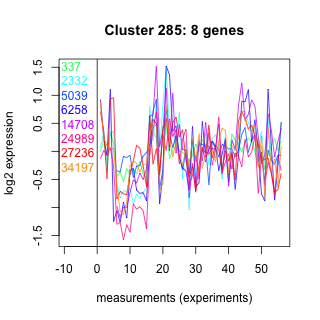 |
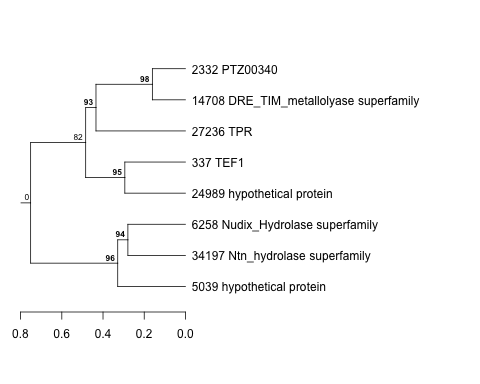 |
0.00019 |
0.057 |
5.9 |
exponential_vs_stationary_24light | 0.673000 | -0.23 |
| Title | Cluster Plot | Dendrogram | e-value | e-value | e-value | Condition | Condition FDR | Condition Difference |
|---|---|---|---|---|---|---|---|---|
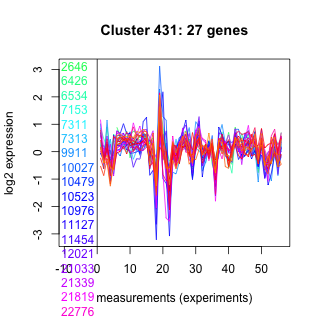
| Thaps_hclust_0431 |
 |
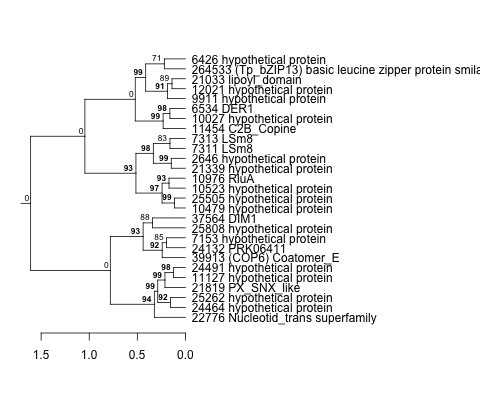 |
0.003 |
0.00095 |
0.0043 |
lowtemp_TMEVA | 0.297000 | -0.229 |
| Title | Cluster Plot | Dendrogram | e-value | e-value | e-value | Condition | Condition FDR | Condition Difference |
|---|---|---|---|---|---|---|---|---|
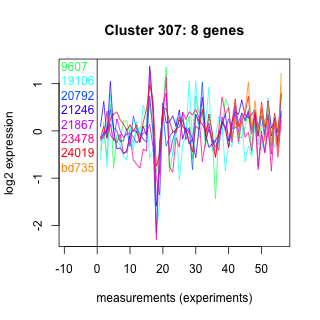
| Thaps_hclust_0307 |
 |
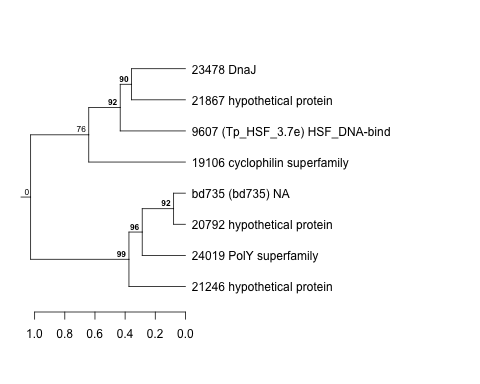 |
46 |
50 |
580 |
highpH_TMEVA | 0.344000 | -0.229 |
| Title | Cluster Plot | Dendrogram | e-value | e-value | e-value | Condition | Condition FDR | Condition Difference |
|---|---|---|---|---|---|---|---|---|
| Thaps_hclust_0126 |
 |
 |
0.025 |
1.3 |
0.6 |
co2_elevated_stat_arrays | 0.311000 | -0.229 |
| Thaps_hclust_0126 |
|
|
0.025 |
1.3 |
0.6 |
exponential_vs_stationary_24highlight | 0.023100 | -0.226 |
| Title | Cluster Plot | Dendrogram | e-value | e-value | e-value | Condition | Condition FDR | Condition Difference |
|---|---|---|---|---|---|---|---|---|
| Thaps_hclust_0408 |
 |
 |
0.3 |
4.9 |
5.3 |
lowtemp_TMEVA | 0.380000 | -0.229 |
| Title | Cluster Plot | Dendrogram | e-value | e-value | e-value | Condition | Condition FDR | Condition Difference |
|---|---|---|---|---|---|---|---|---|
| Thaps_hclust_0104 |
 |
 |
23 |
24 |
220 |
exponential_vs_stationary_24light | 0.626000 | -0.228 |
| Title | Cluster Plot | Dendrogram | e-value | e-value | e-value | Condition | Condition FDR | Condition Difference |
|---|---|---|---|---|---|---|---|---|
| Thaps_hclust_0344 |
 |
 |
7.9 |
94 |
120 |
lowtemp_TMEVA | 0.380000 | -0.228 |
| Title | Cluster Plot | Dendrogram | e-value | e-value | e-value | Condition | Condition FDR | Condition Difference |
|---|---|---|---|---|---|---|---|---|
| Thaps_hclust_0272 |
 |
 |
0.0048 |
0.01 |
0.059 |
highpH_TMEVA | 0.151000 | -0.228 |
| Title | Cluster Plot | Dendrogram | e-value | e-value | e-value | Condition | Condition FDR | Condition Difference |
|---|---|---|---|---|---|---|---|---|
| Thaps_hclust_0335 |
 |
 |
0.0000000032 |
0.000001 |
0.019 |
lowFe_KTKB_Day3 | 0.213000 | -0.228 |
| Thaps_hclust_0335 |
|
|
0.0000000032 |
0.000001 |
0.019 |
lowSi_TMEVA | 0.832000 | -0.227 |
| Title | Cluster Plot | Dendrogram | e-value | e-value | e-value | Condition | Condition FDR | Condition Difference |
|---|---|---|---|---|---|---|---|---|
| Thaps_hclust_0477 |
 |
 |
0.02 |
0.011 |
0.071 |
BaP | 0.562000 | -0.228 |
| Title | Cluster Plot | Dendrogram | e-value | e-value | e-value | Condition | Condition FDR | Condition Difference |
|---|---|---|---|---|---|---|---|---|
| Thaps_hclust_0081 |
 |
 |
0.000000001 |
0.000000000027 |
0.28 |
diel_exponential_vs_stationary | 0.124000 | -0.227 |
| Title | Cluster Plot | Dendrogram | e-value | e-value | e-value | Condition | Condition FDR | Condition Difference |
|---|---|---|---|---|---|---|---|---|
| Thaps_hclust_0080 |
 |
 |
0.000037 |
0.000075 |
0.96 |
highlight_arrays | 0.142000 | -0.227 |
| Title | Cluster Plot | Dendrogram | e-value | e-value | e-value | Condition | Condition FDR | Condition Difference |
|---|---|---|---|---|---|---|---|---|
| Thaps_hclust_0019 |
 |
 |
0.0000001 |
0.00000017 |
0.000037 |
lowSi_TMEVA | 0.832000 | -0.227 |
| Title | Cluster Plot | Dendrogram | e-value | e-value | e-value | Condition | Condition FDR | Condition Difference |
|---|---|---|---|---|---|---|---|---|
| Thaps_hclust_0470 |
 |
 |
0.0000048 |
0.00021 |
0.086 |
lowSi_TMEVA | 0.838000 | -0.227 |
| Title | Cluster Plot | Dendrogram | e-value | e-value | e-value | Condition | Condition FDR | Condition Difference |
|---|---|---|---|---|---|---|---|---|
| Thaps_hclust_0358 |
 |
 |
0.18 |
390 |
1700 |
lowFe_TMEVA | 0.436000 | -0.227 |
| Title | Cluster Plot | Dendrogram | e-value | e-value | e-value | Condition | Condition FDR | Condition Difference |
|---|---|---|---|---|---|---|---|---|
| Thaps_hclust_0089 |
 |
 |
0.000036 |
0.00054 |
0.075 |
lowSi_TMEVA | 0.838000 | -0.227 |
| Title | Cluster Plot | Dendrogram | e-value | e-value | e-value | Condition | Condition FDR | Condition Difference |
|---|---|---|---|---|---|---|---|---|
| Thaps_hclust_0165 |
 |
 |
0.00011 |
2.3 |
3.9 |
lowN_TMEVA | 0.564000 | -0.227 |
| Thaps_hclust_0165 |
|
|
0.00011 |
2.3 |
3.9 |
highpH_TMEVA | 0.189000 | -0.226 |
| Title | Cluster Plot | Dendrogram | e-value | e-value | e-value | Condition | Condition FDR | Condition Difference |
|---|---|---|---|---|---|---|---|---|
| Thaps_hclust_0023 |
 |
 |
0.000000000039 |
0.0000072 |
0.002 |
BaP | 0.192000 | -0.227 |
| Title | Cluster Plot | Dendrogram | e-value | e-value | e-value | Condition | Condition FDR | Condition Difference |
|---|---|---|---|---|---|---|---|---|
| Thaps_hclust_0153 |
 |
 |
0.0000021 |
0.0049 |
0.015 |
lowFe_KTKB_Day5 | 0.234000 | -0.227 |
| Title | Cluster Plot | Dendrogram | e-value | e-value | e-value | Condition | Condition FDR | Condition Difference |
|---|---|---|---|---|---|---|---|---|
| Thaps_hclust_0194 |
 |
 |
0.27 |
0.6 |
1.5 |
lowN_TMEVA | 0.542000 | -0.226 |
| Title | Cluster Plot | Dendrogram | e-value | e-value | e-value | Condition | Condition FDR | Condition Difference |
|---|---|---|---|---|---|---|---|---|
| Thaps_hclust_0489 |
 |
 |
0.00024 |
0.0048 |
0.027 |
highpH_TMEVA | 0.113000 | -0.226 |
| Title | Cluster Plot | Dendrogram | e-value | e-value | e-value | Condition | Condition FDR | Condition Difference |
|---|---|---|---|---|---|---|---|---|
| Thaps_hclust_0083 |
 |
 |
0.0039 |
6.3 |
14 |
co2_elevated_stat_arrays | 0.361000 | -0.226 |
| Title | Cluster Plot | Dendrogram | e-value | e-value | e-value | Condition | Condition FDR | Condition Difference |
|---|---|---|---|---|---|---|---|---|
| Thaps_hclust_0221 |
 |
|
|
1e-37 |
0.0000000000012 |
diel_exponential_vs_stationary | 0.004250 | -0.226 |
| Title | Cluster Plot | Dendrogram | e-value | e-value | e-value | Condition | Condition FDR | Condition Difference |
|---|---|---|---|---|---|---|---|---|
| Thaps_hclust_0137 |
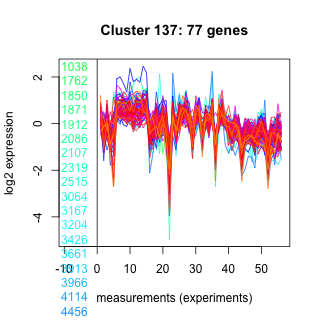 |
|
2.3e-18 |
0.00000000000062 |
0.000025 |
lowFe_KTKB_Day5 | 0.023600 | -0.226 |
| Title | Cluster Plot | Dendrogram | e-value | e-value | e-value | Condition | Condition FDR | Condition Difference |
|---|---|---|---|---|---|---|---|---|
| Thaps_hclust_0253 |
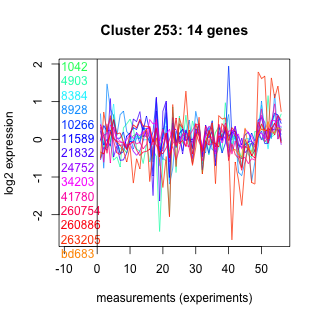 |
 |
1.5 |
61 |
370 |
diel_exponential_vs_stationary | 0.311000 | -0.226 |
| Title | Cluster Plot | Dendrogram | e-value | e-value | e-value | Condition | Condition FDR | Condition Difference |
|---|---|---|---|---|---|---|---|---|
| Thaps_hclust_0043 |
 |
 |
3.9e-18 |
0.0000000053 |
2 |
lowFe_TMEVA | 0.331000 | -0.225 |
| Title | Cluster Plot | Dendrogram | e-value | e-value | e-value | Condition | Condition FDR | Condition Difference |
|---|---|---|---|---|---|---|---|---|
| Thaps_hclust_0049 |
 |
 |
0.00054 |
0.0063 |
0.03 |
lowFe_TMEVA | 0.370000 | -0.225 |
| Title | Cluster Plot | Dendrogram | e-value | e-value | e-value | Condition | Condition FDR | Condition Difference |
|---|---|---|---|---|---|---|---|---|
| Thaps_hclust_0403 |
 |
 |
0.83 |
0.015 |
0.016 |
highpH_TMEVA | 0.174000 | -0.224 |
| Title | Cluster Plot | Dendrogram | e-value | e-value | e-value | Condition | Condition FDR | Condition Difference |
|---|---|---|---|---|---|---|---|---|
| Thaps_hclust_0148 |
 |
 |
4.7 |
39 |
51 |
diel_light_vs_dark | 0.307000 | -0.224 |
| Title | Cluster Plot | Dendrogram | e-value | e-value | e-value | Condition | Condition FDR | Condition Difference |
|---|---|---|---|---|---|---|---|---|
| Thaps_hclust_0374 |
 |
 |
1.4 |
19 |
50 |
lowFe_KTKB_Day3 | 0.458000 | -0.224 |
| Title | Cluster Plot | Dendrogram | e-value | e-value | e-value | Condition | Condition FDR | Condition Difference |
|---|---|---|---|---|---|---|---|---|
| Thaps_hclust_0013 |
 |
 |
0.000000021 |
0.00018 |
0.025 |
co2_elevated_stat_arrays | 0.281000 | -0.224 |
| Title | Cluster Plot | Dendrogram | e-value | e-value | e-value | Condition | Condition FDR | Condition Difference |
|---|---|---|---|---|---|---|---|---|
| Thaps_hclust_0447 |
 |
 |
0.0005 |
0.0031 |
0.0041 |
lowN_TMEVA | 0.503000 | -0.224 |
| Title | Cluster Plot | Dendrogram | e-value | e-value | e-value | Condition | Condition FDR | Condition Difference |
|---|---|---|---|---|---|---|---|---|
| Thaps_hclust_0024 |
 |
|
2.8e-19 |
1.2e-20 |
0.00000000000043 |
highpH_TMEVA | 0.008490 | -0.223 |
| Title | Cluster Plot | Dendrogram | e-value | e-value | e-value | Condition | Condition FDR | Condition Difference |
|---|---|---|---|---|---|---|---|---|
| Thaps_hclust_0324 |
 |
 |
0.0023 |
2.4 |
5.1 |
BaP | 0.357000 | -0.223 |
| Title | Cluster Plot | Dendrogram | e-value | e-value | e-value | Condition | Condition FDR | Condition Difference |
|---|---|---|---|---|---|---|---|---|
| Thaps_hclust_0386 |
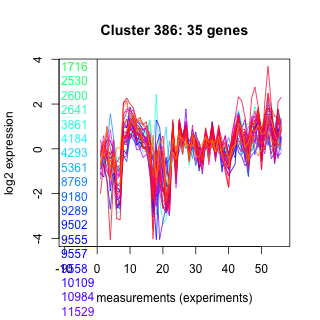 |
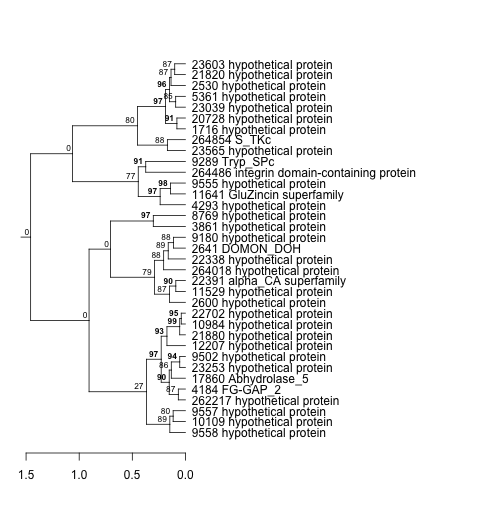 |
0.00000064 |
0.00000005 |
0.00054 |
lowN_TMEVA | 0.477000 | -0.223 |