Hierarchical Clusters
Displaying 1101 - 1200 of 7500
| Title | Cluster Plot | Dendrogram | e-value | e-value | e-value | Condition | Condition FDR | Condition Difference |
|---|---|---|---|---|---|---|---|---|
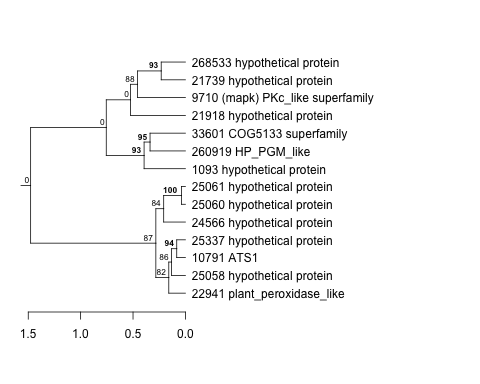
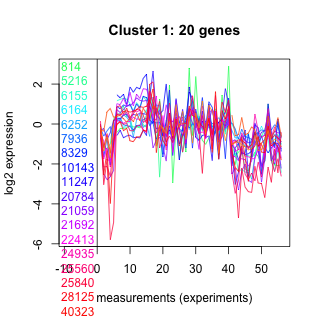
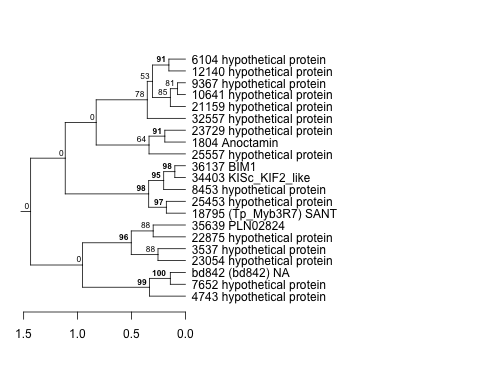
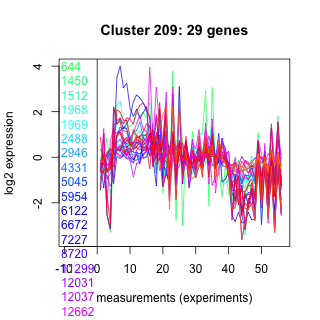
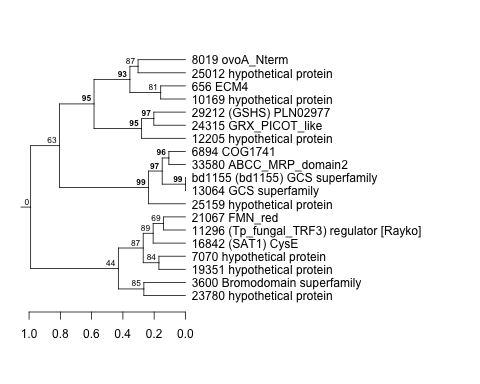
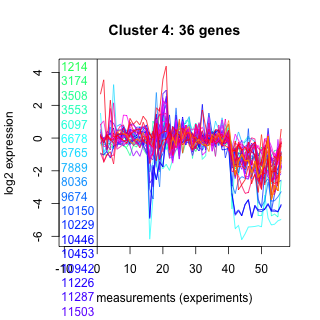
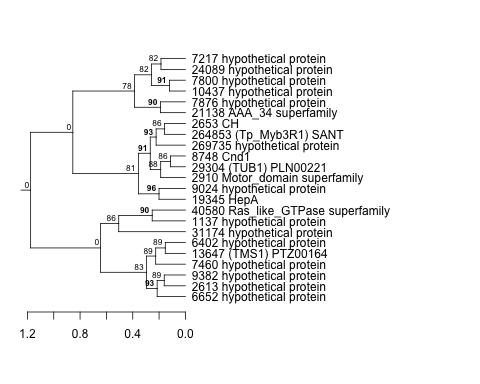
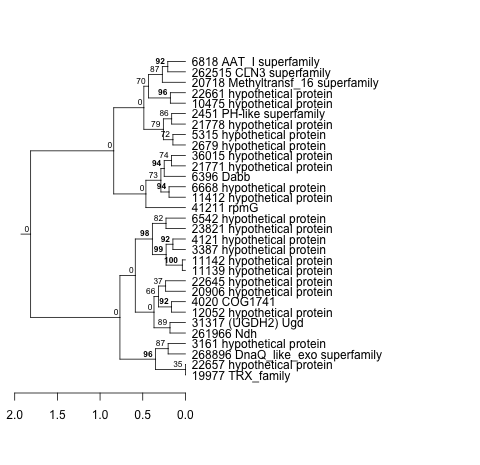
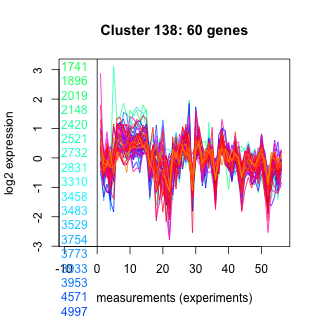
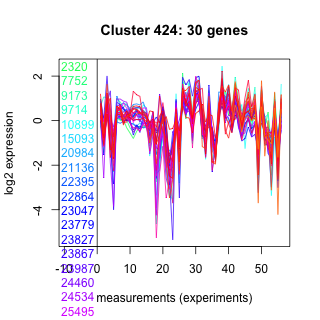
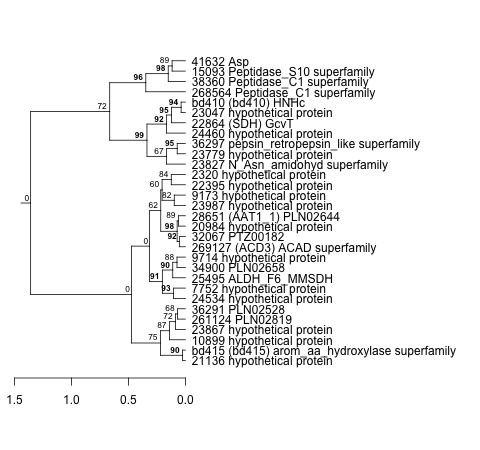
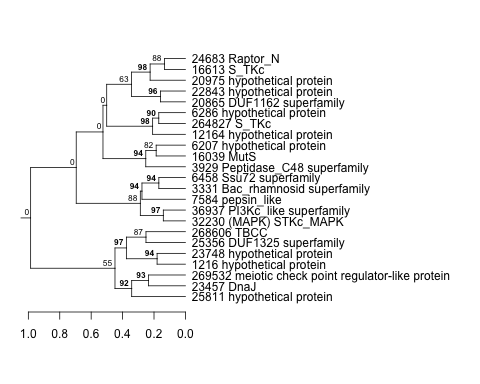
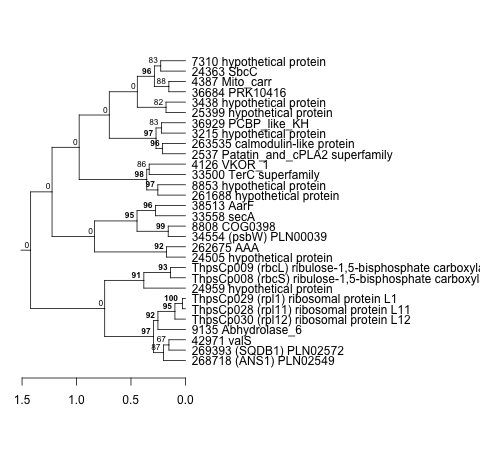
| Thaps_hclust_0082 |
 |
|
8.89825e-43 |
2e-27 |
1.3e-16 |
lowSi_TMEVA | 0.001350 | -1.03 |
| Thaps_hclust_0082 |
|
|
8.89825e-43 |
2e-27 |
1.3e-16 |
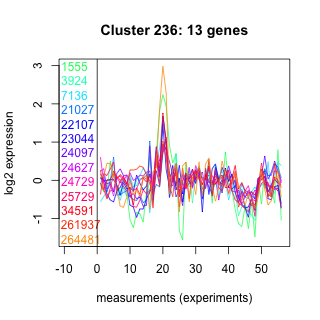
co2_elevated_expo_arrays | 0.001390 | 1.09 |
| Title | Cluster Plot | Dendrogram | e-value | e-value | e-value | Condition | Condition FDR | Condition Difference |
|---|---|---|---|---|---|---|---|---|
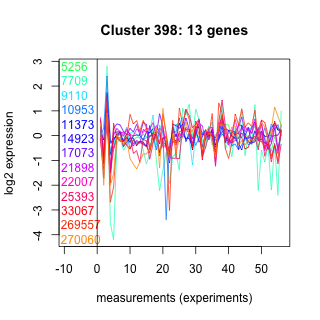
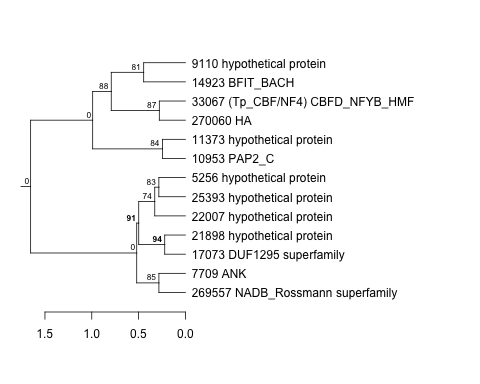
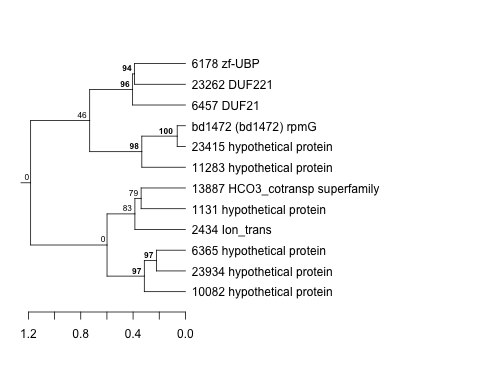
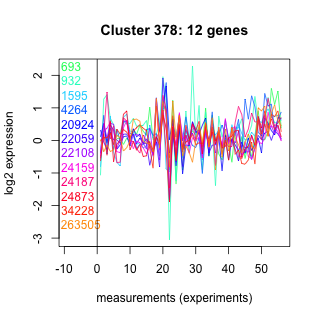
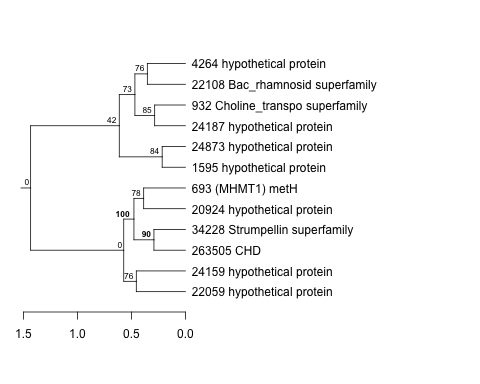
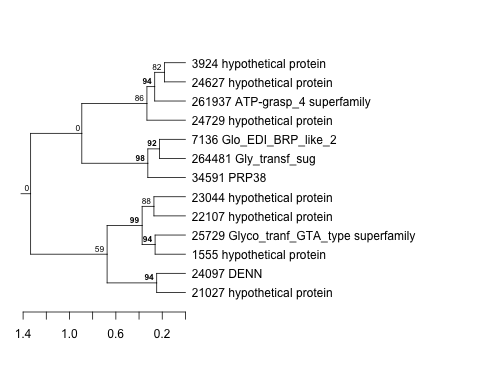
| Thaps_hclust_0398 |
 |
 |
0.014 |
0.28 |
1.2 |
lowSi_TMEVA | 0.001350 | -1.42 |
| Title | Cluster Plot | Dendrogram | e-value | e-value | e-value | Condition | Condition FDR | Condition Difference |
|---|---|---|---|---|---|---|---|---|
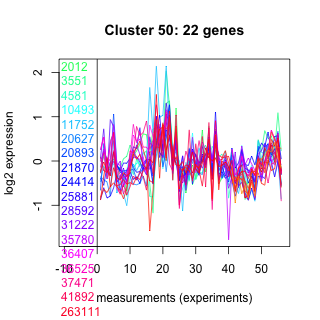
| Thaps_hclust_0014 |
 |
 |
Not available | Not available | Not available | lowSi_TMEVA | 0.001350 | -1.3 |
| Thaps_hclust_0014 |
|
|
Not available | Not available | Not available | co2_elevated_expo_arrays | 0.001390 | 0.294 |
| Title | Cluster Plot | Dendrogram | e-value | e-value | e-value | Condition | Condition FDR | Condition Difference |
|---|---|---|---|---|---|---|---|---|
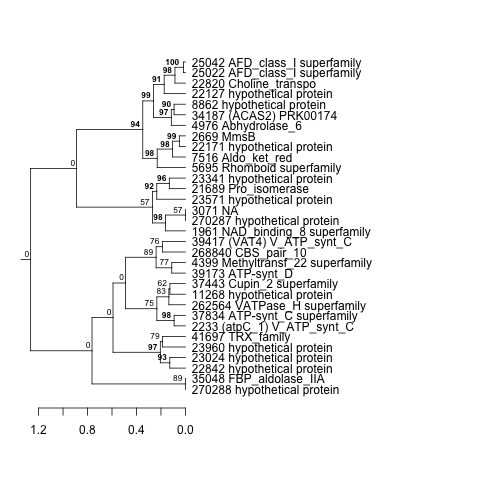
| Thaps_hclust_0022 |
 |
|
1.9e-31 |
2.4e-22 |
6.4e-20 |
lowSi_TMEVA | 0.001350 | -4.7 |
| Thaps_hclust_0022 |
|
|
1.9e-31 |
2.4e-22 |
6.4e-20 |
co2_elevated_expo_arrays | 0.001390 | -0.333 |
| Title | Cluster Plot | Dendrogram | e-value | e-value | e-value | Condition | Condition FDR | Condition Difference |
|---|---|---|---|---|---|---|---|---|
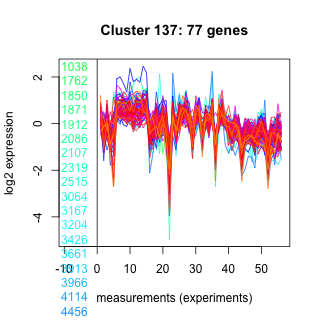
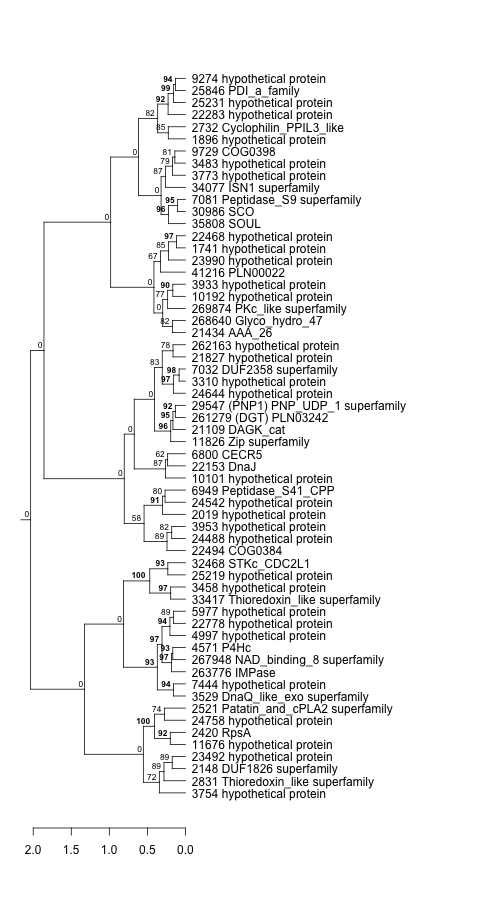
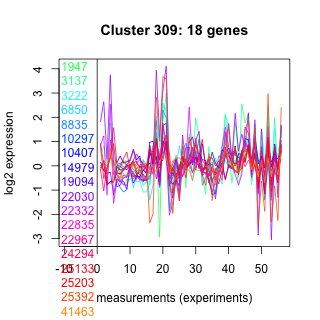
| Thaps_hclust_0137 |
 |
|
2.3e-18 |
0.00000000000062 |
0.000025 |
lowSi_TMEVA | 0.001350 | -0.578 |
| Title | Cluster Plot | Dendrogram | e-value | e-value | e-value | Condition | Condition FDR | Condition Difference |
|---|---|---|---|---|---|---|---|---|
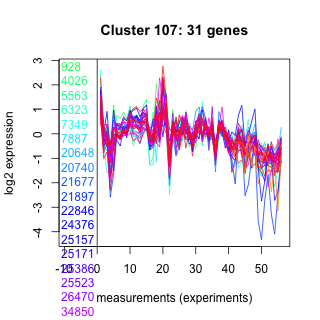
| Thaps_hclust_0107 |
 |
 |
0.00000004 |
0.000000023 |
0.0054 |
lowSi_TMEVA | 0.001350 | -1.12 |
| Title | Cluster Plot | Dendrogram | e-value | e-value | e-value | Condition | Condition FDR | Condition Difference |
|---|---|---|---|---|---|---|---|---|
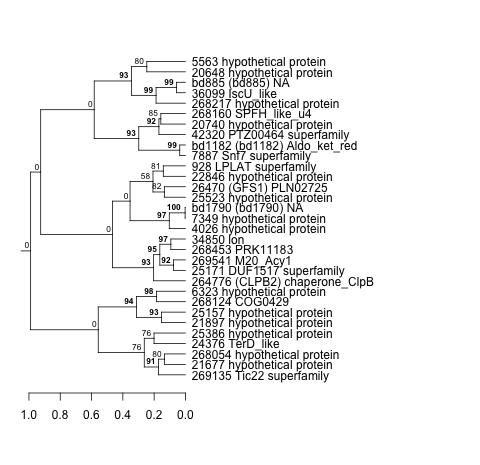
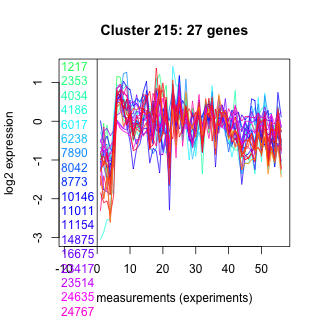
| Thaps_hclust_0215 |
 |
 |
0.000036 |
0.0000076 |
0.000057 |
lowSi_TMEVA | 0.001350 | -1.45 |
| Title | Cluster Plot | Dendrogram | e-value | e-value | e-value | Condition | Condition FDR | Condition Difference |
|---|---|---|---|---|---|---|---|---|
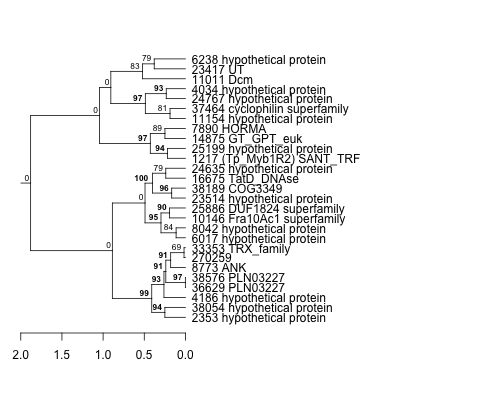
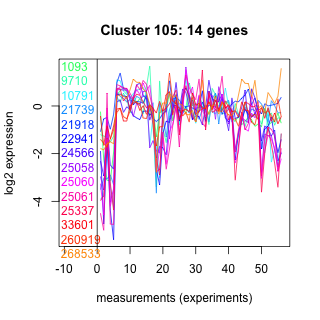
| Thaps_hclust_0105 |
 |
 |
49 |
0.074 |
21 |
lowSi_TMEVA | 0.001350 | -2.82 |
| Title | Cluster Plot | Dendrogram | e-value | e-value | e-value | Condition | Condition FDR | Condition Difference |
|---|---|---|---|---|---|---|---|---|
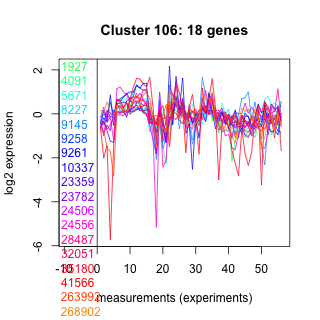
| Thaps_hclust_0001 |
 |
 |
0.0033 |
0.052 |
2 |
lowSi_TMEVA | 0.001350 | -1.92 |
| Title | Cluster Plot | Dendrogram | e-value | e-value | e-value | Condition | Condition FDR | Condition Difference |
|---|---|---|---|---|---|---|---|---|
| Thaps_hclust_0012 |
 |
 |
0.000000000019 |
0.0000000000016 |
0.0000013 |
lowSi_TMEVA | 0.001350 | -1.91 |
| Title | Cluster Plot | Dendrogram | e-value | e-value | e-value | Condition | Condition FDR | Condition Difference |
|---|---|---|---|---|---|---|---|---|
| Thaps_hclust_0360 |
 |
 |
0.0000000013 |
0.0000000052 |
0.0000016 |
lowSi_TMEVA | 0.001350 | -1.29 |
| Thaps_hclust_0360 |
|
|
0.0000000013 |
0.0000000052 |
0.0000016 |
co2_elevated_expo_arrays | 0.001390 | -0.469 |
| Title | Cluster Plot | Dendrogram | e-value | e-value | e-value | Condition | Condition FDR | Condition Difference |
|---|---|---|---|---|---|---|---|---|
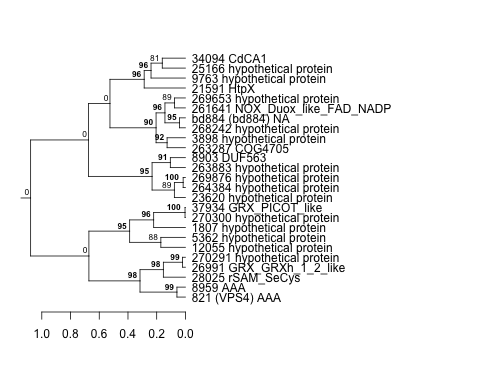
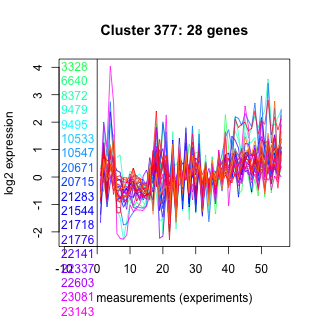
| Thaps_hclust_0377 |
 |
 |
0.00016 |
0.034 |
0.95 |
lowSi_TMEVA | 0.001350 | 0.932 |
| Title | Cluster Plot | Dendrogram | e-value | e-value | e-value | Condition | Condition FDR | Condition Difference |
|---|---|---|---|---|---|---|---|---|
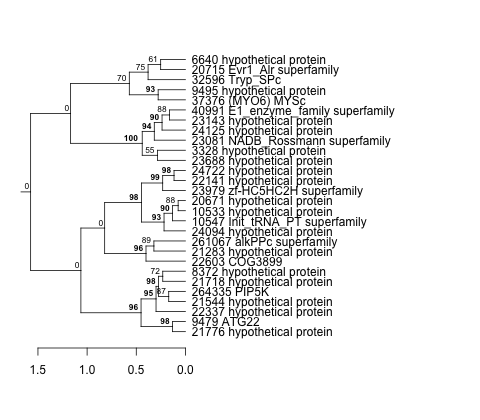
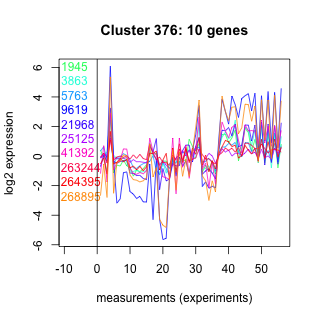
| Thaps_hclust_0376 |
 |
 |
0.42 |
3.3 |
2.4 |
lowSi_TMEVA | 0.001350 | 2.82 |
| Title | Cluster Plot | Dendrogram | e-value | e-value | e-value | Condition | Condition FDR | Condition Difference |
|---|---|---|---|---|---|---|---|---|
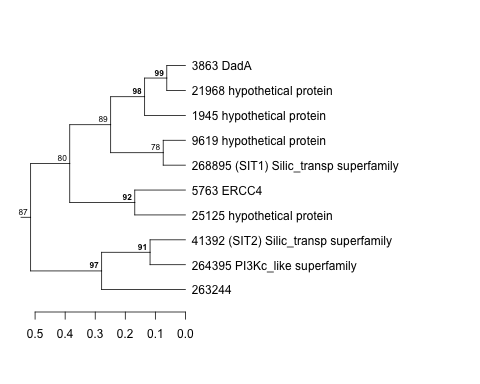
| Thaps_hclust_0094 |
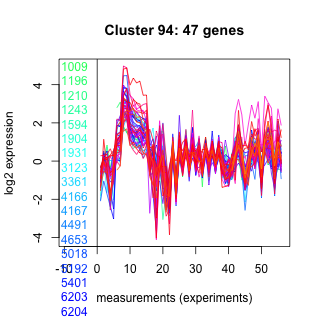 |
 |
0.0000000025 |
0.000014 |
0.0000045 |
lowSi_TMEVA | 0.001350 | -0.996 |
| Thaps_hclust_0094 |
|
|
0.0000000025 |
0.000014 |
0.0000045 |
co2_elevated_expo_arrays | 0.001390 | 0.699 |
| Title | Cluster Plot | Dendrogram | e-value | e-value | e-value | Condition | Condition FDR | Condition Difference |
|---|---|---|---|---|---|---|---|---|
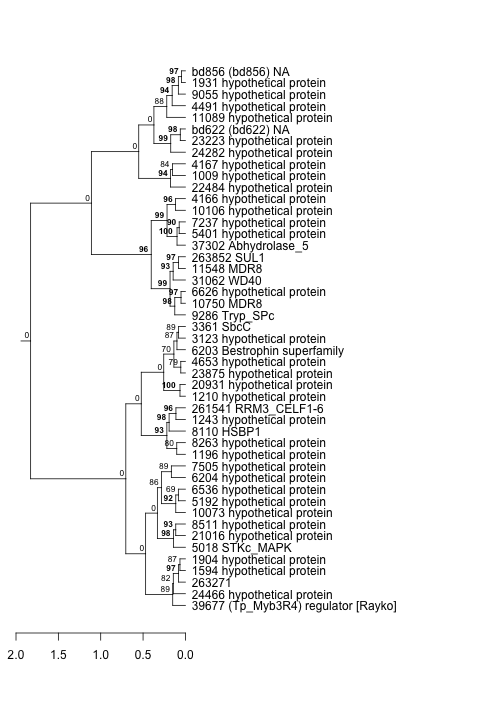
| Thaps_hclust_0211 |
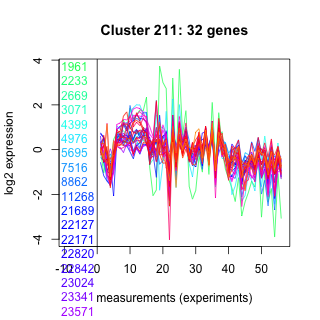 |
 |
0.000000055 |
0.00014 |
0.026 |
lowSi_TMEVA | 0.001350 | -0.976 |
| Title | Cluster Plot | Dendrogram | e-value | e-value | e-value | Condition | Condition FDR | Condition Difference |
|---|---|---|---|---|---|---|---|---|
| Thaps_hclust_0446 |
 |
 |
0.0000045 |
0.018 |
0.021 |
lowSi_TMEVA | 0.001350 | -1.25 |
| Title | Cluster Plot | Dendrogram | e-value | e-value | e-value | Condition | Condition FDR | Condition Difference |
|---|---|---|---|---|---|---|---|---|
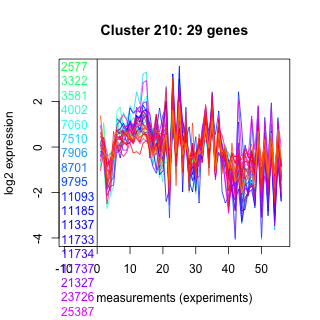
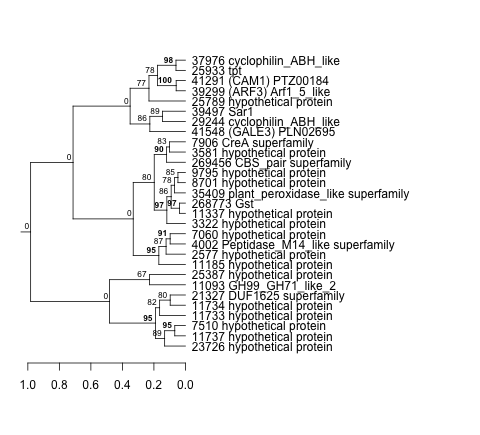
| Thaps_hclust_0210 |
 |
 |
0.0000000000046 |
0.0000033 |
0.086 |
lowSi_TMEVA | 0.001350 | -1.17 |
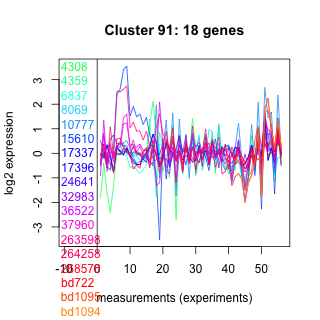
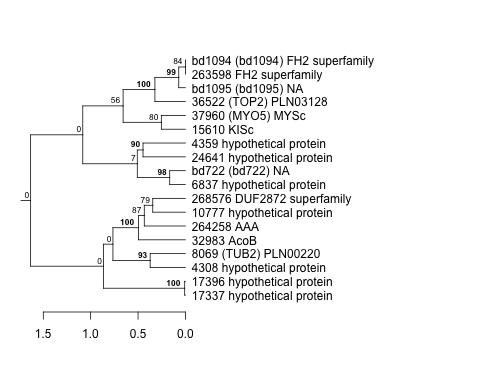
| Title | Cluster Plot | Dendrogram | e-value | e-value | e-value | Condition | Condition FDR | Condition Difference |
|---|---|---|---|---|---|---|---|---|
| Thaps_hclust_0092 |
 |
|
1.3e-37 |
4.2e-20 |
0.0000000000000013 |
lowSi_TMEVA | 0.001350 | -1.05 |
| Thaps_hclust_0092 |
|
|
1.3e-37 |
4.2e-20 |
0.0000000000000013 |
co2_elevated_expo_arrays | 0.001390 | 1.11 |
| Title | Cluster Plot | Dendrogram | e-value | e-value | e-value | Condition | Condition FDR | Condition Difference |
|---|---|---|---|---|---|---|---|---|
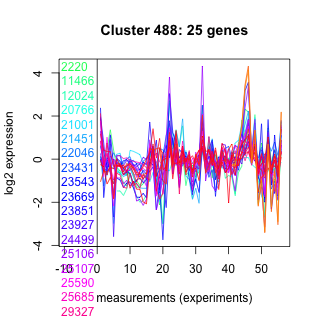
| Thaps_hclust_0488 |
 |
 |
0.15 |
0.012 |
0.2 |
diel_light_vs_dark | 0.001360 | -0.527 |
| Thaps_hclust_0488 |
|
|
0.15 |
0.012 |
0.2 |
co2_elevated_expo_arrays | 0.001390 | -0.337 |
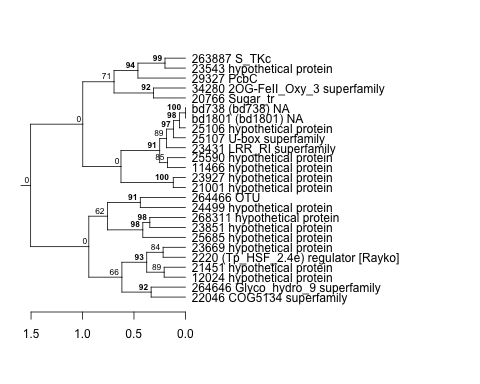
| Title | Cluster Plot | Dendrogram | e-value | e-value | e-value | Condition | Condition FDR | Condition Difference |
|---|---|---|---|---|---|---|---|---|
| Thaps_hclust_0417 |
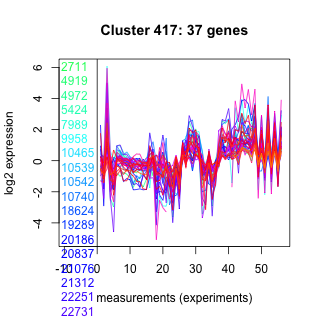 |
 |
0.0000000018 |
0.00013 |
0.00029 |
diel_light_vs_dark | 0.001360 | -0.428 |
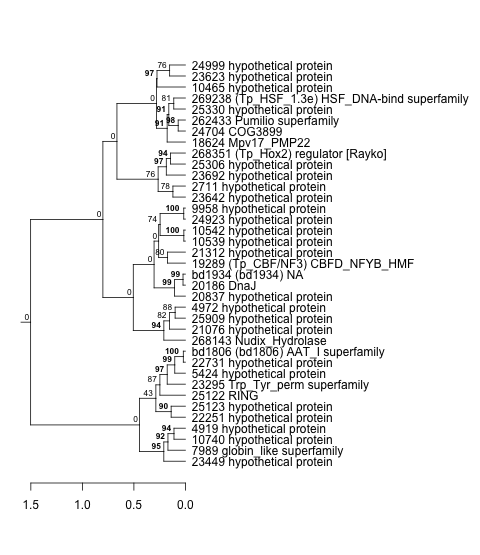
| Title | Cluster Plot | Dendrogram | e-value | e-value | e-value | Condition | Condition FDR | Condition Difference |
|---|---|---|---|---|---|---|---|---|
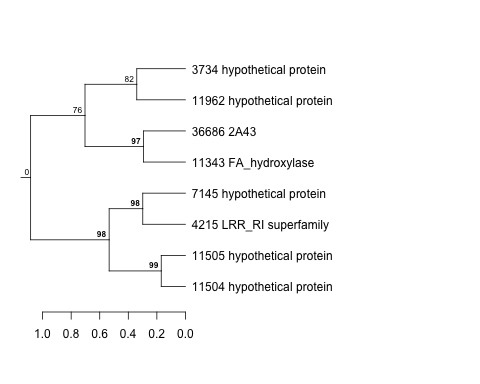
| Thaps_hclust_0080 |
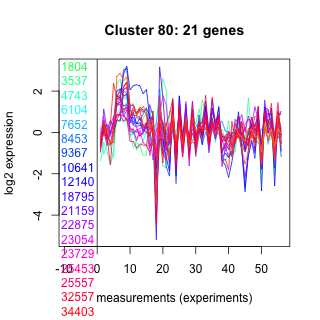 |
 |
0.000037 |
0.000075 |
0.96 |
highpH_TMEVA | 0.001370 | -0.496 |
| Thaps_hclust_0080 |
|
|
0.000037 |
0.000075 |
0.96 |
co2_elevated_expo_arrays | 0.001390 | 0.588 |
| Title | Cluster Plot | Dendrogram | e-value | e-value | e-value | Condition | Condition FDR | Condition Difference |
|---|---|---|---|---|---|---|---|---|
| Thaps_hclust_0485 |
 |
 |
0.0012 |
0.0078 |
0.16 |
highpH_TMEVA | 0.001370 | 0.323 |
| Thaps_hclust_0485 |
|
|
0.0012 |
0.0078 |
0.16 |
co2_elevated_expo_arrays | 0.001390 | -0.314 |
| Title | Cluster Plot | Dendrogram | e-value | e-value | e-value | Condition | Condition FDR | Condition Difference |
|---|---|---|---|---|---|---|---|---|
| Thaps_hclust_0209 |
 |
 |
1.2e-16 |
0.00011 |
0.000027 |
highpH_TMEVA | 0.001370 | -0.425 |
| Title | Cluster Plot | Dendrogram | e-value | e-value | e-value | Condition | Condition FDR | Condition Difference |
|---|---|---|---|---|---|---|---|---|
| Thaps_hclust_0221 |
 |
|
|
1e-37 |
0.0000000000012 |
highpH_TMEVA | 0.001370 | -0.241 |
| Title | Cluster Plot | Dendrogram | e-value | e-value | e-value | Condition | Condition FDR | Condition Difference |
|---|---|---|---|---|---|---|---|---|
| Thaps_hclust_0085 |
 |
 |
0.000012 |
0.0024 |
0.37 |
co2_elevated_expo_arrays | 0.001390 | 0.345 |
| Title | Cluster Plot | Dendrogram | e-value | e-value | e-value | Condition | Condition FDR | Condition Difference |
|---|---|---|---|---|---|---|---|---|
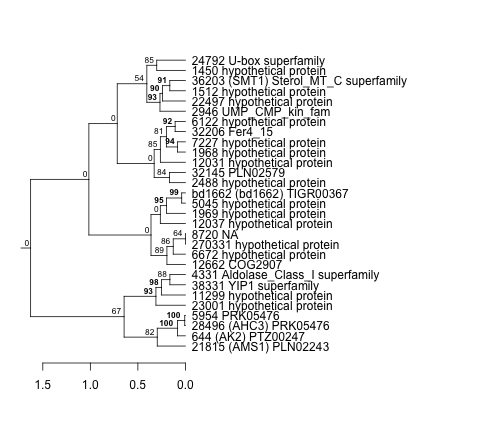
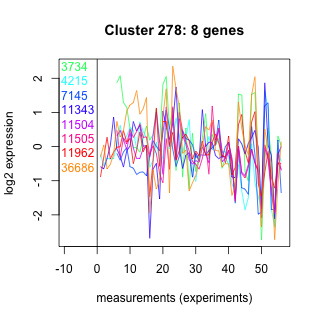
| Thaps_hclust_0278 |
 |
 |
0.093 |
0.57 |
39 |
co2_elevated_expo_arrays | 0.001390 | 1.15 |
| Title | Cluster Plot | Dendrogram | e-value | e-value | e-value | Condition | Condition FDR | Condition Difference |
|---|---|---|---|---|---|---|---|---|
| Thaps_hclust_0384 |
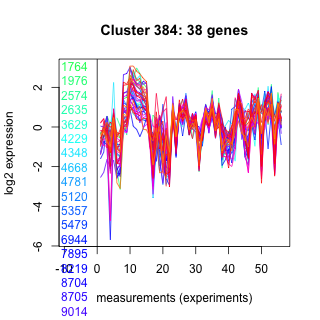 |
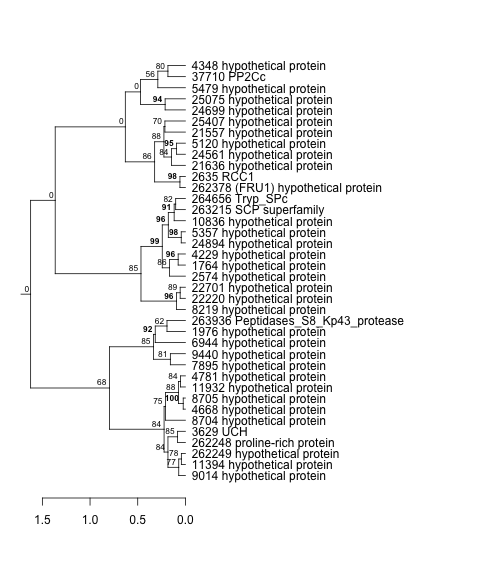 |
0.0000000074 |
0.000000031 |
0.12 |
co2_elevated_expo_arrays | 0.001390 | 0.582 |
| Title | Cluster Plot | Dendrogram | e-value | e-value | e-value | Condition | Condition FDR | Condition Difference |
|---|---|---|---|---|---|---|---|---|
| Thaps_hclust_0313 |
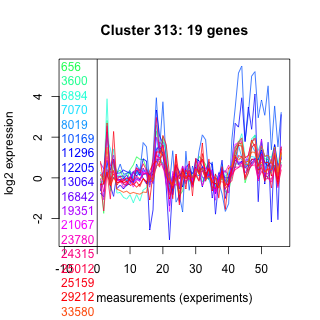 |
 |
0.00000043 |
0.00014 |
0.00078 |
co2_elevated_expo_arrays | 0.001390 | 0.384 |
| Title | Cluster Plot | Dendrogram | e-value | e-value | e-value | Condition | Condition FDR | Condition Difference |
|---|---|---|---|---|---|---|---|---|
| Thaps_hclust_0004 |
 |
 |
0.000000074 |
0.0000031 |
0.0000044 |
co2_elevated_expo_arrays | 0.001390 | 0.349 |
| Title | Cluster Plot | Dendrogram | e-value | e-value | e-value | Condition | Condition FDR | Condition Difference |
|---|---|---|---|---|---|---|---|---|
| Thaps_hclust_0076 |
 |
 |
0.0047 |
0.13 |
1.2 |
co2_elevated_expo_arrays | 0.001390 | 0.324 |
| Title | Cluster Plot | Dendrogram | e-value | e-value | e-value | Condition | Condition FDR | Condition Difference |
|---|---|---|---|---|---|---|---|---|
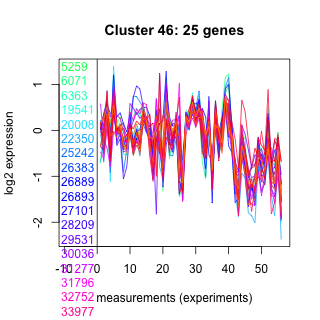
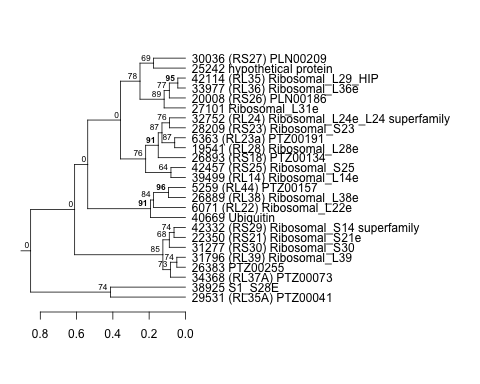
| Thaps_hclust_0047 |
 |
 |
3.4e-21 |
3.4e-17 |
5.5e-19 |
co2_elevated_expo_arrays | 0.001390 | -0.332 |
| Title | Cluster Plot | Dendrogram | e-value | e-value | e-value | Condition | Condition FDR | Condition Difference |
|---|---|---|---|---|---|---|---|---|
| Thaps_hclust_0081 |
 |
 |
0.000000001 |
0.000000000027 |
0.28 |
co2_elevated_expo_arrays | 0.001390 | 0.536 |
| Title | Cluster Plot | Dendrogram | e-value | e-value | e-value | Condition | Condition FDR | Condition Difference |
|---|---|---|---|---|---|---|---|---|
| Thaps_hclust_0486 |
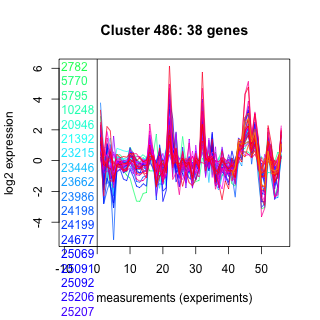 |
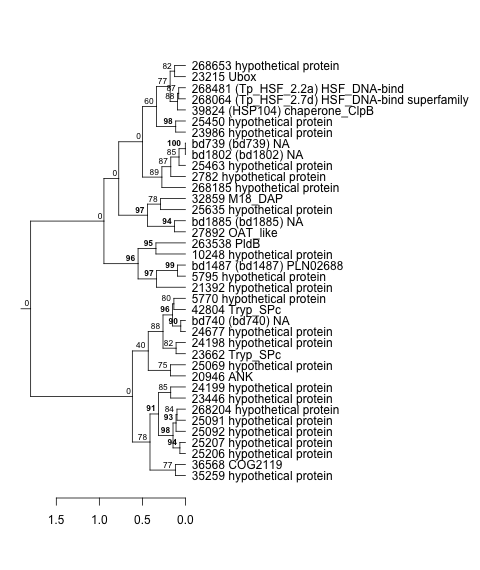 |
0.000000043 |
0.044 |
0.047 |
co2_elevated_expo_arrays | 0.001390 | -0.559 |
| Title | Cluster Plot | Dendrogram | e-value | e-value | e-value | Condition | Condition FDR | Condition Difference |
|---|---|---|---|---|---|---|---|---|
| Thaps_hclust_0003 |
 |
 |
0.24 |
16 |
240 |
co2_elevated_expo_arrays | 0.001390 | 0.419 |
| Title | Cluster Plot | Dendrogram | e-value | e-value | e-value | Condition | Condition FDR | Condition Difference |
|---|---|---|---|---|---|---|---|---|
| Thaps_hclust_0046 |
 |
 |
0.00000051 |
0.000067 |
0.29 |
co2_elevated_expo_arrays | 0.001390 | -0.411 |
| Title | Cluster Plot | Dendrogram | e-value | e-value | e-value | Condition | Condition FDR | Condition Difference |
|---|---|---|---|---|---|---|---|---|
| Thaps_hclust_0097 |
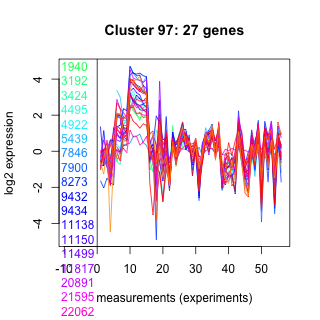 |
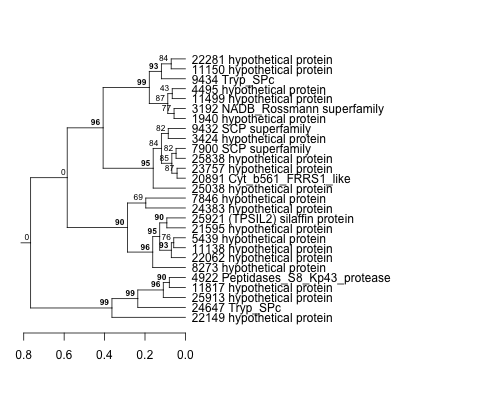 |
0.02 |
1.4 |
3.4 |
co2_elevated_expo_arrays | 0.001390 | 0.796 |
| Thaps_hclust_0097 |
|
|
0.02 |
1.4 |
3.4 |
highlight_arrays | 0.001570 | -0.403 |
| Title | Cluster Plot | Dendrogram | e-value | e-value | e-value | Condition | Condition FDR | Condition Difference |
|---|---|---|---|---|---|---|---|---|
| Thaps_hclust_0079 |
 |
 |
0.00048 |
0.000048 |
0.27 |
co2_elevated_expo_arrays | 0.001390 | 0.553 |
| Title | Cluster Plot | Dendrogram | e-value | e-value | e-value | Condition | Condition FDR | Condition Difference |
|---|---|---|---|---|---|---|---|---|
| Thaps_hclust_0484 |
 |
 |
0.024 |
0.26 |
5.1 |
co2_elevated_expo_arrays | 0.001390 | -0.501 |
| Thaps_hclust_0484 |
|
|
0.024 |
0.26 |
5.1 |
highpH_TMEVA | 0.001970 | 0.465 |
| Title | Cluster Plot | Dendrogram | e-value | e-value | e-value | Condition | Condition FDR | Condition Difference |
|---|---|---|---|---|---|---|---|---|
| Thaps_hclust_0040 |
 |
 |
1.8e-29 |
0.000000000042 |
0.00000000063 |
co2_elevated_expo_arrays | 0.001390 | 0.817 |
| Title | Cluster Plot | Dendrogram | e-value | e-value | e-value | Condition | Condition FDR | Condition Difference |
|---|---|---|---|---|---|---|---|---|
| Thaps_hclust_0065 |
 |
 |
1.5e-32 |
2.5e-32 |
9.9e-33 |
co2_elevated_expo_arrays | 0.001390 | 0.337 |
| Title | Cluster Plot | Dendrogram | e-value | e-value | e-value | Condition | Condition FDR | Condition Difference |
|---|---|---|---|---|---|---|---|---|
| Thaps_hclust_0063 |
 |
 |
9.8e-19 |
5.7e-17 |
8.2e-17 |
co2_elevated_expo_arrays | 0.001390 | 0.552 |
| Thaps_hclust_0063 |
|
|
9.8e-19 |
5.7e-17 |
8.2e-17 |
lowtemp_TMEVA | 0.001430 | 0.847 |
| Title | Cluster Plot | Dendrogram | e-value | e-value | e-value | Condition | Condition FDR | Condition Difference |
|---|---|---|---|---|---|---|---|---|
| Thaps_hclust_0463 |
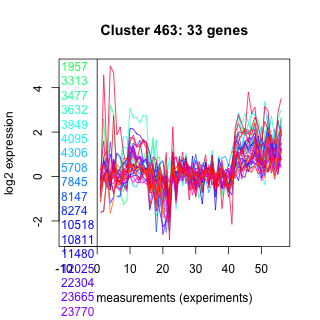 |
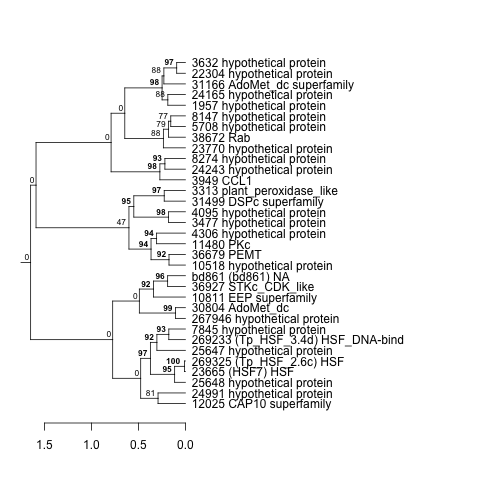 |
0.0000000063 |
0.000000075 |
0.78 |
co2_elevated_expo_arrays | 0.001390 | 0.306 |
| Thaps_hclust_0463 |
|
|
0.0000000063 |
0.000000075 |
0.78 |
BaP | 0.001910 | -0.524 |
| Title | Cluster Plot | Dendrogram | e-value | e-value | e-value | Condition | Condition FDR | Condition Difference |
|---|---|---|---|---|---|---|---|---|
| Thaps_hclust_0321 |
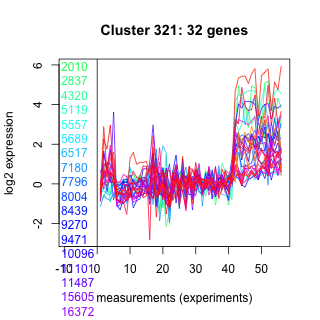 |
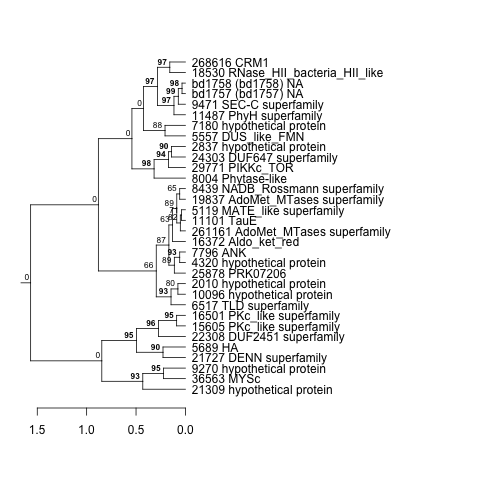 |
0.000000086 |
0.0000000042 |
0.0000028 |
co2_elevated_expo_arrays | 0.001390 | 0.674 |
| Thaps_hclust_0321 |
|
|
0.000000086 |
0.0000000042 |
0.0000028 |
lowFe_TMEVA | 0.002000 | 0.632 |
| Title | Cluster Plot | Dendrogram | e-value | e-value | e-value | Condition | Condition FDR | Condition Difference |
|---|---|---|---|---|---|---|---|---|
| Thaps_hclust_0062 |
 |
 |
0.000000026 |
0.000000021 |
0.000000000021 |
co2_elevated_expo_arrays | 0.001390 | 0.718 |
| Title | Cluster Plot | Dendrogram | e-value | e-value | e-value | Condition | Condition FDR | Condition Difference |
|---|---|---|---|---|---|---|---|---|
| Thaps_hclust_0091 |
 |
 |
0.00000061 |
0.00022 |
0.44 |
co2_elevated_expo_arrays | 0.001390 | 0.65 |
| Title | Cluster Plot | Dendrogram | e-value | e-value | e-value | Condition | Condition FDR | Condition Difference |
|---|---|---|---|---|---|---|---|---|
| Thaps_hclust_0496 |
 |
 |
0.00082 |
0.0031 |
0.43 |
co2_elevated_expo_arrays | 0.001390 | -0.54 |
| Title | Cluster Plot | Dendrogram | e-value | e-value | e-value | Condition | Condition FDR | Condition Difference |
|---|---|---|---|---|---|---|---|---|
| Thaps_hclust_0117 |
 |
 |
0.0000000000002 |
0.000000021 |
0.00000045 |
co2_elevated_expo_arrays | 0.001390 | 0.788 |
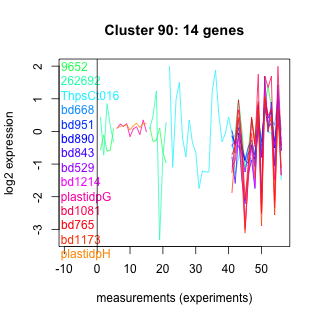
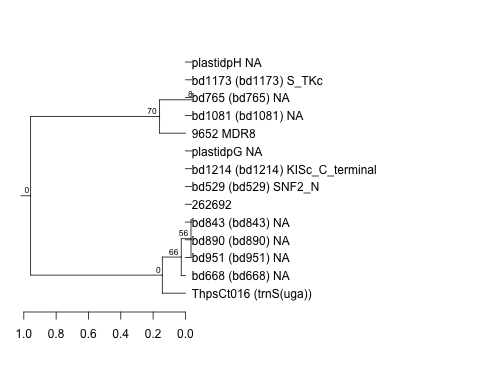
| Title | Cluster Plot | Dendrogram | e-value | e-value | e-value | Condition | Condition FDR | Condition Difference |
|---|---|---|---|---|---|---|---|---|
| Thaps_hclust_0090 |
 |
 |
0.23 |
2.7 |
11 |
co2_elevated_expo_arrays | 0.001390 | 0.773 |
| Title | Cluster Plot | Dendrogram | e-value | e-value | e-value | Condition | Condition FDR | Condition Difference |
|---|---|---|---|---|---|---|---|---|
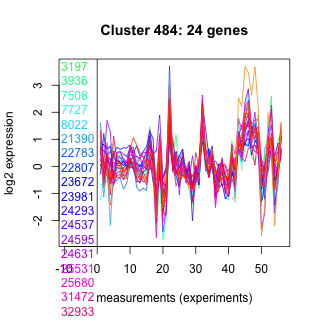
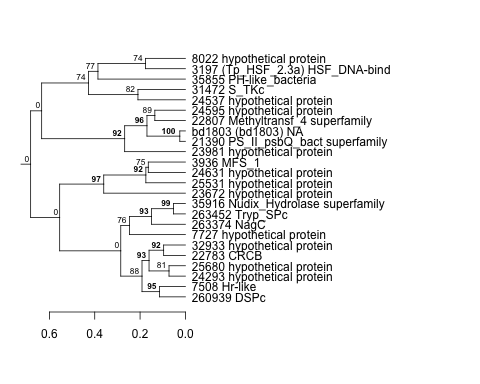
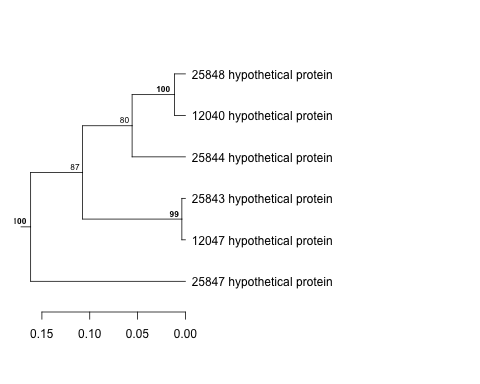
| Thaps_hclust_0495 |
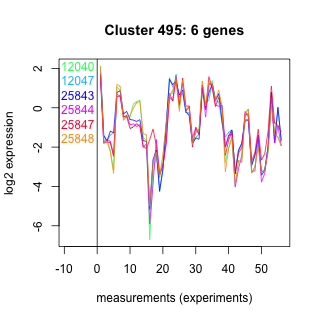 |
 |
0.0000000031 |
0.00000049 |
0.0000038 |
co2_elevated_expo_arrays | 0.001390 | -1.69 |
| Thaps_hclust_0495 |
|
|
0.0000000031 |
0.00000049 |
0.0000038 |
lowFe_TMEVA | 0.002000 | -1.62 |
| Title | Cluster Plot | Dendrogram | e-value | e-value | e-value | Condition | Condition FDR | Condition Difference |
|---|---|---|---|---|---|---|---|---|
| Thaps_hclust_0300 |
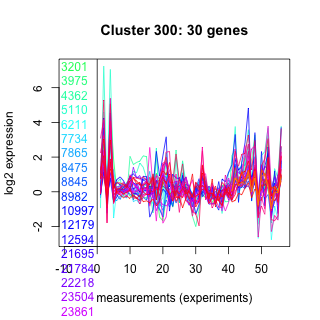 |
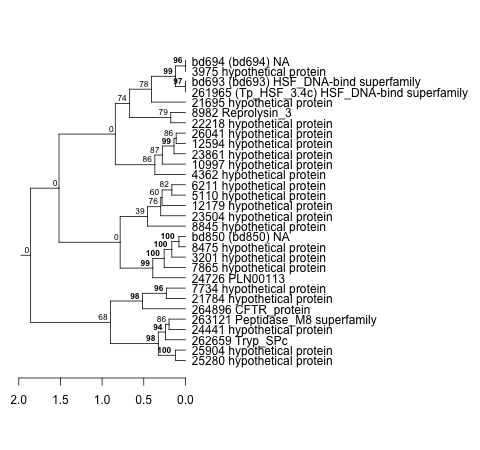 |
0.05 |
11 |
3.8 |
co2_elevated_expo_arrays | 0.001390 | 0.384 |
| Title | Cluster Plot | Dendrogram | e-value | e-value | e-value | Condition | Condition FDR | Condition Difference |
|---|---|---|---|---|---|---|---|---|
| Thaps_hclust_0086 |
 |
 |
0.0000000068 |
0.01 |
0.0037 |
co2_elevated_expo_arrays | 0.001390 | 0.384 |
| Title | Cluster Plot | Dendrogram | e-value | e-value | e-value | Condition | Condition FDR | Condition Difference |
|---|---|---|---|---|---|---|---|---|
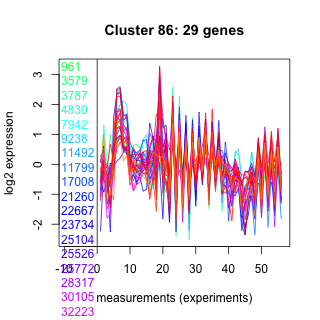
| Thaps_hclust_0340 |
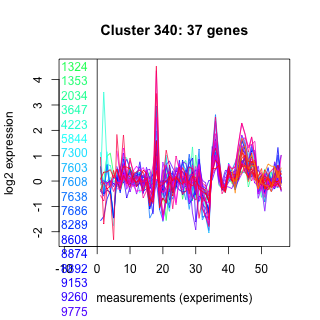 |
 |
0.00000000039 |
0.0000000031 |
0.0000002 |
lowtemp_TMEVA | 0.001430 | -0.584 |
| Title | Cluster Plot | Dendrogram | e-value | e-value | e-value | Condition | Condition FDR | Condition Difference |
|---|---|---|---|---|---|---|---|---|
| Thaps_hclust_0265 |
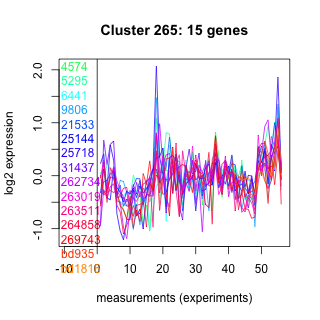 |
 |
0.02 |
0.000051 |
27 |
highlight_arrays | 0.001570 | -0.558 |
| Title | Cluster Plot | Dendrogram | e-value | e-value | e-value | Condition | Condition FDR | Condition Difference |
|---|---|---|---|---|---|---|---|---|
| Thaps_hclust_0494 |
 |
 |
6.7 |
15 |
60 |
highlight_arrays | 0.001570 | 0.468 |
| Title | Cluster Plot | Dendrogram | e-value | e-value | e-value | Condition | Condition FDR | Condition Difference |
|---|---|---|---|---|---|---|---|---|
| Thaps_hclust_0084 |
 |
 |
0.0000000000035 |
0.00000025 |
0.12 |
highlight_arrays | 0.001570 | -0.437 |
| Title | Cluster Plot | Dendrogram | e-value | e-value | e-value | Condition | Condition FDR | Condition Difference |
|---|---|---|---|---|---|---|---|---|
| Thaps_hclust_0381 |
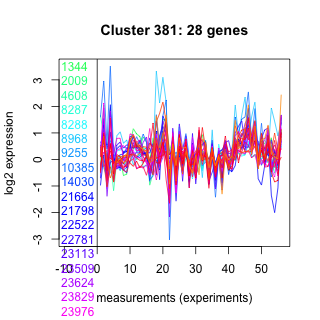 |
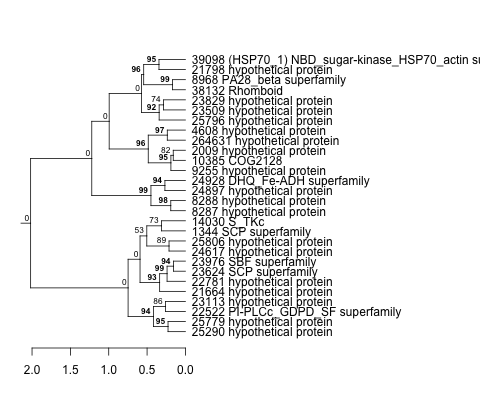 |
0.0001 |
0.0035 |
0.061 |
highlight_arrays | 0.001570 | 0.395 |
| Title | Cluster Plot | Dendrogram | e-value | e-value | e-value | Condition | Condition FDR | Condition Difference |
|---|---|---|---|---|---|---|---|---|
| Thaps_hclust_0141 |
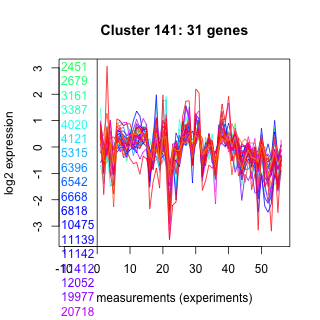 |
 |
0.000021 |
0.0007 |
0.0051 |
highlight_arrays | 0.001570 | 0.396 |
| Title | Cluster Plot | Dendrogram | e-value | e-value | e-value | Condition | Condition FDR | Condition Difference |
|---|---|---|---|---|---|---|---|---|
| Thaps_hclust_0138 |
 |
 |
0.00000000000028 |
0.0000000011 |
0.0000065 |
diel_exponential_vs_stationary | 0.001600 | -0.29 |
| Title | Cluster Plot | Dendrogram | e-value | e-value | e-value | Condition | Condition FDR | Condition Difference |
|---|---|---|---|---|---|---|---|---|
| Thaps_hclust_0309 |
 |
 |
0.0000055 |
0.015 |
1.1 |
diel_exponential_vs_stationary | 0.001600 | -0.6 |
| Title | Cluster Plot | Dendrogram | e-value | e-value | e-value | Condition | Condition FDR | Condition Difference |
|---|---|---|---|---|---|---|---|---|
| Thaps_hclust_0135 |
 |
 |
0.0000000028 |
0.0077 |
0.17 |
diel_exponential_vs_stationary | 0.001600 | -0.456 |
| Title | Cluster Plot | Dendrogram | e-value | e-value | e-value | Condition | Condition FDR | Condition Difference |
|---|---|---|---|---|---|---|---|---|
| Thaps_hclust_0355 |
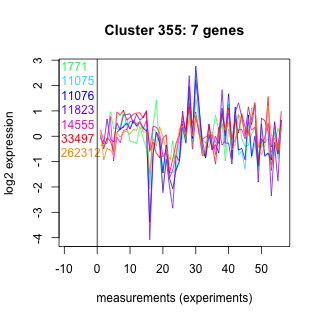 |
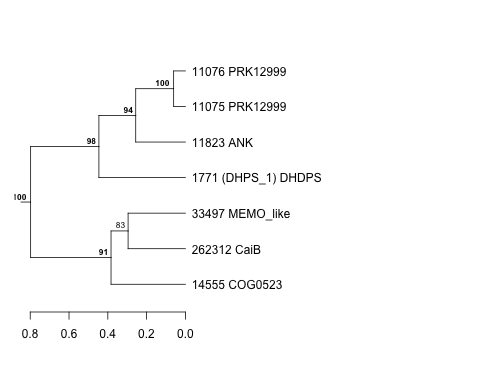 |
0.49 |
16 |
310 |
diel_exponential_vs_stationary | 0.001600 | -1.05 |
| Title | Cluster Plot | Dendrogram | e-value | e-value | e-value | Condition | Condition FDR | Condition Difference |
|---|---|---|---|---|---|---|---|---|
| Thaps_hclust_0289 |
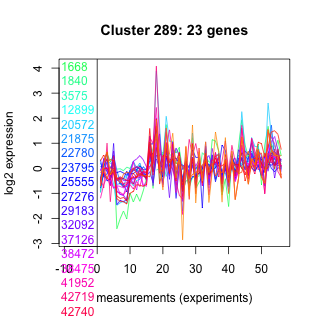 |
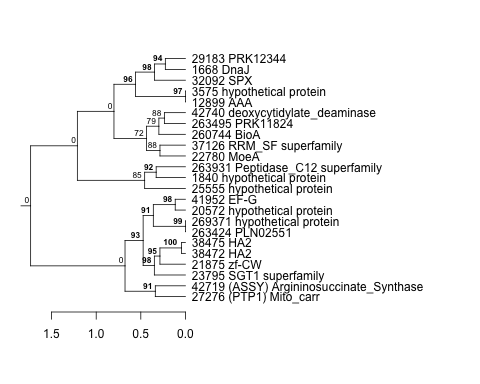 |
0.0000000000026 |
0.00000000000025 |
0.0000045 |
lowFe_KTKB_Day3 | 0.001610 | 0.617 |
| Title | Cluster Plot | Dendrogram | e-value | e-value | e-value | Condition | Condition FDR | Condition Difference |
|---|---|---|---|---|---|---|---|---|
| Thaps_hclust_0054 |
 |
 |
1.6e-17 |
0.0000000000053 |
0.000000000000024 |
lowFe_KTKB_Day3 | 0.001610 | 0.767 |
| Title | Cluster Plot | Dendrogram | e-value | e-value | e-value | Condition | Condition FDR | Condition Difference |
|---|---|---|---|---|---|---|---|---|
| Thaps_hclust_0424 |
 |
 |
0.012 |
0.74 |
0.26 |
lowFe_KTKB_Day3 | 0.001610 | -0.578 |
| Title | Cluster Plot | Dendrogram | e-value | e-value | e-value | Condition | Condition FDR | Condition Difference |
|---|---|---|---|---|---|---|---|---|
| Thaps_hclust_0049 |
 |
 |
0.00054 |
0.0063 |
0.03 |
lowFe_KTKB_Day3 | 0.001610 | 0.586 |
| Title | Cluster Plot | Dendrogram | e-value | e-value | e-value | Condition | Condition FDR | Condition Difference |
|---|---|---|---|---|---|---|---|---|
| Thaps_hclust_0106 |
 |
 |
0.48 |
3.7 |
8.9 |
BaP | 0.001620 | -0.688 |
| Title | Cluster Plot | Dendrogram | e-value | e-value | e-value | Condition | Condition FDR | Condition Difference |
|---|---|---|---|---|---|---|---|---|
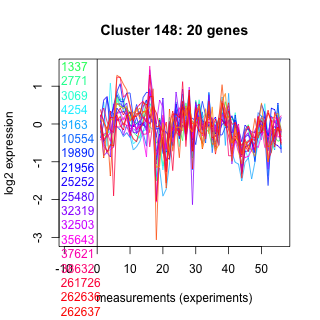
| Thaps_hclust_0148 |
 |
 |
4.7 |
39 |
51 |
BaP | 0.001620 | -0.654 |
| Title | Cluster Plot | Dendrogram | e-value | e-value | e-value | Condition | Condition FDR | Condition Difference |
|---|---|---|---|---|---|---|---|---|
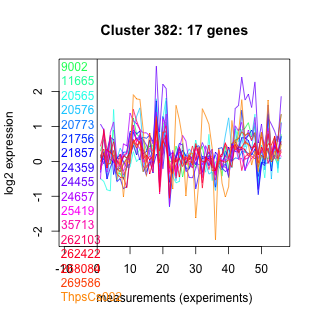
| Thaps_hclust_0382 |
 |
 |
0.0000042 |
0.012 |
0.055 |
BaP | 0.001620 | 0.721 |
| Title | Cluster Plot | Dendrogram | e-value | e-value | e-value | Condition | Condition FDR | Condition Difference |
|---|---|---|---|---|---|---|---|---|
| Thaps_hclust_0116 |
 |
 |
0.74 |
8.1 |
4.9 |
exponential_vs_stationary_24light | 0.001670 | -1.02 |
| Title | Cluster Plot | Dendrogram | e-value | e-value | e-value | Condition | Condition FDR | Condition Difference |
|---|---|---|---|---|---|---|---|---|
| Thaps_hclust_0048 |
 |
 |
4.8e-17 |
0.000000018 |
0.0000097 |
co2_elevated_stat_arrays | 0.001700 | 0.528 |
| Title | Cluster Plot | Dendrogram | e-value | e-value | e-value | Condition | Condition FDR | Condition Difference |
|---|---|---|---|---|---|---|---|---|
| Thaps_hclust_0337 |
 |
 |
3.5 |
3 |
280 |
co2_elevated_stat_arrays | 0.001700 | 0.946 |
| Title | Cluster Plot | Dendrogram | e-value | e-value | e-value | Condition | Condition FDR | Condition Difference |
|---|---|---|---|---|---|---|---|---|
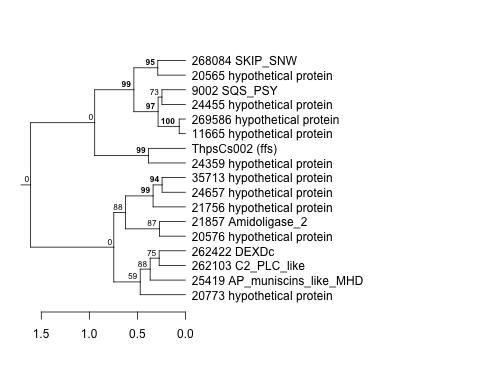
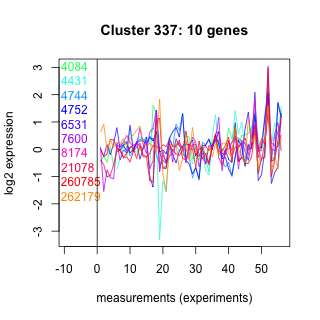
| Thaps_hclust_0128 |
 |
 |
0.0000000058 |
0.00033 |
21 |
co2_elevated_stat_arrays | 0.001700 | -0.575 |
| Title | Cluster Plot | Dendrogram | e-value | e-value | e-value | Condition | Condition FDR | Condition Difference |
|---|---|---|---|---|---|---|---|---|
| Thaps_hclust_0336 |
 |
 |
8.7e-23 |
0.00000000000015 |
0.0000000000000032 |
co2_elevated_stat_arrays | 0.001700 | 0.801 |
| Title | Cluster Plot | Dendrogram | e-value | e-value | e-value | Condition | Condition FDR | Condition Difference |
|---|---|---|---|---|---|---|---|---|
| Thaps_hclust_0304 |
 |
 |
0.16 |
1.3 |
16 |
exponential_vs_stationary_24highlight | 0.001710 | -0.242 |
| Title | Cluster Plot | Dendrogram | e-value | e-value | e-value | Condition | Condition FDR | Condition Difference |
|---|---|---|---|---|---|---|---|---|
| Thaps_hclust_0220 |
 |
|
|
2.4e-19 |
3.2e-19 |
exponential_vs_stationary_24highlight | 0.001710 | -0.142 |
| Title | Cluster Plot | Dendrogram | e-value | e-value | e-value | Condition | Condition FDR | Condition Difference |
|---|---|---|---|---|---|---|---|---|
| Thaps_hclust_0010 |
 |
 |
0.0000000000019 |
0.000000000035 |
0.013 |
diel_light_vs_dark | 0.001770 | 0.401 |
| Title | Cluster Plot | Dendrogram | e-value | e-value | e-value | Condition | Condition FDR | Condition Difference |
|---|---|---|---|---|---|---|---|---|
| Thaps_hclust_0044 |
 |
 |
0.27 |
2.6 |
4.2 |
diel_light_vs_dark | 0.001770 | -0.757 |
| Title | Cluster Plot | Dendrogram | e-value | e-value | e-value | Condition | Condition FDR | Condition Difference |
|---|---|---|---|---|---|---|---|---|
| Thaps_hclust_0378 |
 |
 |
0.0003 |
210 |
10 |
diel_light_vs_dark | 0.001770 | 0.752 |
| Title | Cluster Plot | Dendrogram | e-value | e-value | e-value | Condition | Condition FDR | Condition Difference |
|---|---|---|---|---|---|---|---|---|
| Thaps_hclust_0060 |
 |
 |
0.00000047 |
0.00077 |
0.0075 |
BaP | 0.001910 | -0.537 |
| Title | Cluster Plot | Dendrogram | e-value | e-value | e-value | Condition | Condition FDR | Condition Difference |
|---|---|---|---|---|---|---|---|---|
| Thaps_hclust_0236 |
 |
 |
0.0078 |
3.3 |
1.1 |
BaP | 0.001910 | 0.84 |
| Title | Cluster Plot | Dendrogram | e-value | e-value | e-value | Condition | Condition FDR | Condition Difference |
|---|---|---|---|---|---|---|---|---|
| Thaps_hclust_0050 |
 |
 |
0.0000000011 |
0.0000042 |
0.00021 |
highlight_arrays | 0.001940 | -0.419 |
| Title | Cluster Plot | Dendrogram | e-value | e-value | e-value | Condition | Condition FDR | Condition Difference |
|---|---|---|---|---|---|---|---|---|
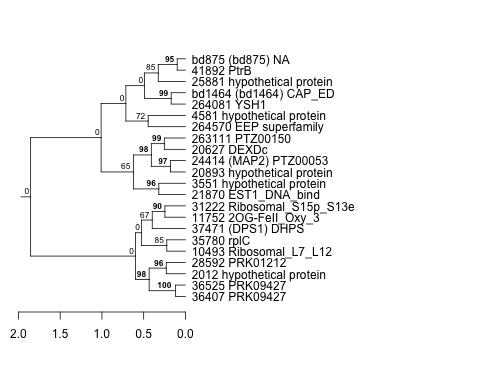
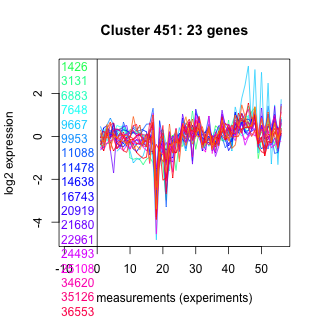
| Thaps_hclust_0451 |
 |
 |
10 |
0.0026 |
160 |
highlight_arrays | 0.001940 | 0.427 |
| Title | Cluster Plot | Dendrogram | e-value | e-value | e-value | Condition | Condition FDR | Condition Difference |
|---|---|---|---|---|---|---|---|---|
| Thaps_hclust_0387 |
 |
 |
0.0023 |
0.003 |
0.38 |
highpH_TMEVA | 0.001970 | 0.48 |
| Title | Cluster Plot | Dendrogram | e-value | e-value | e-value | Condition | Condition FDR | Condition Difference |
|---|---|---|---|---|---|---|---|---|
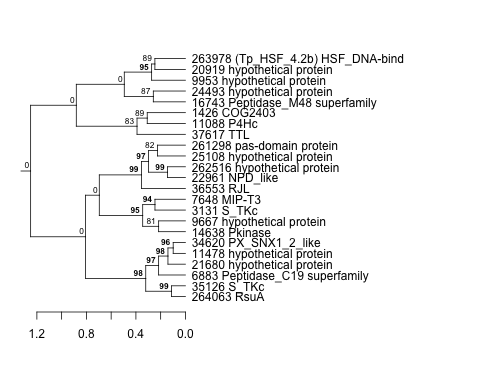
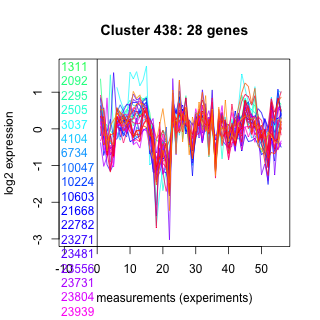
| Thaps_hclust_0438 |
 |
 |
0.0024 |
1.5 |
3.6 |
highpH_TMEVA | 0.001970 | 0.413 |
| Title | Cluster Plot | Dendrogram | e-value | e-value | e-value | Condition | Condition FDR | Condition Difference |
|---|---|---|---|---|---|---|---|---|
| Thaps_hclust_0206 |
 |
 |
0.00000000000075 |
0.0000028 |
3.5 |
diel_exponential_vs_stationary | 0.002080 | 0.474 |