Hierarchical Clusters
Displaying 1501 - 1600 of 7500
| Title | Cluster Plot | Dendrogram | e-value | e-value | e-value | Condition | Condition FDR | Condition Difference |
|---|---|---|---|---|---|---|---|---|
| Thaps_hclust_0343 |
 |
 |
9.7e-16 |
0.000000023 |
0.0000000024 |
exponential_vs_stationary_24light | 0.813000 | -0.085 |
| Title | Cluster Plot | Dendrogram | e-value | e-value | e-value | Condition | Condition FDR | Condition Difference |
|---|---|---|---|---|---|---|---|---|
| Thaps_hclust_0044 |
 |
 |
0.27 |
2.6 |
4.2 |
diel_exponential_vs_stationary | 0.813000 | 0.0649 |
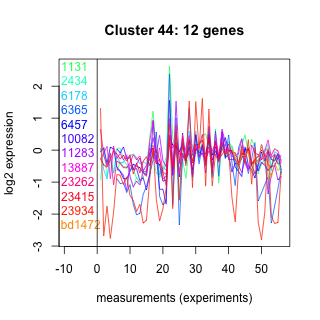
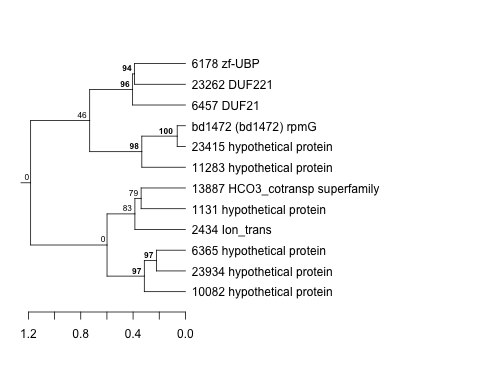
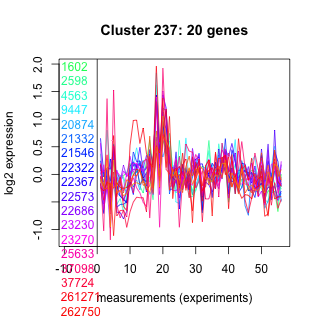
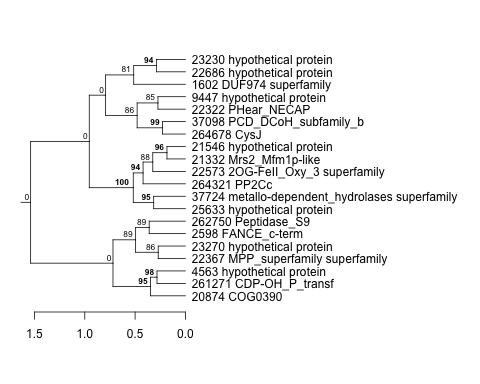
| Title | Cluster Plot | Dendrogram | e-value | e-value | e-value | Condition | Condition FDR | Condition Difference |
|---|---|---|---|---|---|---|---|---|
| Thaps_hclust_0237 |
 |
 |
0.0000097 |
0.000009 |
0.000056 |
lowFe_KTKB_Day5 | 0.813000 | -0.0557 |
| Title | Cluster Plot | Dendrogram | e-value | e-value | e-value | Condition | Condition FDR | Condition Difference |
|---|---|---|---|---|---|---|---|---|
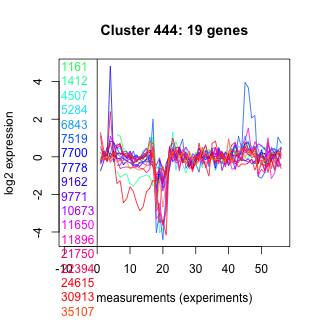
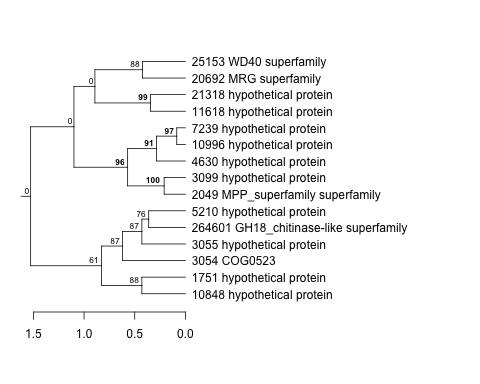
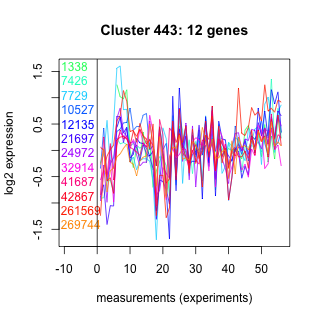
| Thaps_hclust_0444 |
 |
 |
14 |
140 |
1.6 |
exponential_vs_stationary_24light | 0.813000 | -0.101 |
| Title | Cluster Plot | Dendrogram | e-value | e-value | e-value | Condition | Condition FDR | Condition Difference |
|---|---|---|---|---|---|---|---|---|
| Thaps_hclust_0054 |
 |
 |
1.6e-17 |
0.0000000000053 |
0.000000000000024 |
lowFe_TMEVA | 0.813000 | -0.098 |
| Title | Cluster Plot | Dendrogram | e-value | e-value | e-value | Condition | Condition FDR | Condition Difference |
|---|---|---|---|---|---|---|---|---|
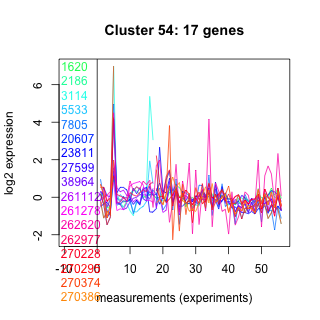
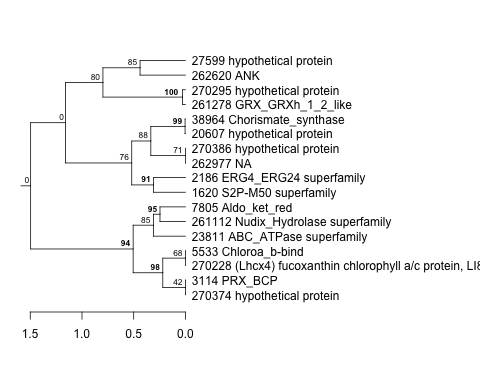
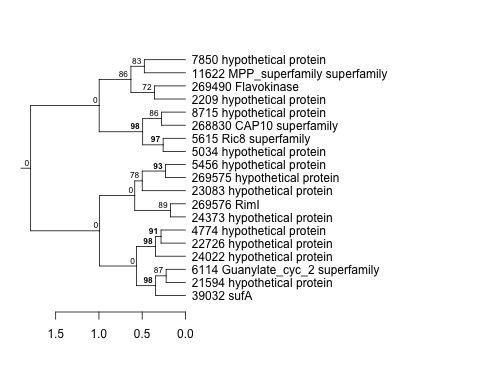
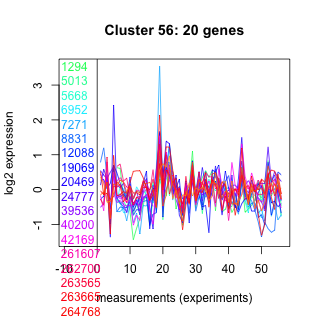
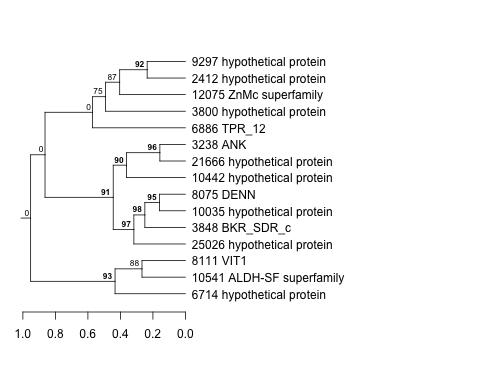
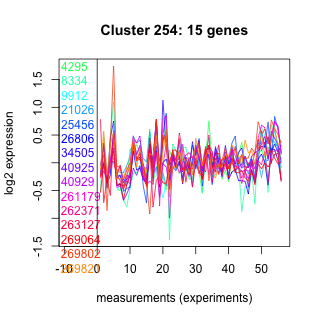
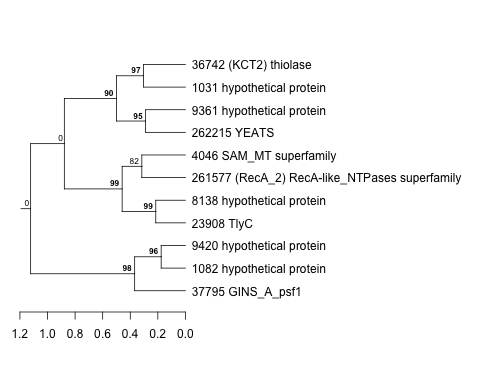
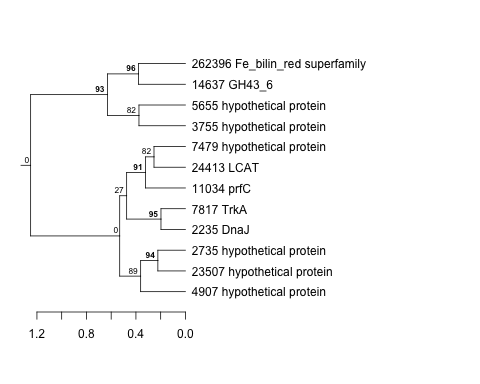
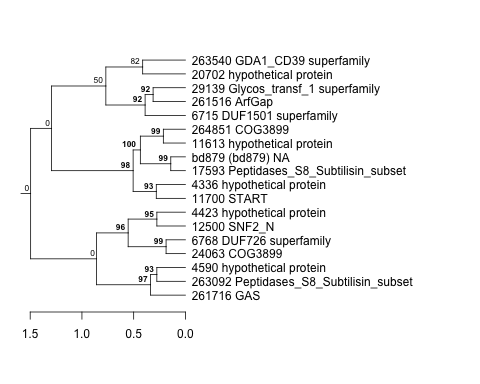
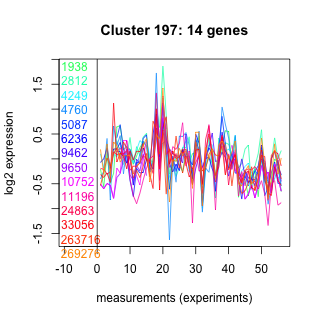
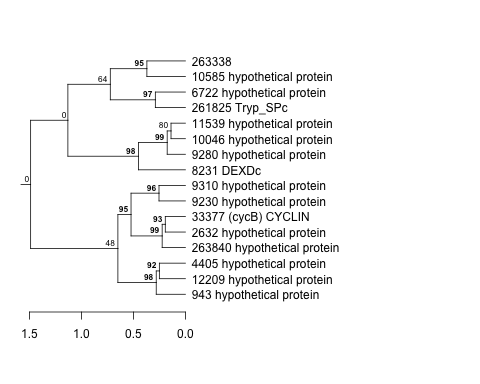
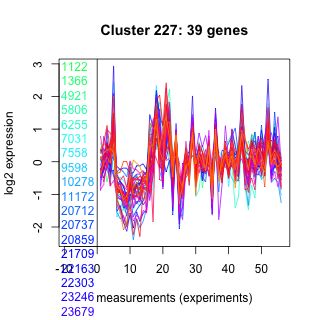
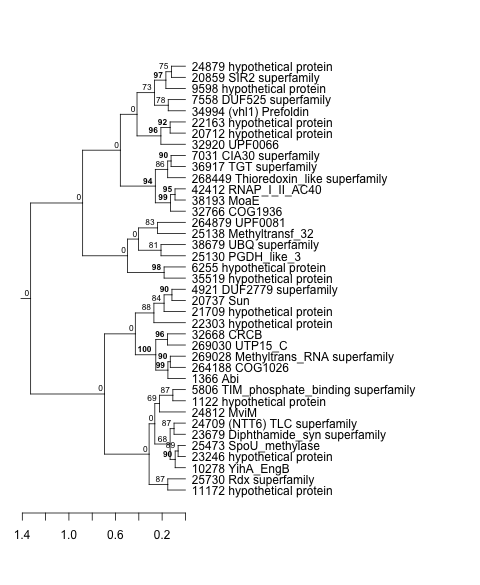
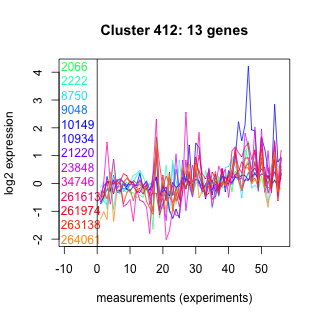
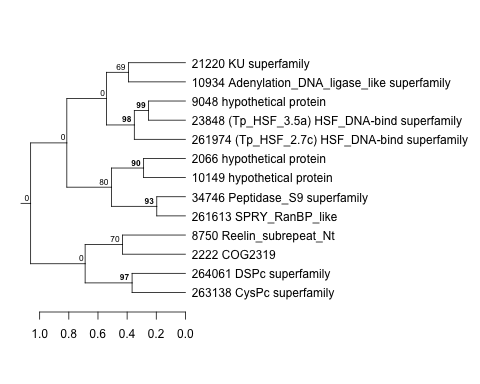
| Thaps_hclust_0261 |
 |
 |
0.00000000025 |
0.000000005 |
0.0000069 |
exponential_vs_stationary_24light | 0.813000 | -0.0832 |
| Thaps_hclust_0261 |
|
|
0.00000000025 |
0.000000005 |
0.0000069 |
lowN_TMEVA | 0.808000 | 0.0873 |
| Title | Cluster Plot | Dendrogram | e-value | e-value | e-value | Condition | Condition FDR | Condition Difference |
|---|---|---|---|---|---|---|---|---|
| Thaps_hclust_0089 |
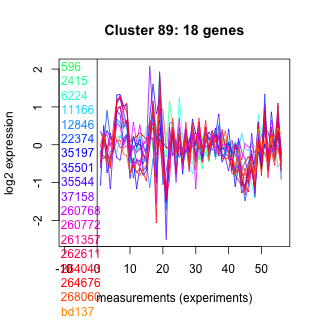 |
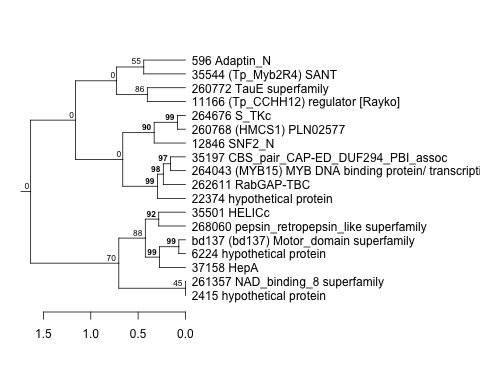 |
0.000036 |
0.00054 |
0.075 |
lowFe_TMEVA | 0.813000 | 0.0953 |
| Title | Cluster Plot | Dendrogram | e-value | e-value | e-value | Condition | Condition FDR | Condition Difference |
|---|---|---|---|---|---|---|---|---|
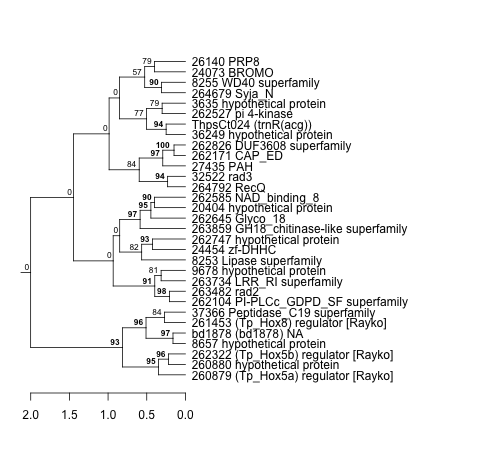
| Thaps_hclust_0472 |
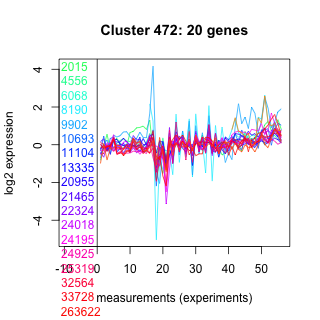 |
 |
0.00000011 |
0.000015 |
0.00015 |
lowFe_TMEVA | 0.813000 | -0.0941 |
| Title | Cluster Plot | Dendrogram | e-value | e-value | e-value | Condition | Condition FDR | Condition Difference |
|---|---|---|---|---|---|---|---|---|
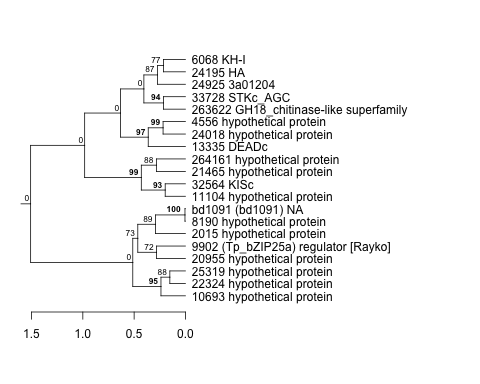
| Thaps_hclust_0270 |
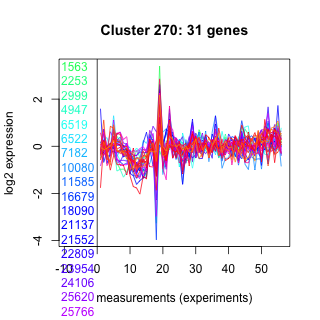 |
 |
0.0000000000069 |
0.000026 |
0.0036 |
BaP | 0.812000 | -0.0494 |
| Thaps_hclust_0270 |
|
|
0.0000000000069 |
0.000026 |
0.0036 |
lowFe_KTKB_Day3 | 0.810000 | 0.0548 |
| Thaps_hclust_0270 |
|
|
0.0000000000069 |
0.000026 |
0.0036 |
diel_exponential_vs_stationary | 0.807000 | 0.0453 |
| Title | Cluster Plot | Dendrogram | e-value | e-value | e-value | Condition | Condition FDR | Condition Difference |
|---|---|---|---|---|---|---|---|---|
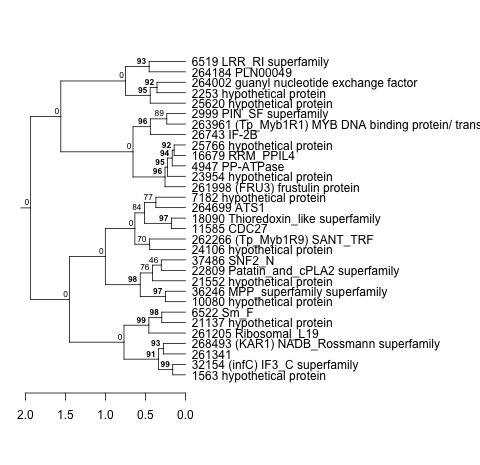
| Thaps_hclust_0283 |
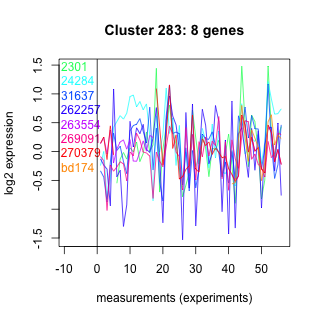 |
 |
0.0022 |
0.0079 |
0.019 |
co2_elevated_expo_arrays | 0.812000 | -0.0984 |
| Title | Cluster Plot | Dendrogram | e-value | e-value | e-value | Condition | Condition FDR | Condition Difference |
|---|---|---|---|---|---|---|---|---|
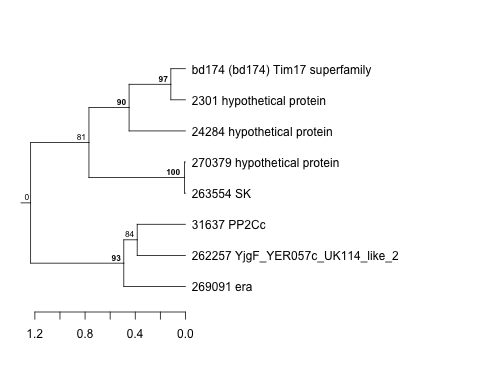
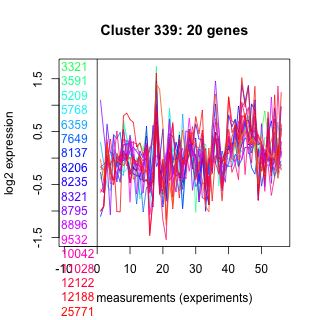
| Thaps_hclust_0339 |
 |
 |
0.000016 |
0.00038 |
0.0017 |
lowSi_TMEVA | 0.812000 | -0.243 |
| Thaps_hclust_0339 |
|
|
0.000016 |
0.00038 |
0.0017 |
lowtemp_TMEVA | 0.811000 | -0.0718 |
| Title | Cluster Plot | Dendrogram | e-value | e-value | e-value | Condition | Condition FDR | Condition Difference |
|---|---|---|---|---|---|---|---|---|
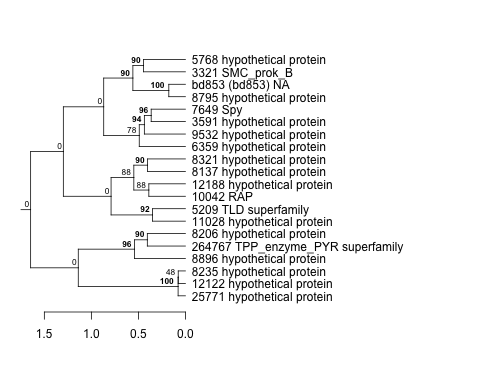
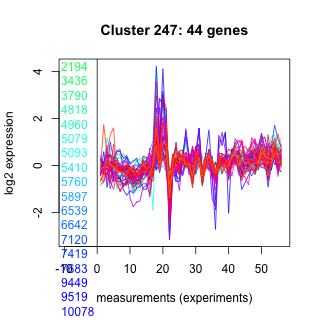
| Thaps_hclust_0247 |
 |
 |
8.7e-16 |
0.00000000045 |
0.0000019 |
lowtemp_TMEVA | 0.811000 | -0.0505 |
| Title | Cluster Plot | Dendrogram | e-value | e-value | e-value | Condition | Condition FDR | Condition Difference |
|---|---|---|---|---|---|---|---|---|
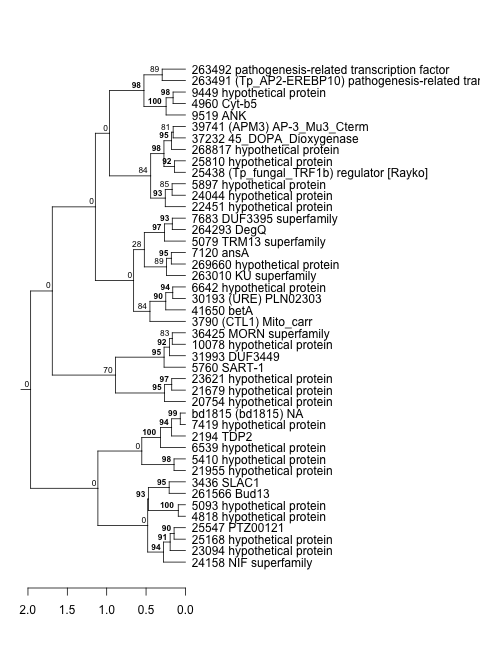
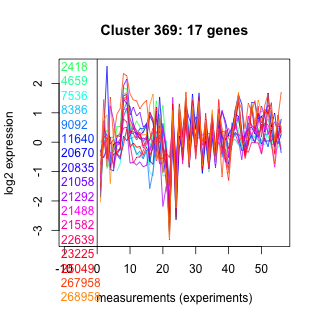
| Thaps_hclust_0369 |
 |
 |
0.34 |
2.4 |
5 |
lowFe_KTKB_Day3 | 0.811000 | -0.0717 |
| Title | Cluster Plot | Dendrogram | e-value | e-value | e-value | Condition | Condition FDR | Condition Difference |
|---|---|---|---|---|---|---|---|---|
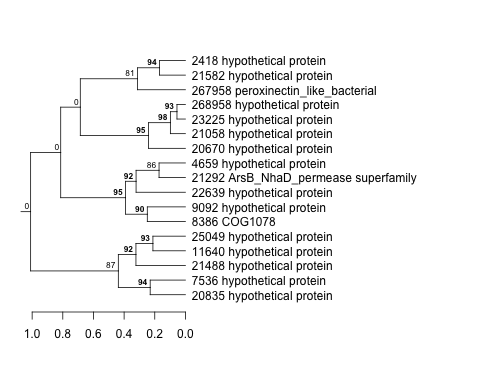
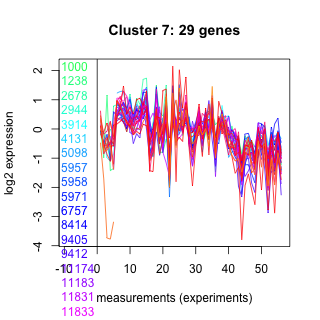
| Thaps_hclust_0007 |
 |
 |
0.0000000001 |
0.0000000097 |
0.000027 |
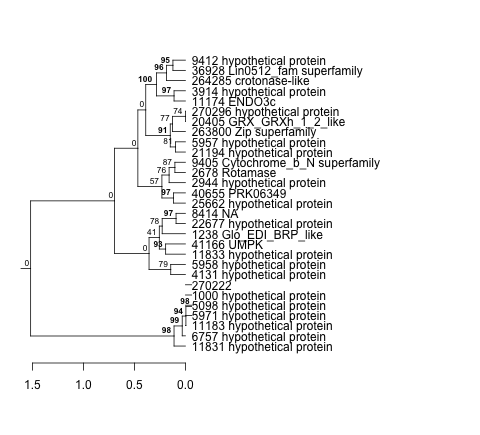
diel_exponential_vs_stationary | 0.811000 | -0.0458 |
| Title | Cluster Plot | Dendrogram | e-value | e-value | e-value | Condition | Condition FDR | Condition Difference |
|---|---|---|---|---|---|---|---|---|
| Thaps_hclust_0190 |
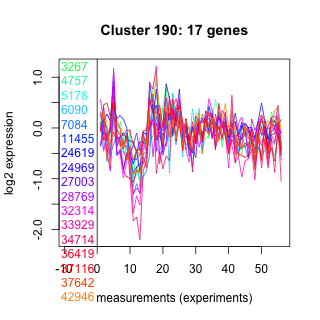 |
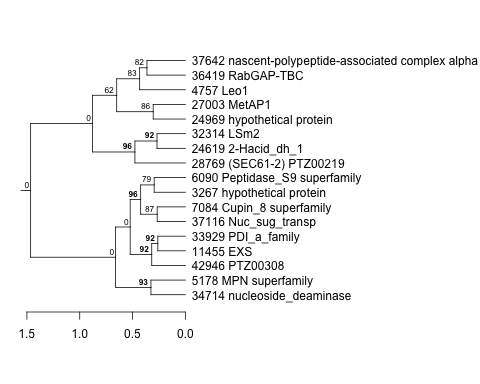 |
0.0000025 |
0.00027 |
0.93 |
highpH_TMEVA | 0.811000 | 0.0501 |
| Title | Cluster Plot | Dendrogram | e-value | e-value | e-value | Condition | Condition FDR | Condition Difference |
|---|---|---|---|---|---|---|---|---|
| Thaps_hclust_0125 |
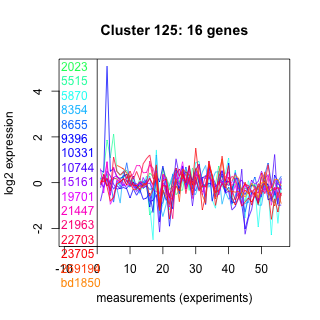 |
 |
0.1 |
0.35 |
2.4 |
highpH_TMEVA | 0.811000 | 0.053 |
| Title | Cluster Plot | Dendrogram | e-value | e-value | e-value | Condition | Condition FDR | Condition Difference |
|---|---|---|---|---|---|---|---|---|
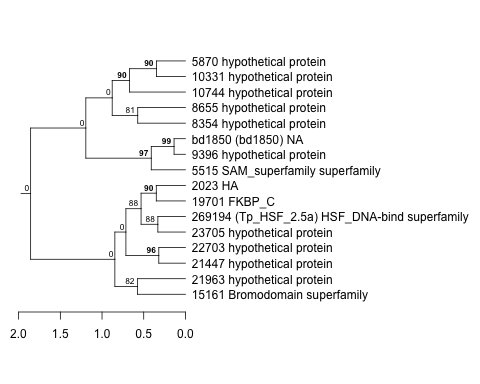
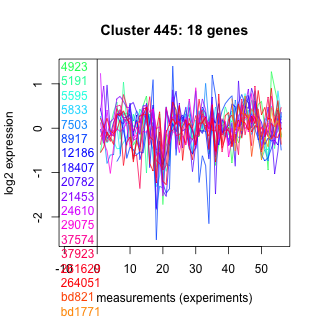
| Thaps_hclust_0445 |
 |
 |
0.000046 |
6.9 |
33 |
lowFe_KTKB_Day3 | 0.810000 | -0.071 |
| Title | Cluster Plot | Dendrogram | e-value | e-value | e-value | Condition | Condition FDR | Condition Difference |
|---|---|---|---|---|---|---|---|---|
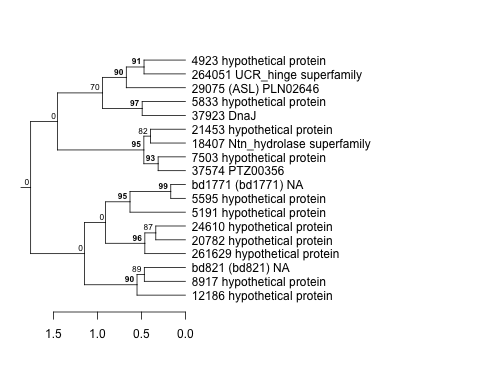
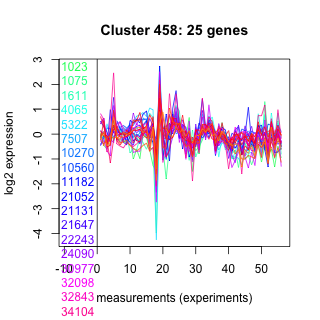
| Thaps_hclust_0458 |
 |
 |
0.0000000041 |
0.000000022 |
0.0024 |
lowFe_KTKB_Day3 | 0.810000 | -0.0599 |
| Title | Cluster Plot | Dendrogram | e-value | e-value | e-value | Condition | Condition FDR | Condition Difference |
|---|---|---|---|---|---|---|---|---|
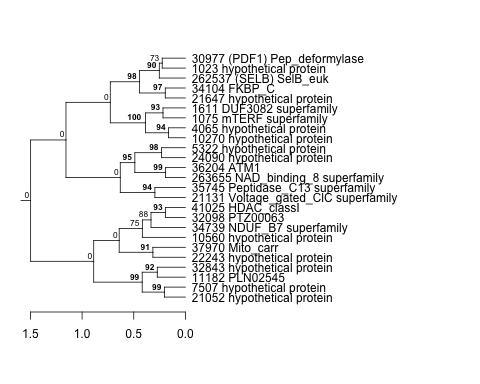
| Thaps_hclust_0301 |
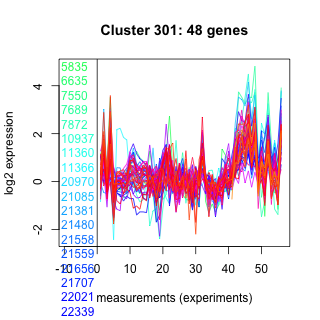 |
 |
0.000000022 |
0.82 |
2.1 |
lowFe_KTKB_Day3 | 0.810000 | 0.0454 |
| Title | Cluster Plot | Dendrogram | e-value | e-value | e-value | Condition | Condition FDR | Condition Difference |
|---|---|---|---|---|---|---|---|---|
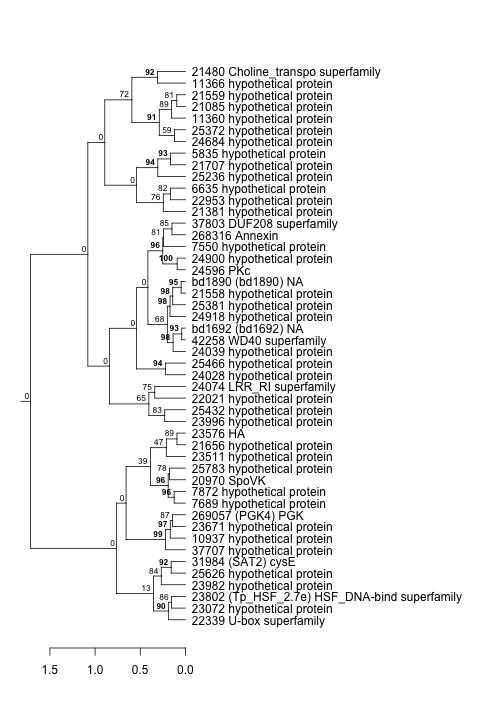
| Thaps_hclust_0259 |
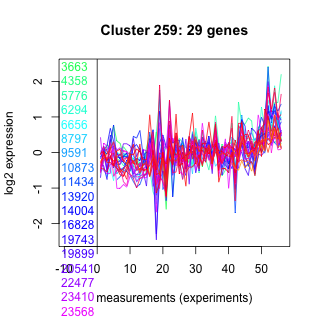 |
 |
0.000051 |
0.026 |
17 |
lowFe_KTKB_Day3 | 0.810000 | 0.0561 |
| Thaps_hclust_0259 |
|
|
0.000051 |
0.026 |
17 |
lowFe_TMEVA | 0.803000 | -0.0957 |
| Title | Cluster Plot | Dendrogram | e-value | e-value | e-value | Condition | Condition FDR | Condition Difference |
|---|---|---|---|---|---|---|---|---|
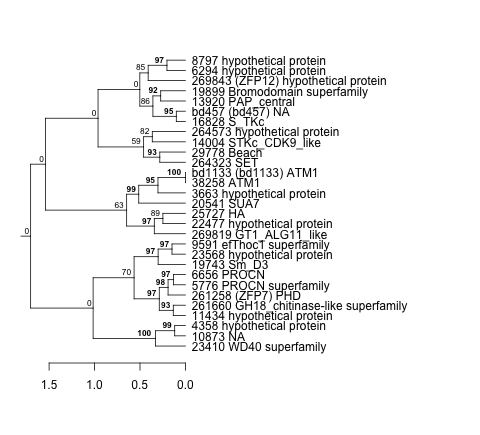
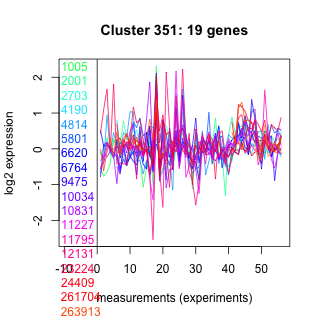
| Thaps_hclust_0351 |
 |
 |
0.033 |
0.06 |
50 |
lowFe_KTKB_Day3 | 0.810000 | 0.0684 |
| Title | Cluster Plot | Dendrogram | e-value | e-value | e-value | Condition | Condition FDR | Condition Difference |
|---|---|---|---|---|---|---|---|---|
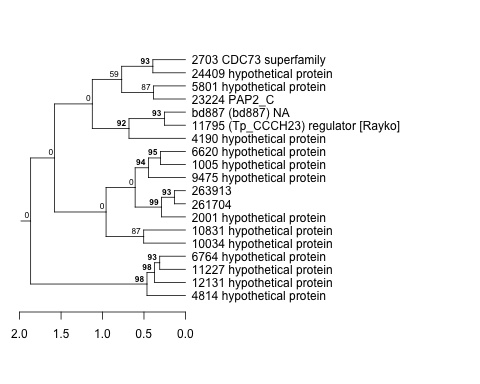
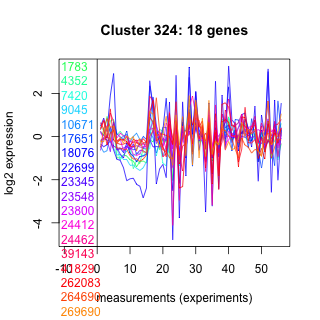
| Thaps_hclust_0324 |
 |
 |
0.0023 |
2.4 |
5.1 |
lowFe_TMEVA | 0.810000 | 0.0981 |
| Title | Cluster Plot | Dendrogram | e-value | e-value | e-value | Condition | Condition FDR | Condition Difference |
|---|---|---|---|---|---|---|---|---|
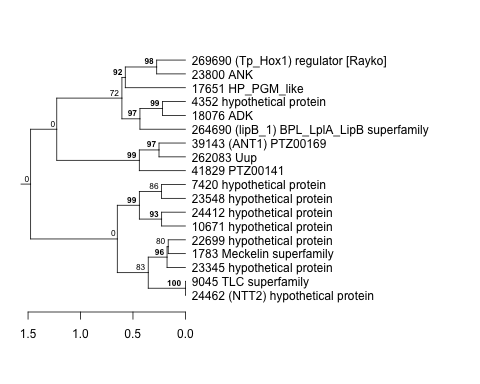
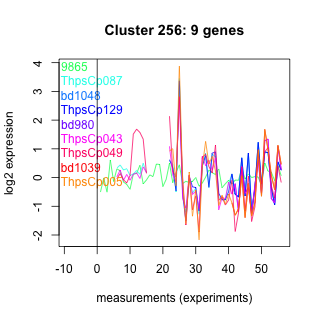
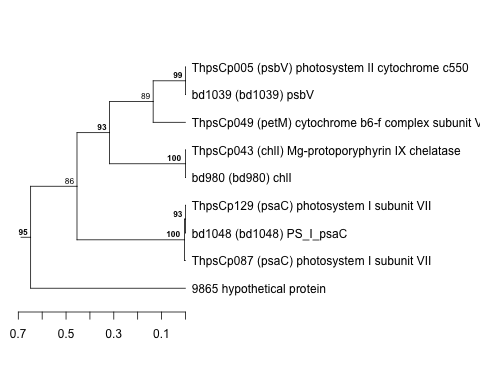
| Thaps_hclust_0256 |
 |
 |
0.0000000000016 |
0.0000000000033 |
0.0000000000017 |
lowFe_KTKB_Day3 | 0.810000 | 0.0927 |
| Thaps_hclust_0256 |
|
|
0.0000000000016 |
0.0000000000033 |
0.0000000000017 |
co2_elevated_expo_arrays | 0.808000 | 0.0943 |
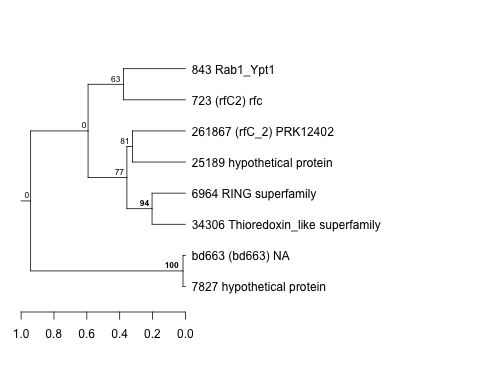
| Title | Cluster Plot | Dendrogram | e-value | e-value | e-value | Condition | Condition FDR | Condition Difference |
|---|---|---|---|---|---|---|---|---|
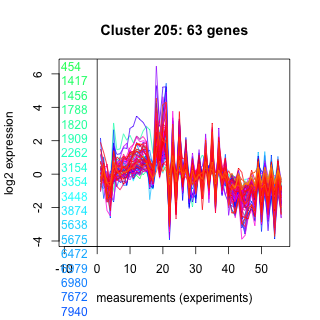
| Thaps_hclust_0205 |
 |
 |
2.3e-23 |
7.6e-16 |
0.00000015 |
lowFe_TMEVA | 0.810000 | 0.0887 |
| Title | Cluster Plot | Dendrogram | e-value | e-value | e-value | Condition | Condition FDR | Condition Difference |
|---|---|---|---|---|---|---|---|---|
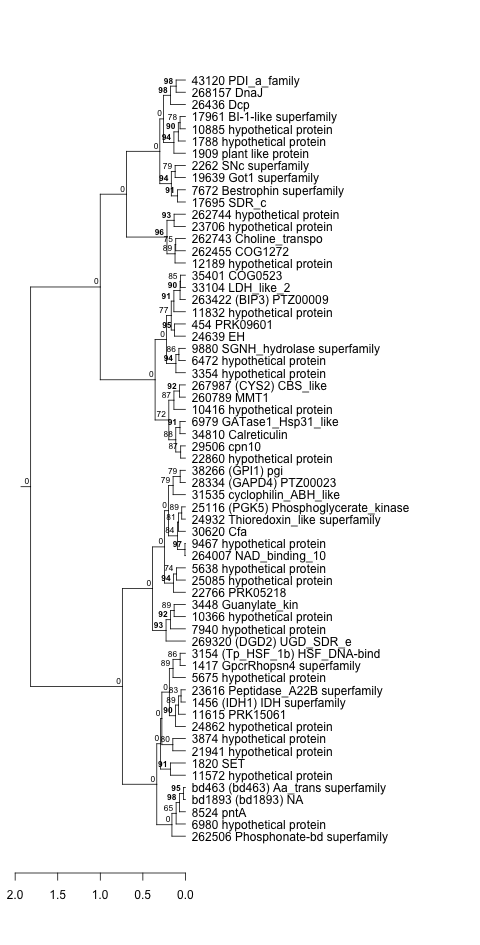
| Thaps_hclust_0429 |
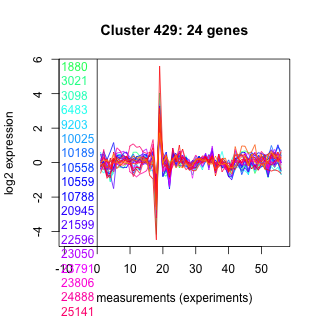 |
 |
0.0000000033 |
0.00000039 |
0.000054 |
lowFe_KTKB_Day3 | 0.810000 | -0.0596 |
| Title | Cluster Plot | Dendrogram | e-value | e-value | e-value | Condition | Condition FDR | Condition Difference |
|---|---|---|---|---|---|---|---|---|
| Thaps_hclust_0338 |
 |
 |
0.0000012 |
0.0000014 |
0.000012 |
diel_light_vs_dark | 0.809000 | -0.0542 |
| Title | Cluster Plot | Dendrogram | e-value | e-value | e-value | Condition | Condition FDR | Condition Difference |
|---|---|---|---|---|---|---|---|---|
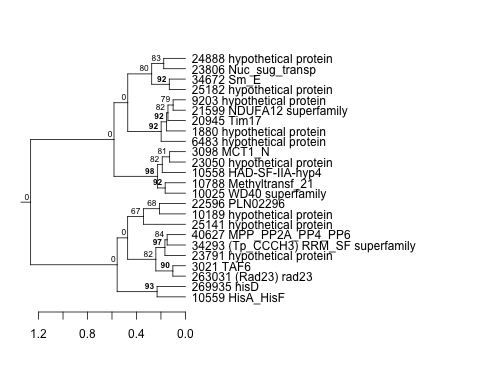
| Thaps_hclust_0409 |
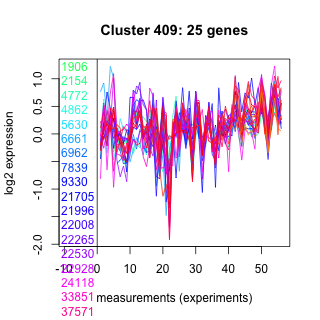 |
 |
0.0000000066 |
0.0028 |
0.21 |
exponential_vs_stationary_24highlight | 0.809000 | 0.0264 |
| Thaps_hclust_0409 |
|
|
0.0000000066 |
0.0028 |
0.21 |
lowN_TMEVA | 0.803000 | 0.0939 |
| Thaps_hclust_0409 |
|
|
0.0000000066 |
0.0028 |
0.21 |
lowFe_KTKB_Day3 | 0.802000 | 0.0637 |
| Title | Cluster Plot | Dendrogram | e-value | e-value | e-value | Condition | Condition FDR | Condition Difference |
|---|---|---|---|---|---|---|---|---|
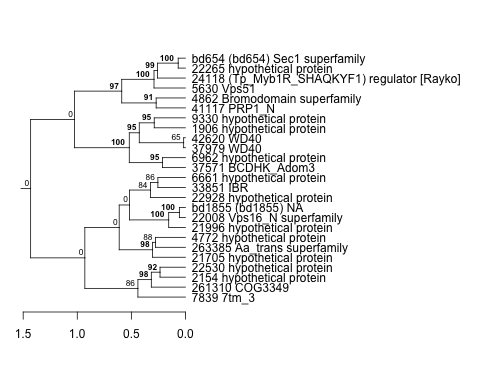
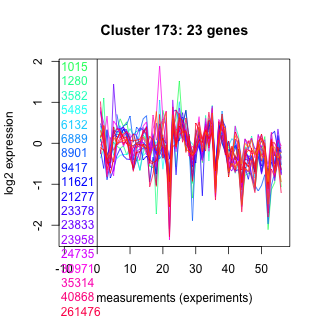
| Thaps_hclust_0173 |
 |
 |
0.013 |
0.83 |
0.45 |
lowFe_KTKB_Day5 | 0.809000 | -0.0527 |
| Title | Cluster Plot | Dendrogram | e-value | e-value | e-value | Condition | Condition FDR | Condition Difference |
|---|---|---|---|---|---|---|---|---|
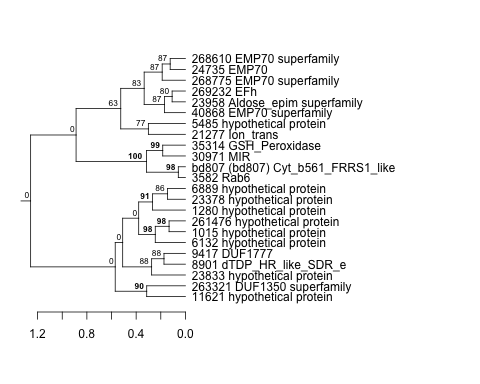
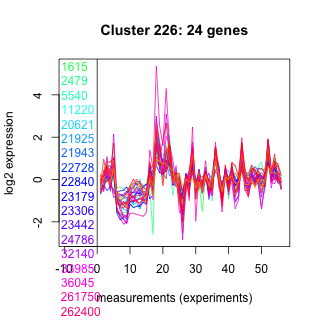
| Thaps_hclust_0226 |
 |
 |
0.000000041 |
0.95 |
4.6 |
exponential_vs_stationary_24highlight | 0.809000 | -0.0265 |
| Title | Cluster Plot | Dendrogram | e-value | e-value | e-value | Condition | Condition FDR | Condition Difference |
|---|---|---|---|---|---|---|---|---|
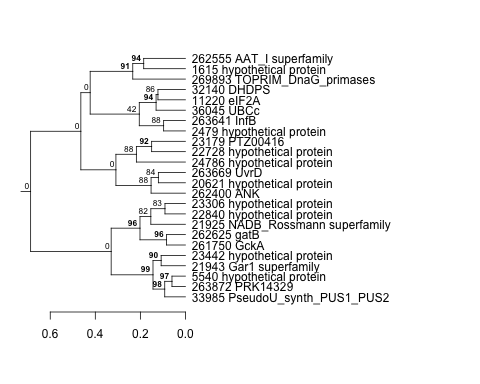
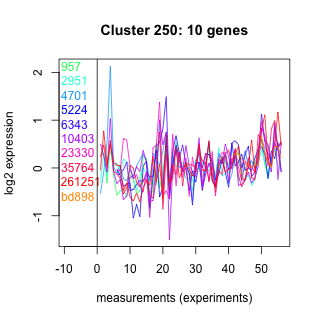
| Thaps_hclust_0250 |
 |
 |
0.38 |
88 |
290 |
diel_exponential_vs_stationary | 0.809000 | -0.071 |
| Title | Cluster Plot | Dendrogram | e-value | e-value | e-value | Condition | Condition FDR | Condition Difference |
|---|---|---|---|---|---|---|---|---|
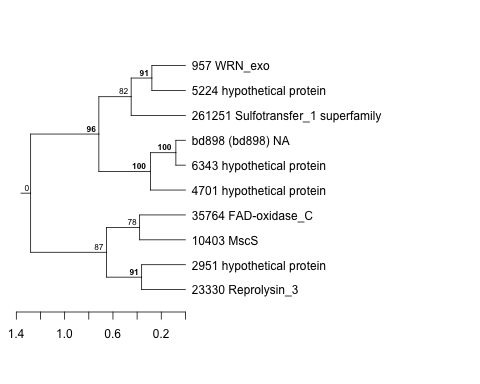
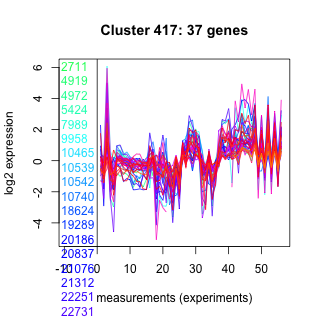
| Thaps_hclust_0417 |
 |
 |
0.0000000018 |
0.00013 |
0.00029 |
co2_elevated_expo_arrays | 0.808000 | -0.0734 |
| Title | Cluster Plot | Dendrogram | e-value | e-value | e-value | Condition | Condition FDR | Condition Difference |
|---|---|---|---|---|---|---|---|---|
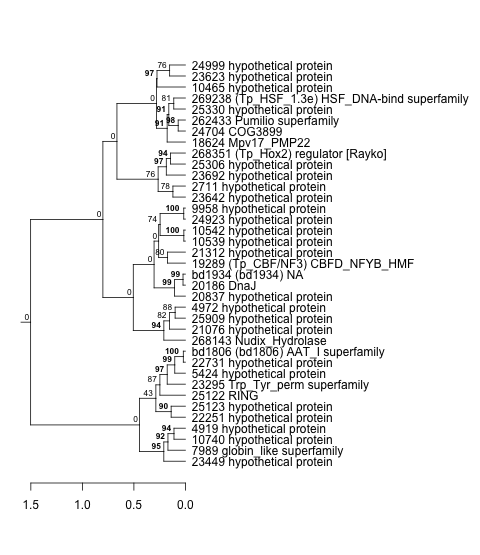
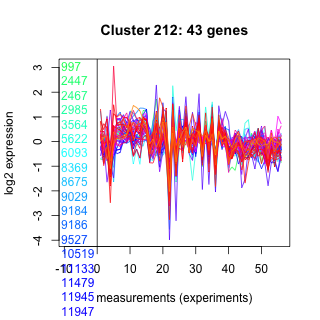
| Thaps_hclust_0212 |
 |
 |
2.5e-17 |
0.000019 |
0.027 |
lowFe_KTKB_Day5 | 0.808000 | -0.0395 |
| Thaps_hclust_0212 |
|
|
2.5e-17 |
0.000019 |
0.027 |
highlight_arrays | 0.805000 | 0.0325 |
| Title | Cluster Plot | Dendrogram | e-value | e-value | e-value | Condition | Condition FDR | Condition Difference |
|---|---|---|---|---|---|---|---|---|
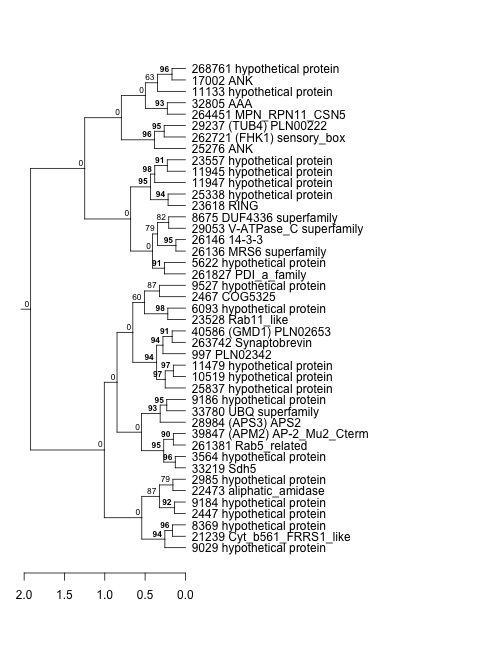
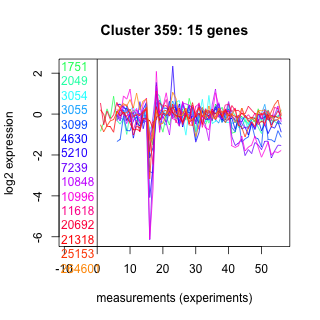
| Thaps_hclust_0359 |
 |
 |
0.5 |
11 |
31 |
co2_elevated_stat_arrays | 0.808000 | 0.0717 |
| Thaps_hclust_0359 |
|
|
0.5 |
11 |
31 |
lowtemp_TMEVA | 0.803000 | -0.083 |
| Title | Cluster Plot | Dendrogram | e-value | e-value | e-value | Condition | Condition FDR | Condition Difference |
|---|---|---|---|---|---|---|---|---|
| Thaps_hclust_0443 |
 |
 |
0.96 |
9.8 |
42 |
lowFe_KTKB_Day5 | 0.808000 | -0.0726 |
| Title | Cluster Plot | Dendrogram | e-value | e-value | e-value | Condition | Condition FDR | Condition Difference |
|---|---|---|---|---|---|---|---|---|
| Thaps_hclust_0468 |
 |
 |
0.0023 |
0.08 |
2.3 |
lowN_TMEVA | 0.808000 | -0.0902 |
| Title | Cluster Plot | Dendrogram | e-value | e-value | e-value | Condition | Condition FDR | Condition Difference |
|---|---|---|---|---|---|---|---|---|
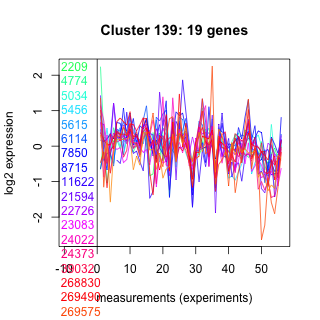
| Thaps_hclust_0139 |
 |
 |
0.00014 |
0.00066 |
3 |
lowFe_KTKB_Day5 | 0.808000 | -0.0576 |
| Title | Cluster Plot | Dendrogram | e-value | e-value | e-value | Condition | Condition FDR | Condition Difference |
|---|---|---|---|---|---|---|---|---|
| Thaps_hclust_0056 |
 |
 |
0.0000000078 |
0.077 |
1 |
highlight_arrays | 0.808000 | 0.0448 |
| Title | Cluster Plot | Dendrogram | e-value | e-value | e-value | Condition | Condition FDR | Condition Difference |
|---|---|---|---|---|---|---|---|---|
| Thaps_hclust_0073 |
 |
 |
0.013 |
0.043 |
210 |
lowFe_KTKB_Day5 | 0.808000 | -0.0611 |
| Title | Cluster Plot | Dendrogram | e-value | e-value | e-value | Condition | Condition FDR | Condition Difference |
|---|---|---|---|---|---|---|---|---|
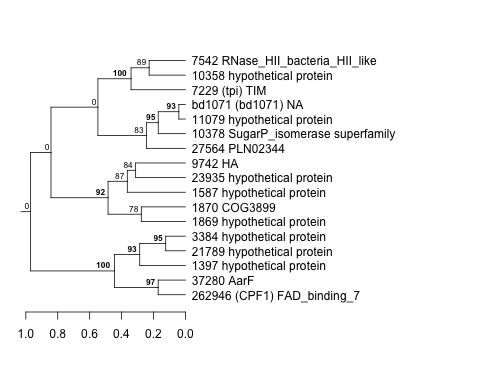
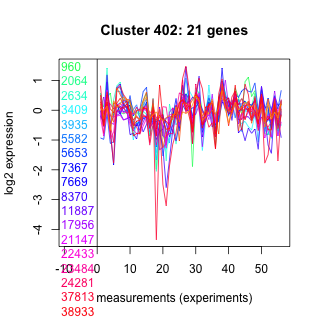
| Thaps_hclust_0402 |
 |
 |
0.0022 |
5.7 |
0.07 |
co2_elevated_expo_arrays | 0.808000 | -0.0796 |
| Title | Cluster Plot | Dendrogram | e-value | e-value | e-value | Condition | Condition FDR | Condition Difference |
|---|---|---|---|---|---|---|---|---|
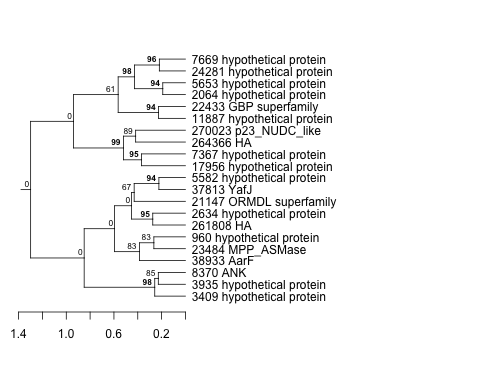
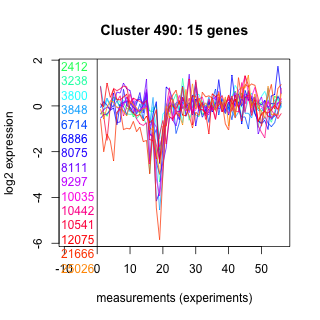
| Thaps_hclust_0490 |
 |
 |
0.6 |
9.5 |
74 |
exponential_vs_stationary_24light | 0.807000 | -0.113 |
| Title | Cluster Plot | Dendrogram | e-value | e-value | e-value | Condition | Condition FDR | Condition Difference |
|---|---|---|---|---|---|---|---|---|
| Thaps_hclust_0254 |
 |
 |
0.00045 |
0.0045 |
5.8 |
lowFe_TMEVA | 0.807000 | 0.105 |
| Title | Cluster Plot | Dendrogram | e-value | e-value | e-value | Condition | Condition FDR | Condition Difference |
|---|---|---|---|---|---|---|---|---|
| Thaps_hclust_0321 |
 |
 |
0.000000086 |
0.0000000042 |
0.0000028 |
diel_light_vs_dark | 0.807000 | -0.0546 |
| Title | Cluster Plot | Dendrogram | e-value | e-value | e-value | Condition | Condition FDR | Condition Difference |
|---|---|---|---|---|---|---|---|---|
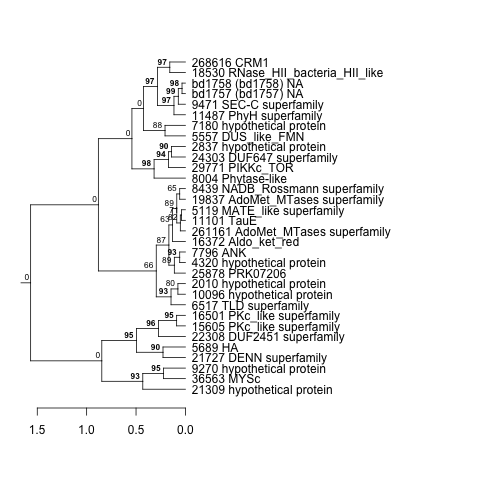
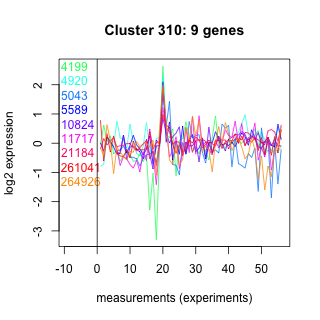
| Thaps_hclust_0310 |
 |
 |
4.9 |
19 |
86 |
highpH_TMEVA | 0.807000 | -0.0669 |
| Thaps_hclust_0310 |
|
|
4.9 |
19 |
86 |
co2_elevated_stat_arrays | 0.802000 | 0.084 |
| Title | Cluster Plot | Dendrogram | e-value | e-value | e-value | Condition | Condition FDR | Condition Difference |
|---|---|---|---|---|---|---|---|---|
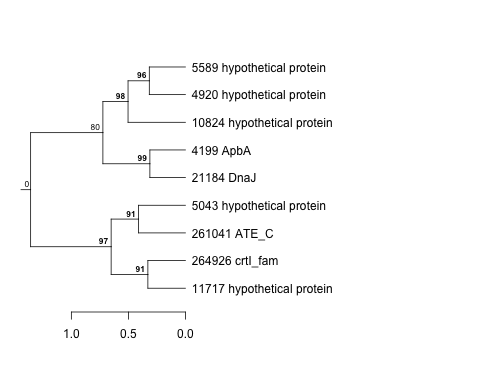
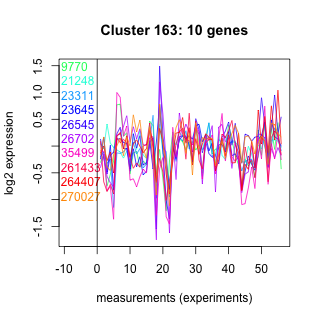
| Thaps_hclust_0163 |
 |
 |
2.5 |
63 |
210 |
lowFe_TMEVA | 0.807000 | -0.114 |
| Title | Cluster Plot | Dendrogram | e-value | e-value | e-value | Condition | Condition FDR | Condition Difference |
|---|---|---|---|---|---|---|---|---|
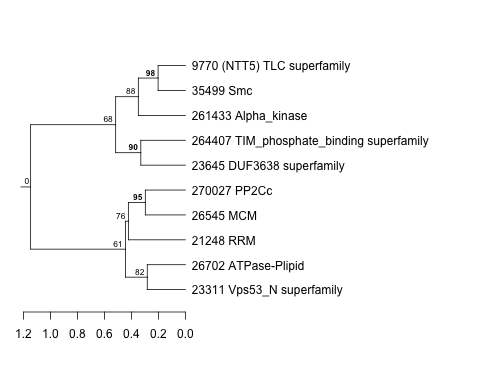
| Thaps_hclust_0315 |
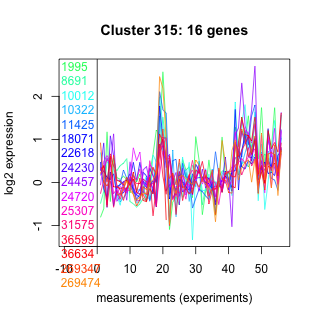 |
 |
0.01 |
0.93 |
0.53 |
diel_light_vs_dark | 0.807000 | 0.0765 |
| Title | Cluster Plot | Dendrogram | e-value | e-value | e-value | Condition | Condition FDR | Condition Difference |
|---|---|---|---|---|---|---|---|---|
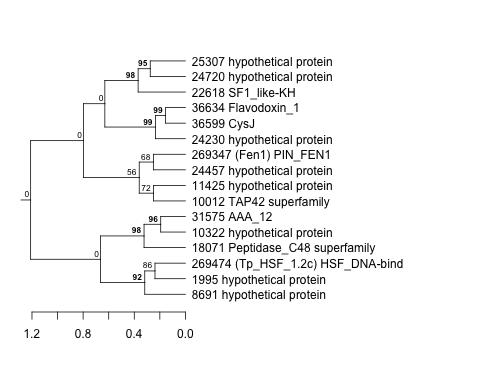
| Thaps_hclust_0191 |
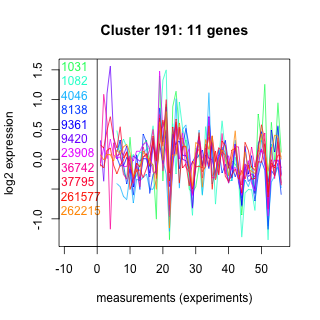 |
 |
1.5 |
3.5 |
44 |
highpH_TMEVA | 0.807000 | 0.0611 |
| Title | Cluster Plot | Dendrogram | e-value | e-value | e-value | Condition | Condition FDR | Condition Difference |
|---|---|---|---|---|---|---|---|---|
| Thaps_hclust_0174 |
 |
 |
1.3 |
0.99 |
2.2 |
highpH_TMEVA | 0.807000 | -0.0436 |
| Title | Cluster Plot | Dendrogram | e-value | e-value | e-value | Condition | Condition FDR | Condition Difference |
|---|---|---|---|---|---|---|---|---|
| Thaps_hclust_0159 |
 |
 |
0.087 |
1.3 |
3 |
diel_light_vs_dark | 0.807000 | 0.0824 |
| Title | Cluster Plot | Dendrogram | e-value | e-value | e-value | Condition | Condition FDR | Condition Difference |
|---|---|---|---|---|---|---|---|---|
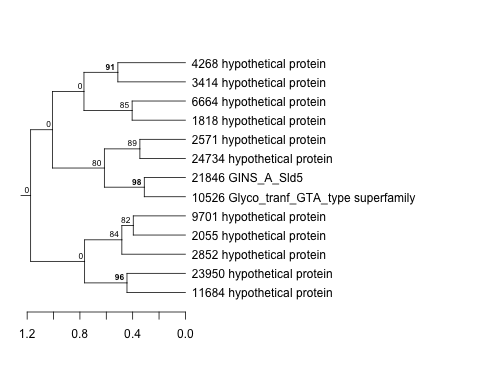
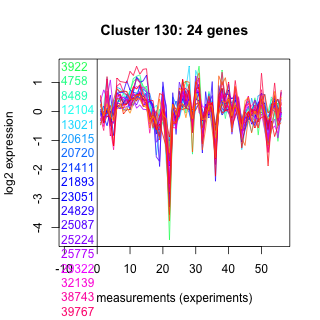
| Thaps_hclust_0130 |
 |
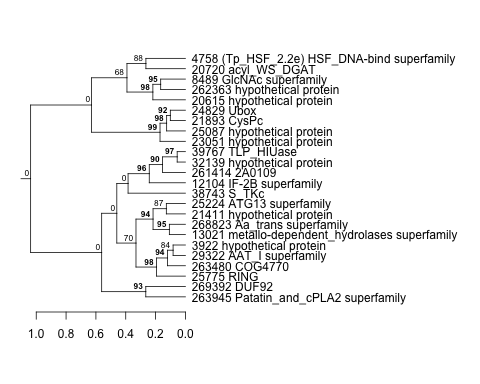 |
0.64 |
15 |
13 |
exponential_vs_stationary_24light | 0.807000 | -0.0931 |
| Title | Cluster Plot | Dendrogram | e-value | e-value | e-value | Condition | Condition FDR | Condition Difference |
|---|---|---|---|---|---|---|---|---|
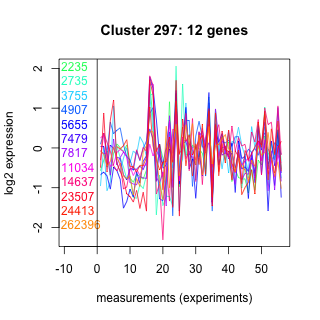
| Thaps_hclust_0297 |
 |
 |
0.018 |
2.5 |
24 |
co2_elevated_stat_arrays | 0.807000 | -0.0761 |
| Title | Cluster Plot | Dendrogram | e-value | e-value | e-value | Condition | Condition FDR | Condition Difference |
|---|---|---|---|---|---|---|---|---|
| Thaps_hclust_0036 |
 |
 |
0.0000003 |
0.00016 |
110 |
highpH_TMEVA | 0.807000 | 0.0397 |
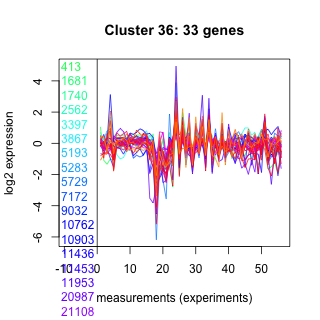
| Title | Cluster Plot | Dendrogram | e-value | e-value | e-value | Condition | Condition FDR | Condition Difference |
|---|---|---|---|---|---|---|---|---|
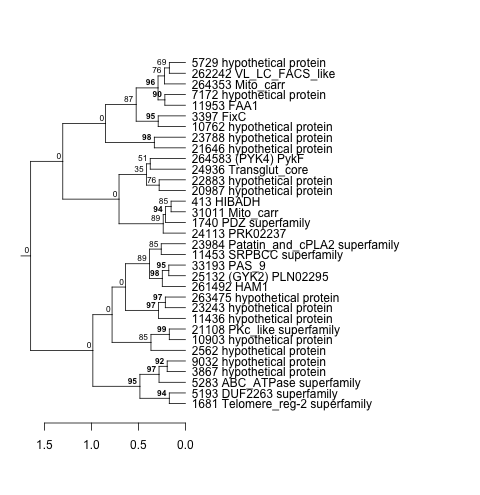
| Thaps_hclust_0151 |
 |
 |
0.015 |
0.13 |
16 |
diel_exponential_vs_stationary | 0.807000 | 0.0568 |
| Thaps_hclust_0151 |
|
|
0.015 |
0.13 |
16 |
exponential_vs_stationary_24highlight | 0.801000 | -0.0336 |
| Title | Cluster Plot | Dendrogram | e-value | e-value | e-value | Condition | Condition FDR | Condition Difference |
|---|---|---|---|---|---|---|---|---|
| Thaps_hclust_0457 |
 |
 |
0.0000081 |
0.1 |
0.53 |
lowFe_TMEVA | 0.807000 | -0.107 |
| Thaps_hclust_0457 |
|
|
0.0000081 |
0.1 |
0.53 |
co2_elevated_stat_arrays | 0.802000 | -0.0752 |
| Title | Cluster Plot | Dendrogram | e-value | e-value | e-value | Condition | Condition FDR | Condition Difference |
|---|---|---|---|---|---|---|---|---|
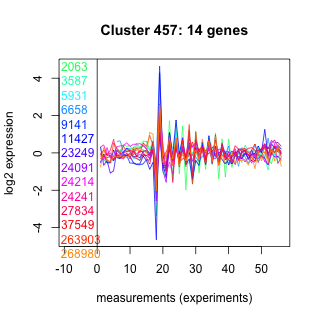
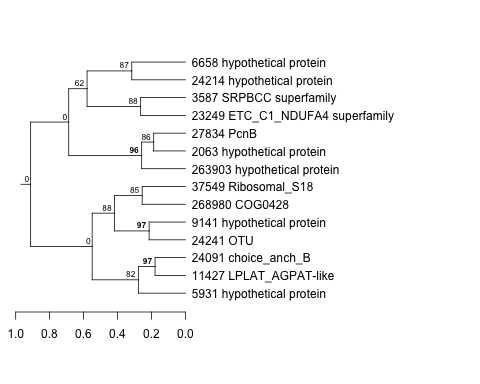
| Thaps_hclust_0197 |
 |
 |
0.12 |
0.3 |
0.65 |
diel_light_vs_dark | 0.807000 | 0.0819 |
| Title | Cluster Plot | Dendrogram | e-value | e-value | e-value | Condition | Condition FDR | Condition Difference |
|---|---|---|---|---|---|---|---|---|
| Thaps_hclust_0120 |
 |
 |
0.00000098 |
0.000000076 |
0.001 |
highpH_TMEVA | 0.806000 | -0.0477 |
| Title | Cluster Plot | Dendrogram | e-value | e-value | e-value | Condition | Condition FDR | Condition Difference |
|---|---|---|---|---|---|---|---|---|
| Thaps_hclust_0123 |
 |
 |
0.000073 |
0.05 |
0.076 |
exponential_vs_stationary_24light | 0.806000 | -0.0885 |
| Title | Cluster Plot | Dendrogram | e-value | e-value | e-value | Condition | Condition FDR | Condition Difference |
|---|---|---|---|---|---|---|---|---|
| Thaps_hclust_0258 |
 |
 |
0.027 |
0.021 |
0.036 |
lowSi_TMEVA | 0.806000 | -0.264 |
| Thaps_hclust_0258 |
|
|
0.027 |
0.021 |
0.036 |
diel_light_vs_dark | 0.802000 | -0.0968 |
| Title | Cluster Plot | Dendrogram | e-value | e-value | e-value | Condition | Condition FDR | Condition Difference |
|---|---|---|---|---|---|---|---|---|
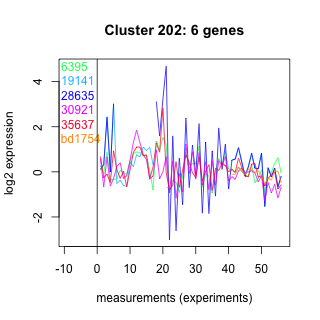
| Thaps_hclust_0202 |
 |
 |
0.0064 |
0.023 |
0.32 |
lowSi_TMEVA | 0.806000 | -0.291 |
| Title | Cluster Plot | Dendrogram | e-value | e-value | e-value | Condition | Condition FDR | Condition Difference |
|---|---|---|---|---|---|---|---|---|
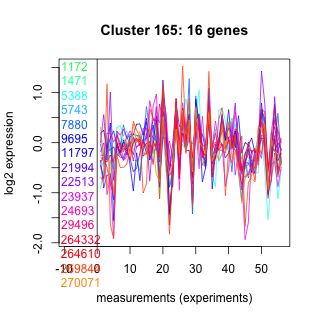
| Thaps_hclust_0165 |
 |
 |
0.00011 |
2.3 |
3.9 |
lowSi_TMEVA | 0.806000 | -0.256 |
| Title | Cluster Plot | Dendrogram | e-value | e-value | e-value | Condition | Condition FDR | Condition Difference |
|---|---|---|---|---|---|---|---|---|
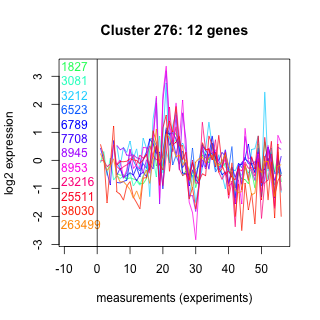
| Thaps_hclust_0276 |
 |
 |
0.063 |
39 |
53 |
lowSi_TMEVA | 0.806000 | -0.263 |
| Thaps_hclust_0276 |
|
|
0.063 |
39 |
53 |
co2_elevated_expo_arrays | 0.802000 | -0.0902 |
| Title | Cluster Plot | Dendrogram | e-value | e-value | e-value | Condition | Condition FDR | Condition Difference |
|---|---|---|---|---|---|---|---|---|
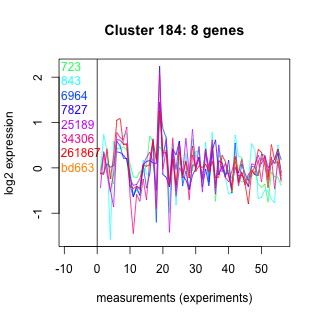
| Thaps_hclust_0184 |
 |
 |
80 |
320 |
240 |
highlight_arrays | 0.806000 | -0.067 |
| Title | Cluster Plot | Dendrogram | e-value | e-value | e-value | Condition | Condition FDR | Condition Difference |
|---|---|---|---|---|---|---|---|---|
| Thaps_hclust_0396 |
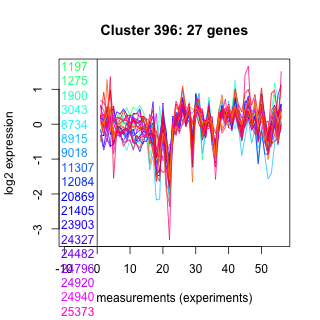 |
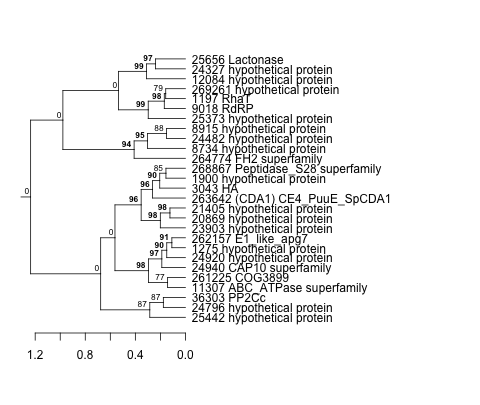 |
0.082 |
10 |
29 |
lowSi_TMEVA | 0.806000 | 0.241 |
| Title | Cluster Plot | Dendrogram | e-value | e-value | e-value | Condition | Condition FDR | Condition Difference |
|---|---|---|---|---|---|---|---|---|
| Thaps_hclust_0452 |
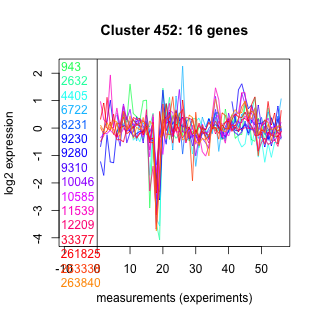 |
 |
84 |
200 |
220 |
exponential_vs_stationary_24highlight | 0.806000 | 0.0341 |
| Title | Cluster Plot | Dendrogram | e-value | e-value | e-value | Condition | Condition FDR | Condition Difference |
|---|---|---|---|---|---|---|---|---|
| Thaps_hclust_0356 |
 |
 |
2.1 |
41 |
71 |
lowSi_TMEVA | 0.806000 | 0.277 |
| Title | Cluster Plot | Dendrogram | e-value | e-value | e-value | Condition | Condition FDR | Condition Difference |
|---|---|---|---|---|---|---|---|---|
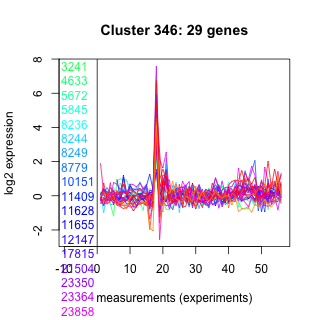
| Thaps_hclust_0346 |
 |
 |
0.00053 |
4.7 |
80 |
exponential_vs_stationary_24highlight | 0.806000 | 0.0252 |
| Title | Cluster Plot | Dendrogram | e-value | e-value | e-value | Condition | Condition FDR | Condition Difference |
|---|---|---|---|---|---|---|---|---|
| Thaps_hclust_0460 |
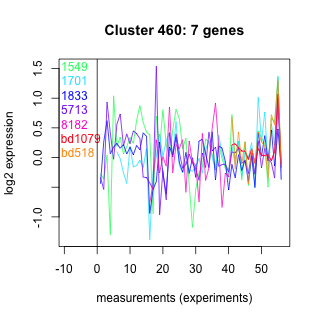 |
 |
0.0073 |
0.0055 |
0.63 |
lowSi_TMEVA | 0.806000 | -0.274 |
| Title | Cluster Plot | Dendrogram | e-value | e-value | e-value | Condition | Condition FDR | Condition Difference |
|---|---|---|---|---|---|---|---|---|
| Thaps_hclust_0461 |
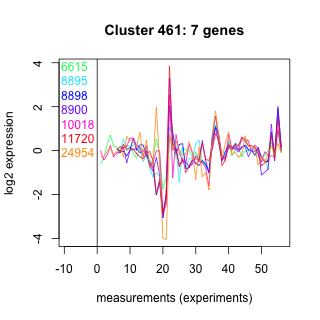 |
 |
0.00000000082 |
0.01 |
0.079 |
co2_elevated_stat_arrays | 0.805000 | 0.0903 |
| Title | Cluster Plot | Dendrogram | e-value | e-value | e-value | Condition | Condition FDR | Condition Difference |
|---|---|---|---|---|---|---|---|---|
| Thaps_hclust_0037 |
 |
 |
0.23 |
0.79 |
340 |
exponential_vs_stationary_24highlight | 0.805000 | -0.0273 |
| Title | Cluster Plot | Dendrogram | e-value | e-value | e-value | Condition | Condition FDR | Condition Difference |
|---|---|---|---|---|---|---|---|---|
| Thaps_hclust_0104 |
 |
 |
23 |
24 |
220 |
co2_elevated_expo_arrays | 0.805000 | -0.0934 |
| Title | Cluster Plot | Dendrogram | e-value | e-value | e-value | Condition | Condition FDR | Condition Difference |
|---|---|---|---|---|---|---|---|---|
| Thaps_hclust_0025 |
 |
 |
0.14 |
0.45 |
4.6 |
highpH_TMEVA | 0.804000 | -0.0607 |
| Title | Cluster Plot | Dendrogram | e-value | e-value | e-value | Condition | Condition FDR | Condition Difference |
|---|---|---|---|---|---|---|---|---|
| Thaps_hclust_0497 |
 |
 |
0.1 |
5.2 |
29 |
diel_exponential_vs_stationary | 0.804000 | -0.072 |
| Thaps_hclust_0497 |
|
|
0.1 |
5.2 |
29 |
lowFe_KTKB_Day5 | 0.802000 | 0.0754 |
| Title | Cluster Plot | Dendrogram | e-value | e-value | e-value | Condition | Condition FDR | Condition Difference |
|---|---|---|---|---|---|---|---|---|
| Thaps_hclust_0019 |
 |
 |
0.0000001 |
0.00000017 |
0.000037 |
lowFe_TMEVA | 0.803000 | -0.097 |
| Title | Cluster Plot | Dendrogram | e-value | e-value | e-value | Condition | Condition FDR | Condition Difference |
|---|---|---|---|---|---|---|---|---|
| Thaps_hclust_0446 |
 |
 |
0.0000045 |
0.018 |
0.021 |
highlight_arrays | 0.803000 | -0.0498 |
| Title | Cluster Plot | Dendrogram | e-value | e-value | e-value | Condition | Condition FDR | Condition Difference |
|---|---|---|---|---|---|---|---|---|
| Thaps_hclust_0227 |
 |
 |
1.2e-22 |
0.0000000098 |
0.0018 |
highlight_arrays | 0.803000 | -0.0342 |
| Title | Cluster Plot | Dendrogram | e-value | e-value | e-value | Condition | Condition FDR | Condition Difference |
|---|---|---|---|---|---|---|---|---|
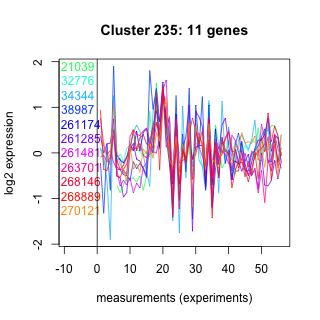
| Thaps_hclust_0235 |
 |
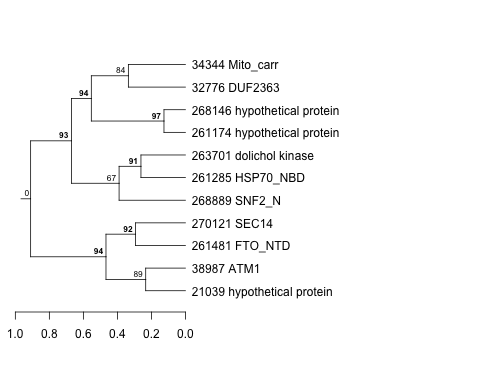 |
0.47 |
5.6 |
74 |
co2_elevated_expo_arrays | 0.802000 | 0.0924 |
| Title | Cluster Plot | Dendrogram | e-value | e-value | e-value | Condition | Condition FDR | Condition Difference |
|---|---|---|---|---|---|---|---|---|
| Thaps_hclust_0377 |
 |
 |
0.00016 |
0.034 |
0.95 |
co2_elevated_expo_arrays | 0.802000 | -0.077 |
| Title | Cluster Plot | Dendrogram | e-value | e-value | e-value | Condition | Condition FDR | Condition Difference |
|---|---|---|---|---|---|---|---|---|
| Thaps_hclust_0308 |
 |
 |
0.37 |
17 |
1.6 |
co2_elevated_expo_arrays | 0.802000 | -0.0941 |
| Title | Cluster Plot | Dendrogram | e-value | e-value | e-value | Condition | Condition FDR | Condition Difference |
|---|---|---|---|---|---|---|---|---|
| Thaps_hclust_0207 |
 |
 |
0.0000000025 |
0.0000000037 |
0.1 |
lowFe_KTKB_Day3 | 0.802000 | 0.0585 |
| Title | Cluster Plot | Dendrogram | e-value | e-value | e-value | Condition | Condition FDR | Condition Difference |
|---|---|---|---|---|---|---|---|---|
| Thaps_hclust_0412 |
 |
 |
0.39 |
17 |
2.9 |
co2_elevated_expo_arrays | 0.802000 | -0.0911 |
| Title | Cluster Plot | Dendrogram | e-value | e-value | e-value | Condition | Condition FDR | Condition Difference |
|---|---|---|---|---|---|---|---|---|
| Thaps_hclust_0112 |
 |
 |
0.00000035 |
0.017 |
0.34 |
co2_elevated_expo_arrays | 0.802000 | 0.0841 |
| Title | Cluster Plot | Dendrogram | e-value | e-value | e-value | Condition | Condition FDR | Condition Difference |
|---|---|---|---|---|---|---|---|---|
| Thaps_hclust_0366 |
 |
 |
0.000011 |
0.054 |
0.47 |
lowFe_KTKB_Day5 | 0.802000 | 0.047 |
| Title | Cluster Plot | Dendrogram | e-value | e-value | e-value | Condition | Condition FDR | Condition Difference |
|---|---|---|---|---|---|---|---|---|
| Thaps_hclust_0042 |
 |
 |
0.26 |
5.9 |
0.46 |
co2_elevated_expo_arrays | 0.802000 | 0.0844 |
| Title | Cluster Plot | Dendrogram | e-value | e-value | e-value | Condition | Condition FDR | Condition Difference |
|---|---|---|---|---|---|---|---|---|
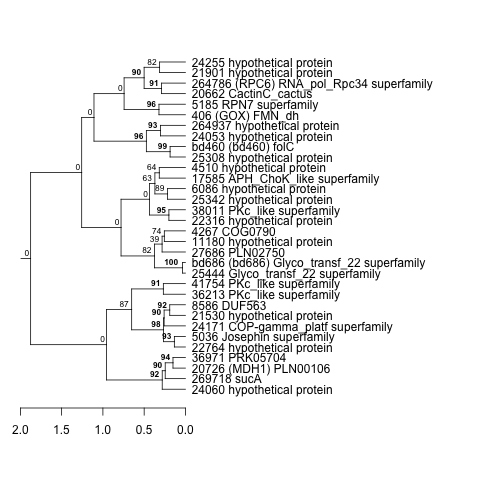
| Thaps_hclust_0425 |
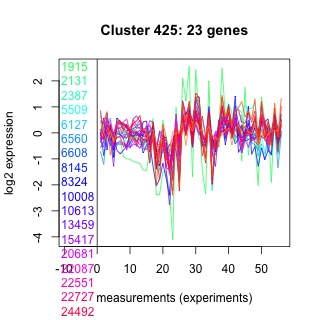 |
 |
0.017 |
1.1 |
140 |
co2_elevated_expo_arrays | 0.802000 | 0.0805 |
| Title | Cluster Plot | Dendrogram | e-value | e-value | e-value | Condition | Condition FDR | Condition Difference |
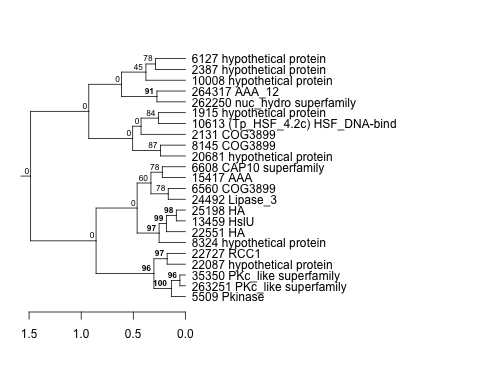
|---|---|---|---|---|---|---|---|---|
| Thaps_hclust_0442 |
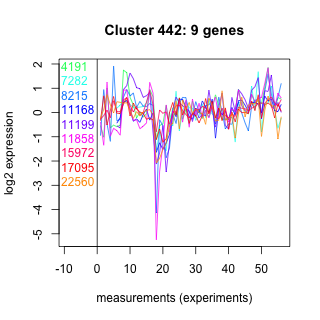 |
 |
0.045 |
2.3 |
2.8 |
co2_elevated_expo_arrays | 0.802000 | 0.099 |