Hierarchical Clusters
Displaying 1901 - 2000 of 7500
| Title | Cluster Plot | Dendrogram | e-value | e-value | e-value | Condition | Condition FDR | Condition Difference |
|---|---|---|---|---|---|---|---|---|
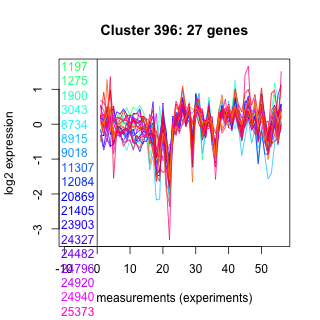
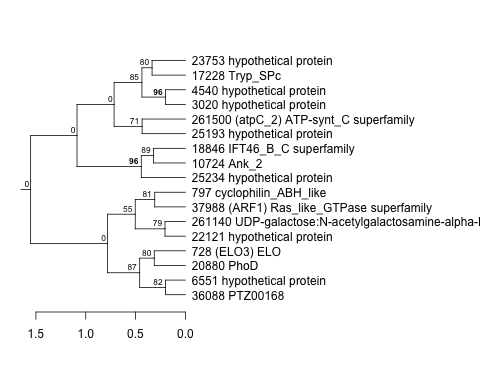
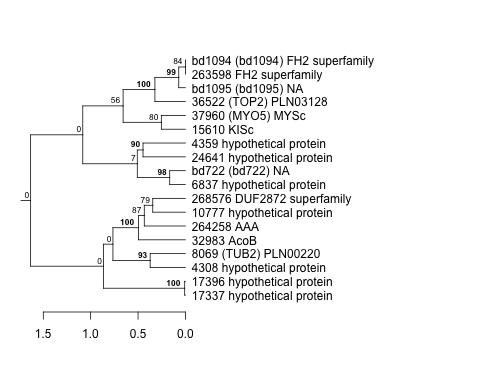
| Thaps_hclust_0396 |
 |
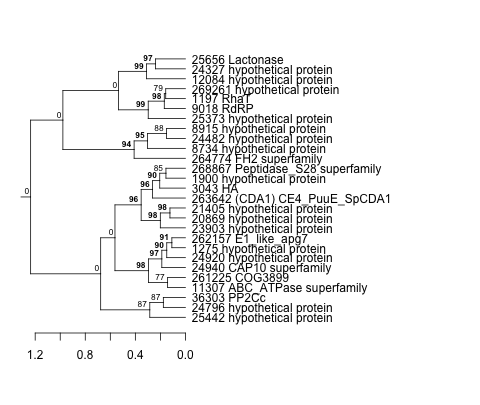 |
0.082 |
10 |
29 |
lowtemp_TMEVA | 0.247000 | -0.254 |
| Title | Cluster Plot | Dendrogram | e-value | e-value | e-value | Condition | Condition FDR | Condition Difference |
|---|---|---|---|---|---|---|---|---|
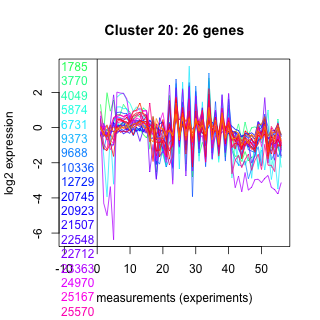
| Thaps_hclust_0020 |
 |
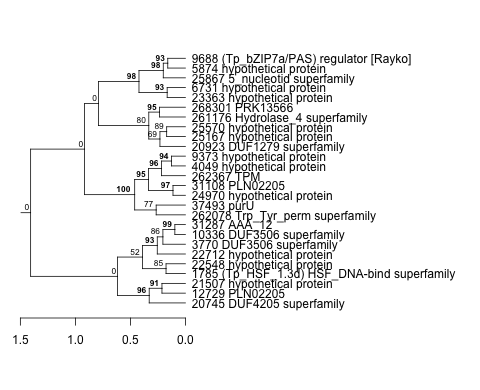 |
0.004 |
0.15 |
3.3 |
co2_elevated_stat_arrays | 0.229000 | -0.254 |
| Thaps_hclust_0020 |
|
|
0.004 |
0.15 |
3.3 |
highlight_arrays | 0.075500 | -0.248 |
| Title | Cluster Plot | Dendrogram | e-value | e-value | e-value | Condition | Condition FDR | Condition Difference |
|---|---|---|---|---|---|---|---|---|
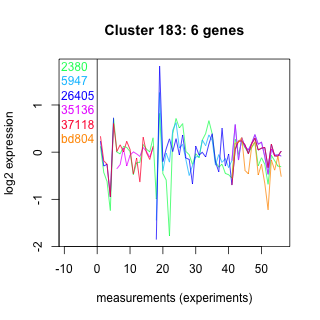
| Thaps_hclust_0183 |
 |
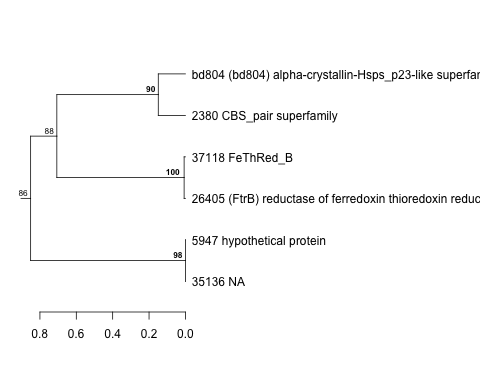 |
0.000026 |
0.000017 |
0.00004 |
exponential_vs_stationary_24highlight | 0.195000 | -0.254 |
| Title | Cluster Plot | Dendrogram | e-value | e-value | e-value | Condition | Condition FDR | Condition Difference |
|---|---|---|---|---|---|---|---|---|
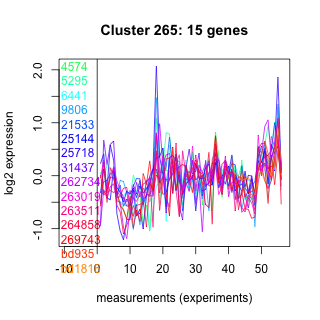
| Thaps_hclust_0265 |
 |
 |
0.02 |
0.000051 |
27 |
lowFe_KTKB_Day5 | 0.284000 | -0.254 |
| Title | Cluster Plot | Dendrogram | e-value | e-value | e-value | Condition | Condition FDR | Condition Difference |
|---|---|---|---|---|---|---|---|---|
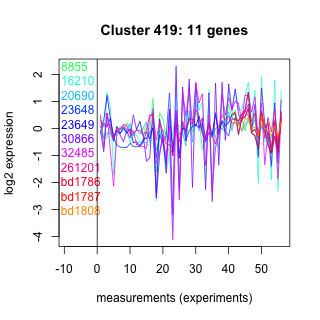
| Thaps_hclust_0419 |
 |
 |
0.0014 |
0.00031 |
0.0014 |
lowFe_KTKB_Day3 | 0.447000 | -0.254 |
| Thaps_hclust_0419 |
|
|
0.0014 |
0.00031 |
0.0014 |
exponential_vs_stationary_24highlight | 0.081700 | -0.245 |
| Title | Cluster Plot | Dendrogram | e-value | e-value | e-value | Condition | Condition FDR | Condition Difference |
|---|---|---|---|---|---|---|---|---|
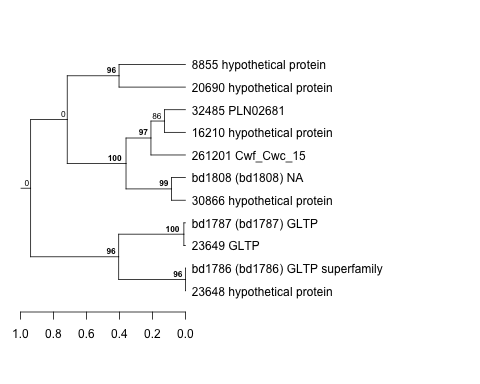
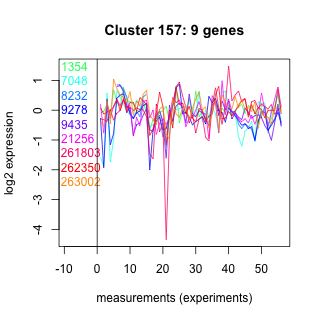
| Thaps_hclust_0157 |
 |
 |
2 |
4.6 |
4.9 |
co2_elevated_stat_arrays | 0.405000 | -0.254 |
| Title | Cluster Plot | Dendrogram | e-value | e-value | e-value | Condition | Condition FDR | Condition Difference |
|---|---|---|---|---|---|---|---|---|
| Thaps_hclust_0498 |
 |
 |
1.3 |
1.8 |
1.8 |
exponential_vs_stationary_24highlight | 0.026000 | -0.253 |
| Title | Cluster Plot | Dendrogram | e-value | e-value | e-value | Condition | Condition FDR | Condition Difference |
|---|---|---|---|---|---|---|---|---|
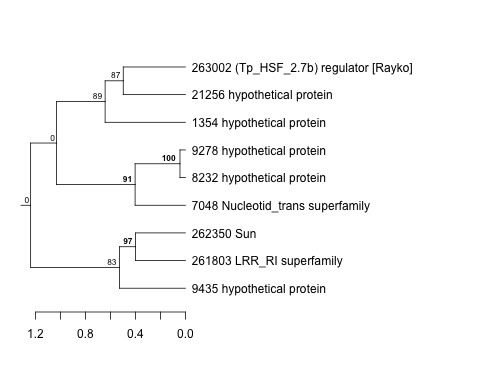
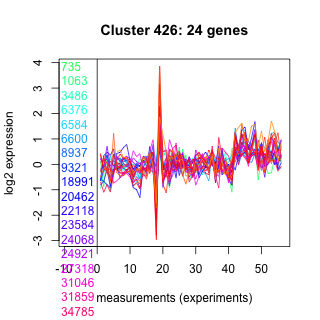
| Thaps_hclust_0426 |
 |
 |
0.0000000000000021 |
0.00000000000026 |
0.000025 |
exponential_vs_stationary_24highlight | 0.008460 | -0.253 |
| Title | Cluster Plot | Dendrogram | e-value | e-value | e-value | Condition | Condition FDR | Condition Difference |
|---|---|---|---|---|---|---|---|---|
| Thaps_hclust_0160 |
 |
 |
0.35 |
66 |
160 |
lowFe_KTKB_Day5 | 0.334000 | -0.253 |
| Title | Cluster Plot | Dendrogram | e-value | e-value | e-value | Condition | Condition FDR | Condition Difference |
|---|---|---|---|---|---|---|---|---|
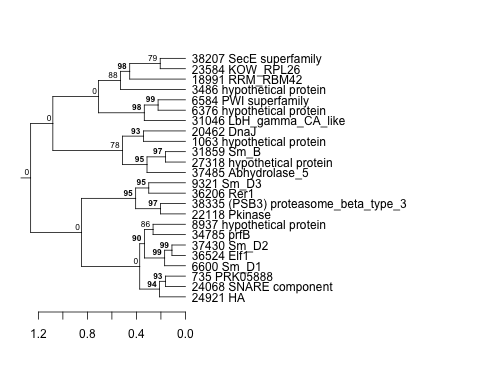
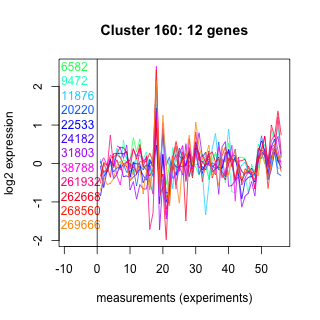
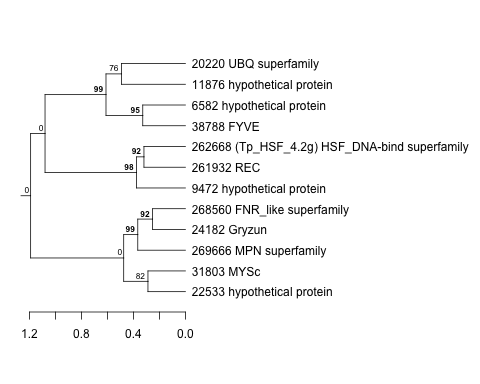
| Thaps_hclust_0251 |
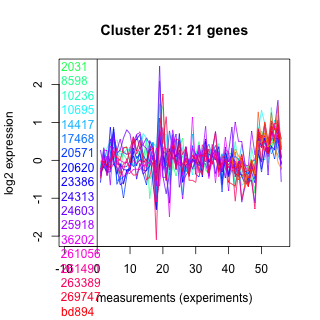 |
 |
0.027 |
0.025 |
9.3 |
highpH_TMEVA | 0.110000 | -0.253 |
| Title | Cluster Plot | Dendrogram | e-value | e-value | e-value | Condition | Condition FDR | Condition Difference |
|---|---|---|---|---|---|---|---|---|
| Thaps_hclust_0085 |
 |
 |
0.000012 |
0.0024 |
0.37 |
highpH_TMEVA | 0.074600 | -0.253 |
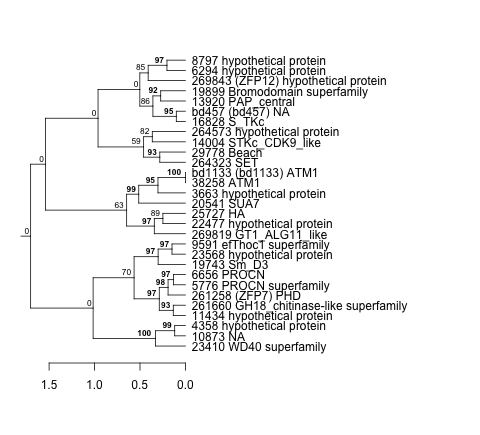
| Title | Cluster Plot | Dendrogram | e-value | e-value | e-value | Condition | Condition FDR | Condition Difference |
|---|---|---|---|---|---|---|---|---|
| Thaps_hclust_0457 |
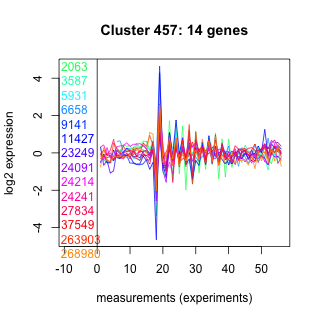 |
 |
0.0000081 |
0.1 |
0.53 |
lowN_TMEVA | 0.524000 | -0.252 |
| Title | Cluster Plot | Dendrogram | e-value | e-value | e-value | Condition | Condition FDR | Condition Difference |
|---|---|---|---|---|---|---|---|---|
| Thaps_hclust_0367 |
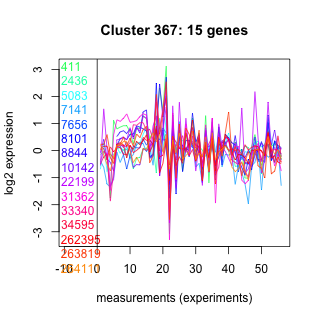 |
 |
0.027 |
0.079 |
0.86 |
lowN_TMEVA | 0.515000 | -0.252 |
| Title | Cluster Plot | Dendrogram | e-value | e-value | e-value | Condition | Condition FDR | Condition Difference |
|---|---|---|---|---|---|---|---|---|
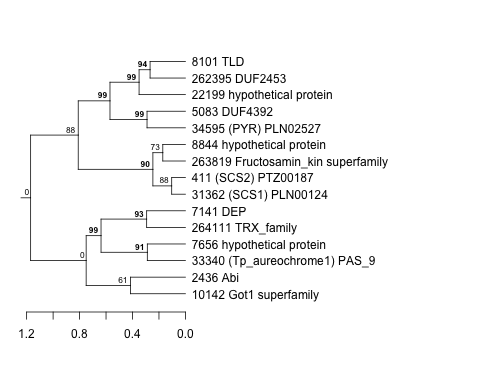
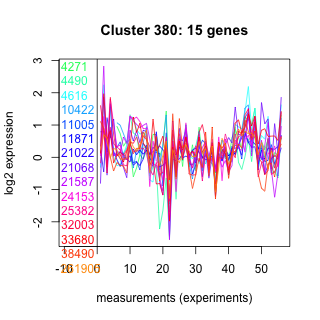
| Thaps_hclust_0380 |
 |
 |
1.1 |
5 |
8.7 |
diel_exponential_vs_stationary | 0.233000 | -0.252 |
| Title | Cluster Plot | Dendrogram | e-value | e-value | e-value | Condition | Condition FDR | Condition Difference |
|---|---|---|---|---|---|---|---|---|
| Thaps_hclust_0494 |
 |
 |
6.7 |
15 |
60 |
co2_elevated_expo_arrays | 0.068700 | -0.252 |
| Title | Cluster Plot | Dendrogram | e-value | e-value | e-value | Condition | Condition FDR | Condition Difference |
|---|---|---|---|---|---|---|---|---|
| Thaps_hclust_0214 |
 |
 |
0.00006 |
0.0000000031 |
0.00076 |
lowN_TMEVA | 0.330000 | -0.252 |
| Title | Cluster Plot | Dendrogram | e-value | e-value | e-value | Condition | Condition FDR | Condition Difference |
|---|---|---|---|---|---|---|---|---|
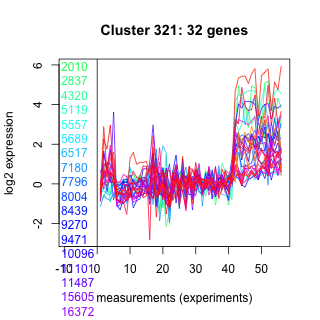
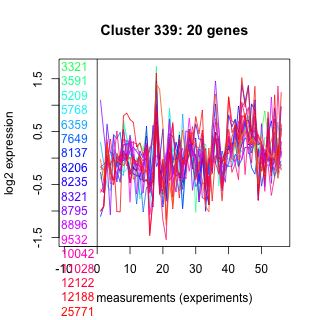
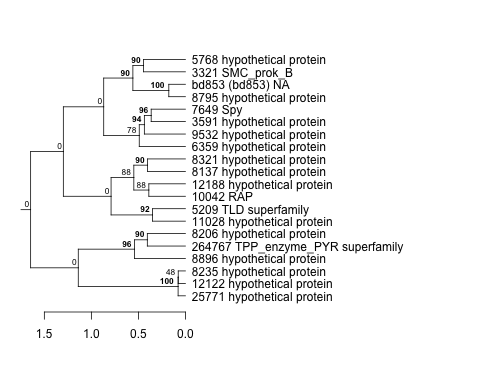
| Thaps_hclust_0321 |
 |
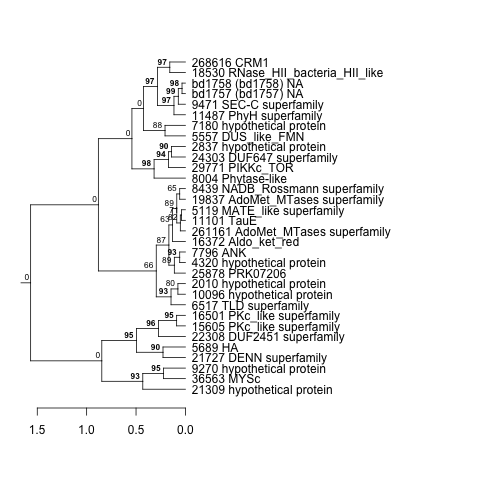 |
0.000000086 |
0.0000000042 |
0.0000028 |
highlight_arrays | 0.046900 | -0.251 |
| Title | Cluster Plot | Dendrogram | e-value | e-value | e-value | Condition | Condition FDR | Condition Difference |
|---|---|---|---|---|---|---|---|---|
| Thaps_hclust_0349 |
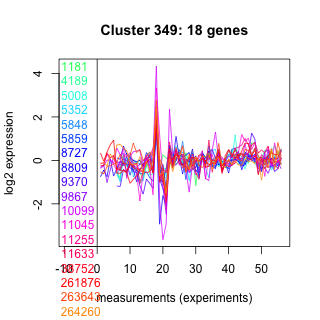 |
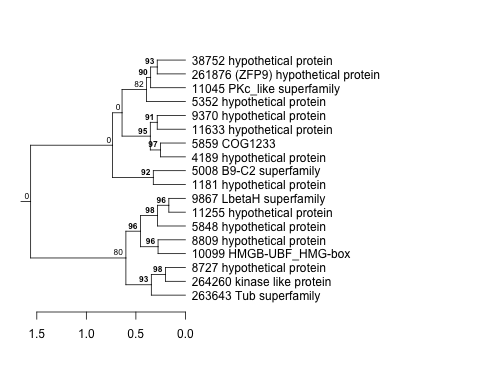 |
360 |
5.4 |
67 |
lowFe_TMEVA | 0.397000 | -0.251 |
| Title | Cluster Plot | Dendrogram | e-value | e-value | e-value | Condition | Condition FDR | Condition Difference |
|---|---|---|---|---|---|---|---|---|
| Thaps_hclust_0069 |
 |
 |
1.2e-26 |
2.6e-24 |
2.4e-20 |
lowFe_KTKB_Day5 | 0.059800 | -0.251 |
| Title | Cluster Plot | Dendrogram | e-value | e-value | e-value | Condition | Condition FDR | Condition Difference |
|---|---|---|---|---|---|---|---|---|
| Thaps_hclust_0500 |
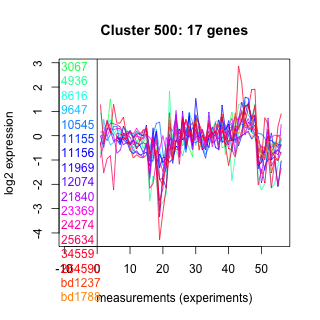 |
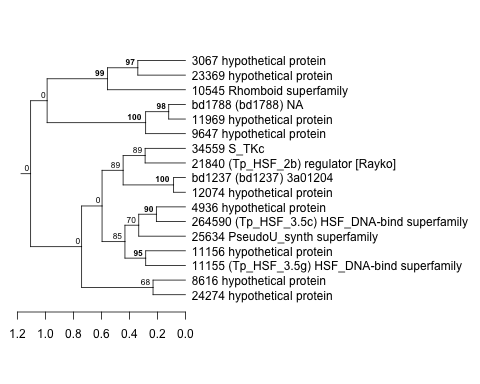 |
0.91 |
14 |
30 |
exponential_vs_stationary_24light | 0.499000 | -0.251 |
| Title | Cluster Plot | Dendrogram | e-value | e-value | e-value | Condition | Condition FDR | Condition Difference |
|---|---|---|---|---|---|---|---|---|
| Thaps_hclust_0110 |
 |
 |
0.64 |
35 |
160 |
diel_light_vs_dark | 0.491000 | -0.251 |
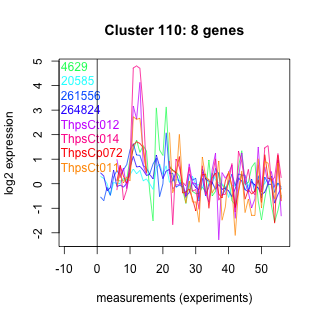
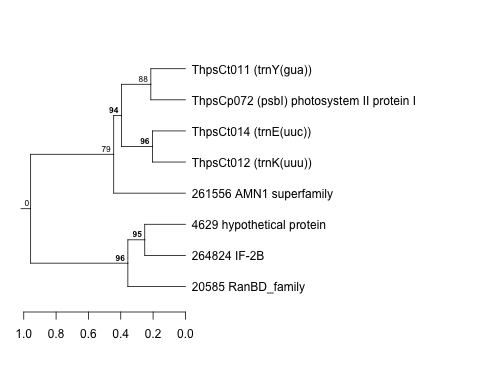
| Title | Cluster Plot | Dendrogram | e-value | e-value | e-value | Condition | Condition FDR | Condition Difference |
|---|---|---|---|---|---|---|---|---|
| Thaps_hclust_0136 |
 |
 |
0.0034 |
0.034 |
340 |
lowFe_KTKB_Day3 | 0.200000 | -0.251 |
| Title | Cluster Plot | Dendrogram | e-value | e-value | e-value | Condition | Condition FDR | Condition Difference |
|---|---|---|---|---|---|---|---|---|
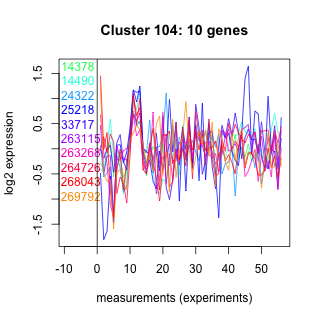
| Thaps_hclust_0104 |
 |
 |
23 |
24 |
220 |
lowSi_TMEVA | 0.824000 | -0.251 |
| Title | Cluster Plot | Dendrogram | e-value | e-value | e-value | Condition | Condition FDR | Condition Difference |
|---|---|---|---|---|---|---|---|---|
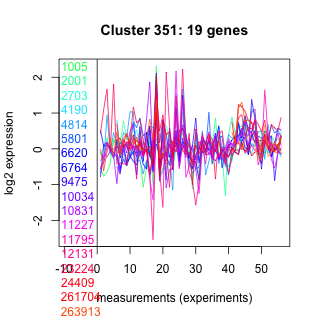
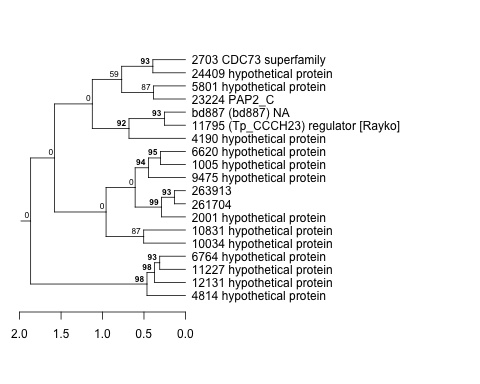
| Thaps_hclust_0351 |
 |
 |
0.033 |
0.06 |
50 |
highpH_TMEVA | 0.129000 | -0.251 |
| Title | Cluster Plot | Dendrogram | e-value | e-value | e-value | Condition | Condition FDR | Condition Difference |
|---|---|---|---|---|---|---|---|---|
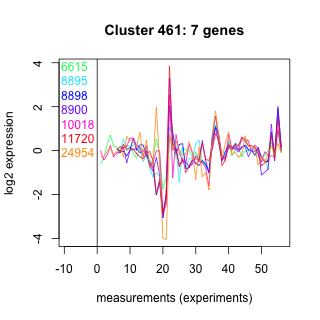
| Thaps_hclust_0461 |
 |
 |
0.00000000082 |
0.01 |
0.079 |
diel_light_vs_dark | 0.535000 | -0.25 |
| Title | Cluster Plot | Dendrogram | e-value | e-value | e-value | Condition | Condition FDR | Condition Difference |
|---|---|---|---|---|---|---|---|---|
| Thaps_hclust_0448 |
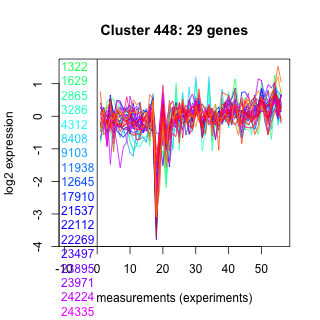 |
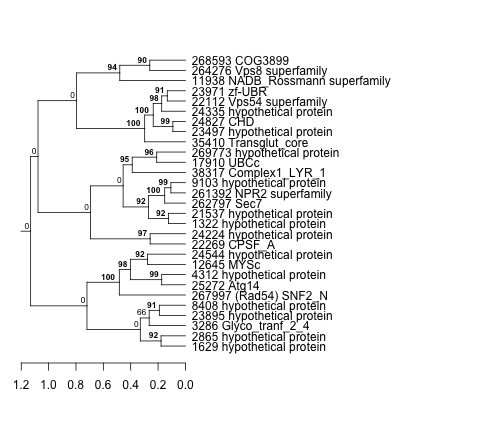 |
0.0000000026 |
0.00021 |
8.2 |
co2_elevated_stat_arrays | 0.218000 | -0.25 |
| Thaps_hclust_0448 |
|
|
0.0000000026 |
0.00021 |
8.2 |
lowtemp_TMEVA | 0.263000 | -0.241 |
| Thaps_hclust_0448 |
|
|
0.0000000026 |
0.00021 |
8.2 |
lowN_TMEVA | 0.464000 | -0.241 |
| Title | Cluster Plot | Dendrogram | e-value | e-value | e-value | Condition | Condition FDR | Condition Difference |
|---|---|---|---|---|---|---|---|---|
| Thaps_hclust_0061 |
 |
 |
0.000000062 |
0.00063 |
0.032 |
lowN_TMEVA | 0.532000 | -0.25 |
| Title | Cluster Plot | Dendrogram | e-value | e-value | e-value | Condition | Condition FDR | Condition Difference |
|---|---|---|---|---|---|---|---|---|
| Thaps_hclust_0042 |
 |
 |
0.26 |
5.9 |
0.46 |
BaP | 0.320000 | -0.25 |
| Title | Cluster Plot | Dendrogram | e-value | e-value | e-value | Condition | Condition FDR | Condition Difference |
|---|---|---|---|---|---|---|---|---|
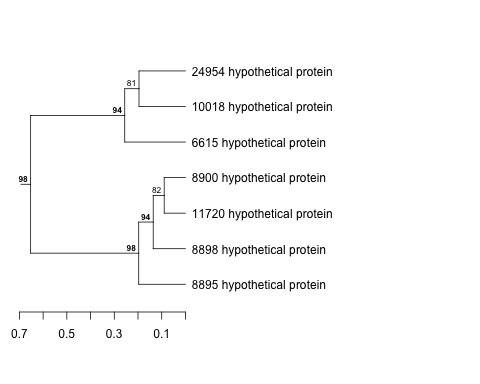
| Thaps_hclust_0398 |
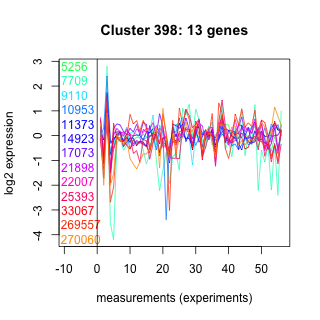 |
 |
0.014 |
0.28 |
1.2 |
BaP | 0.374000 | -0.249 |
| Thaps_hclust_0398 |
|
|
0.014 |
0.28 |
1.2 |
lowFe_KTKB_Day3 | 0.429000 | -0.245 |
| Thaps_hclust_0398 |
|
|
0.014 |
0.28 |
1.2 |
exponential_vs_stationary_24highlight | 0.065900 | -0.24 |
| Title | Cluster Plot | Dendrogram | e-value | e-value | e-value | Condition | Condition FDR | Condition Difference |
|---|---|---|---|---|---|---|---|---|
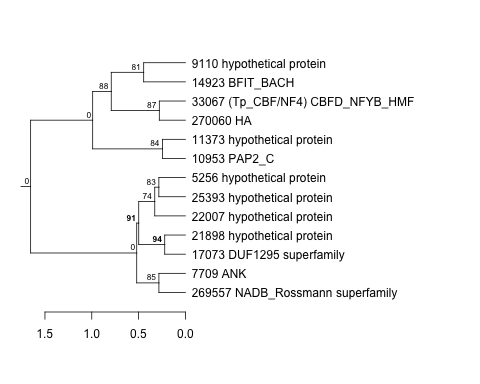
| Thaps_hclust_0299 |
 |
 |
0.0056 |
1.7 |
6.7 |
diel_light_vs_dark | 0.415000 | -0.249 |
| Title | Cluster Plot | Dendrogram | e-value | e-value | e-value | Condition | Condition FDR | Condition Difference |
|---|---|---|---|---|---|---|---|---|
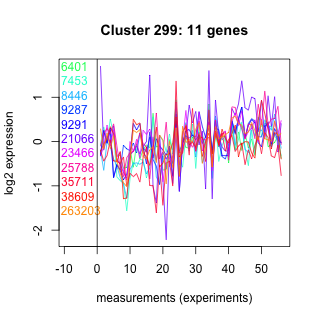
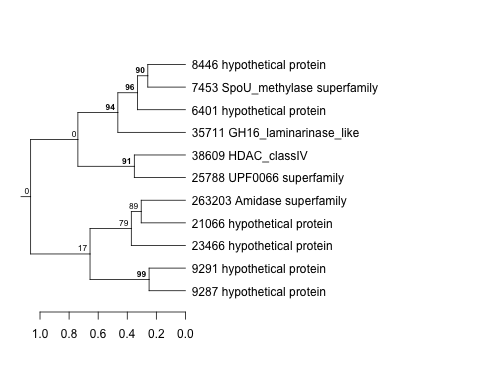
| Thaps_hclust_0362 |
 |
 |
0.00003 |
0.0033 |
0.66 |
exponential_vs_stationary_24light | 0.475000 | -0.249 |
| Title | Cluster Plot | Dendrogram | e-value | e-value | e-value | Condition | Condition FDR | Condition Difference |
|---|---|---|---|---|---|---|---|---|
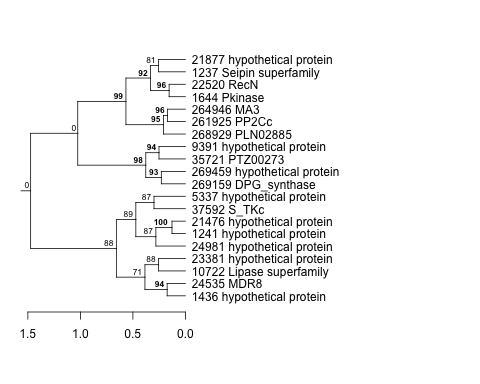
| Thaps_hclust_0286 |
 |
 |
0.00008 |
0.0046 |
0.0058 |
lowFe_TMEVA | 0.456000 | -0.249 |
| Title | Cluster Plot | Dendrogram | e-value | e-value | e-value | Condition | Condition FDR | Condition Difference |
|---|---|---|---|---|---|---|---|---|
| Thaps_hclust_0230 |
 |
|
|
1.1e-30 |
0.0000000000029 |
highpH_TMEVA | 0.000725 | -0.249 |
| Title | Cluster Plot | Dendrogram | e-value | e-value | e-value | Condition | Condition FDR | Condition Difference |
|---|---|---|---|---|---|---|---|---|
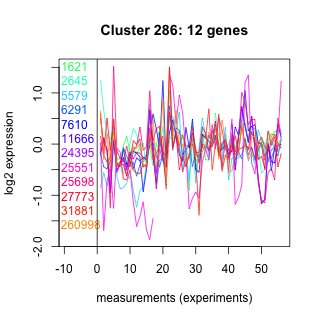
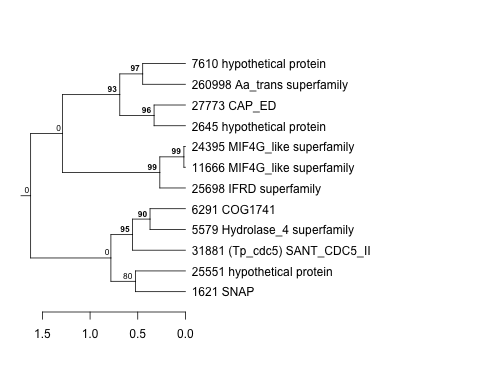
| Thaps_hclust_0331 |
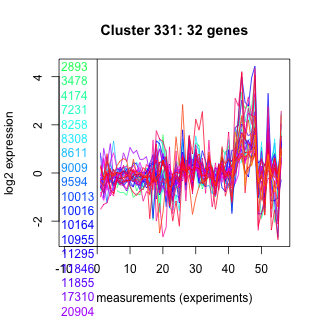 |
 |
0.000000000011 |
20 |
1600 |
lowtemp_TMEVA | 0.218000 | -0.248 |
| Title | Cluster Plot | Dendrogram | e-value | e-value | e-value | Condition | Condition FDR | Condition Difference |
|---|---|---|---|---|---|---|---|---|
| Thaps_hclust_0326 |
 |
 |
0.000000000000042 |
0.00000000011 |
0.00000051 |
lowFe_KTKB_Day3 | 0.073600 | -0.248 |
| Title | Cluster Plot | Dendrogram | e-value | e-value | e-value | Condition | Condition FDR | Condition Difference |
|---|---|---|---|---|---|---|---|---|
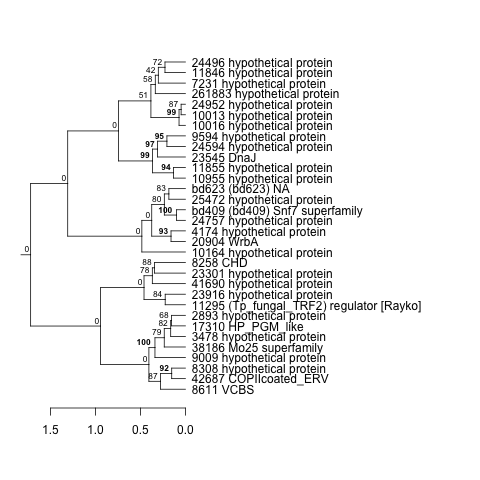
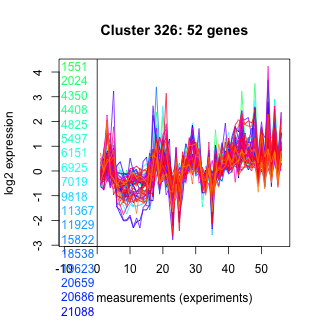
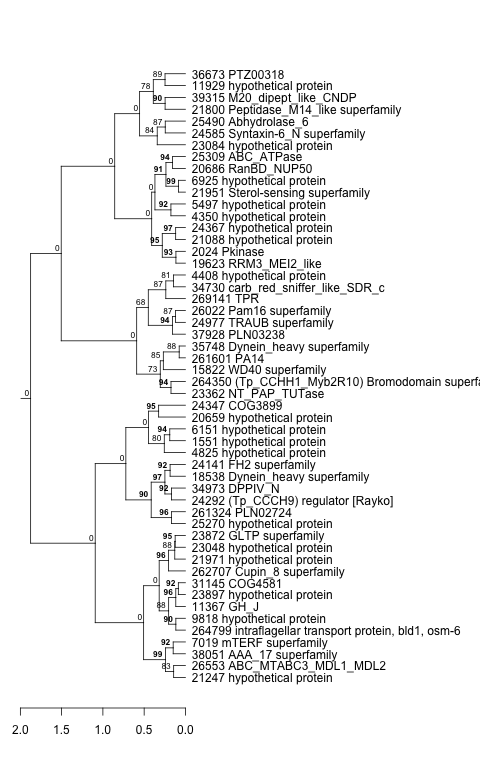
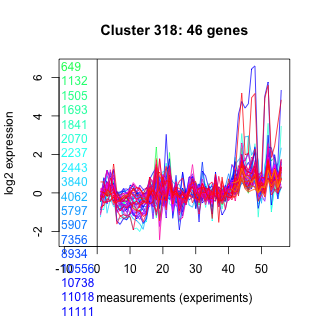
| Thaps_hclust_0318 |
 |
 |
1.1e-17 |
0.000000015 |
0.0000081 |
diel_light_vs_dark | 0.055300 | -0.248 |
| Title | Cluster Plot | Dendrogram | e-value | e-value | e-value | Condition | Condition FDR | Condition Difference |
|---|---|---|---|---|---|---|---|---|
| Thaps_hclust_0144 |
 |
 |
0.000000001 |
0.0000000019 |
0.00000019 |
lowFe_KTKB_Day5 | 0.062800 | -0.248 |
| Title | Cluster Plot | Dendrogram | e-value | e-value | e-value | Condition | Condition FDR | Condition Difference |
|---|---|---|---|---|---|---|---|---|
| Thaps_hclust_0125 |
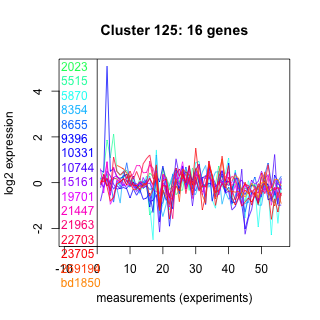 |
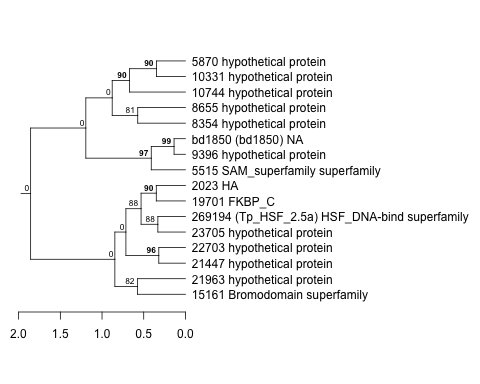 |
0.1 |
0.35 |
2.4 |
exponential_vs_stationary_24light | 0.521000 | -0.248 |
| Title | Cluster Plot | Dendrogram | e-value | e-value | e-value | Condition | Condition FDR | Condition Difference |
|---|---|---|---|---|---|---|---|---|
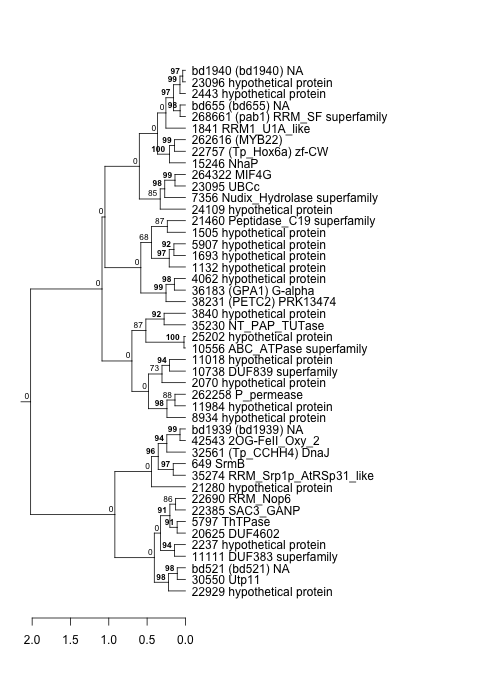
| Thaps_hclust_0179 |
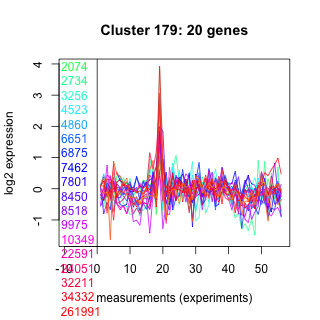 |
 |
0.0000039 |
0.056 |
2.8 |
co2_elevated_stat_arrays | 0.296000 | -0.248 |
| Title | Cluster Plot | Dendrogram | e-value | e-value | e-value | Condition | Condition FDR | Condition Difference |
|---|---|---|---|---|---|---|---|---|
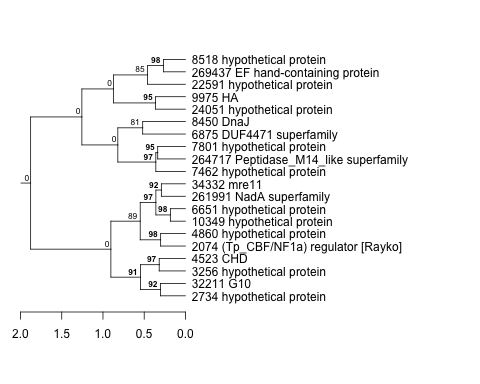
| Thaps_hclust_0277 |
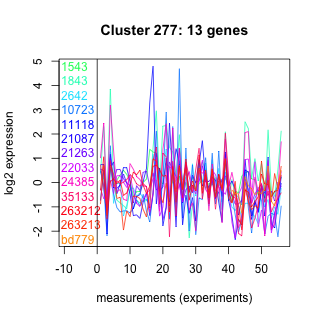 |
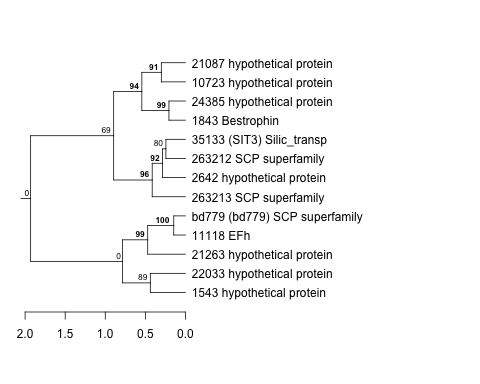 |
0.00036 |
6.6 |
7.6 |
lowFe_KTKB_Day3 | 0.422000 | -0.248 |
| Title | Cluster Plot | Dendrogram | e-value | e-value | e-value | Condition | Condition FDR | Condition Difference |
|---|---|---|---|---|---|---|---|---|
| Thaps_hclust_0158 |
 |
 |
0.007 |
0.55 |
1.2 |
lowtemp_TMEVA | 0.388000 | -0.248 |
| Title | Cluster Plot | Dendrogram | e-value | e-value | e-value | Condition | Condition FDR | Condition Difference |
|---|---|---|---|---|---|---|---|---|
| Thaps_hclust_0019 |
 |
 |
0.0000001 |
0.00000017 |
0.000037 |
diel_light_vs_dark | 0.213000 | -0.247 |
| Title | Cluster Plot | Dendrogram | e-value | e-value | e-value | Condition | Condition FDR | Condition Difference |
|---|---|---|---|---|---|---|---|---|
| Thaps_hclust_0078 |
 |
 |
8.1e-17 |
0.00018 |
0.021 |
co2_elevated_stat_arrays | 0.234000 | -0.247 |
| Title | Cluster Plot | Dendrogram | e-value | e-value | e-value | Condition | Condition FDR | Condition Difference |
|---|---|---|---|---|---|---|---|---|
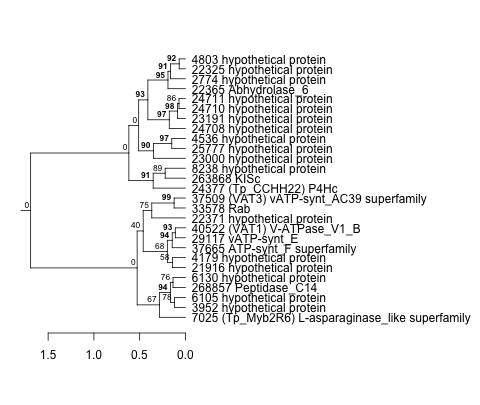
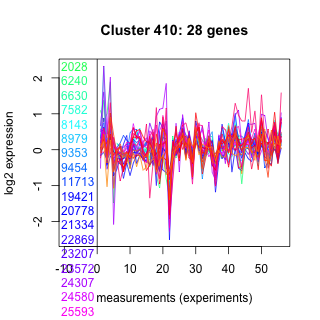
| Thaps_hclust_0410 |
 |
 |
0.065 |
0.56 |
0.36 |
diel_exponential_vs_stationary | 0.094900 | -0.247 |
| Title | Cluster Plot | Dendrogram | e-value | e-value | e-value | Condition | Condition FDR | Condition Difference |
|---|---|---|---|---|---|---|---|---|
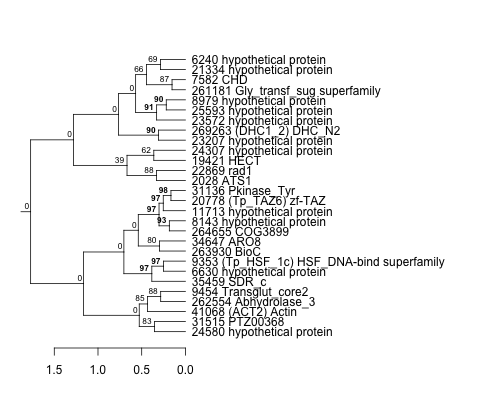
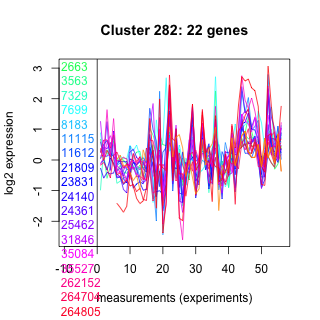
| Thaps_hclust_0282 |
 |
 |
0.0005 |
0.0059 |
0.15 |
co2_elevated_expo_arrays | 0.076900 | -0.247 |
| Thaps_hclust_0282 |
|
|
0.0005 |
0.0059 |
0.15 |
diel_light_vs_dark | 0.223000 | -0.242 |
| Title | Cluster Plot | Dendrogram | e-value | e-value | e-value | Condition | Condition FDR | Condition Difference |
|---|---|---|---|---|---|---|---|---|
| Thaps_hclust_0092 |
 |
|
1.3e-37 |
4.2e-20 |
0.0000000000000013 |
lowtemp_TMEVA | 0.038100 | -0.246 |
| Title | Cluster Plot | Dendrogram | e-value | e-value | e-value | Condition | Condition FDR | Condition Difference |
|---|---|---|---|---|---|---|---|---|
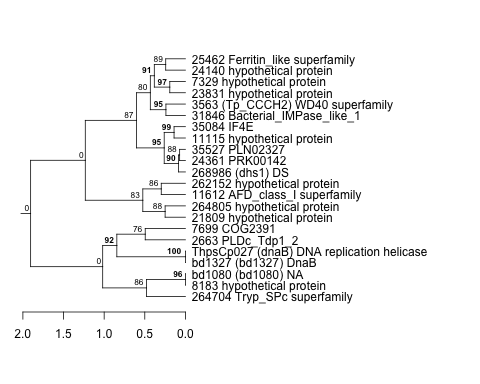
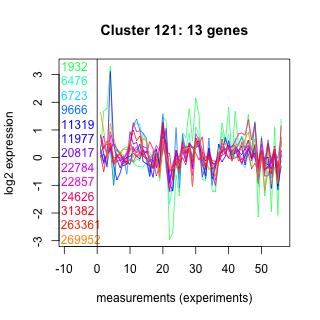
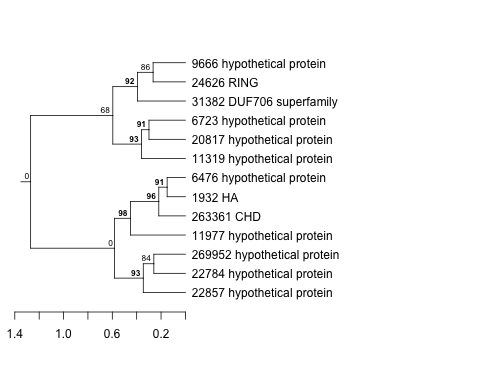
| Thaps_hclust_0121 |
 |
 |
0.00021 |
0.77 |
30 |
diel_light_vs_dark | 0.367000 | -0.246 |
| Title | Cluster Plot | Dendrogram | e-value | e-value | e-value | Condition | Condition FDR | Condition Difference |
|---|---|---|---|---|---|---|---|---|
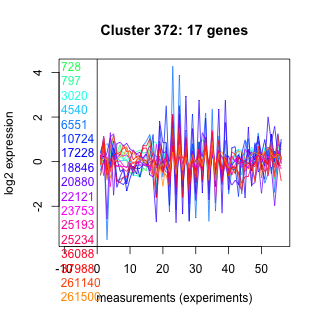
| Thaps_hclust_0372 |
 |
 |
0.0016 |
0.064 |
18 |
highlight_arrays | 0.151000 | -0.246 |
| Title | Cluster Plot | Dendrogram | e-value | e-value | e-value | Condition | Condition FDR | Condition Difference |
|---|---|---|---|---|---|---|---|---|
| Thaps_hclust_0044 |
 |
 |
0.27 |
2.6 |
4.2 |
lowFe_KTKB_Day3 | 0.454000 | -0.246 |
| Title | Cluster Plot | Dendrogram | e-value | e-value | e-value | Condition | Condition FDR | Condition Difference |
|---|---|---|---|---|---|---|---|---|
| Thaps_hclust_0169 |
 |
 |
2.2 |
23 |
3.9 |
lowSi_TMEVA | 0.824000 | -0.246 |
| Thaps_hclust_0169 |
|
|
2.2 |
23 |
3.9 |
highlight_arrays | 0.207000 | -0.246 |
| Title | Cluster Plot | Dendrogram | e-value | e-value | e-value | Condition | Condition FDR | Condition Difference |
|---|---|---|---|---|---|---|---|---|
| Thaps_hclust_0039 |
 |
 |
2.2e-16 |
0.000000000000049 |
0.00083 |
highlight_arrays | 0.017500 | -0.246 |
| Title | Cluster Plot | Dendrogram | e-value | e-value | e-value | Condition | Condition FDR | Condition Difference |
|---|---|---|---|---|---|---|---|---|
| Thaps_hclust_0134 |
 |
 |
0.00013 |
0.55 |
0.0039 |
lowFe_KTKB_Day3 | 0.363000 | -0.245 |
| Title | Cluster Plot | Dendrogram | e-value | e-value | e-value | Condition | Condition FDR | Condition Difference |
|---|---|---|---|---|---|---|---|---|
| Thaps_hclust_0415 |
 |
 |
0.0000000000041 |
0.000000046 |
0.000024 |
co2_elevated_stat_arrays | 0.166000 | -0.245 |
| Title | Cluster Plot | Dendrogram | e-value | e-value | e-value | Condition | Condition FDR | Condition Difference |
|---|---|---|---|---|---|---|---|---|
| Thaps_hclust_0273 |
 |
 |
0.052 |
0.27 |
12 |
highpH_TMEVA | 0.205000 | -0.245 |
| Title | Cluster Plot | Dendrogram | e-value | e-value | e-value | Condition | Condition FDR | Condition Difference |
|---|---|---|---|---|---|---|---|---|
| Thaps_hclust_0218 |
 |
 |
0.02 |
0.065 |
7.1 |
lowtemp_TMEVA | 0.385000 | -0.245 |
| Title | Cluster Plot | Dendrogram | e-value | e-value | e-value | Condition | Condition FDR | Condition Difference |
|---|---|---|---|---|---|---|---|---|
| Thaps_hclust_0197 |
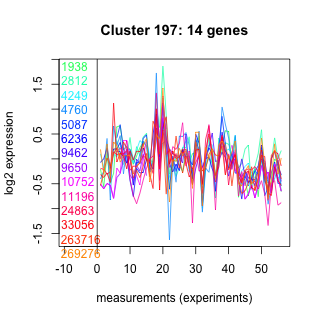 |
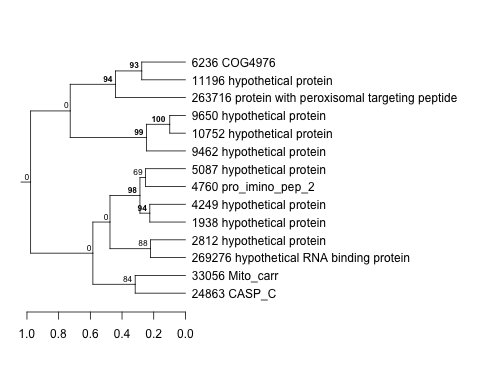 |
0.12 |
0.3 |
0.65 |
highpH_TMEVA | 0.179000 | -0.245 |
| Title | Cluster Plot | Dendrogram | e-value | e-value | e-value | Condition | Condition FDR | Condition Difference |
|---|---|---|---|---|---|---|---|---|
| Thaps_hclust_0314 |
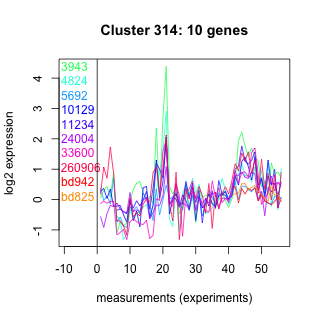 |
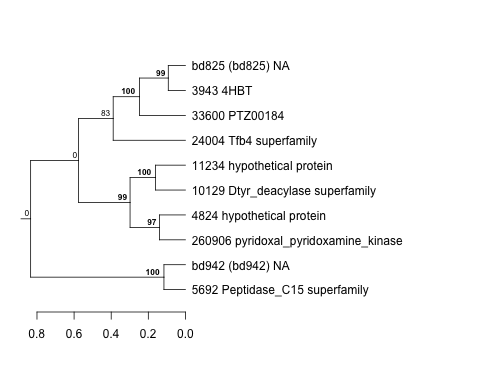 |
0.052 |
1.9 |
8.5 |
exponential_vs_stationary_24highlight | 0.101000 | -0.245 |
| Title | Cluster Plot | Dendrogram | e-value | e-value | e-value | Condition | Condition FDR | Condition Difference |
|---|---|---|---|---|---|---|---|---|
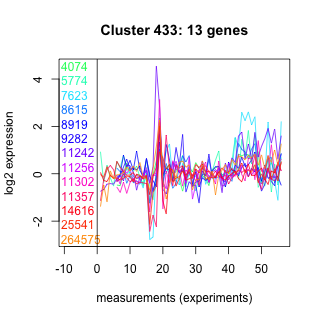
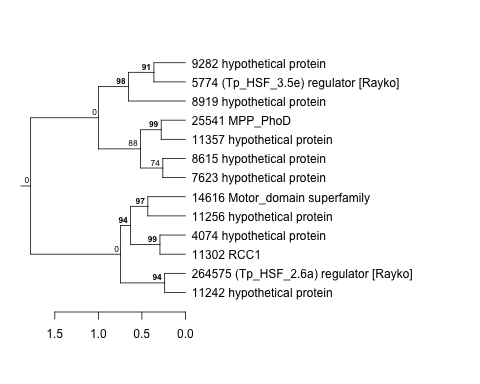
| Thaps_hclust_0433 |
 |
 |
14 |
54 |
440 |
exponential_vs_stationary_24highlight | 0.061500 | -0.244 |
| Title | Cluster Plot | Dendrogram | e-value | e-value | e-value | Condition | Condition FDR | Condition Difference |
|---|---|---|---|---|---|---|---|---|
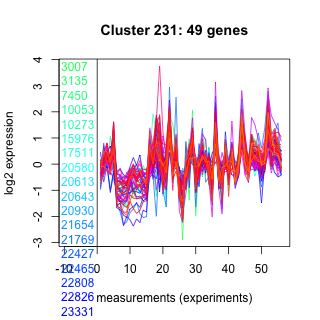
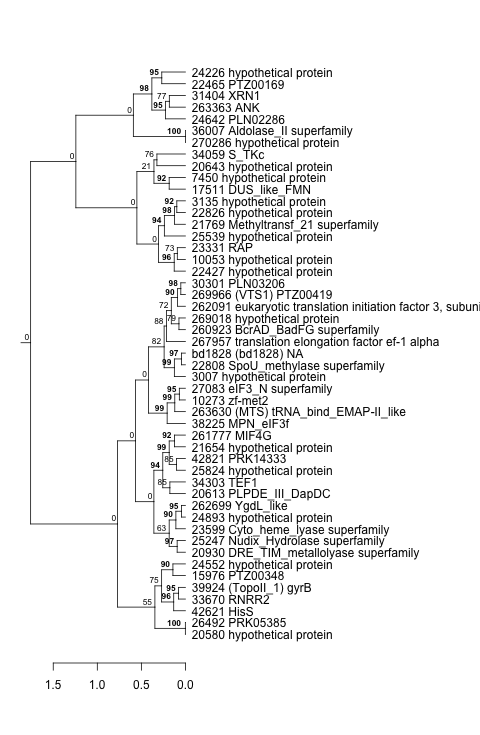
| Thaps_hclust_0231 |
 |
 |
9.5e-23 |
0.000000000000034 |
0.00000039 |
diel_light_vs_dark | 0.052700 | -0.244 |
| Title | Cluster Plot | Dendrogram | e-value | e-value | e-value | Condition | Condition FDR | Condition Difference |
|---|---|---|---|---|---|---|---|---|
| Thaps_hclust_0071 |
 |
 |
0.0000019 |
0.0000028 |
0.00008 |
lowFe_TMEVA | 0.337000 | -0.244 |
| Title | Cluster Plot | Dendrogram | e-value | e-value | e-value | Condition | Condition FDR | Condition Difference |
|---|---|---|---|---|---|---|---|---|
| Thaps_hclust_0026 |
 |
 |
0.0021 |
0.16 |
0.32 |
BaP | 0.425000 | -0.244 |
| Title | Cluster Plot | Dendrogram | e-value | e-value | e-value | Condition | Condition FDR | Condition Difference |
|---|---|---|---|---|---|---|---|---|
| Thaps_hclust_0339 |
 |
 |
0.000016 |
0.00038 |
0.0017 |
lowSi_TMEVA | 0.812000 | -0.243 |
| Title | Cluster Plot | Dendrogram | e-value | e-value | e-value | Condition | Condition FDR | Condition Difference |
|---|---|---|---|---|---|---|---|---|
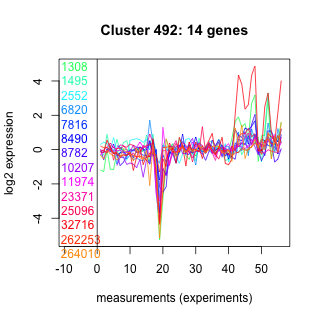
| Thaps_hclust_0492 |
 |
 |
0.29 |
0.47 |
23 |
lowFe_TMEVA | 0.438000 | -0.243 |
| Title | Cluster Plot | Dendrogram | e-value | e-value | e-value | Condition | Condition FDR | Condition Difference |
|---|---|---|---|---|---|---|---|---|
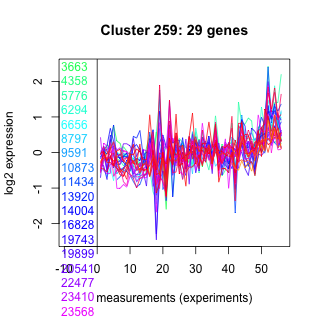
| Thaps_hclust_0259 |
 |
 |
0.000051 |
0.026 |
17 |
lowN_TMEVA | 0.461000 | -0.243 |
| Title | Cluster Plot | Dendrogram | e-value | e-value | e-value | Condition | Condition FDR | Condition Difference |
|---|---|---|---|---|---|---|---|---|
| Thaps_hclust_0059 |
 |
 |
0.0000000000000026 |
0.000000000024 |
0.0000014 |
highpH_TMEVA | 0.026800 | -0.243 |
| Title | Cluster Plot | Dendrogram | e-value | e-value | e-value | Condition | Condition FDR | Condition Difference |
|---|---|---|---|---|---|---|---|---|
| Thaps_hclust_0045 |
 |
 |
0.0000000028 |
0.0075 |
5.4 |
diel_light_vs_dark | 0.301000 | -0.243 |
| Title | Cluster Plot | Dendrogram | e-value | e-value | e-value | Condition | Condition FDR | Condition Difference |
|---|---|---|---|---|---|---|---|---|
| Thaps_hclust_0370 |
 |
 |
0.55 |
1 |
7 |
exponential_vs_stationary_24light | 0.468000 | -0.242 |
| Title | Cluster Plot | Dendrogram | e-value | e-value | e-value | Condition | Condition FDR | Condition Difference |
|---|---|---|---|---|---|---|---|---|
| Thaps_hclust_0058 |
 |
 |
0.000000037 |
0.000000014 |
0.00000069 |
lowFe_KTKB_Day3 | 0.106000 | -0.242 |
| Title | Cluster Plot | Dendrogram | e-value | e-value | e-value | Condition | Condition FDR | Condition Difference |
|---|---|---|---|---|---|---|---|---|
| Thaps_hclust_0074 |
 |
 |
77 |
130 |
300 |
lowFe_KTKB_Day5 | 0.369000 | -0.242 |
| Title | Cluster Plot | Dendrogram | e-value | e-value | e-value | Condition | Condition FDR | Condition Difference |
|---|---|---|---|---|---|---|---|---|
| Thaps_hclust_0458 |
 |
 |
0.0000000041 |
0.000000022 |
0.0024 |
highlight_arrays | 0.090000 | -0.242 |
| Title | Cluster Plot | Dendrogram | e-value | e-value | e-value | Condition | Condition FDR | Condition Difference |
|---|---|---|---|---|---|---|---|---|
| Thaps_hclust_0304 |
 |
 |
0.16 |
1.3 |
16 |
exponential_vs_stationary_24highlight | 0.001710 | -0.242 |
| Title | Cluster Plot | Dendrogram | e-value | e-value | e-value | Condition | Condition FDR | Condition Difference |
|---|---|---|---|---|---|---|---|---|
| Thaps_hclust_0228 |
 |
 |
0.00000000000028 |
0.0027 |
0.016 |
diel_light_vs_dark | 0.208000 | -0.242 |
| Title | Cluster Plot | Dendrogram | e-value | e-value | e-value | Condition | Condition FDR | Condition Difference |
|---|---|---|---|---|---|---|---|---|
| Thaps_hclust_0247 |
 |
 |
8.7e-16 |
0.00000000045 |
0.0000019 |
co2_elevated_stat_arrays | 0.173000 | -0.242 |
| Title | Cluster Plot | Dendrogram | e-value | e-value | e-value | Condition | Condition FDR | Condition Difference |
|---|---|---|---|---|---|---|---|---|
| Thaps_hclust_0033 |
 |
 |
0.000000000000011 |
0.0012 |
0.0073 |
highpH_TMEVA | 0.018400 | -0.242 |
| Title | Cluster Plot | Dendrogram | e-value | e-value | e-value | Condition | Condition FDR | Condition Difference |
|---|---|---|---|---|---|---|---|---|
| Thaps_hclust_0140 |
 |
 |
0.0000000084 |
0.000091 |
0.0000072 |
co2_elevated_stat_arrays | 0.288000 | -0.242 |
| Title | Cluster Plot | Dendrogram | e-value | e-value | e-value | Condition | Condition FDR | Condition Difference |
|---|---|---|---|---|---|---|---|---|
| Thaps_hclust_0332 |
 |
 |
0.000000055 |
0.0000013 |
0.0037 |
lowFe_TMEVA | 0.315000 | -0.241 |
| Title | Cluster Plot | Dendrogram | e-value | e-value | e-value | Condition | Condition FDR | Condition Difference |
|---|---|---|---|---|---|---|---|---|
| Thaps_hclust_0442 |
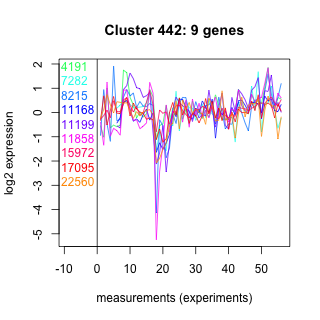 |
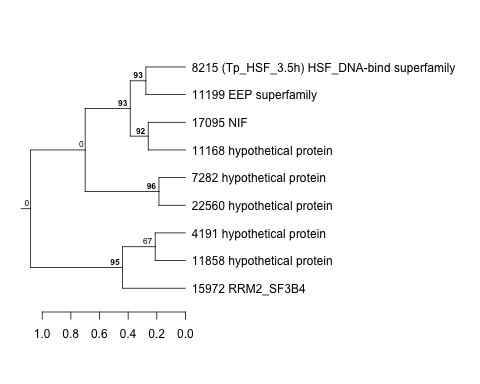 |
0.045 |
2.3 |
2.8 |
highlight_arrays | 0.311000 | -0.241 |
| Title | Cluster Plot | Dendrogram | e-value | e-value | e-value | Condition | Condition FDR | Condition Difference |
|---|---|---|---|---|---|---|---|---|
| Thaps_hclust_0221 |
 |
|
|
1e-37 |
0.0000000000012 |
highpH_TMEVA | 0.001370 | -0.241 |
| Title | Cluster Plot | Dendrogram | e-value | e-value | e-value | Condition | Condition FDR | Condition Difference |
|---|---|---|---|---|---|---|---|---|
| Thaps_hclust_0148 |
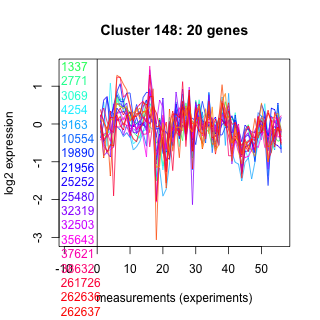 |
 |
4.7 |
39 |
51 |
lowN_TMEVA | 0.505000 | -0.241 |
| Title | Cluster Plot | Dendrogram | e-value | e-value | e-value | Condition | Condition FDR | Condition Difference |
|---|---|---|---|---|---|---|---|---|
| Thaps_hclust_0382 |
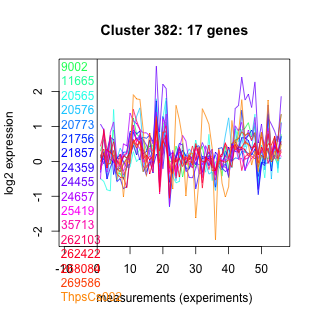 |
 |
0.0000042 |
0.012 |
0.055 |
exponential_vs_stationary_24highlight | 0.034100 | -0.24 |
| Title | Cluster Plot | Dendrogram | e-value | e-value | e-value | Condition | Condition FDR | Condition Difference |
|---|---|---|---|---|---|---|---|---|
| Thaps_hclust_0193 |
 |
 |
0.00027 |
0.013 |
6.2 |
highpH_TMEVA | 0.114000 | -0.24 |
| Title | Cluster Plot | Dendrogram | e-value | e-value | e-value | Condition | Condition FDR | Condition Difference |
|---|---|---|---|---|---|---|---|---|
| Thaps_hclust_0091 |
 |
 |
0.00000061 |
0.00022 |
0.44 |
lowtemp_TMEVA | 0.384000 | -0.24 |
| Title | Cluster Plot | Dendrogram | e-value | e-value | e-value | Condition | Condition FDR | Condition Difference |
|---|---|---|---|---|---|---|---|---|
| Thaps_hclust_0060 |
 |
 |
0.00000047 |
0.00077 |
0.0075 |
highpH_TMEVA | 0.066600 | -0.24 |
| Title | Cluster Plot | Dendrogram | e-value | e-value | e-value | Condition | Condition FDR | Condition Difference |
|---|---|---|---|---|---|---|---|---|
| Thaps_hclust_0268 |
 |
 |
0.17 |
14 |
60 |
highpH_TMEVA | 0.148000 | -0.24 |
| Title | Cluster Plot | Dendrogram | e-value | e-value | e-value | Condition | Condition FDR | Condition Difference |
|---|---|---|---|---|---|---|---|---|
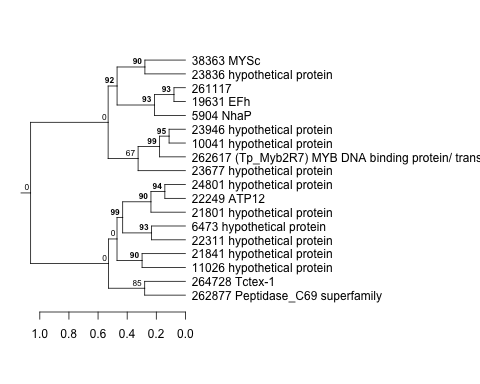
| Thaps_hclust_0262 |
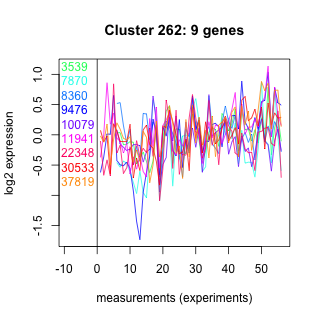 |
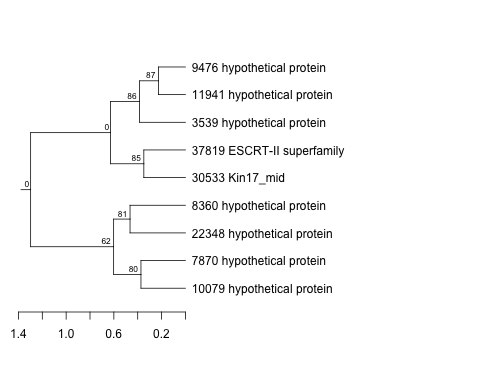 |
12 |
130 |
130 |
lowFe_KTKB_Day3 | 0.527000 | -0.24 |
| Title | Cluster Plot | Dendrogram | e-value | e-value | e-value | Condition | Condition FDR | Condition Difference |
|---|---|---|---|---|---|---|---|---|
| Thaps_hclust_0403 |
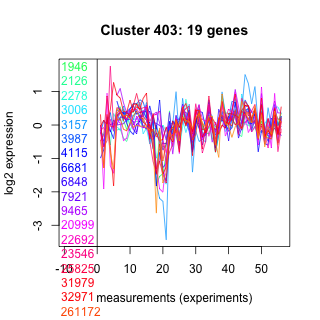 |
 |
0.83 |
0.015 |
0.016 |
co2_elevated_stat_arrays | 0.316000 | -0.24 |
| Title | Cluster Plot | Dendrogram | e-value | e-value | e-value | Condition | Condition FDR | Condition Difference |
|---|---|---|---|---|---|---|---|---|
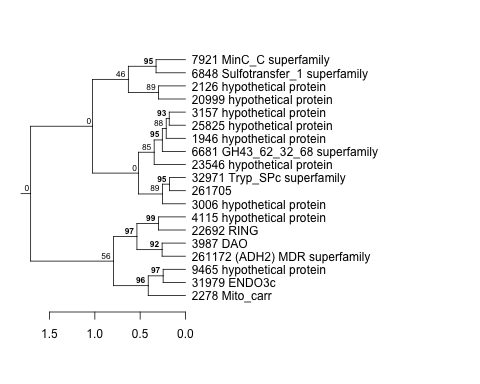
| Thaps_hclust_0270 |
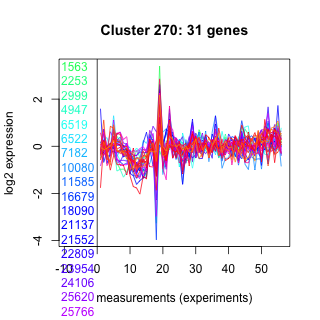 |
 |
0.0000000000069 |
0.000026 |
0.0036 |
highlight_arrays | 0.056200 | -0.24 |
| Title | Cluster Plot | Dendrogram | e-value | e-value | e-value | Condition | Condition FDR | Condition Difference |
|---|---|---|---|---|---|---|---|---|
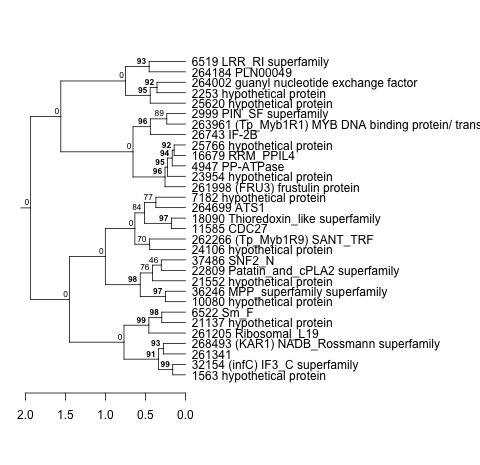
| Thaps_hclust_0263 |
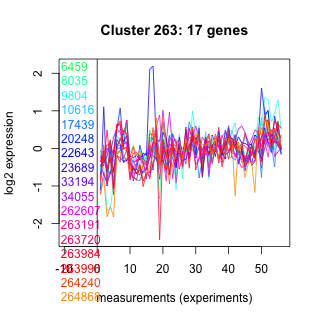 |
 |
0.15 |
0.25 |
1.4 |
lowFe_TMEVA | 0.427000 | -0.239 |
| Title | Cluster Plot | Dendrogram | e-value | e-value | e-value | Condition | Condition FDR | Condition Difference |
|---|---|---|---|---|---|---|---|---|
| Thaps_hclust_0180 |
 |
 |
1.5 |
1.7 |
12 |
highlight_arrays | 0.286000 | -0.239 |
| Title | Cluster Plot | Dendrogram | e-value | e-value | e-value | Condition | Condition FDR | Condition Difference |
|---|---|---|---|---|---|---|---|---|
| Thaps_hclust_0460 |
 |
 |
0.0073 |
0.0055 |
0.63 |
highlight_arrays | 0.375000 | -0.239 |
| Title | Cluster Plot | Dendrogram | e-value | e-value | e-value | Condition | Condition FDR | Condition Difference |
|---|---|---|---|---|---|---|---|---|
| Thaps_hclust_0374 |
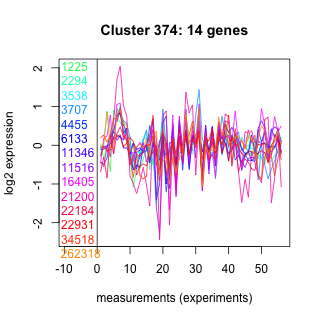 |
 |
1.4 |
19 |
50 |
highpH_TMEVA | 0.187000 | -0.239 |
| Title | Cluster Plot | Dendrogram | e-value | e-value | e-value | Condition | Condition FDR | Condition Difference |
|---|---|---|---|---|---|---|---|---|
| Thaps_hclust_0177 |
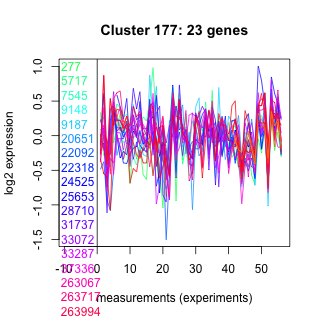 |
 |
0.0000000012 |
0.0000078 |
0.00084 |
BaP | 0.251000 | -0.239 |