Hierarchical Clusters
Displaying 1401 - 1500 of 7500
| Title | Cluster Plot | Dendrogram | e-value | e-value | e-value | Condition | Condition FDR | Condition Difference |
|---|---|---|---|---|---|---|---|---|
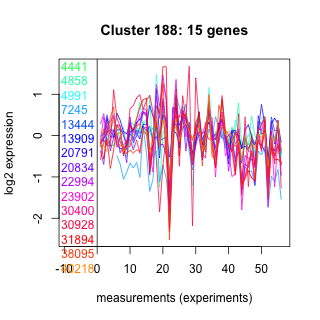
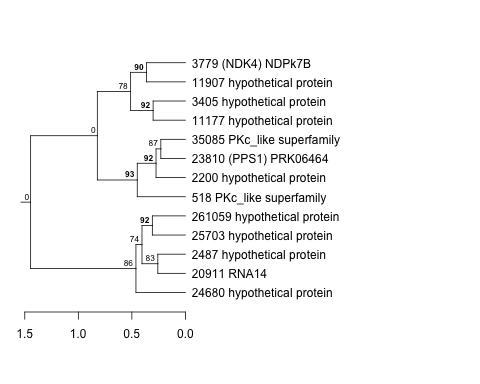
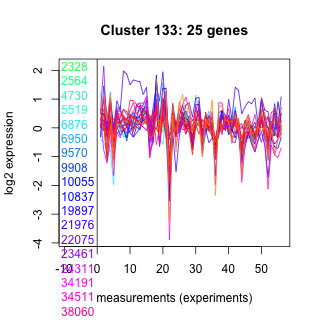
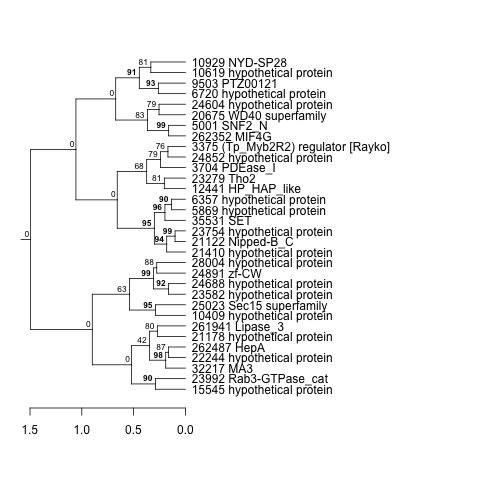
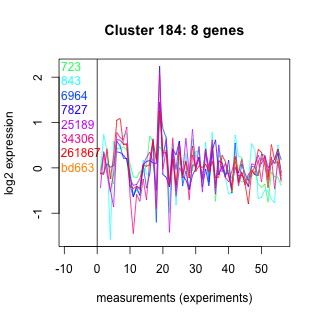
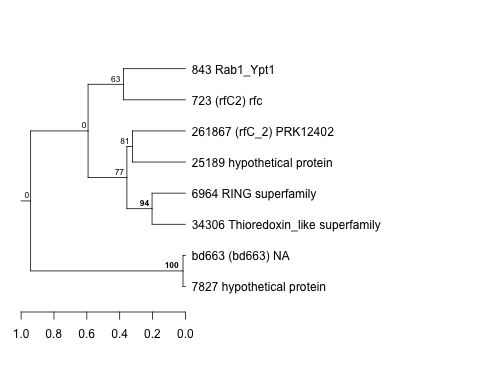
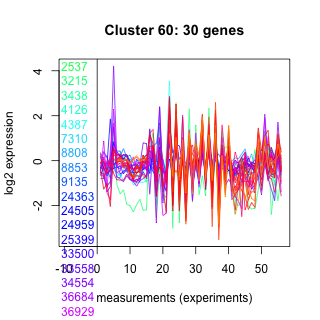
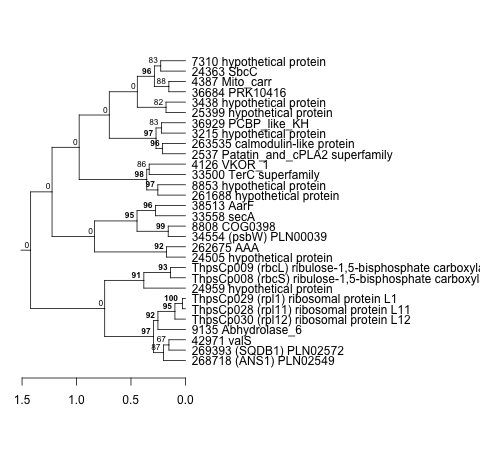
| Thaps_hclust_0188 |
 |
 |
0.0058 |
0.31 |
0.34 |
co2_elevated_stat_arrays | 0.011500 | -0.562 |
| Title | Cluster Plot | Dendrogram | e-value | e-value | e-value | Condition | Condition FDR | Condition Difference |
|---|---|---|---|---|---|---|---|---|
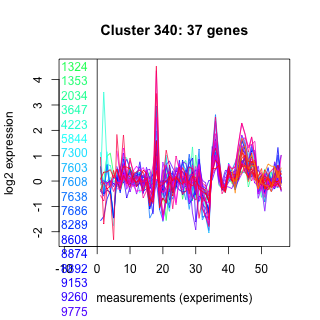
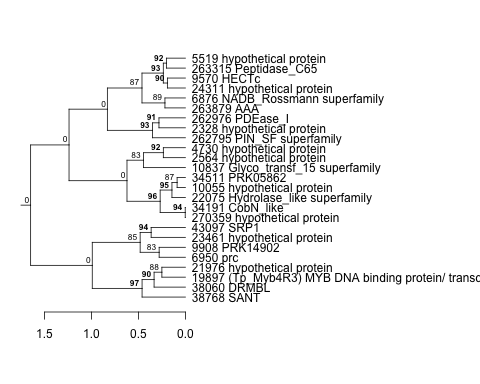
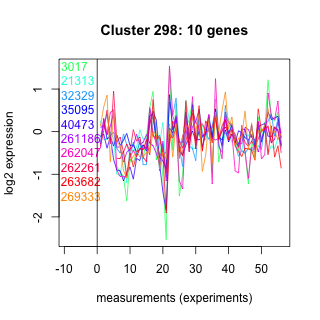
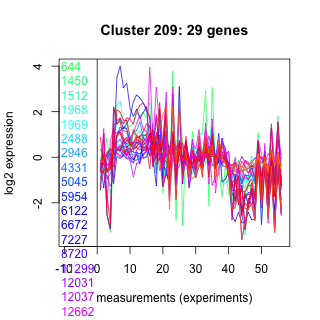
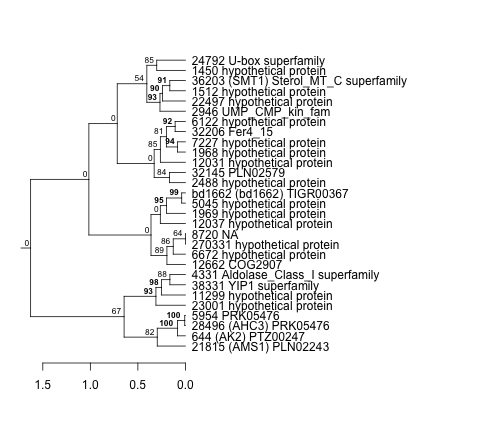
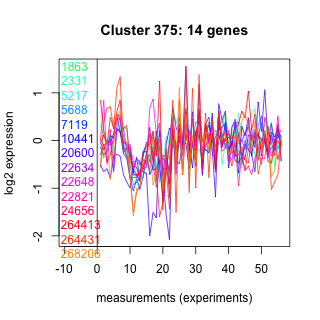
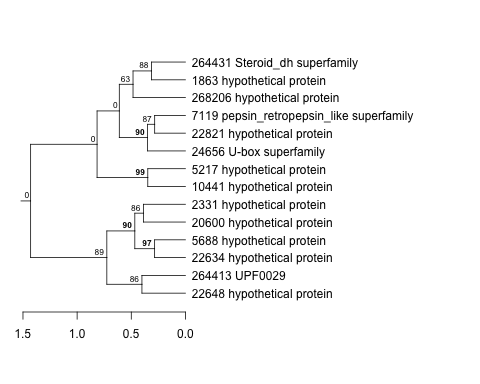
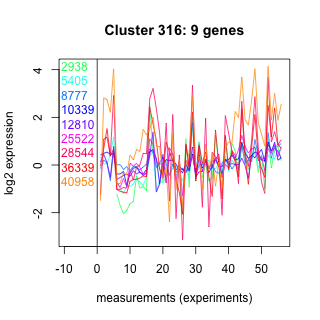
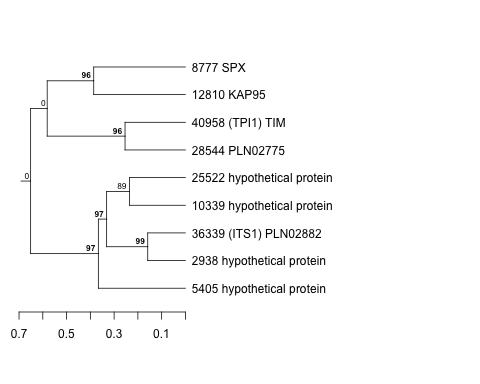
| Thaps_hclust_0340 |
 |
 |
0.00000000039 |
0.0000000031 |
0.0000002 |
co2_elevated_stat_arrays | 0.125000 | 0.278 |
| Title | Cluster Plot | Dendrogram | e-value | e-value | e-value | Condition | Condition FDR | Condition Difference |
|---|---|---|---|---|---|---|---|---|
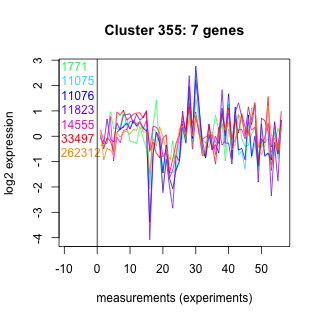
| Thaps_hclust_0116 |
 |
 |
0.74 |
8.1 |
4.9 |
co2_elevated_stat_arrays | 0.320000 | 0.247 |
| Title | Cluster Plot | Dendrogram | e-value | e-value | e-value | Condition | Condition FDR | Condition Difference |
|---|---|---|---|---|---|---|---|---|
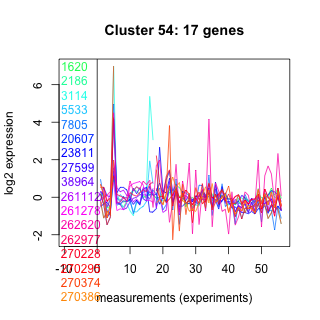
| Thaps_hclust_0054 |
 |
 |
1.6e-17 |
0.0000000000053 |
0.000000000000024 |
co2_elevated_stat_arrays | 0.856000 | 0.0533 |
| Title | Cluster Plot | Dendrogram | e-value | e-value | e-value | Condition | Condition FDR | Condition Difference |
|---|---|---|---|---|---|---|---|---|
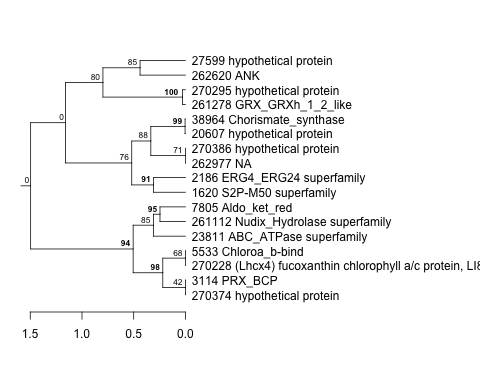
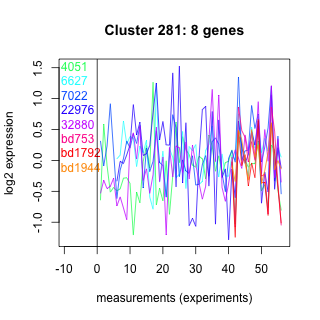
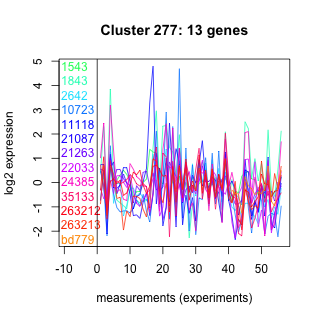
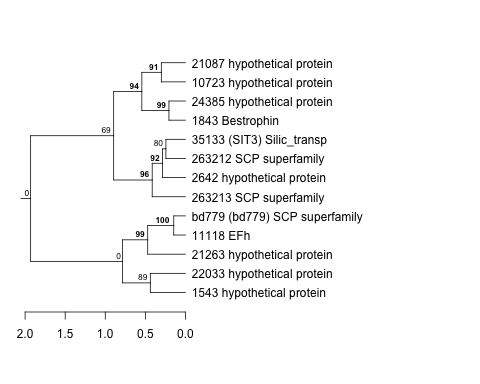
| Thaps_hclust_0281 |
 |
 |
0.0000064 |
0.00064 |
0.03 |
co2_elevated_stat_arrays | 0.762000 | 0.106 |
| Title | Cluster Plot | Dendrogram | e-value | e-value | e-value | Condition | Condition FDR | Condition Difference |
|---|---|---|---|---|---|---|---|---|
| Thaps_hclust_0085 |
 |
 |
0.000012 |
0.0024 |
0.37 |
co2_elevated_stat_arrays | 0.962000 | 0.0105 |
| Title | Cluster Plot | Dendrogram | e-value | e-value | e-value | Condition | Condition FDR | Condition Difference |
|---|---|---|---|---|---|---|---|---|
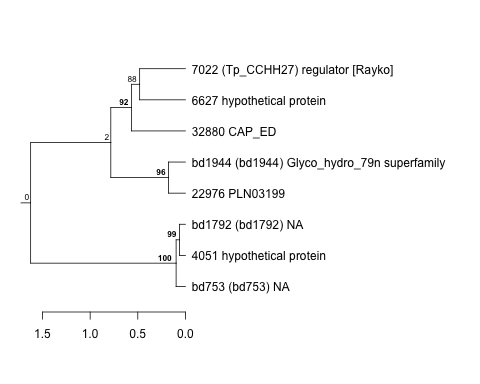
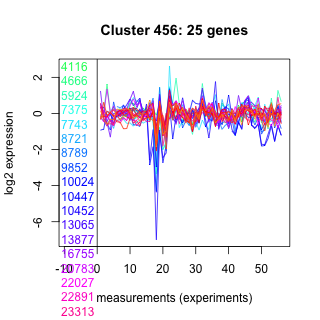
| Thaps_hclust_0456 |
 |
 |
0.0000000043 |
0.047 |
6.5 |
co2_elevated_stat_arrays | 0.695000 | 0.106 |
| Title | Cluster Plot | Dendrogram | e-value | e-value | e-value | Condition | Condition FDR | Condition Difference |
|---|---|---|---|---|---|---|---|---|
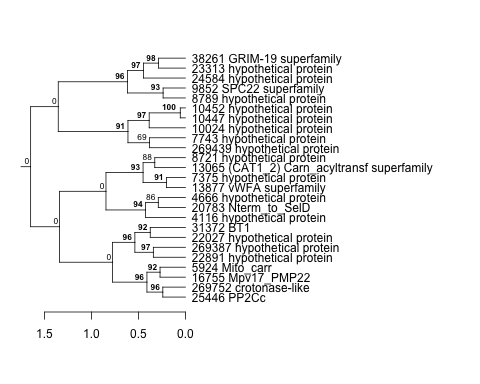
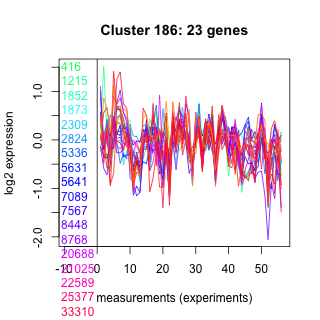
| Thaps_hclust_0186 |
 |
 |
0.0000000043 |
0.006 |
0.0000084 |
co2_elevated_stat_arrays | 0.009910 | -0.499 |
| Title | Cluster Plot | Dendrogram | e-value | e-value | e-value | Condition | Condition FDR | Condition Difference |
|---|---|---|---|---|---|---|---|---|
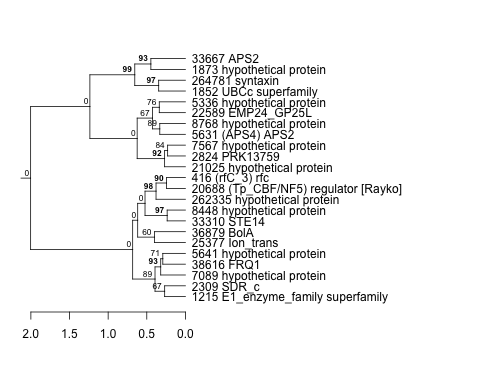
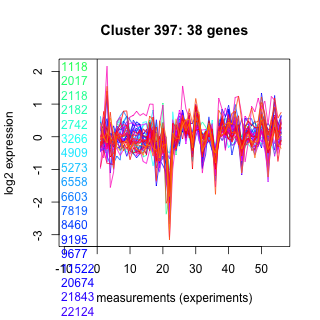
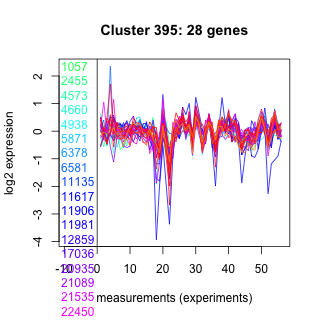
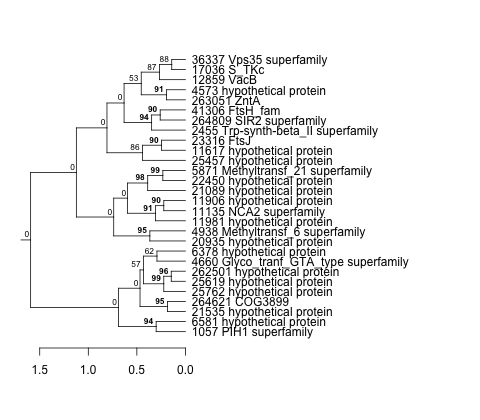
| Thaps_hclust_0397 |
 |
 |
0.00003 |
0.00016 |
0.0062 |
co2_elevated_stat_arrays | 0.000658 | -0.522 |
| Title | Cluster Plot | Dendrogram | e-value | e-value | e-value | Condition | Condition FDR | Condition Difference |
|---|---|---|---|---|---|---|---|---|
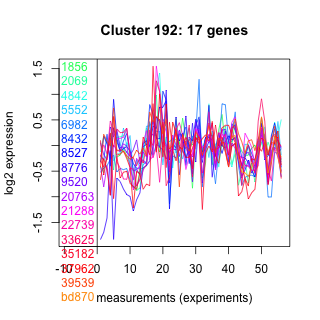
| Thaps_hclust_0192 |
 |
 |
0.000012 |
0.017 |
1.3 |
co2_elevated_stat_arrays | 0.025000 | -0.511 |
| Title | Cluster Plot | Dendrogram | e-value | e-value | e-value | Condition | Condition FDR | Condition Difference |
|---|---|---|---|---|---|---|---|---|
| Thaps_hclust_0338 |
 |
 |
0.0000012 |
0.0000014 |
0.000012 |
co2_elevated_stat_arrays | 0.543000 | 0.143 |
| Title | Cluster Plot | Dendrogram | e-value | e-value | e-value | Condition | Condition FDR | Condition Difference |
|---|---|---|---|---|---|---|---|---|
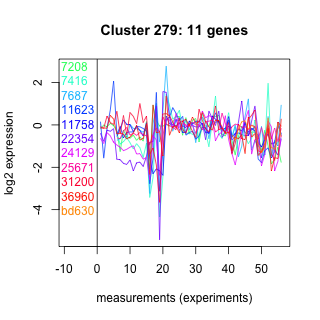
| Thaps_hclust_0279 |
 |
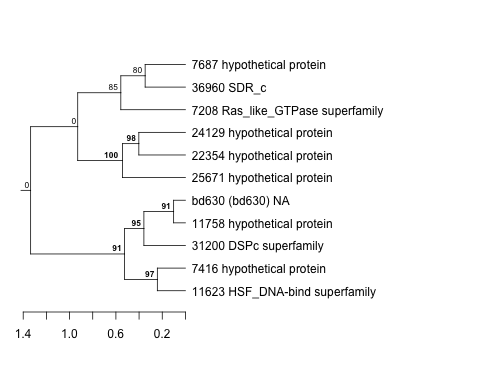 |
2.7 |
22 |
38 |
co2_elevated_stat_arrays | 0.028700 | 0.6 |
| Title | Cluster Plot | Dendrogram | e-value | e-value | e-value | Condition | Condition FDR | Condition Difference |
|---|---|---|---|---|---|---|---|---|
| Thaps_hclust_0028 |
 |
|
1.6e-27 |
6.8e-18 |
0.0000000000000078 |
co2_elevated_stat_arrays | 0.001190 | -0.393 |
| Title | Cluster Plot | Dendrogram | e-value | e-value | e-value | Condition | Condition FDR | Condition Difference |
|---|---|---|---|---|---|---|---|---|
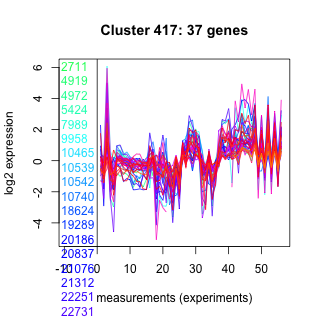
| Thaps_hclust_0417 |
 |
 |
0.0000000018 |
0.00013 |
0.00029 |
co2_elevated_stat_arrays | 0.004850 | 0.43 |
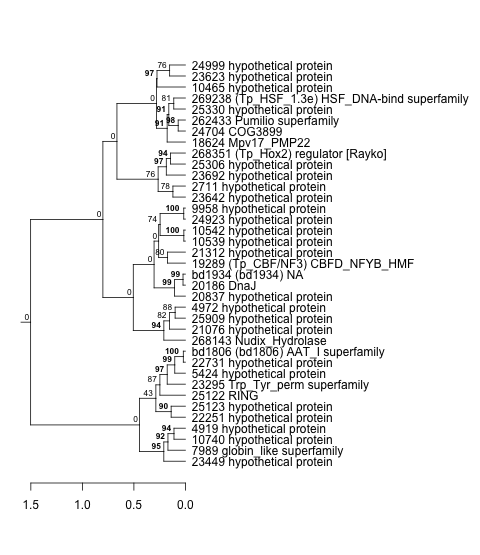
| Title | Cluster Plot | Dendrogram | e-value | e-value | e-value | Condition | Condition FDR | Condition Difference |
|---|---|---|---|---|---|---|---|---|
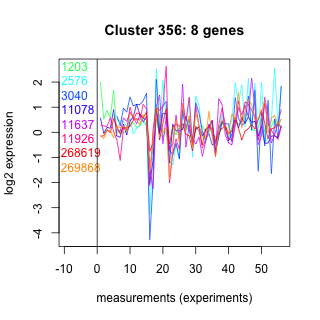
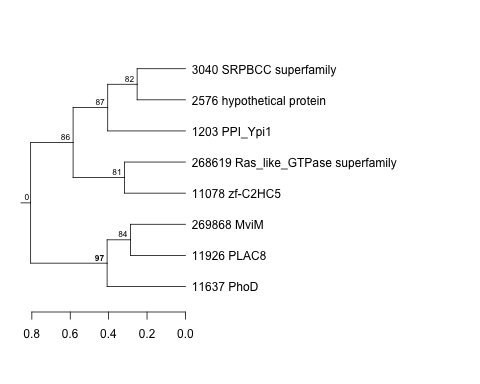
| Thaps_hclust_0358 |
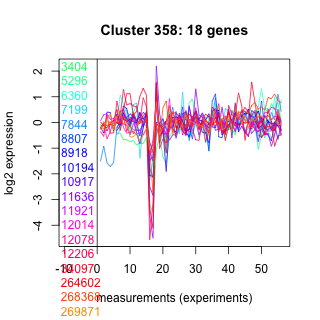 |
 |
0.18 |
390 |
1700 |
co2_elevated_stat_arrays | 0.937000 | 0.0253 |
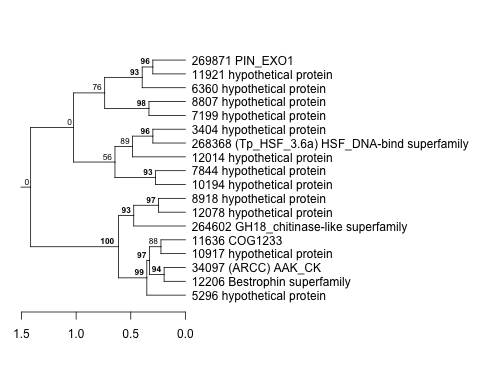
| Title | Cluster Plot | Dendrogram | e-value | e-value | e-value | Condition | Condition FDR | Condition Difference |
|---|---|---|---|---|---|---|---|---|
| Thaps_hclust_0134 |
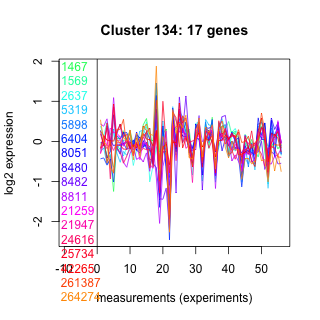 |
 |
0.00013 |
0.55 |
0.0039 |
co2_elevated_stat_arrays | 0.058300 | -0.434 |
| Title | Cluster Plot | Dendrogram | e-value | e-value | e-value | Condition | Condition FDR | Condition Difference |
|---|---|---|---|---|---|---|---|---|
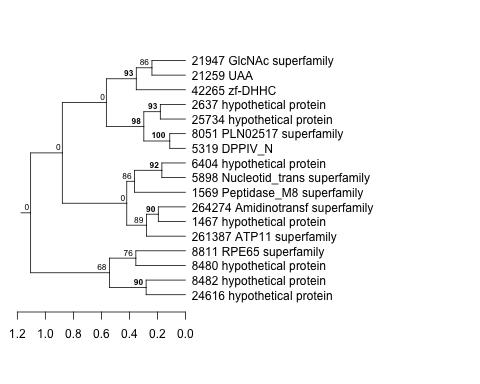
| Thaps_hclust_0299 |
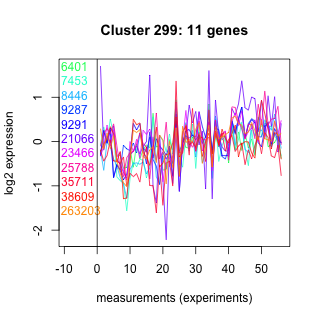 |
 |
0.0056 |
1.7 |
6.7 |
co2_elevated_stat_arrays | 0.892000 | -0.0432 |
| Title | Cluster Plot | Dendrogram | e-value | e-value | e-value | Condition | Condition FDR | Condition Difference |
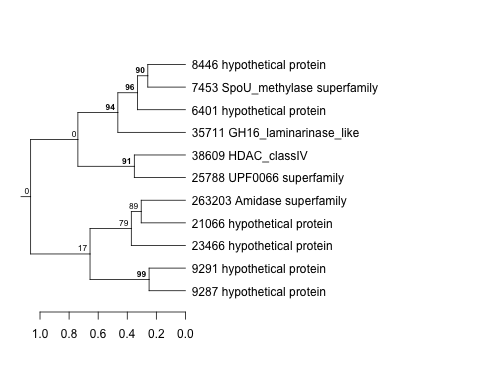
|---|---|---|---|---|---|---|---|---|
| Thaps_hclust_0167 |
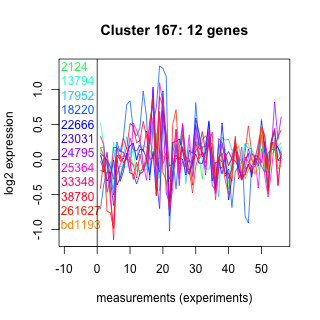 |
 |
1 |
15 |
160 |
co2_elevated_stat_arrays | 0.329000 | -0.266 |
| Title | Cluster Plot | Dendrogram | e-value | e-value | e-value | Condition | Condition FDR | Condition Difference |
|---|---|---|---|---|---|---|---|---|
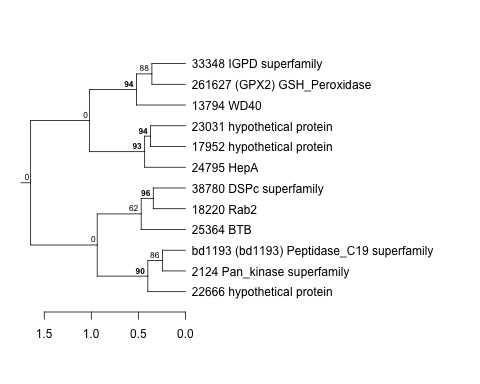
| Thaps_hclust_0378 |
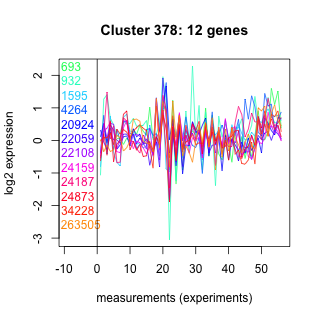 |
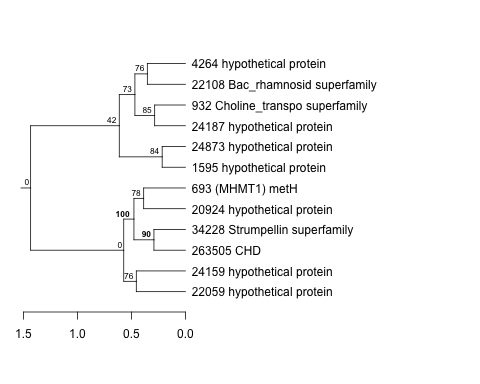 |
0.0003 |
210 |
10 |
co2_elevated_stat_arrays | 0.861000 | 0.0537 |
| Title | Cluster Plot | Dendrogram | e-value | e-value | e-value | Condition | Condition FDR | Condition Difference |
|---|---|---|---|---|---|---|---|---|
| Thaps_hclust_0319 |
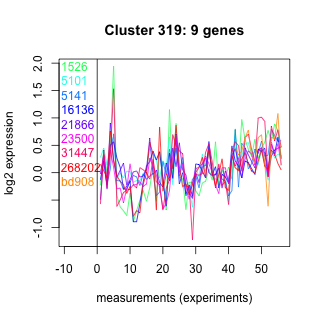 |
 |
2.4 |
46 |
70 |
co2_elevated_stat_arrays | 0.365000 | -0.27 |
| Title | Cluster Plot | Dendrogram | e-value | e-value | e-value | Condition | Condition FDR | Condition Difference |
|---|---|---|---|---|---|---|---|---|
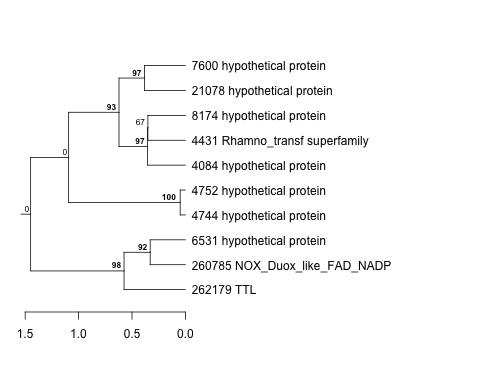
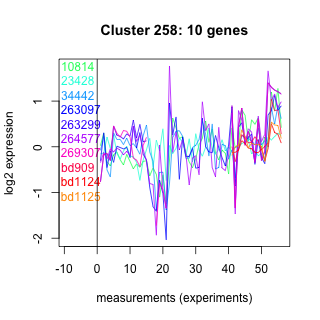
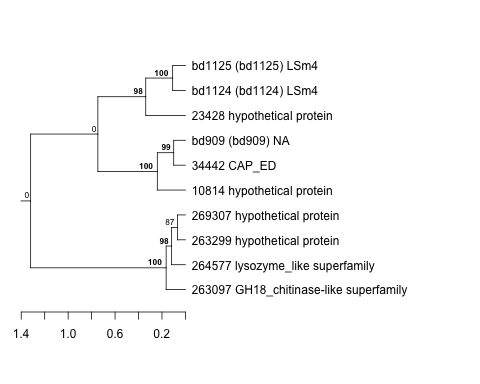
| Thaps_hclust_0260 |
 |
 |
1.6e-36 |
9.1e-22 |
8.6e-22 |
co2_elevated_stat_arrays | 0.011200 | 0.673 |
| Title | Cluster Plot | Dendrogram | e-value | e-value | e-value | Condition | Condition FDR | Condition Difference |
|---|---|---|---|---|---|---|---|---|
| Thaps_hclust_0187 |
 |
 |
0.000000024 |
0.034 |
0.66 |
co2_elevated_stat_arrays | 0.013700 | -0.42 |
| Title | Cluster Plot | Dendrogram | e-value | e-value | e-value | Condition | Condition FDR | Condition Difference |
|---|---|---|---|---|---|---|---|---|
| Thaps_hclust_0053 |
 |
 |
0.000012 |
0.000065 |
0.009 |
co2_elevated_stat_arrays | 0.345000 | 0.267 |
| Title | Cluster Plot | Dendrogram | e-value | e-value | e-value | Condition | Condition FDR | Condition Difference |
|---|---|---|---|---|---|---|---|---|
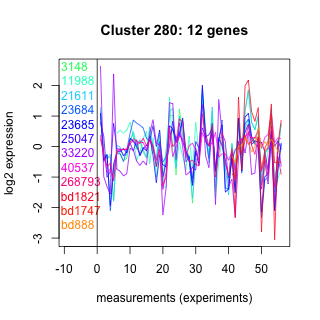
| Thaps_hclust_0280 |
 |
 |
0.75 |
0.64 |
81 |
co2_elevated_stat_arrays | 0.044700 | 0.526 |
| Title | Cluster Plot | Dendrogram | e-value | e-value | e-value | Condition | Condition FDR | Condition Difference |
|---|---|---|---|---|---|---|---|---|
| Thaps_hclust_0230 |
 |
|
|
1.1e-30 |
0.0000000000029 |
co2_elevated_stat_arrays | 0.000658 | 0.639 |
| Title | Cluster Plot | Dendrogram | e-value | e-value | e-value | Condition | Condition FDR | Condition Difference |
|---|---|---|---|---|---|---|---|---|
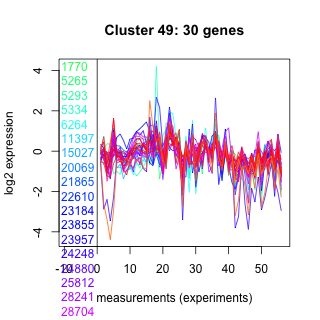
| Thaps_hclust_0049 |
 |
 |
0.00054 |
0.0063 |
0.03 |
co2_elevated_stat_arrays | 0.018000 | 0.42 |
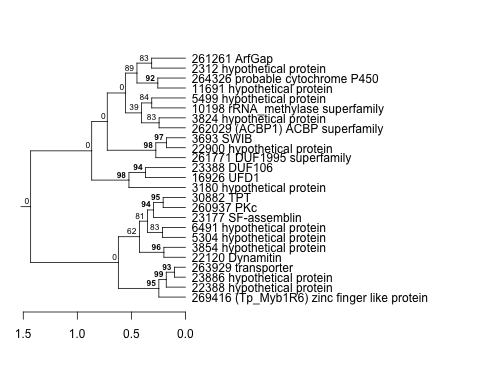
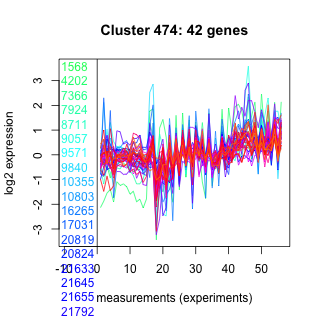
| Title | Cluster Plot | Dendrogram | e-value | e-value | e-value | Condition | Condition FDR | Condition Difference |
|---|---|---|---|---|---|---|---|---|
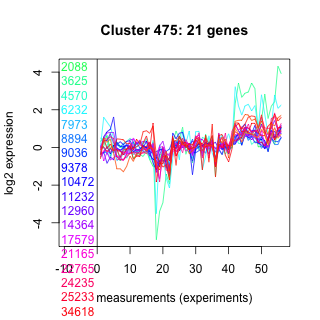
| Thaps_hclust_0475 |
 |
 |
0.011 |
0.95 |
0.77 |
co2_elevated_stat_arrays | 0.707000 | -0.1 |
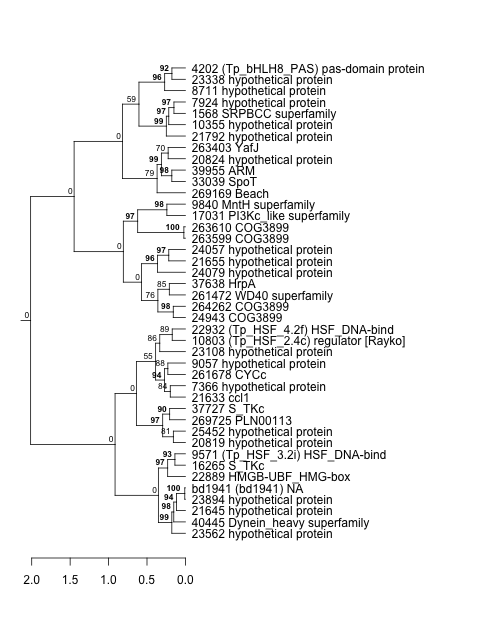
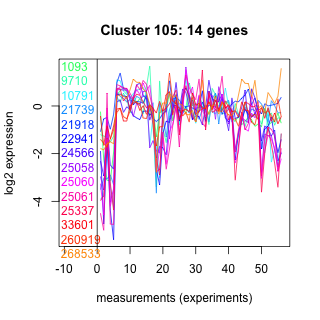
| Title | Cluster Plot | Dendrogram | e-value | e-value | e-value | Condition | Condition FDR | Condition Difference |
|---|---|---|---|---|---|---|---|---|
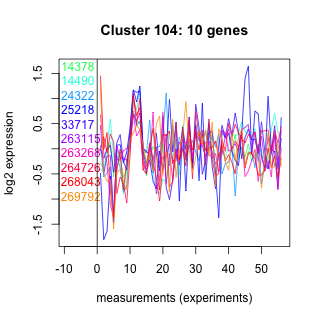
| Thaps_hclust_0106 |
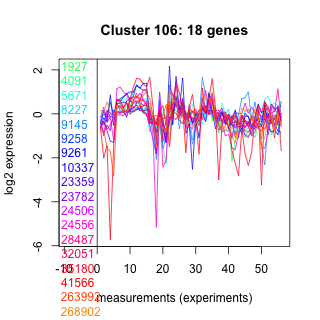 |
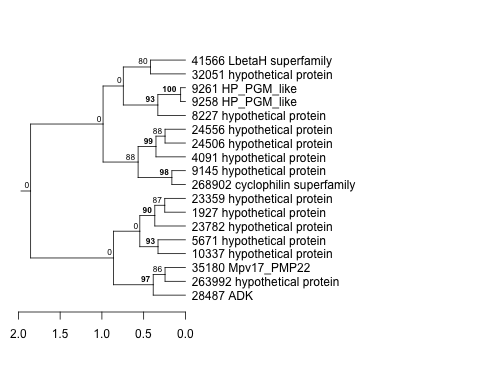 |
0.48 |
3.7 |
8.9 |
co2_elevated_stat_arrays | 0.370000 | 0.222 |
| Title | Cluster Plot | Dendrogram | e-value | e-value | e-value | Condition | Condition FDR | Condition Difference |
|---|---|---|---|---|---|---|---|---|
| Thaps_hclust_0416 |
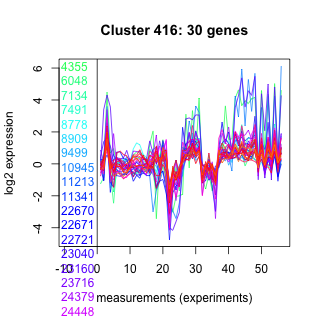 |
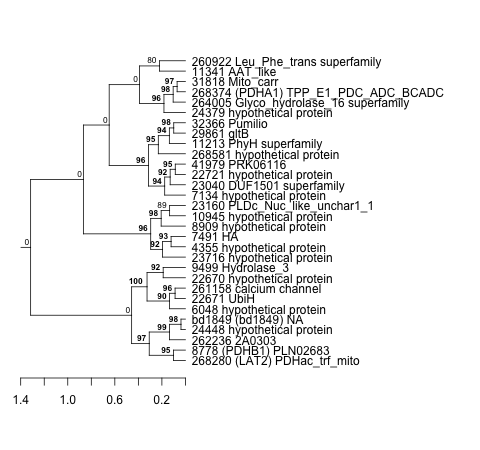 |
0.00000015 |
0.00000035 |
0.7 |
co2_elevated_stat_arrays | 0.801000 | 0.0707 |
| Title | Cluster Plot | Dendrogram | e-value | e-value | e-value | Condition | Condition FDR | Condition Difference |
|---|---|---|---|---|---|---|---|---|
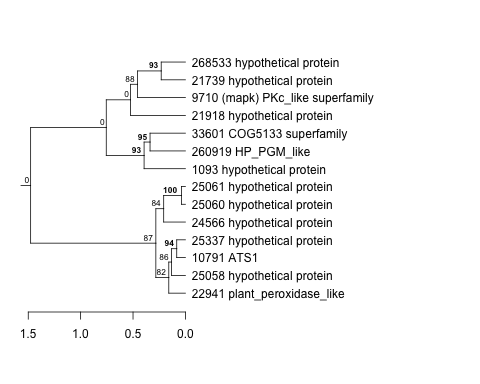
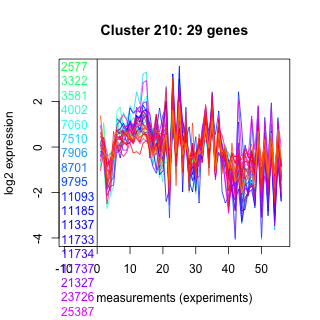
| Thaps_hclust_0211 |
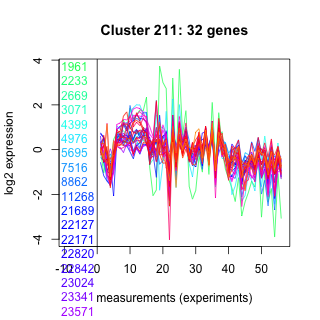 |
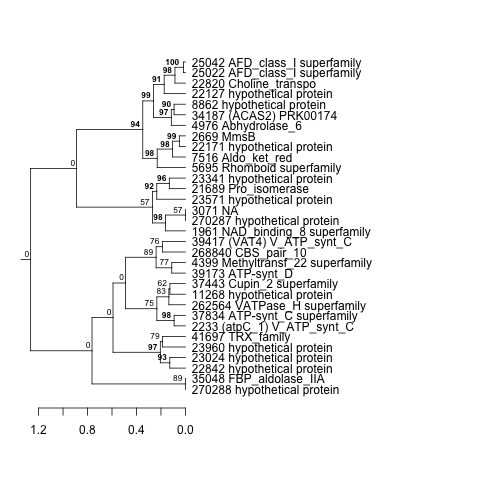 |
0.000000055 |
0.00014 |
0.026 |
co2_elevated_stat_arrays | 0.165000 | -0.271 |
| Title | Cluster Plot | Dendrogram | e-value | e-value | e-value | Condition | Condition FDR | Condition Difference |
|---|---|---|---|---|---|---|---|---|
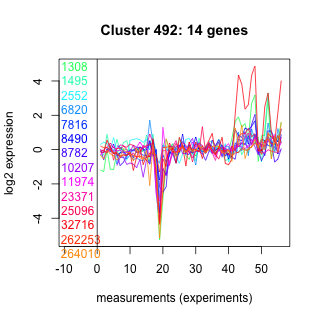
| Thaps_hclust_0495 |
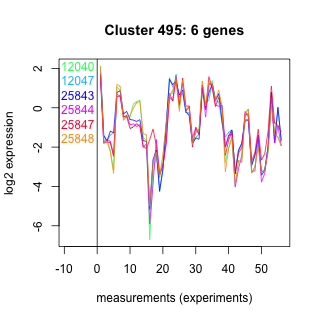 |
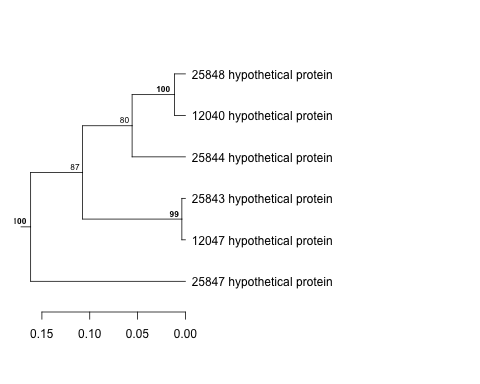 |
0.0000000031 |
0.00000049 |
0.0000038 |
co2_elevated_stat_arrays | 0.954000 | 0.02 |
| Title | Cluster Plot | Dendrogram | e-value | e-value | e-value | Condition | Condition FDR | Condition Difference |
|---|---|---|---|---|---|---|---|---|
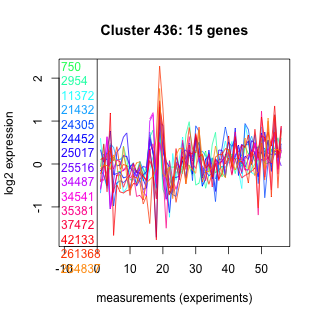
| Thaps_hclust_0436 |
 |
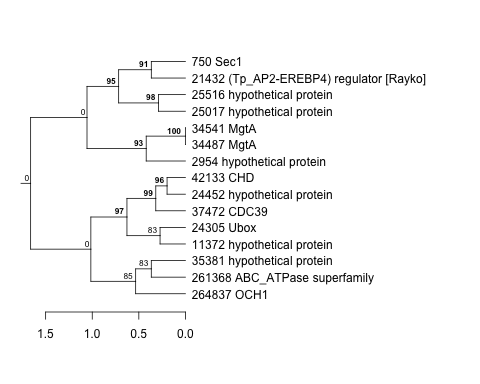 |
0.067 |
0.93 |
0.55 |
co2_elevated_stat_arrays | 0.557000 | -0.158 |
| Title | Cluster Plot | Dendrogram | e-value | e-value | e-value | Condition | Condition FDR | Condition Difference |
|---|---|---|---|---|---|---|---|---|
| Thaps_hclust_0079 |
 |
 |
0.00048 |
0.000048 |
0.27 |
co2_elevated_stat_arrays | 0.794000 | -0.0734 |
| Title | Cluster Plot | Dendrogram | e-value | e-value | e-value | Condition | Condition FDR | Condition Difference |
|---|---|---|---|---|---|---|---|---|
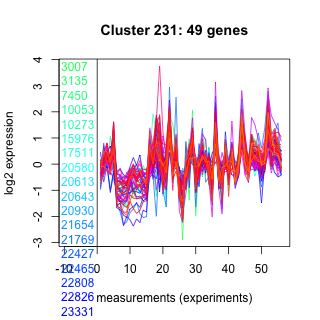
| Thaps_hclust_0231 |
 |
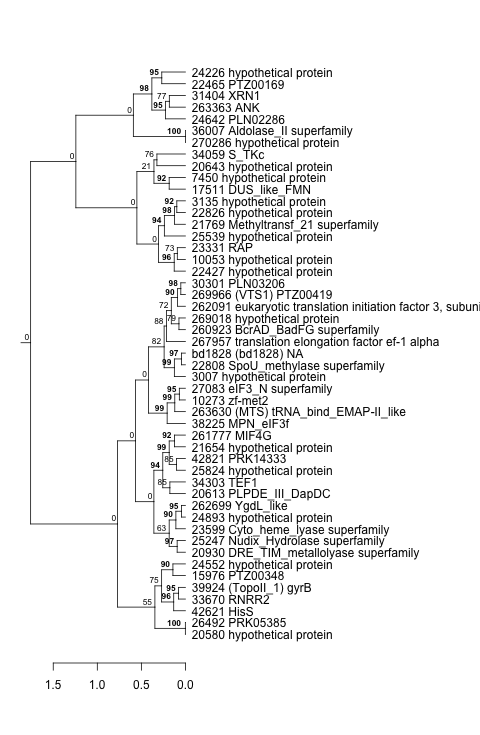 |
9.5e-23 |
0.000000000000034 |
0.00000039 |
co2_elevated_stat_arrays | 0.000658 | 0.774 |
| Title | Cluster Plot | Dendrogram | e-value | e-value | e-value | Condition | Condition FDR | Condition Difference |
|---|---|---|---|---|---|---|---|---|
| Thaps_hclust_0377 |
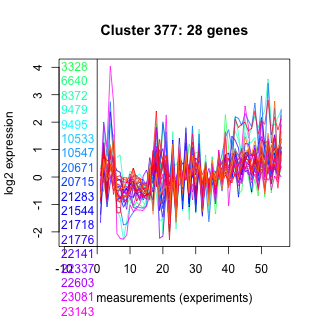 |
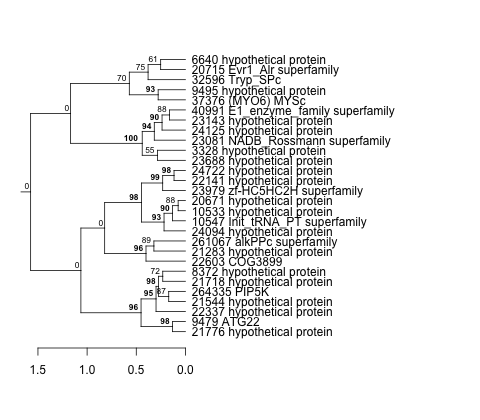 |
0.00016 |
0.034 |
0.95 |
co2_elevated_stat_arrays | 0.876000 | -0.0448 |
| Title | Cluster Plot | Dendrogram | e-value | e-value | e-value | Condition | Condition FDR | Condition Difference |
|---|---|---|---|---|---|---|---|---|
| Thaps_hclust_0014 |
 |
 |
Not available | Not available | Not available | co2_elevated_stat_arrays | 0.074600 | 0.266 |
| Title | Cluster Plot | Dendrogram | e-value | e-value | e-value | Condition | Condition FDR | Condition Difference |
|---|---|---|---|---|---|---|---|---|
| Thaps_hclust_0153 |
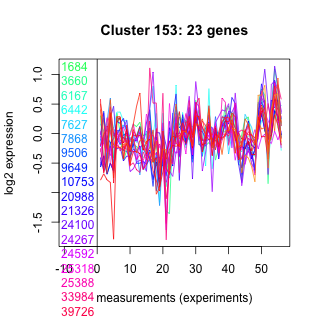 |
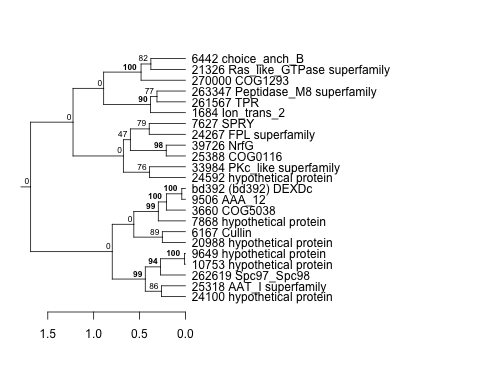 |
0.0000021 |
0.0049 |
0.015 |
co2_elevated_stat_arrays | 0.017700 | -0.461 |
| Title | Cluster Plot | Dendrogram | e-value | e-value | e-value | Condition | Condition FDR | Condition Difference |
|---|---|---|---|---|---|---|---|---|
| Thaps_hclust_0318 |
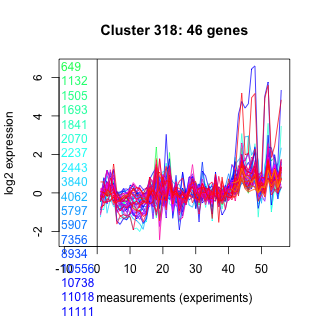 |
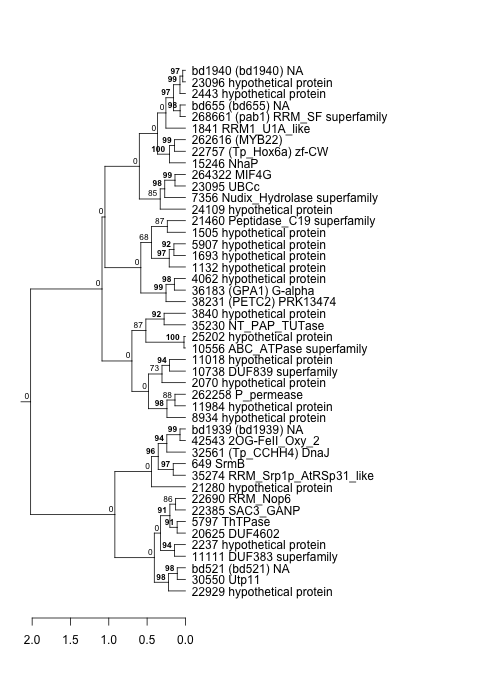 |
1.1e-17 |
0.000000015 |
0.0000081 |
co2_elevated_stat_arrays | 0.000658 | 0.784 |
| Title | Cluster Plot | Dendrogram | e-value | e-value | e-value | Condition | Condition FDR | Condition Difference |
|---|---|---|---|---|---|---|---|---|
| Thaps_hclust_0259 |
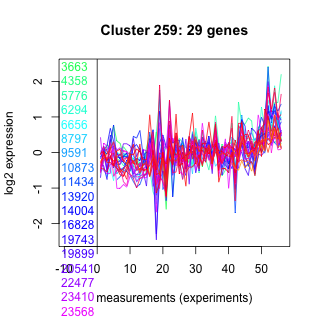 |
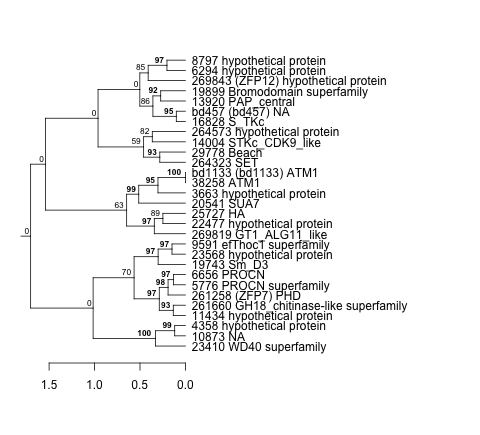 |
0.000051 |
0.026 |
17 |
co2_elevated_stat_arrays | 0.178000 | 0.268 |
| Title | Cluster Plot | Dendrogram | e-value | e-value | e-value | Condition | Condition FDR | Condition Difference |
|---|---|---|---|---|---|---|---|---|
| Thaps_hclust_0104 |
 |
 |
23 |
24 |
220 |
co2_elevated_stat_arrays | 0.835000 | 0.0676 |
| Title | Cluster Plot | Dendrogram | e-value | e-value | e-value | Condition | Condition FDR | Condition Difference |
|---|---|---|---|---|---|---|---|---|
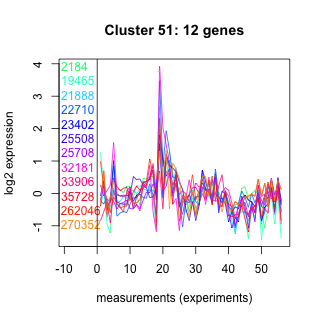
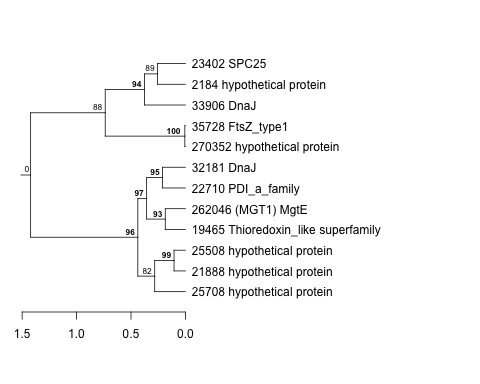
| Thaps_hclust_0052 |
 |
 |
1.4e-22 |
3.3e-19 |
0.0000000000037 |
co2_elevated_stat_arrays | 0.048700 | 0.324 |
| Title | Cluster Plot | Dendrogram | e-value | e-value | e-value | Condition | Condition FDR | Condition Difference |
|---|---|---|---|---|---|---|---|---|
| Thaps_hclust_0229 |
 |
 |
9.9e-18 |
0.000000000000034 |
0.0000002 |
co2_elevated_stat_arrays | 0.000658 | 0.914 |
| Title | Cluster Plot | Dendrogram | e-value | e-value | e-value | Condition | Condition FDR | Condition Difference |
|---|---|---|---|---|---|---|---|---|
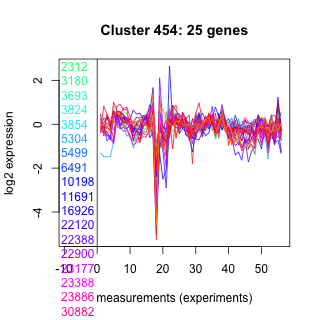
| Thaps_hclust_0454 |
 |
 |
0.0000012 |
0.00054 |
0.21 |
co2_elevated_stat_arrays | 0.534000 | -0.15 |
| Title | Cluster Plot | Dendrogram | e-value | e-value | e-value | Condition | Condition FDR | Condition Difference |
|---|---|---|---|---|---|---|---|---|
| Thaps_hclust_0048 |
 |
 |
4.8e-17 |
0.000000018 |
0.0000097 |
co2_elevated_stat_arrays | 0.001700 | 0.528 |
| Title | Cluster Plot | Dendrogram | e-value | e-value | e-value | Condition | Condition FDR | Condition Difference |
|---|---|---|---|---|---|---|---|---|
| Thaps_hclust_0474 |
 |
 |
0.0078 |
0.000018 |
0.003 |
co2_elevated_stat_arrays | 0.503000 | -0.147 |
| Title | Cluster Plot | Dendrogram | e-value | e-value | e-value | Condition | Condition FDR | Condition Difference |
|---|---|---|---|---|---|---|---|---|
| Thaps_hclust_0105 |
 |
 |
49 |
0.074 |
21 |
co2_elevated_stat_arrays | 0.051600 | 0.476 |
| Title | Cluster Plot | Dendrogram | e-value | e-value | e-value | Condition | Condition FDR | Condition Difference |
|---|---|---|---|---|---|---|---|---|
| Thaps_hclust_0415 |
 |
 |
0.0000000000041 |
0.000000046 |
0.000024 |
co2_elevated_stat_arrays | 0.166000 | -0.245 |
| Title | Cluster Plot | Dendrogram | e-value | e-value | e-value | Condition | Condition FDR | Condition Difference |
|---|---|---|---|---|---|---|---|---|
| Thaps_hclust_0210 |
 |
 |
0.0000000000046 |
0.0000033 |
0.086 |
co2_elevated_stat_arrays | 0.296000 | 0.222 |
| Title | Cluster Plot | Dendrogram | e-value | e-value | e-value | Condition | Condition FDR | Condition Difference |
|---|---|---|---|---|---|---|---|---|
| Thaps_hclust_0494 |
 |
 |
6.7 |
15 |
60 |
co2_elevated_stat_arrays | 0.346000 | 0.222 |
| Title | Cluster Plot | Dendrogram | e-value | e-value | e-value | Condition | Condition FDR | Condition Difference |
|---|---|---|---|---|---|---|---|---|
| Thaps_hclust_0435 |
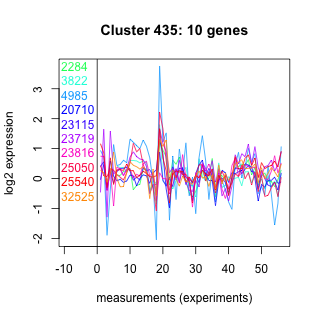 |
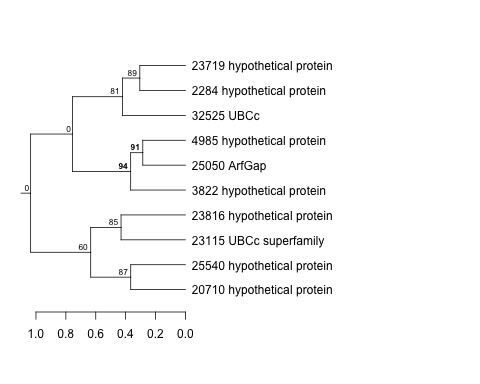 |
0.17 |
0.24 |
1.5 |
co2_elevated_stat_arrays | 0.892000 | 0.0437 |
| Title | Cluster Plot | Dendrogram | e-value | e-value | e-value | Condition | Condition FDR | Condition Difference |
|---|---|---|---|---|---|---|---|---|
| Thaps_hclust_0078 |
 |
 |
8.1e-17 |
0.00018 |
0.021 |
co2_elevated_stat_arrays | 0.234000 | -0.247 |
| Title | Cluster Plot | Dendrogram | e-value | e-value | e-value | Condition | Condition FDR | Condition Difference |
|---|---|---|---|---|---|---|---|---|
| Thaps_hclust_0376 |
 |
 |
0.42 |
3.3 |
2.4 |
co2_elevated_stat_arrays | 0.169000 | -0.388 |
| Title | Cluster Plot | Dendrogram | e-value | e-value | e-value | Condition | Condition FDR | Condition Difference |
|---|---|---|---|---|---|---|---|---|
| Thaps_hclust_0013 |
 |
 |
0.000000021 |
0.00018 |
0.025 |
co2_elevated_stat_arrays | 0.281000 | -0.224 |
| Title | Cluster Plot | Dendrogram | e-value | e-value | e-value | Condition | Condition FDR | Condition Difference |
|---|---|---|---|---|---|---|---|---|
| Thaps_hclust_0152 |
 |
 |
0.00015 |
0.00023 |
0.031 |
co2_elevated_stat_arrays | 0.801000 | -0.0855 |
| Title | Cluster Plot | Dendrogram | e-value | e-value | e-value | Condition | Condition FDR | Condition Difference |
|---|---|---|---|---|---|---|---|---|
| Thaps_hclust_0084 |
 |
 |
0.0000000000035 |
0.00000025 |
0.12 |
co2_elevated_stat_arrays | 0.599000 | 0.132 |
| Title | Cluster Plot | Dendrogram | e-value | e-value | e-value | Condition | Condition FDR | Condition Difference |
|---|---|---|---|---|---|---|---|---|
| Thaps_hclust_0317 |
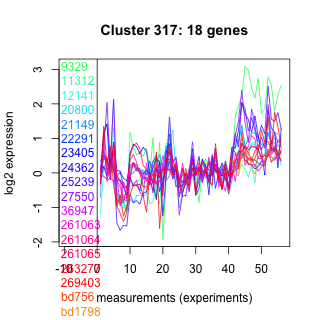 |
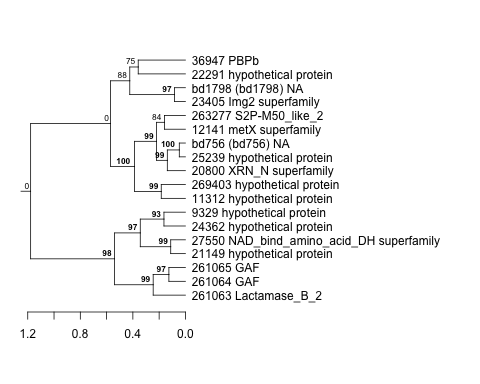 |
0.000000000082 |
0.00000001 |
0.00000042 |
co2_elevated_stat_arrays | 0.299000 | 0.252 |
| Title | Cluster Plot | Dendrogram | e-value | e-value | e-value | Condition | Condition FDR | Condition Difference |
|---|---|---|---|---|---|---|---|---|
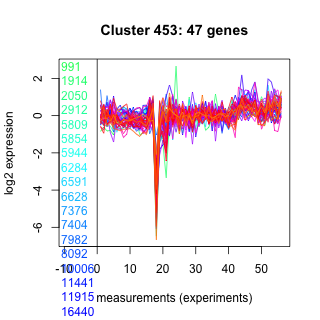
| Thaps_hclust_0455 |
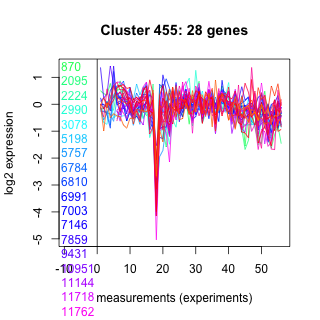 |
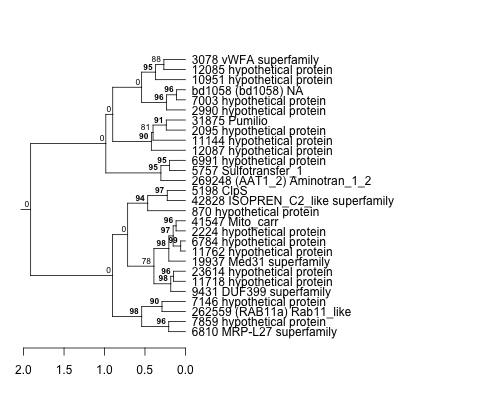 |
0.00038 |
0.18 |
0.01 |
co2_elevated_stat_arrays | 0.398000 | -0.187 |
| Title | Cluster Plot | Dendrogram | e-value | e-value | e-value | Condition | Condition FDR | Condition Difference |
|---|---|---|---|---|---|---|---|---|
| Thaps_hclust_0185 |
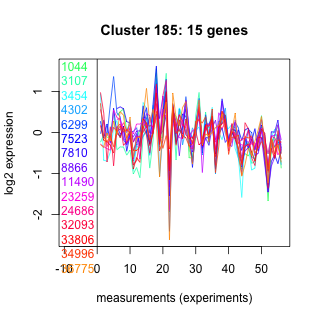 |
 |
0.000039 |
1.8 |
5.8 |
co2_elevated_stat_arrays | 0.007080 | -0.594 |
| Title | Cluster Plot | Dendrogram | e-value | e-value | e-value | Condition | Condition FDR | Condition Difference |
|---|---|---|---|---|---|---|---|---|
| Thaps_hclust_0396 |
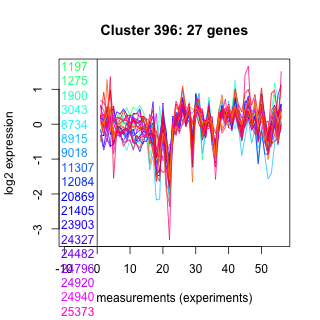 |
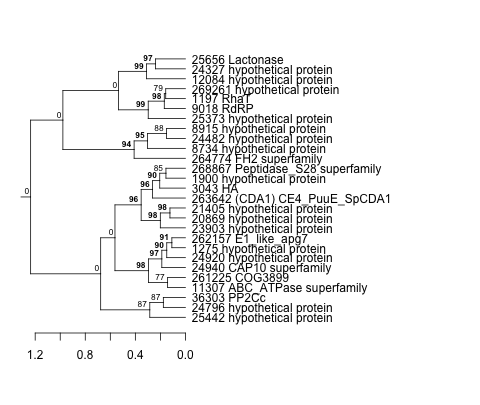 |
0.082 |
10 |
29 |
co2_elevated_stat_arrays | 0.010300 | -0.439 |
| Title | Cluster Plot | Dendrogram | e-value | e-value | e-value | Condition | Condition FDR | Condition Difference |
|---|---|---|---|---|---|---|---|---|
| Thaps_hclust_0066 |
 |
 |
0.0000000000000019 |
0.00000025 |
0.00000047 |
co2_elevated_stat_arrays | 0.261000 | 0.229 |
| Title | Cluster Plot | Dendrogram | e-value | e-value | e-value | Condition | Condition FDR | Condition Difference |
|---|---|---|---|---|---|---|---|---|
| Thaps_hclust_0337 |
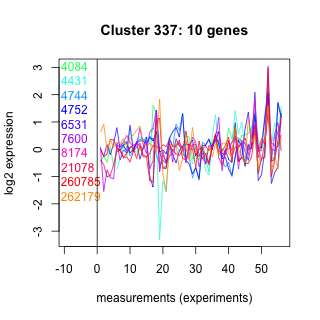 |
 |
3.5 |
3 |
280 |
co2_elevated_stat_arrays | 0.001700 | 0.946 |
| Title | Cluster Plot | Dendrogram | e-value | e-value | e-value | Condition | Condition FDR | Condition Difference |
|---|---|---|---|---|---|---|---|---|
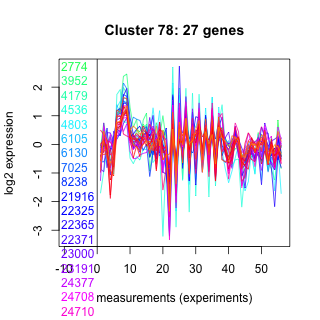
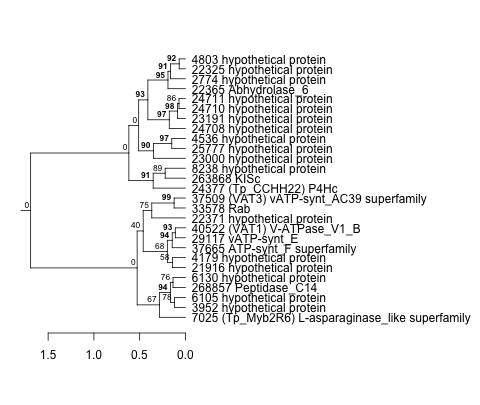
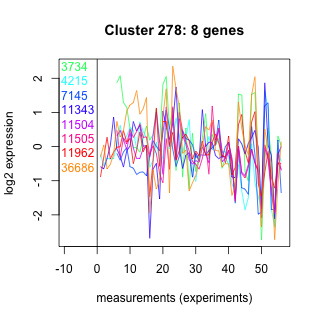
| Thaps_hclust_0278 |
 |
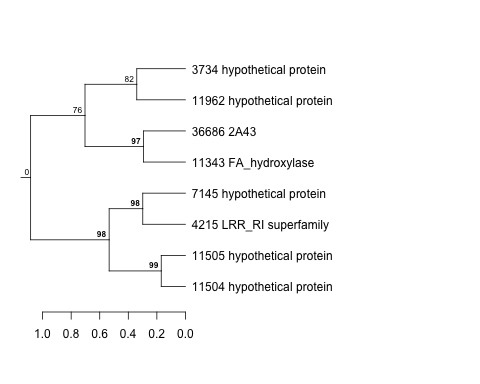 |
0.093 |
0.57 |
39 |
co2_elevated_stat_arrays | 0.000658 | 1.52 |
| Title | Cluster Plot | Dendrogram | e-value | e-value | e-value | Condition | Condition FDR | Condition Difference |
|---|---|---|---|---|---|---|---|---|
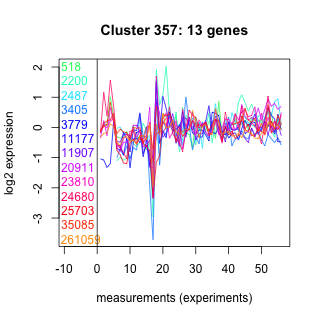
| Thaps_hclust_0357 |
 |
 |
0.077 |
0.1 |
0.81 |
co2_elevated_stat_arrays | 0.543000 | 0.168 |
| Title | Cluster Plot | Dendrogram | e-value | e-value | e-value | Condition | Condition FDR | Condition Difference |
|---|---|---|---|---|---|---|---|---|
| Thaps_hclust_0133 |
 |
 |
0.95 |
2.2 |
2.4 |
co2_elevated_stat_arrays | 0.002130 | -0.517 |
| Title | Cluster Plot | Dendrogram | e-value | e-value | e-value | Condition | Condition FDR | Condition Difference |
|---|---|---|---|---|---|---|---|---|
| Thaps_hclust_0298 |
 |
 |
0.035 |
0.58 |
41 |
co2_elevated_stat_arrays | 0.857000 | 0.059 |
| Title | Cluster Plot | Dendrogram | e-value | e-value | e-value | Condition | Condition FDR | Condition Difference |
|---|---|---|---|---|---|---|---|---|
| Thaps_hclust_0166 |
 |
 |
0.001 |
5.3 |
63 |
co2_elevated_stat_arrays | 0.949000 | 0.0197 |
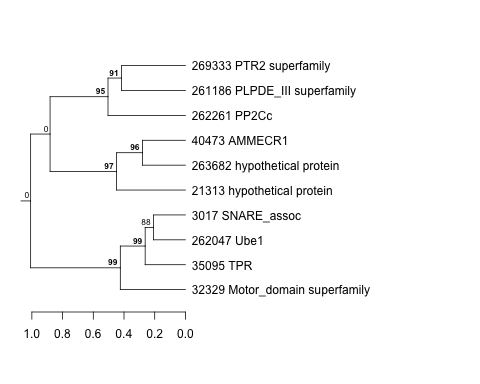
| Title | Cluster Plot | Dendrogram | e-value | e-value | e-value | Condition | Condition FDR | Condition Difference |
|---|---|---|---|---|---|---|---|---|
| Thaps_hclust_0394 |
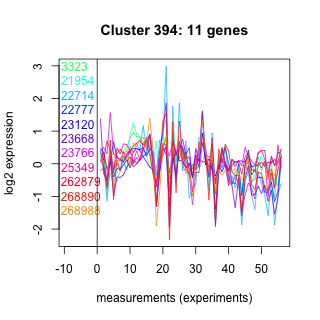 |
 |
0.044 |
0.46 |
610 |
co2_elevated_stat_arrays | 0.477000 | -0.203 |
| Title | Cluster Plot | Dendrogram | e-value | e-value | e-value | Condition | Condition FDR | Condition Difference |
|---|---|---|---|---|---|---|---|---|
| Thaps_hclust_0047 |
 |
 |
3.4e-21 |
3.4e-17 |
5.5e-19 |
co2_elevated_stat_arrays | 0.475000 | 0.154 |
| Title | Cluster Plot | Dendrogram | e-value | e-value | e-value | Condition | Condition FDR | Condition Difference |
|---|---|---|---|---|---|---|---|---|
| Thaps_hclust_0473 |
 |
 |
0.00036 |
0.0036 |
0.68 |
co2_elevated_stat_arrays | 0.254000 | -0.236 |
| Title | Cluster Plot | Dendrogram | e-value | e-value | e-value | Condition | Condition FDR | Condition Difference |
|---|---|---|---|---|---|---|---|---|
| Thaps_hclust_0022 |
 |
|
1.9e-31 |
2.4e-22 |
6.4e-20 |
co2_elevated_stat_arrays | 0.392000 | 0.164 |
| Title | Cluster Plot | Dendrogram | e-value | e-value | e-value | Condition | Condition FDR | Condition Difference |
|---|---|---|---|---|---|---|---|---|
| Thaps_hclust_0414 |
 |
 |
0.0000000000028 |
0.00000026 |
0.000019 |
co2_elevated_stat_arrays | 0.125000 | -0.293 |
| Title | Cluster Plot | Dendrogram | e-value | e-value | e-value | Condition | Condition FDR | Condition Difference |
|---|---|---|---|---|---|---|---|---|
| Thaps_hclust_0209 |
 |
 |
1.2e-16 |
0.00011 |
0.000027 |
co2_elevated_stat_arrays | 0.642000 | -0.118 |
| Title | Cluster Plot | Dendrogram | e-value | e-value | e-value | Condition | Condition FDR | Condition Difference |
|---|---|---|---|---|---|---|---|---|
| Thaps_hclust_0355 |
 |
 |
0.49 |
16 |
310 |
co2_elevated_stat_arrays | 0.625000 | 0.168 |
| Title | Cluster Plot | Dendrogram | e-value | e-value | e-value | Condition | Condition FDR | Condition Difference |
|---|---|---|---|---|---|---|---|---|
| Thaps_hclust_0493 |
 |
 |
0.00000036 |
0.0000009 |
0.000056 |
co2_elevated_stat_arrays | 0.045100 | 0.463 |
| Title | Cluster Plot | Dendrogram | e-value | e-value | e-value | Condition | Condition FDR | Condition Difference |
|---|---|---|---|---|---|---|---|---|
| Thaps_hclust_0131 |
 |
 |
260 |
48 |
370 |
co2_elevated_stat_arrays | 0.299000 | -0.297 |
| Title | Cluster Plot | Dendrogram | e-value | e-value | e-value | Condition | Condition FDR | Condition Difference |
|---|---|---|---|---|---|---|---|---|
| Thaps_hclust_0434 |
 |
 |
0.011 |
17 |
57 |
co2_elevated_stat_arrays | 0.928000 | 0.0314 |
| Title | Cluster Plot | Dendrogram | e-value | e-value | e-value | Condition | Condition FDR | Condition Difference |
|---|---|---|---|---|---|---|---|---|
| Thaps_hclust_0164 |
 |
 |
13 |
58 |
65 |
co2_elevated_stat_arrays | 0.483000 | -0.201 |
| Title | Cluster Plot | Dendrogram | e-value | e-value | e-value | Condition | Condition FDR | Condition Difference |
|---|---|---|---|---|---|---|---|---|
| Thaps_hclust_0375 |
 |
 |
1.8 |
2.9 |
40 |
co2_elevated_stat_arrays | 0.951000 | -0.0179 |
| Title | Cluster Plot | Dendrogram | e-value | e-value | e-value | Condition | Condition FDR | Condition Difference |
|---|---|---|---|---|---|---|---|---|
| Thaps_hclust_0012 |
 |
 |
0.000000000019 |
0.0000000000016 |
0.0000013 |
co2_elevated_stat_arrays | 0.490000 | -0.163 |
| Title | Cluster Plot | Dendrogram | e-value | e-value | e-value | Condition | Condition FDR | Condition Difference |
|---|---|---|---|---|---|---|---|---|
| Thaps_hclust_0151 |
 |
 |
0.015 |
0.13 |
16 |
co2_elevated_stat_arrays | 0.063900 | -0.422 |
| Title | Cluster Plot | Dendrogram | e-value | e-value | e-value | Condition | Condition FDR | Condition Difference |
|---|---|---|---|---|---|---|---|---|
| Thaps_hclust_0083 |
 |
 |
0.0039 |
6.3 |
14 |
co2_elevated_stat_arrays | 0.361000 | -0.226 |
| Title | Cluster Plot | Dendrogram | e-value | e-value | e-value | Condition | Condition FDR | Condition Difference |
|---|---|---|---|---|---|---|---|---|
| Thaps_hclust_0316 |
 |
 |
0.14 |
2.2 |
4.4 |
co2_elevated_stat_arrays | 0.002130 | 0.872 |
| Title | Cluster Plot | Dendrogram | e-value | e-value | e-value | Condition | Condition FDR | Condition Difference |
|---|---|---|---|---|---|---|---|---|
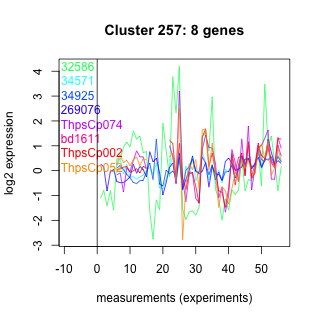
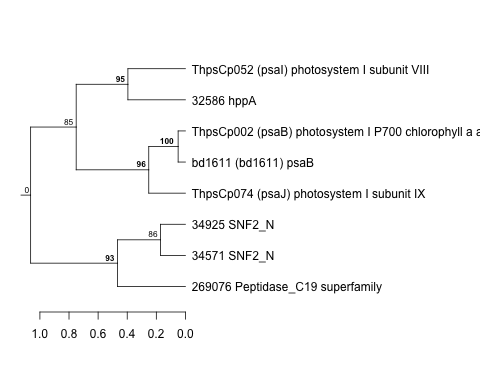
| Thaps_hclust_0257 |
 |
 |
Not available | Not available | Not available | co2_elevated_stat_arrays | 0.301000 | 0.316 |
| Title | Cluster Plot | Dendrogram | e-value | e-value | e-value | Condition | Condition FDR | Condition Difference |
|---|---|---|---|---|---|---|---|---|
| Thaps_hclust_0184 |
 |
 |
80 |
320 |
240 |
co2_elevated_stat_arrays | 0.847000 | -0.0685 |
| Title | Cluster Plot | Dendrogram | e-value | e-value | e-value | Condition | Condition FDR | Condition Difference |
|---|---|---|---|---|---|---|---|---|
| Thaps_hclust_0395 |
 |
 |
0.0015 |
0.0018 |
0.48 |
co2_elevated_stat_arrays | 0.005610 | -0.469 |
| Title | Cluster Plot | Dendrogram | e-value | e-value | e-value | Condition | Condition FDR | Condition Difference |
|---|---|---|---|---|---|---|---|---|
| Thaps_hclust_0065 |
 |
 |
1.5e-32 |
2.5e-32 |
9.9e-33 |
co2_elevated_stat_arrays | 0.001190 | 0.507 |
| Title | Cluster Plot | Dendrogram | e-value | e-value | e-value | Condition | Condition FDR | Condition Difference |
|---|---|---|---|---|---|---|---|---|
| Thaps_hclust_0336 |
 |
 |
8.7e-23 |
0.00000000000015 |
0.0000000000000032 |
co2_elevated_stat_arrays | 0.001700 | 0.801 |
| Title | Cluster Plot | Dendrogram | e-value | e-value | e-value | Condition | Condition FDR | Condition Difference |
|---|---|---|---|---|---|---|---|---|
| Thaps_hclust_0277 |
 |
 |
0.00036 |
6.6 |
7.6 |
co2_elevated_stat_arrays | 0.517000 | 0.178 |
| Title | Cluster Plot | Dendrogram | e-value | e-value | e-value | Condition | Condition FDR | Condition Difference |
|---|---|---|---|---|---|---|---|---|
| Thaps_hclust_0356 |
 |
 |
2.1 |
41 |
71 |
co2_elevated_stat_arrays | 0.626000 | -0.161 |
| Title | Cluster Plot | Dendrogram | e-value | e-value | e-value | Condition | Condition FDR | Condition Difference |
|---|---|---|---|---|---|---|---|---|
| Thaps_hclust_0132 |
 |
 |
0.00017 |
0.000096 |
26 |
co2_elevated_stat_arrays | 0.002130 | -0.514 |
| Title | Cluster Plot | Dendrogram | e-value | e-value | e-value | Condition | Condition FDR | Condition Difference |
|---|---|---|---|---|---|---|---|---|
| Thaps_hclust_0297 |
 |
 |
0.018 |
2.5 |
24 |
co2_elevated_stat_arrays | 0.807000 | -0.0761 |
| Title | Cluster Plot | Dendrogram | e-value | e-value | e-value | Condition | Condition FDR | Condition Difference |
|---|---|---|---|---|---|---|---|---|
| Thaps_hclust_0060 |
 |
 |
0.00000047 |
0.00077 |
0.0075 |
co2_elevated_stat_arrays | 0.481000 | 0.163 |
| Title | Cluster Plot | Dendrogram | e-value | e-value | e-value | Condition | Condition FDR | Condition Difference |
|---|---|---|---|---|---|---|---|---|
| Thaps_hclust_0165 |
 |
 |
0.00011 |
2.3 |
3.9 |
co2_elevated_stat_arrays | 0.006700 | -0.6 |
| Title | Cluster Plot | Dendrogram | e-value | e-value | e-value | Condition | Condition FDR | Condition Difference |
|---|---|---|---|---|---|---|---|---|
| Thaps_hclust_0258 |
 |
 |
0.027 |
0.021 |
0.036 |
co2_elevated_stat_arrays | 0.248000 | 0.326 |
| Title | Cluster Plot | Dendrogram | e-value | e-value | e-value | Condition | Condition FDR | Condition Difference |
|---|---|---|---|---|---|---|---|---|
| Thaps_hclust_0103 |
 |
 |
3.4 |
4.8 |
21 |
co2_elevated_stat_arrays | 0.229000 | -0.309 |
| Title | Cluster Plot | Dendrogram | e-value | e-value | e-value | Condition | Condition FDR | Condition Difference |
|---|---|---|---|---|---|---|---|---|
| Thaps_hclust_0051 |
 |
 |
0.012 |
0.033 |
0.41 |
co2_elevated_stat_arrays | 0.345000 | 0.259 |
| Title | Cluster Plot | Dendrogram | e-value | e-value | e-value | Condition | Condition FDR | Condition Difference |
|---|---|---|---|---|---|---|---|---|
| Thaps_hclust_0208 |
 |
|
1.2e-20 |
0.0000000000000057 |
0.0000000099 |
co2_elevated_stat_arrays | 0.000658 | -0.474 |
| Title | Cluster Plot | Dendrogram | e-value | e-value | e-value | Condition | Condition FDR | Condition Difference |
|---|---|---|---|---|---|---|---|---|
| Thaps_hclust_0492 |
 |
 |
0.29 |
0.47 |
23 |
co2_elevated_stat_arrays | 0.002600 | 0.707 |
| Title | Cluster Plot | Dendrogram | e-value | e-value | e-value | Condition | Condition FDR | Condition Difference |
|---|---|---|---|---|---|---|---|---|
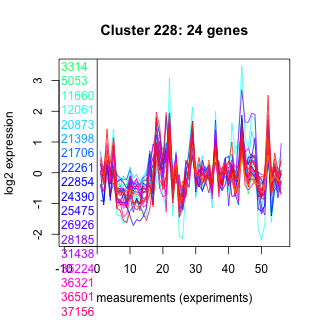
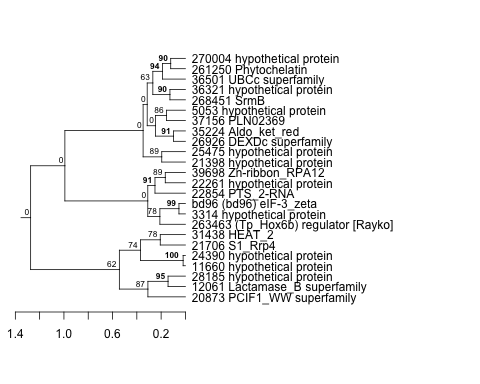
| Thaps_hclust_0228 |
 |
 |
0.00000000000028 |
0.0027 |
0.016 |
co2_elevated_stat_arrays | 0.000658 | 0.92 |
| Title | Cluster Plot | Dendrogram | e-value | e-value | e-value | Condition | Condition FDR | Condition Difference |
|---|---|---|---|---|---|---|---|---|
| Thaps_hclust_0453 |
 |
 |
0.000000000093 |
0.000000041 |
0.00016 |
co2_elevated_stat_arrays | 0.206000 | 0.226 |