Hierarchical Clusters
Displaying 1301 - 1400 of 7500
| Title | Cluster Plot | Dendrogram | e-value | e-value | e-value | Condition | Condition FDR | Condition Difference |
|---|---|---|---|---|---|---|---|---|
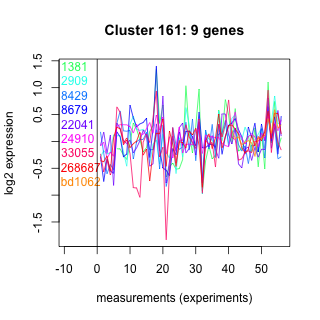
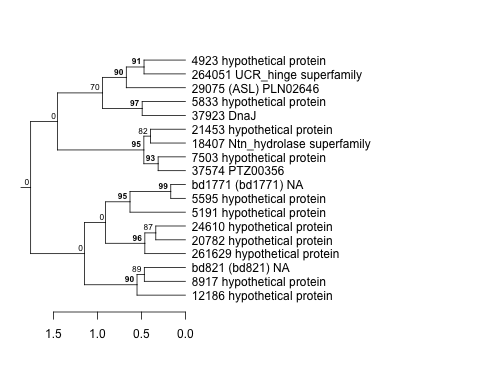
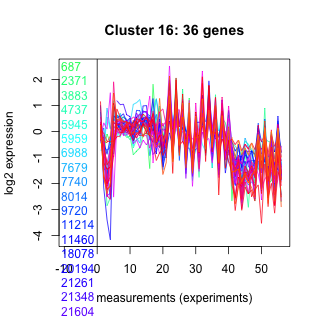
| Thaps_hclust_0161 |
 |
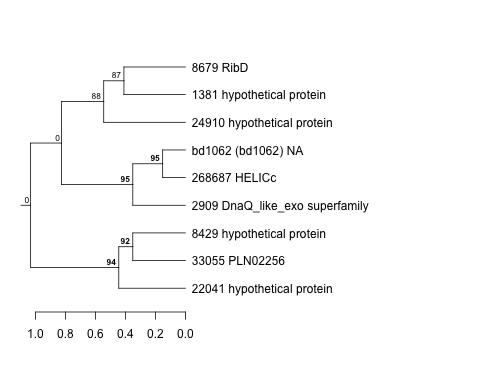 |
1.8 |
13 |
18 |
exponential_vs_stationary_24highlight | 0.847000 | -0.0357 |
| Title | Cluster Plot | Dendrogram | e-value | e-value | e-value | Condition | Condition FDR | Condition Difference |
|---|---|---|---|---|---|---|---|---|
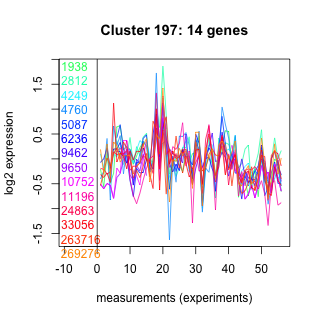
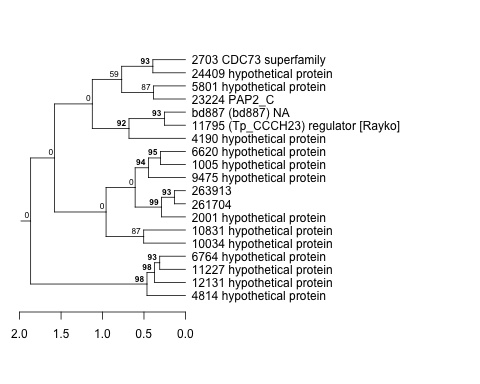
| Thaps_hclust_0197 |
 |
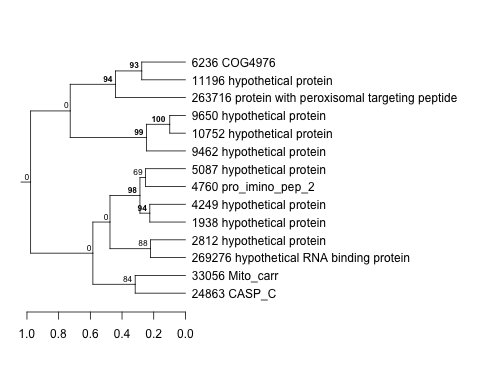 |
0.12 |
0.3 |
0.65 |
exponential_vs_stationary_24highlight | 0.847000 | -0.0293 |
| Title | Cluster Plot | Dendrogram | e-value | e-value | e-value | Condition | Condition FDR | Condition Difference |
|---|---|---|---|---|---|---|---|---|
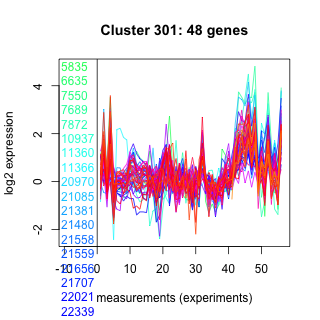
| Thaps_hclust_0301 |
 |
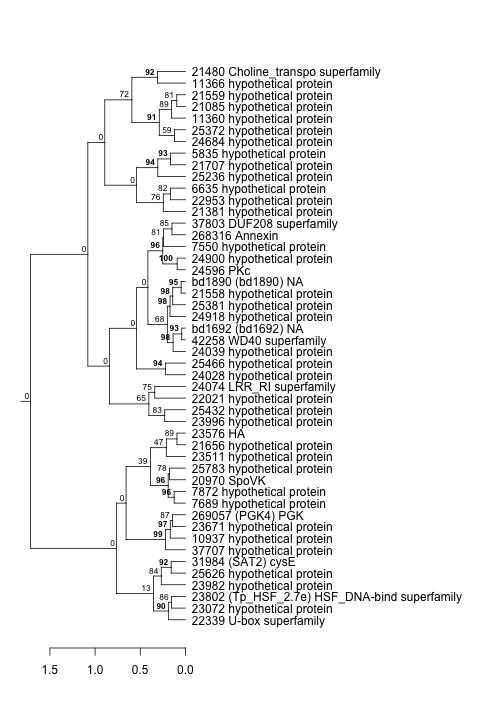 |
0.000000022 |
0.82 |
2.1 |
lowN_TMEVA | 0.847000 | -0.0717 |
| Title | Cluster Plot | Dendrogram | e-value | e-value | e-value | Condition | Condition FDR | Condition Difference |
|---|---|---|---|---|---|---|---|---|
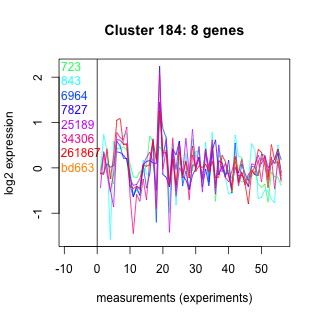
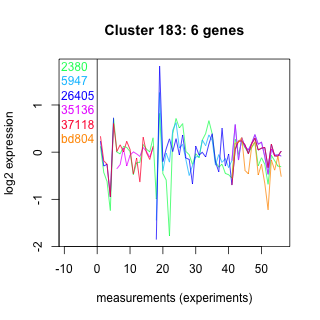
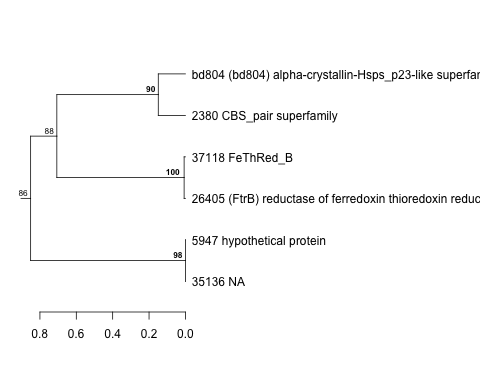
| Thaps_hclust_0184 |
 |
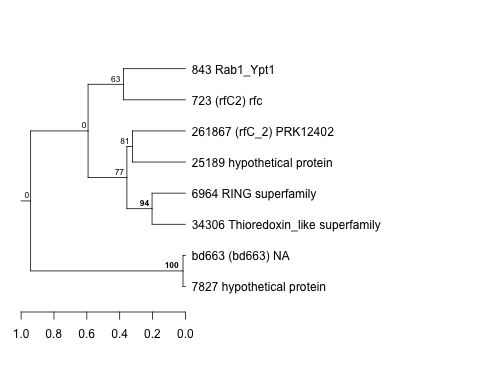 |
80 |
320 |
240 |
co2_elevated_stat_arrays | 0.847000 | -0.0685 |
| Title | Cluster Plot | Dendrogram | e-value | e-value | e-value | Condition | Condition FDR | Condition Difference |
|---|---|---|---|---|---|---|---|---|
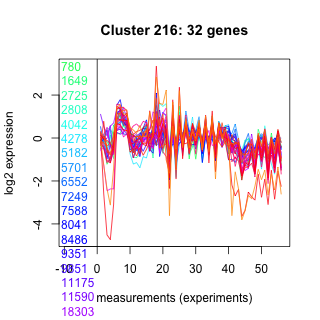
| Thaps_hclust_0216 |
 |
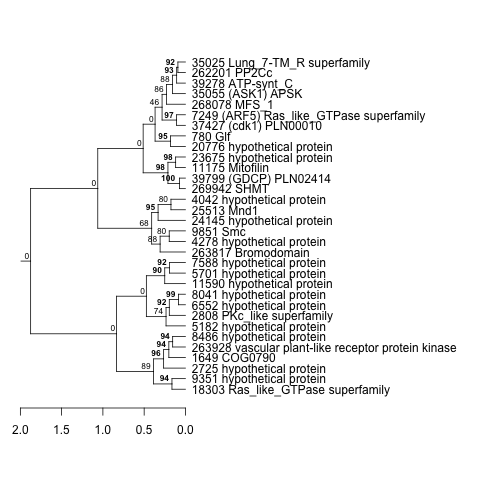 |
0.0000076 |
0.019 |
0.0036 |
highpH_TMEVA | 0.846000 | -0.0347 |
| Title | Cluster Plot | Dendrogram | e-value | e-value | e-value | Condition | Condition FDR | Condition Difference |
|---|---|---|---|---|---|---|---|---|
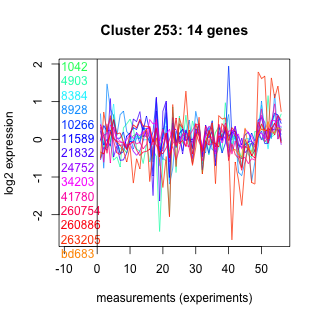
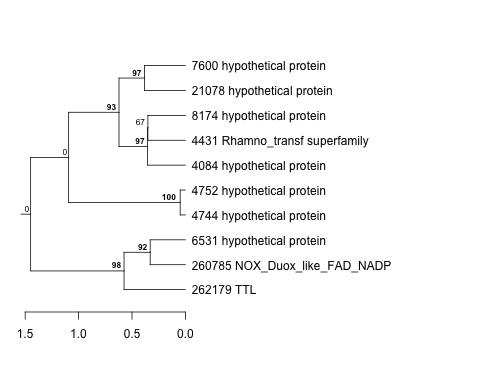
| Thaps_hclust_0253 |
 |
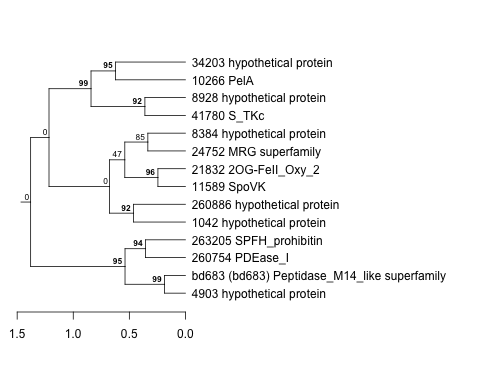 |
1.5 |
61 |
370 |
lowFe_TMEVA | 0.846000 | -0.087 |
| Title | Cluster Plot | Dendrogram | e-value | e-value | e-value | Condition | Condition FDR | Condition Difference |
|---|---|---|---|---|---|---|---|---|
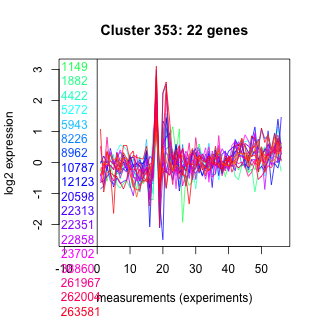
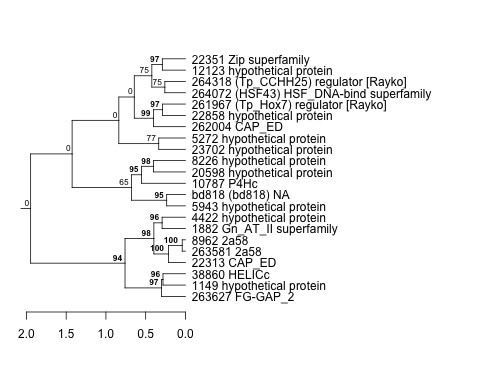
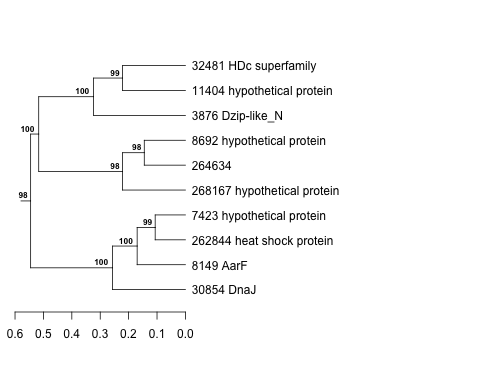
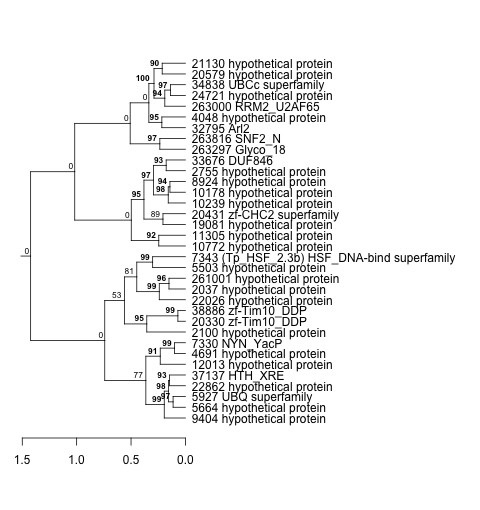
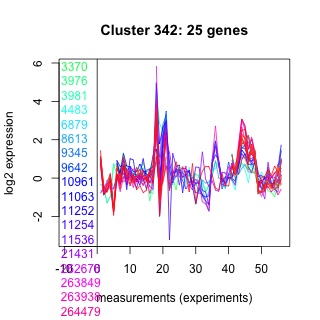
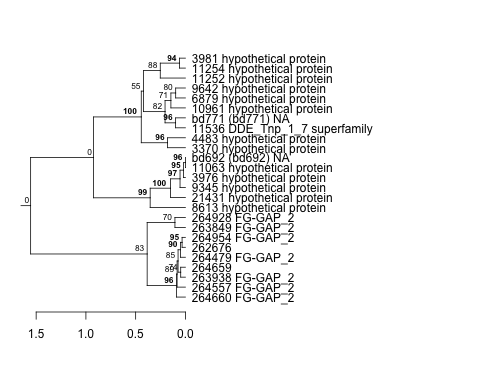
| Thaps_hclust_0343 |
 |
 |
9.7e-16 |
0.000000023 |
0.0000000024 |
diel_light_vs_dark | 0.846000 | 0.0475 |
| Thaps_hclust_0343 |
|
|
9.7e-16 |
0.000000023 |
0.0000000024 |
co2_elevated_expo_arrays | 0.833000 | 0.0686 |
| Title | Cluster Plot | Dendrogram | e-value | e-value | e-value | Condition | Condition FDR | Condition Difference |
|---|---|---|---|---|---|---|---|---|
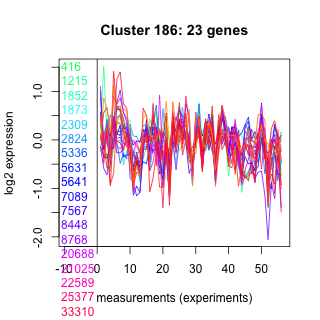
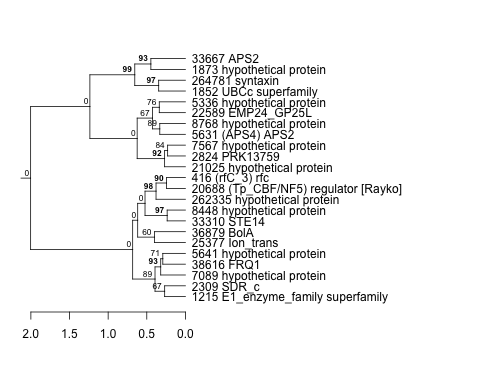
| Thaps_hclust_0186 |
 |
 |
0.0000000043 |
0.006 |
0.0000084 |
lowSi_TMEVA | 0.845000 | -0.211 |
| Title | Cluster Plot | Dendrogram | e-value | e-value | e-value | Condition | Condition FDR | Condition Difference |
|---|---|---|---|---|---|---|---|---|
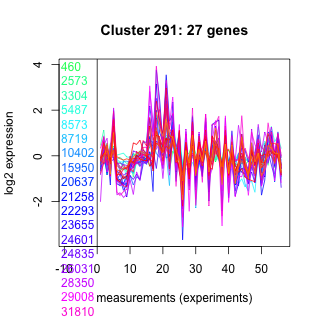
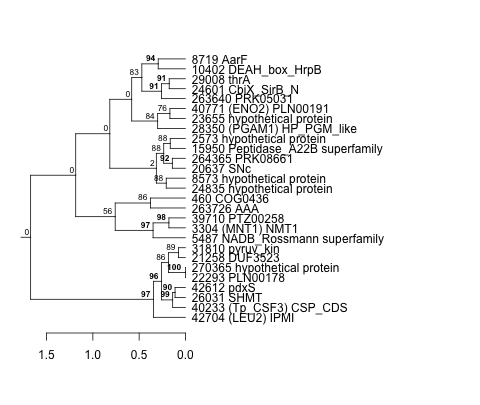
| Thaps_hclust_0291 |
 |
 |
0.000000049 |
0.000056 |
0.0000035 |
lowSi_TMEVA | 0.845000 | -0.21 |
| Title | Cluster Plot | Dendrogram | e-value | e-value | e-value | Condition | Condition FDR | Condition Difference |
|---|---|---|---|---|---|---|---|---|
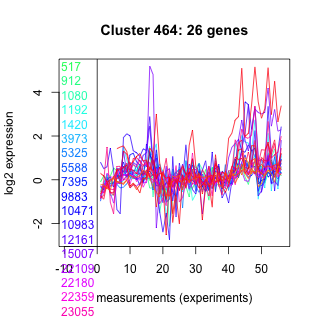
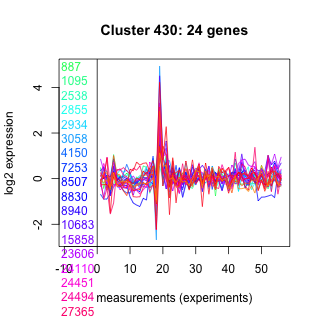
| Thaps_hclust_0464 |
 |
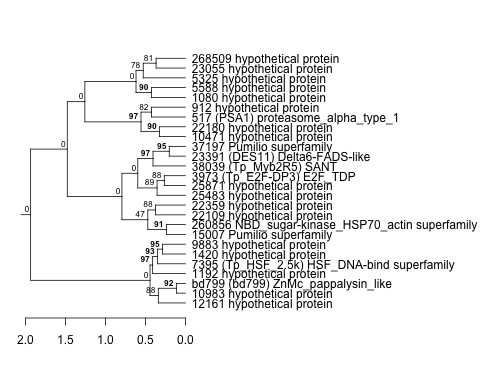 |
0.0002 |
14 |
31 |
lowSi_TMEVA | 0.845000 | -0.208 |
| Thaps_hclust_0464 |
|
|
0.0002 |
14 |
31 |
lowN_TMEVA | 0.835000 | 0.0823 |
| Title | Cluster Plot | Dendrogram | e-value | e-value | e-value | Condition | Condition FDR | Condition Difference |
|---|---|---|---|---|---|---|---|---|
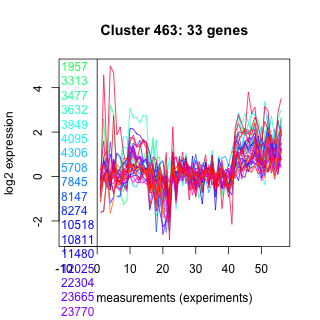
| Thaps_hclust_0463 |
 |
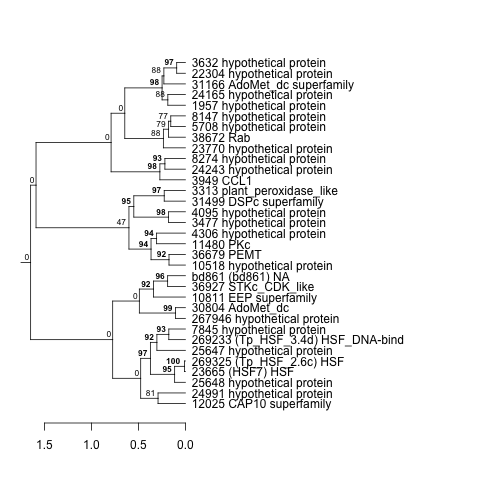 |
0.0000000063 |
0.000000075 |
0.78 |
lowSi_TMEVA | 0.845000 | 0.211 |
| Thaps_hclust_0463 |
|
|
0.0000000063 |
0.000000075 |
0.78 |
diel_exponential_vs_stationary | 0.837000 | -0.0369 |
| Title | Cluster Plot | Dendrogram | e-value | e-value | e-value | Condition | Condition FDR | Condition Difference |
|---|---|---|---|---|---|---|---|---|
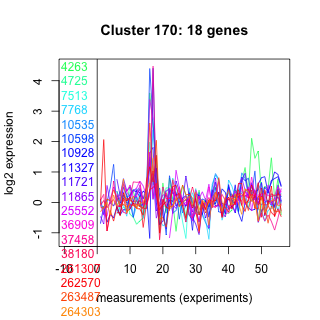
| Thaps_hclust_0170 |
 |
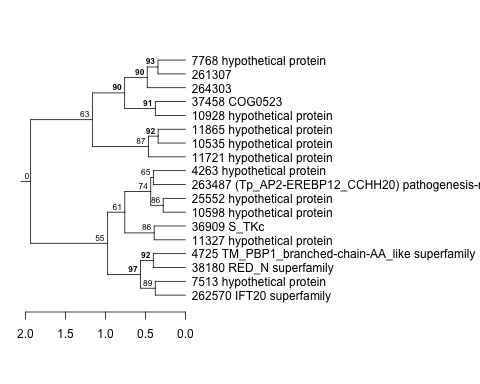 |
0.028 |
1.8 |
150 |
co2_elevated_stat_arrays | 0.845000 | 0.0572 |
| Title | Cluster Plot | Dendrogram | e-value | e-value | e-value | Condition | Condition FDR | Condition Difference |
|---|---|---|---|---|---|---|---|---|
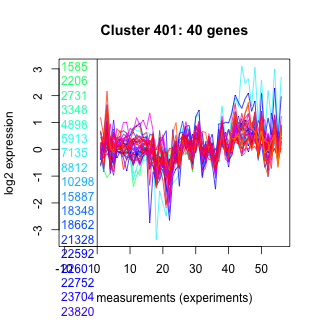
| Thaps_hclust_0401 |
 |
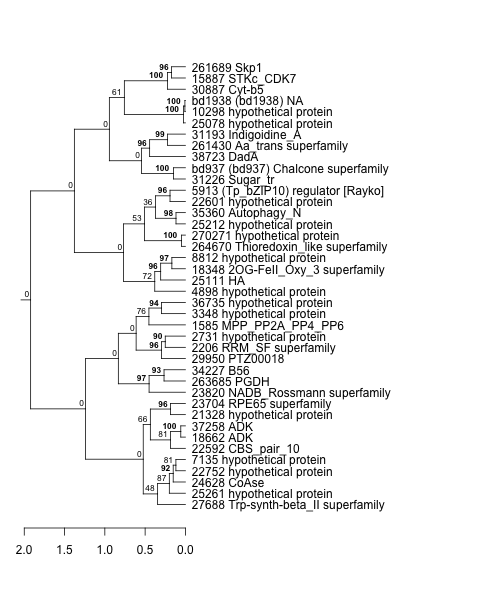 |
3.5e-16 |
0.000000000077 |
0.000000012 |
highpH_TMEVA | 0.845000 | 0.032 |
| Title | Cluster Plot | Dendrogram | e-value | e-value | e-value | Condition | Condition FDR | Condition Difference |
|---|---|---|---|---|---|---|---|---|
| Thaps_hclust_0135 |
 |
 |
0.0000000028 |
0.0077 |
0.17 |
lowSi_TMEVA | 0.844000 | -0.213 |
| Title | Cluster Plot | Dendrogram | e-value | e-value | e-value | Condition | Condition FDR | Condition Difference |
|---|---|---|---|---|---|---|---|---|
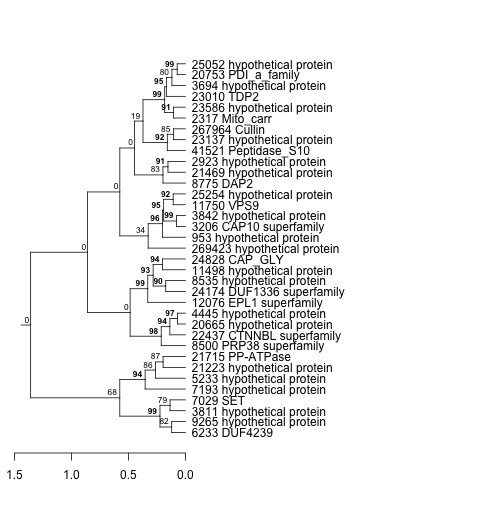
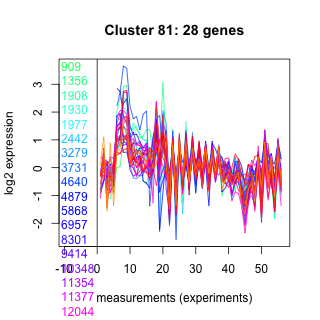
| Thaps_hclust_0081 |
 |
 |
0.000000001 |
0.000000000027 |
0.28 |
lowSi_TMEVA | 0.844000 | -0.213 |
| Title | Cluster Plot | Dendrogram | e-value | e-value | e-value | Condition | Condition FDR | Condition Difference |
|---|---|---|---|---|---|---|---|---|
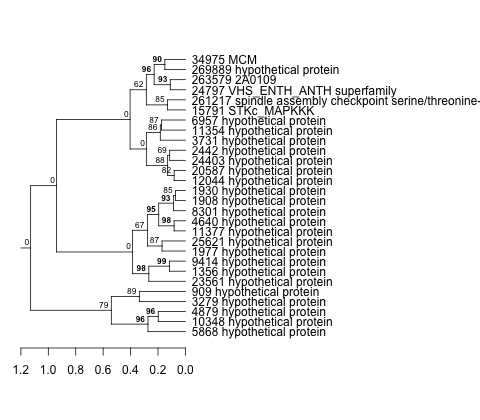
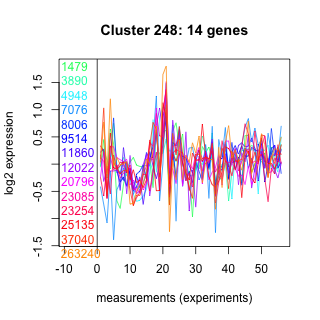
| Thaps_hclust_0248 |
 |
 |
0.000037 |
0.000078 |
39 |
lowtemp_TMEVA | 0.844000 | 0.0684 |
| Thaps_hclust_0248 |
|
|
0.000037 |
0.000078 |
39 |
lowSi_TMEVA | 0.844000 | 0.218 |
| Title | Cluster Plot | Dendrogram | e-value | e-value | e-value | Condition | Condition FDR | Condition Difference |
|---|---|---|---|---|---|---|---|---|
| Thaps_hclust_0021 |
 |
 |
0.00000000002 |
0.0000088 |
0.0012 |
lowSi_TMEVA | 0.844000 | -0.213 |
| Title | Cluster Plot | Dendrogram | e-value | e-value | e-value | Condition | Condition FDR | Condition Difference |
|---|---|---|---|---|---|---|---|---|
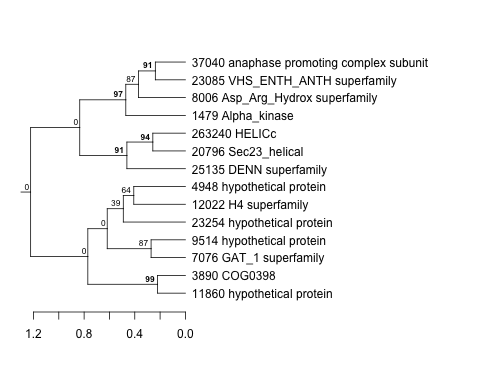
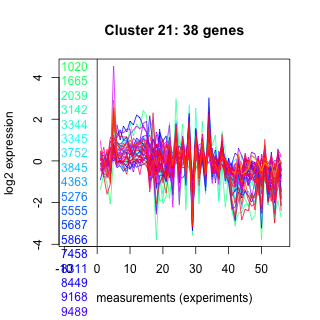
| Thaps_hclust_0351 |
 |
 |
0.033 |
0.06 |
50 |
exponential_vs_stationary_24highlight | 0.844000 | 0.0261 |
| Title | Cluster Plot | Dendrogram | e-value | e-value | e-value | Condition | Condition FDR | Condition Difference |
|---|---|---|---|---|---|---|---|---|
| Thaps_hclust_0195 |
 |
 |
0.0031 |
0.024 |
0.00037 |
lowtemp_TMEVA | 0.844000 | 0.0607 |
| Title | Cluster Plot | Dendrogram | e-value | e-value | e-value | Condition | Condition FDR | Condition Difference |
|---|---|---|---|---|---|---|---|---|
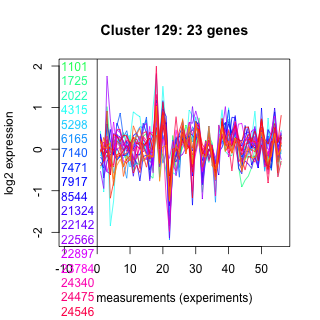
| Thaps_hclust_0129 |
 |
 |
0.015 |
0.29 |
1 |
lowSi_TMEVA | 0.844000 | -0.213 |
| Title | Cluster Plot | Dendrogram | e-value | e-value | e-value | Condition | Condition FDR | Condition Difference |
|---|---|---|---|---|---|---|---|---|
| Thaps_hclust_0192 |
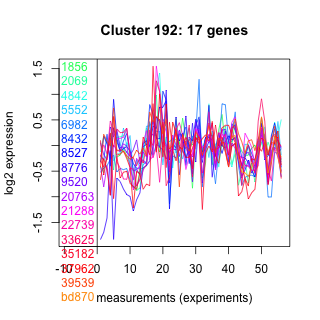 |
 |
0.000012 |
0.017 |
1.3 |
lowtemp_TMEVA | 0.844000 | -0.0651 |
| Title | Cluster Plot | Dendrogram | e-value | e-value | e-value | Condition | Condition FDR | Condition Difference |
|---|---|---|---|---|---|---|---|---|
| Thaps_hclust_0393 |
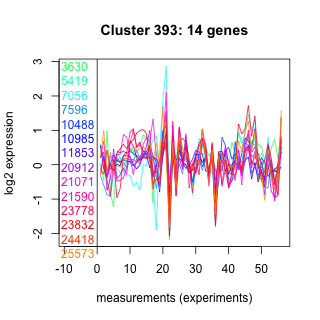 |
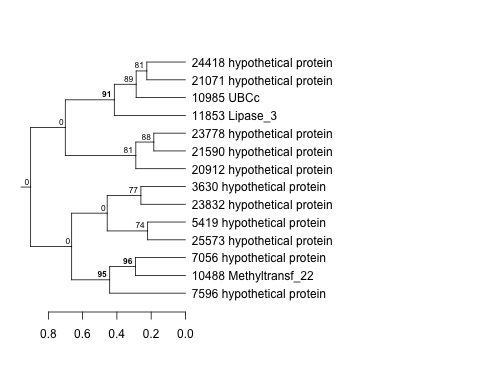 |
2 |
16 |
16 |
lowSi_TMEVA | 0.844000 | -0.218 |
| Title | Cluster Plot | Dendrogram | e-value | e-value | e-value | Condition | Condition FDR | Condition Difference |
|---|---|---|---|---|---|---|---|---|
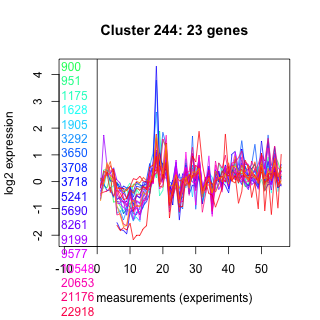
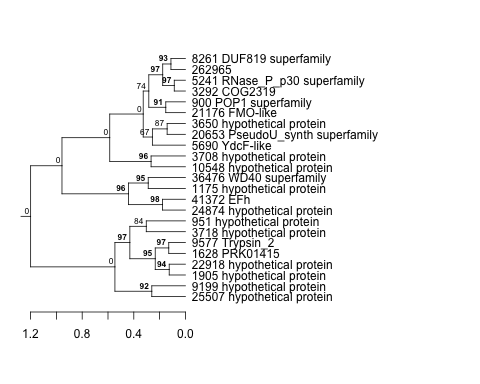
| Thaps_hclust_0244 |
 |
 |
0.000000057 |
0.0001 |
4.1 |
lowtemp_TMEVA | 0.844000 | 0.057 |
| Title | Cluster Plot | Dendrogram | e-value | e-value | e-value | Condition | Condition FDR | Condition Difference |
|---|---|---|---|---|---|---|---|---|
| Thaps_hclust_0084 |
 |
 |
0.0000000000035 |
0.00000025 |
0.12 |
diel_exponential_vs_stationary | 0.844000 | 0.0419 |
| Title | Cluster Plot | Dendrogram | e-value | e-value | e-value | Condition | Condition FDR | Condition Difference |
|---|---|---|---|---|---|---|---|---|
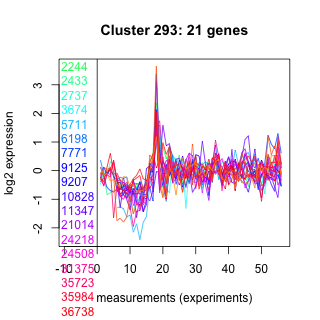
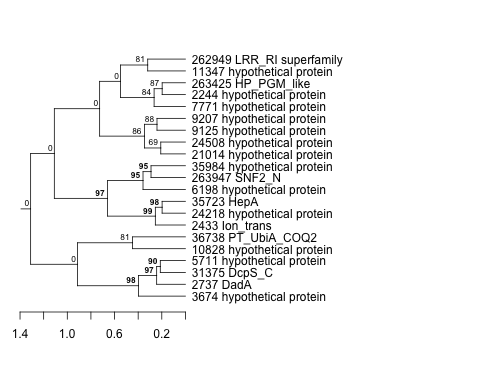
| Thaps_hclust_0293 |
 |
 |
0.16 |
120 |
360 |
co2_elevated_stat_arrays | 0.843000 | 0.0578 |
| Title | Cluster Plot | Dendrogram | e-value | e-value | e-value | Condition | Condition FDR | Condition Difference |
|---|---|---|---|---|---|---|---|---|
| Thaps_hclust_0382 |
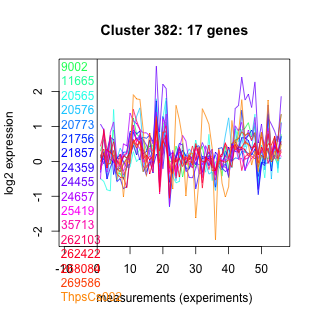 |
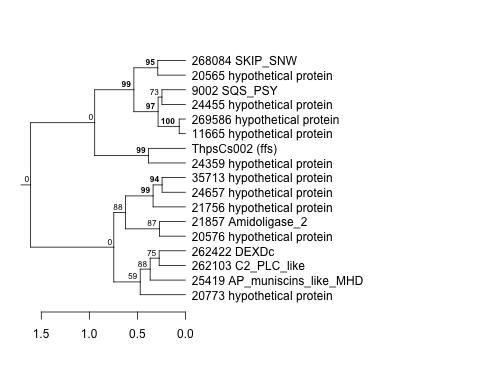 |
0.0000042 |
0.012 |
0.055 |
lowN_TMEVA | 0.842000 | -0.0803 |
| Thaps_hclust_0382 |
|
|
0.0000042 |
0.012 |
0.055 |
lowSi_TMEVA | 0.839000 | 0.227 |
| Title | Cluster Plot | Dendrogram | e-value | e-value | e-value | Condition | Condition FDR | Condition Difference |
|---|---|---|---|---|---|---|---|---|
| Thaps_hclust_0237 |
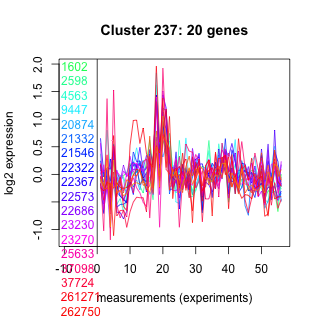 |
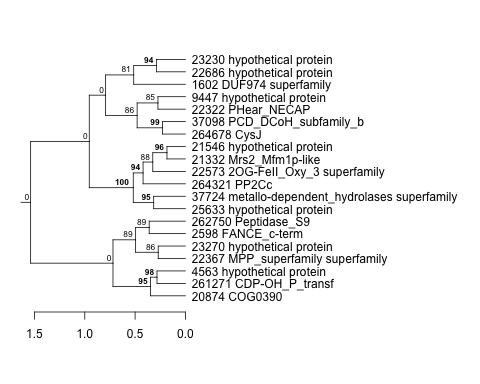 |
0.0000097 |
0.000009 |
0.000056 |
lowN_TMEVA | 0.842000 | 0.0794 |
| Title | Cluster Plot | Dendrogram | e-value | e-value | e-value | Condition | Condition FDR | Condition Difference |
|---|---|---|---|---|---|---|---|---|
| Thaps_hclust_0037 |
 |
 |
0.23 |
0.79 |
340 |
lowN_TMEVA | 0.842000 | -0.0796 |
| Title | Cluster Plot | Dendrogram | e-value | e-value | e-value | Condition | Condition FDR | Condition Difference |
|---|---|---|---|---|---|---|---|---|
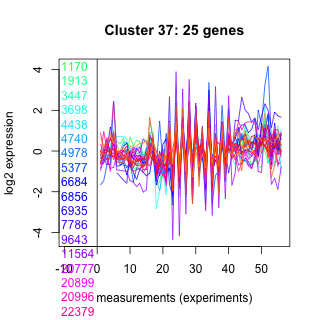
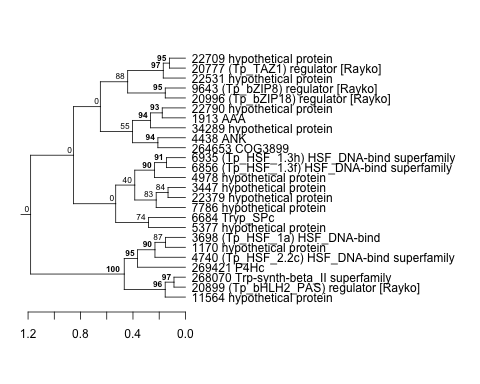
| Thaps_hclust_0324 |
 |
 |
0.0023 |
2.4 |
5.1 |
lowN_TMEVA | 0.842000 | 0.0849 |
| Title | Cluster Plot | Dendrogram | e-value | e-value | e-value | Condition | Condition FDR | Condition Difference |
|---|---|---|---|---|---|---|---|---|
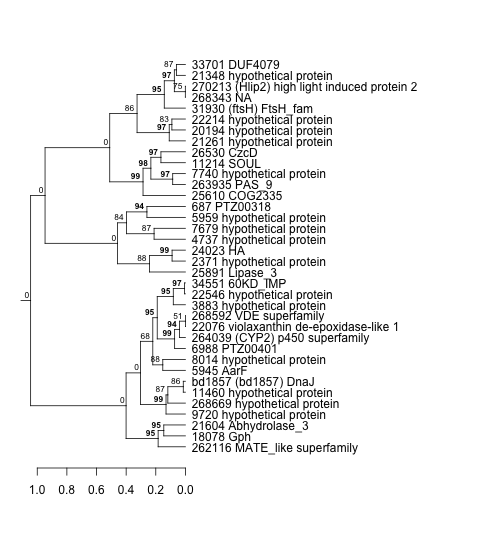
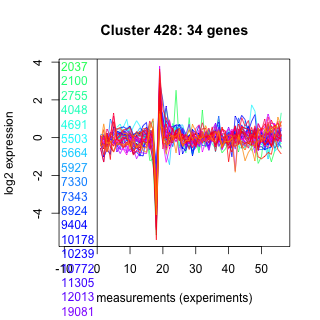
| Thaps_hclust_0427 |
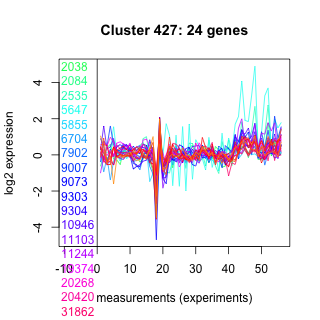 |
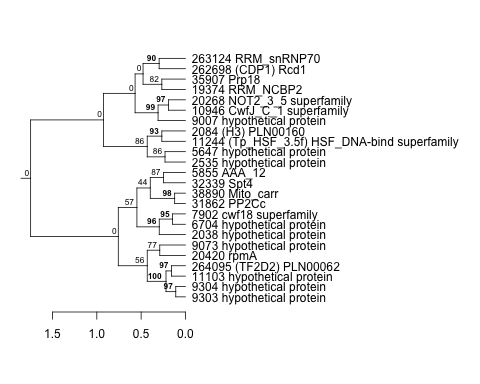 |
0.0000022 |
8.8 |
40 |
lowN_TMEVA | 0.842000 | -0.0783 |
| Title | Cluster Plot | Dendrogram | e-value | e-value | e-value | Condition | Condition FDR | Condition Difference |
|---|---|---|---|---|---|---|---|---|
| Thaps_hclust_0494 |
 |
 |
6.7 |
15 |
60 |
lowN_TMEVA | 0.842000 | 0.08 |
| Title | Cluster Plot | Dendrogram | e-value | e-value | e-value | Condition | Condition FDR | Condition Difference |
|---|---|---|---|---|---|---|---|---|
| Thaps_hclust_0162 |
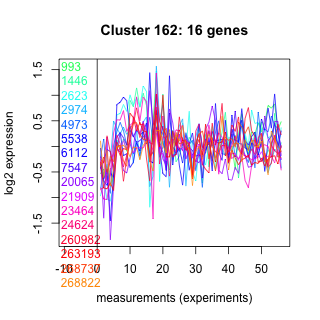 |
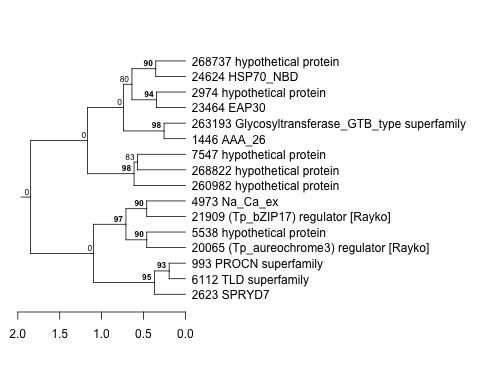 |
0.032 |
3.2 |
58 |
highlight_arrays | 0.842000 | -0.039 |
| Title | Cluster Plot | Dendrogram | e-value | e-value | e-value | Condition | Condition FDR | Condition Difference |
|---|---|---|---|---|---|---|---|---|
| Thaps_hclust_0405 |
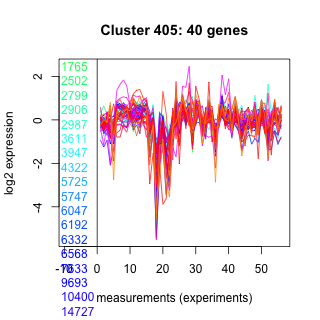 |
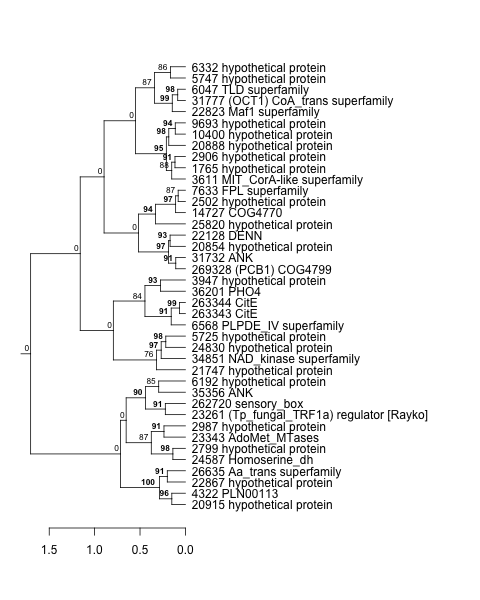 |
0.00000000036 |
0.0000000063 |
0.005 |
lowN_TMEVA | 0.842000 | -0.0757 |
| Title | Cluster Plot | Dendrogram | e-value | e-value | e-value | Condition | Condition FDR | Condition Difference |
|---|---|---|---|---|---|---|---|---|
| Thaps_hclust_0395 |
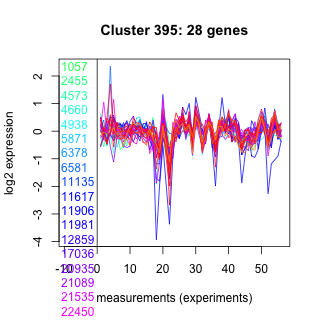 |
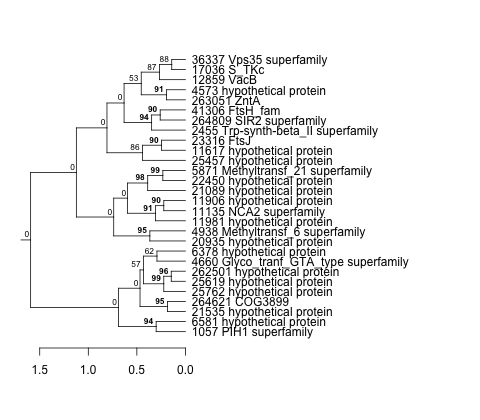 |
0.0015 |
0.0018 |
0.48 |
exponential_vs_stationary_24light | 0.841000 | -0.0731 |
| Title | Cluster Plot | Dendrogram | e-value | e-value | e-value | Condition | Condition FDR | Condition Difference |
|---|---|---|---|---|---|---|---|---|
| Thaps_hclust_0414 |
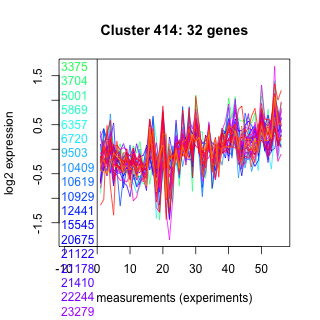 |
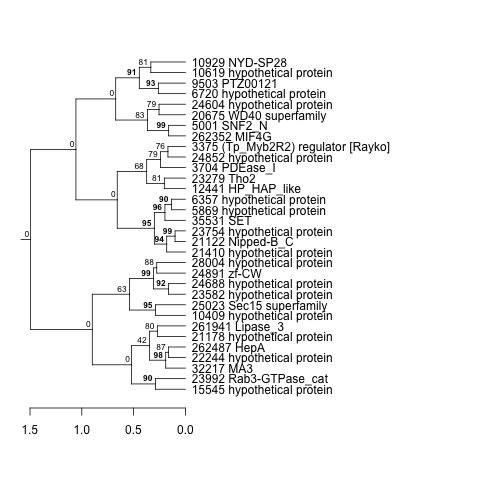 |
0.0000000000028 |
0.00000026 |
0.000019 |
lowN_TMEVA | 0.841000 | -0.0808 |
| Title | Cluster Plot | Dendrogram | e-value | e-value | e-value | Condition | Condition FDR | Condition Difference |
|---|---|---|---|---|---|---|---|---|
| Thaps_hclust_0365 |
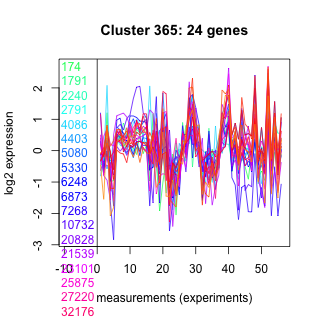 |
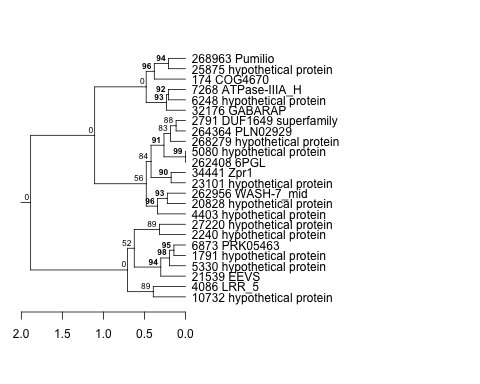 |
0.00082 |
0.0000019 |
2 |
BaP | 0.841000 | 0.0504 |
| Title | Cluster Plot | Dendrogram | e-value | e-value | e-value | Condition | Condition FDR | Condition Difference |
|---|---|---|---|---|---|---|---|---|
| Thaps_hclust_0294 |
 |
 |
0.0033 |
0.13 |
0.53 |
lowFe_KTKB_Day5 | 0.841000 | 0.0476 |
| Title | Cluster Plot | Dendrogram | e-value | e-value | e-value | Condition | Condition FDR | Condition Difference |
|---|---|---|---|---|---|---|---|---|
| Thaps_hclust_0127 |
 |
 |
2.6 |
32 |
48 |
lowN_TMEVA | 0.841000 | -0.0833 |
| Title | Cluster Plot | Dendrogram | e-value | e-value | e-value | Condition | Condition FDR | Condition Difference |
|---|---|---|---|---|---|---|---|---|
| Thaps_hclust_0353 |
 |
 |
0.076 |
1.5 |
0.87 |
diel_exponential_vs_stationary | 0.841000 | 0.0447 |
| Title | Cluster Plot | Dendrogram | e-value | e-value | e-value | Condition | Condition FDR | Condition Difference |
|---|---|---|---|---|---|---|---|---|
| Thaps_hclust_0030 |
 |
 |
0.000056 |
0.048 |
0.088 |
lowFe_KTKB_Day3 | 0.840000 | 0.0557 |
| Title | Cluster Plot | Dendrogram | e-value | e-value | e-value | Condition | Condition FDR | Condition Difference |
|---|---|---|---|---|---|---|---|---|
| Thaps_hclust_0438 |
 |
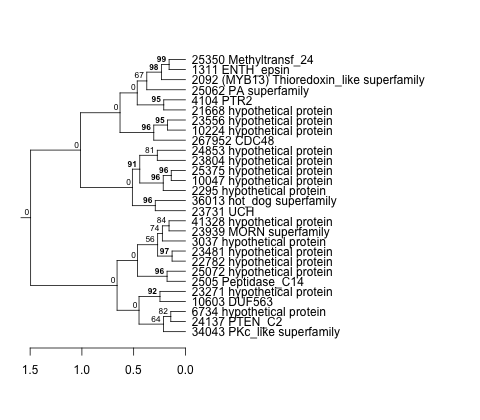 |
0.0024 |
1.5 |
3.6 |
lowFe_TMEVA | 0.840000 | -0.0782 |
| Title | Cluster Plot | Dendrogram | e-value | e-value | e-value | Condition | Condition FDR | Condition Difference |
|---|---|---|---|---|---|---|---|---|
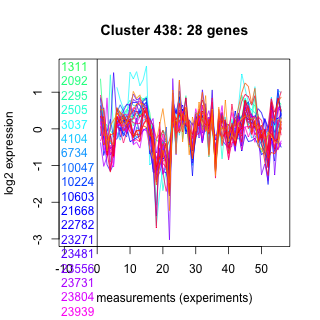
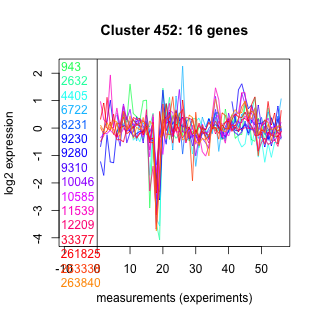
| Thaps_hclust_0452 |
 |
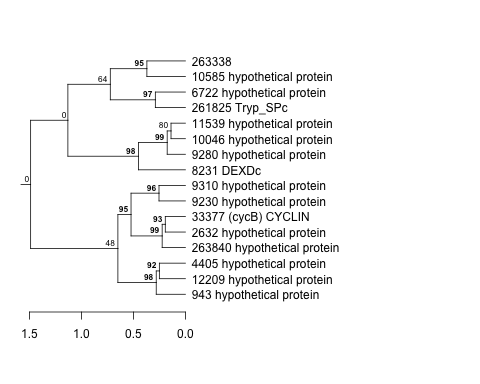 |
84 |
200 |
220 |
lowSi_TMEVA | 0.839000 | 0.228 |
| Title | Cluster Plot | Dendrogram | e-value | e-value | e-value | Condition | Condition FDR | Condition Difference |
|---|---|---|---|---|---|---|---|---|
| Thaps_hclust_0222 |
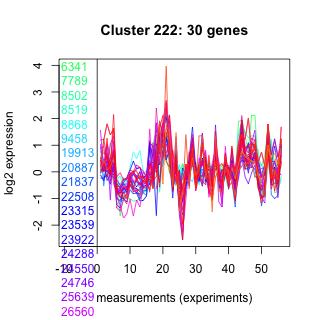 |
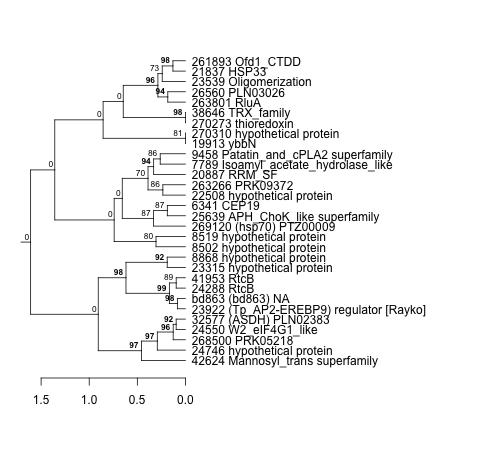 |
0.0000000000016 |
0.000000011 |
0.0008 |
lowSi_TMEVA | 0.839000 | 0.22 |
| Title | Cluster Plot | Dendrogram | e-value | e-value | e-value | Condition | Condition FDR | Condition Difference |
|---|---|---|---|---|---|---|---|---|
| Thaps_hclust_0219 |
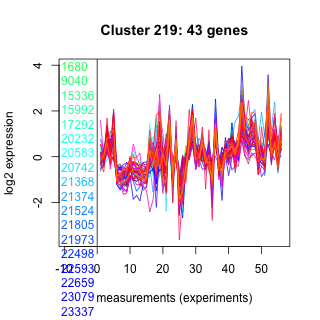 |
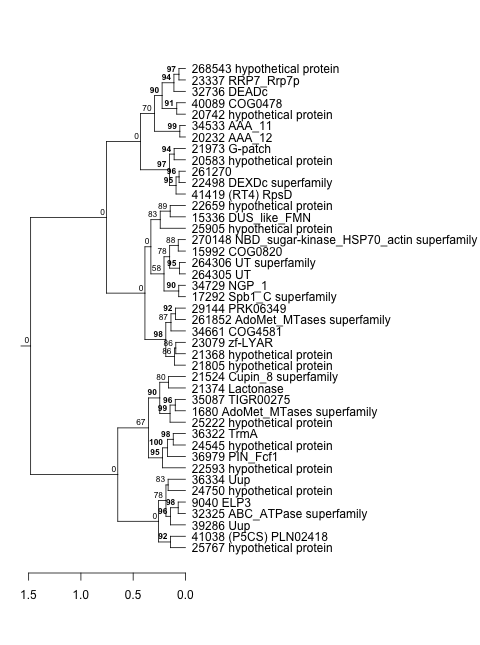 |
2.8e-16 |
0.0000000055 |
0.012 |
lowSi_TMEVA | 0.839000 | 0.218 |
| Title | Cluster Plot | Dendrogram | e-value | e-value | e-value | Condition | Condition FDR | Condition Difference |
|---|---|---|---|---|---|---|---|---|
| Thaps_hclust_0447 |
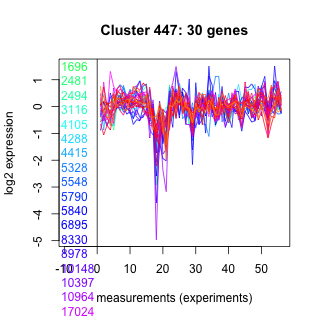 |
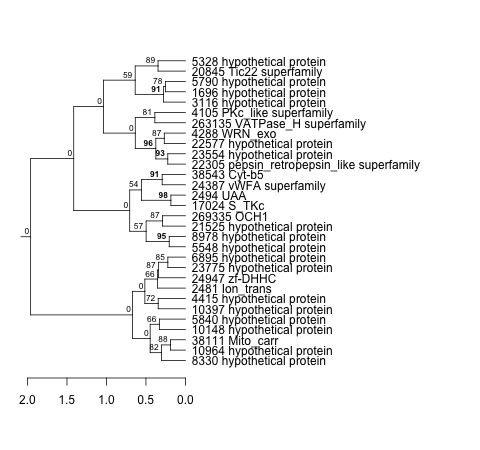 |
0.0005 |
0.0031 |
0.0041 |
lowSi_TMEVA | 0.839000 | -0.22 |
| Title | Cluster Plot | Dendrogram | e-value | e-value | e-value | Condition | Condition FDR | Condition Difference |
|---|---|---|---|---|---|---|---|---|
| Thaps_hclust_0397 |
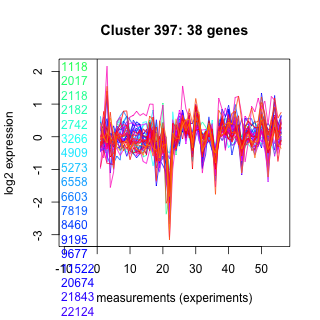 |
 |
0.00003 |
0.00016 |
0.0062 |
lowFe_KTKB_Day5 | 0.839000 | -0.0358 |
| Title | Cluster Plot | Dendrogram | e-value | e-value | e-value | Condition | Condition FDR | Condition Difference |
|---|---|---|---|---|---|---|---|---|
| Thaps_hclust_0337 |
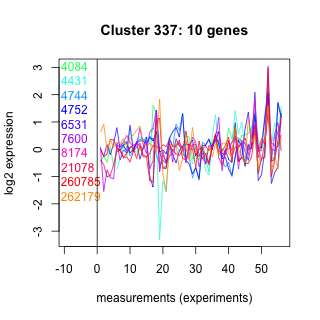 |
 |
3.5 |
3 |
280 |
lowSi_TMEVA | 0.839000 | -0.232 |
| Title | Cluster Plot | Dendrogram | e-value | e-value | e-value | Condition | Condition FDR | Condition Difference |
|---|---|---|---|---|---|---|---|---|
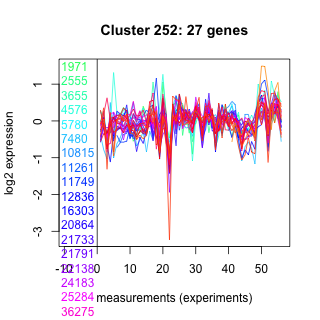
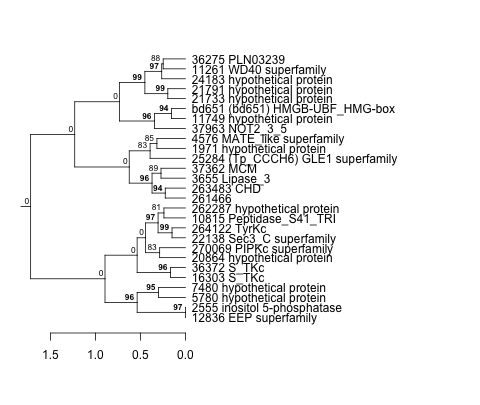
| Thaps_hclust_0252 |
 |
 |
0.000053 |
0.0057 |
2.1 |
lowFe_KTKB_Day5 | 0.839000 | 0.0428 |
| Title | Cluster Plot | Dendrogram | e-value | e-value | e-value | Condition | Condition FDR | Condition Difference |
|---|---|---|---|---|---|---|---|---|
| Thaps_hclust_0061 |
 |
 |
0.000000062 |
0.00063 |
0.032 |
lowSi_TMEVA | 0.838000 | -0.233 |
| Title | Cluster Plot | Dendrogram | e-value | e-value | e-value | Condition | Condition FDR | Condition Difference |
|---|---|---|---|---|---|---|---|---|
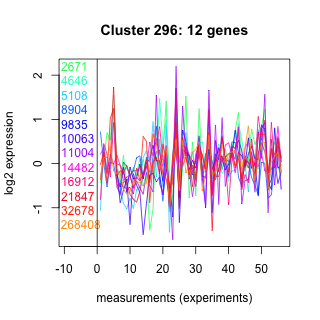
| Thaps_hclust_0296 |
 |
 |
0.17 |
1.8 |
0.83 |
lowSi_TMEVA | 0.838000 | 0.235 |
| Title | Cluster Plot | Dendrogram | e-value | e-value | e-value | Condition | Condition FDR | Condition Difference |
|---|---|---|---|---|---|---|---|---|
| Thaps_hclust_0470 |
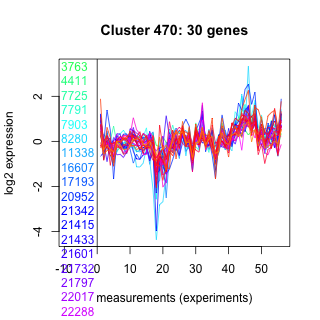 |
 |
0.0000048 |
0.00021 |
0.086 |
lowSi_TMEVA | 0.838000 | -0.227 |
| Title | Cluster Plot | Dendrogram | e-value | e-value | e-value | Condition | Condition FDR | Condition Difference |
|---|---|---|---|---|---|---|---|---|
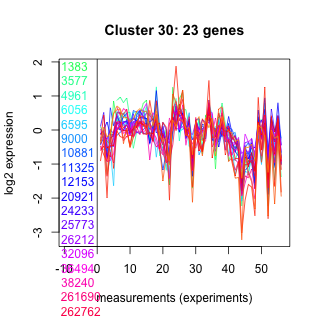
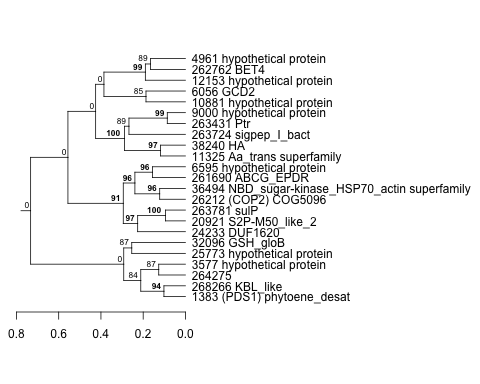
| Thaps_hclust_0029 |
 |
|
9.1e-19 |
4.9e-16 |
0.00000000044 |
co2_elevated_stat_arrays | 0.838000 | 0.07 |
| Title | Cluster Plot | Dendrogram | e-value | e-value | e-value | Condition | Condition FDR | Condition Difference |
|---|---|---|---|---|---|---|---|---|
| Thaps_hclust_0089 |
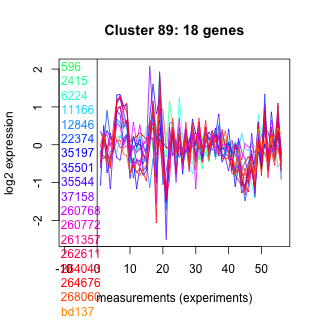 |
 |
0.000036 |
0.00054 |
0.075 |
lowSi_TMEVA | 0.838000 | -0.227 |
| Title | Cluster Plot | Dendrogram | e-value | e-value | e-value | Condition | Condition FDR | Condition Difference |
|---|---|---|---|---|---|---|---|---|
| Thaps_hclust_0099 |
 |
 |
0.0000000000000032 |
0.000000000000013 |
0.000000000000025 |
diel_exponential_vs_stationary | 0.837000 | 0.0789 |
| Title | Cluster Plot | Dendrogram | e-value | e-value | e-value | Condition | Condition FDR | Condition Difference |
|---|---|---|---|---|---|---|---|---|
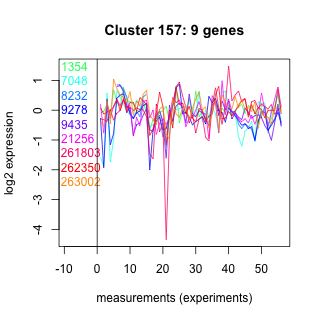
| Thaps_hclust_0157 |
 |
 |
2 |
4.6 |
4.9 |
exponential_vs_stationary_24light | 0.837000 | 0.113 |
| Title | Cluster Plot | Dendrogram | e-value | e-value | e-value | Condition | Condition FDR | Condition Difference |
|---|---|---|---|---|---|---|---|---|
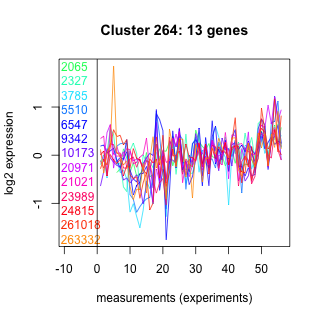
| Thaps_hclust_0264 |
 |
 |
0.0079 |
0.24 |
5.8 |
diel_exponential_vs_stationary | 0.837000 | 0.059 |
| Title | Cluster Plot | Dendrogram | e-value | e-value | e-value | Condition | Condition FDR | Condition Difference |
|---|---|---|---|---|---|---|---|---|
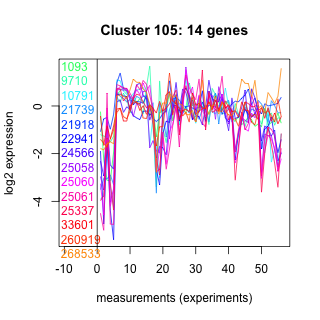
| Thaps_hclust_0105 |
 |
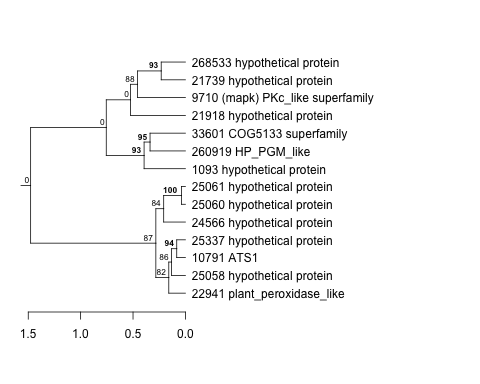 |
49 |
0.074 |
21 |
diel_light_vs_dark | 0.836000 | -0.0712 |
| Title | Cluster Plot | Dendrogram | e-value | e-value | e-value | Condition | Condition FDR | Condition Difference |
|---|---|---|---|---|---|---|---|---|
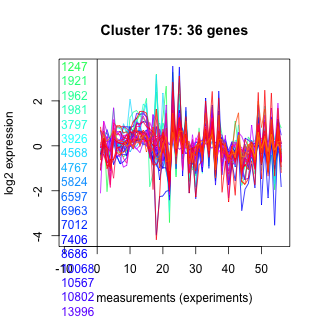
| Thaps_hclust_0175 |
 |
 |
0.00000000000027 |
0.0000042 |
0.58 |
lowFe_KTKB_Day3 | 0.836000 | 0.0463 |
| Title | Cluster Plot | Dendrogram | e-value | e-value | e-value | Condition | Condition FDR | Condition Difference |
|---|---|---|---|---|---|---|---|---|
| Thaps_hclust_0185 |
 |
 |
0.000039 |
1.8 |
5.8 |
highlight_arrays | 0.836000 | 0.0416 |
| Title | Cluster Plot | Dendrogram | e-value | e-value | e-value | Condition | Condition FDR | Condition Difference |
|---|---|---|---|---|---|---|---|---|
| Thaps_hclust_0380 |
 |
 |
1.1 |
5 |
8.7 |
BaP | 0.836000 | -0.0621 |
| Title | Cluster Plot | Dendrogram | e-value | e-value | e-value | Condition | Condition FDR | Condition Difference |
|---|---|---|---|---|---|---|---|---|
| Thaps_hclust_0348 |
 |
 |
8.7 |
34 |
60 |
lowFe_TMEVA | 0.836000 | -0.0996 |
| Title | Cluster Plot | Dendrogram | e-value | e-value | e-value | Condition | Condition FDR | Condition Difference |
|---|---|---|---|---|---|---|---|---|
| Thaps_hclust_0035 |
 |
 |
0.00023 |
0.0000098 |
0.064 |
co2_elevated_stat_arrays | 0.835000 | 0.0605 |
| Title | Cluster Plot | Dendrogram | e-value | e-value | e-value | Condition | Condition FDR | Condition Difference |
|---|---|---|---|---|---|---|---|---|
| Thaps_hclust_0046 |
 |
 |
0.00000051 |
0.000067 |
0.29 |
diel_light_vs_dark | 0.835000 | -0.0554 |
| Title | Cluster Plot | Dendrogram | e-value | e-value | e-value | Condition | Condition FDR | Condition Difference |
|---|---|---|---|---|---|---|---|---|
| Thaps_hclust_0104 |
 |
 |
23 |
24 |
220 |
co2_elevated_stat_arrays | 0.835000 | 0.0676 |
| Title | Cluster Plot | Dendrogram | e-value | e-value | e-value | Condition | Condition FDR | Condition Difference |
|---|---|---|---|---|---|---|---|---|
| Thaps_hclust_0331 |
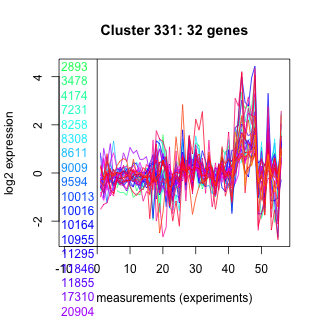 |
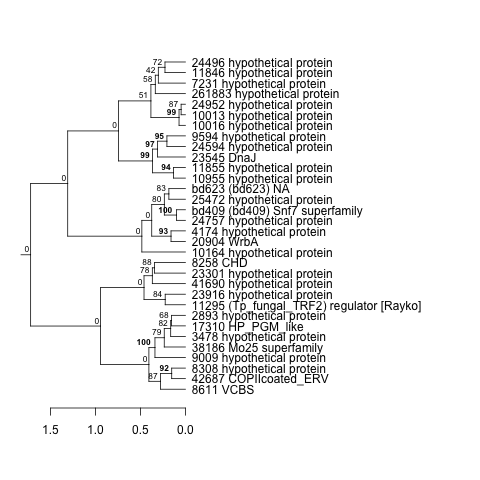 |
0.000000000011 |
20 |
1600 |
BaP | 0.835000 | -0.0438 |
| Title | Cluster Plot | Dendrogram | e-value | e-value | e-value | Condition | Condition FDR | Condition Difference |
|---|---|---|---|---|---|---|---|---|
| Thaps_hclust_0281 |
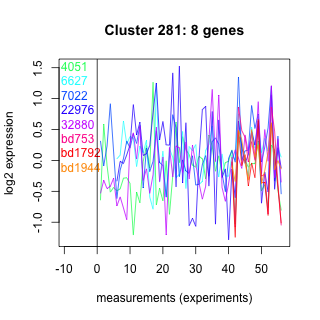 |
 |
0.0000064 |
0.00064 |
0.03 |
lowN_TMEVA | 0.835000 | -0.102 |
| Title | Cluster Plot | Dendrogram | e-value | e-value | e-value | Condition | Condition FDR | Condition Difference |
|---|---|---|---|---|---|---|---|---|
| Thaps_hclust_0149 |
 |
 |
0.00000027 |
0.46 |
3 |
highpH_TMEVA | 0.835000 | 0.0417 |
| Title | Cluster Plot | Dendrogram | e-value | e-value | e-value | Condition | Condition FDR | Condition Difference |
|---|---|---|---|---|---|---|---|---|
| Thaps_hclust_0298 |
 |
 |
0.035 |
0.58 |
41 |
lowFe_KTKB_Day3 | 0.834000 | 0.0822 |
| Thaps_hclust_0298 |
|
|
0.035 |
0.58 |
41 |
co2_elevated_expo_arrays | 0.833000 | -0.082 |
| Title | Cluster Plot | Dendrogram | e-value | e-value | e-value | Condition | Condition FDR | Condition Difference |
|---|---|---|---|---|---|---|---|---|
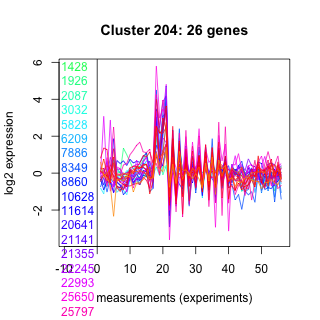
| Thaps_hclust_0204 |
 |
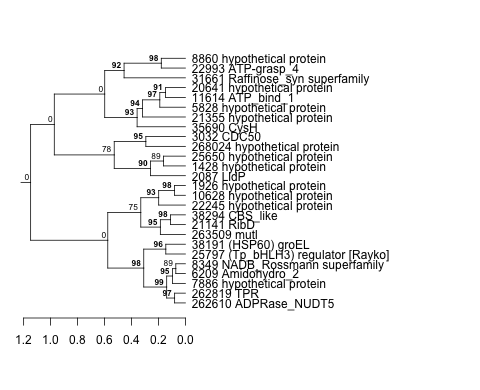 |
0.000065 |
0.008 |
0.00052 |
lowFe_KTKB_Day3 | 0.834000 | -0.054 |
| Title | Cluster Plot | Dendrogram | e-value | e-value | e-value | Condition | Condition FDR | Condition Difference |
|---|---|---|---|---|---|---|---|---|
| Thaps_hclust_0389 |
 |
 |
0.00000008 |
0.00077 |
340 |
lowFe_KTKB_Day3 | 0.834000 | 0.0578 |
| Title | Cluster Plot | Dendrogram | e-value | e-value | e-value | Condition | Condition FDR | Condition Difference |
|---|---|---|---|---|---|---|---|---|
| Thaps_hclust_0183 |
 |
 |
0.000026 |
0.000017 |
0.00004 |
co2_elevated_expo_arrays | 0.833000 | 0.0998 |
| Title | Cluster Plot | Dendrogram | e-value | e-value | e-value | Condition | Condition FDR | Condition Difference |
|---|---|---|---|---|---|---|---|---|
| Thaps_hclust_0306 |
 |
 |
0.001 |
0.26 |
5.3 |
co2_elevated_expo_arrays | 0.833000 | 0.0749 |
| Title | Cluster Plot | Dendrogram | e-value | e-value | e-value | Condition | Condition FDR | Condition Difference |
|---|---|---|---|---|---|---|---|---|
| Thaps_hclust_0347 |
 |
 |
1.2 |
0.85 |
91 |
highlight_arrays | 0.833000 | 0.0523 |
| Title | Cluster Plot | Dendrogram | e-value | e-value | e-value | Condition | Condition FDR | Condition Difference |
|---|---|---|---|---|---|---|---|---|
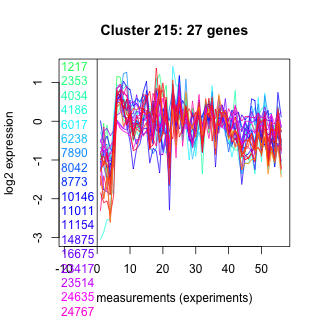
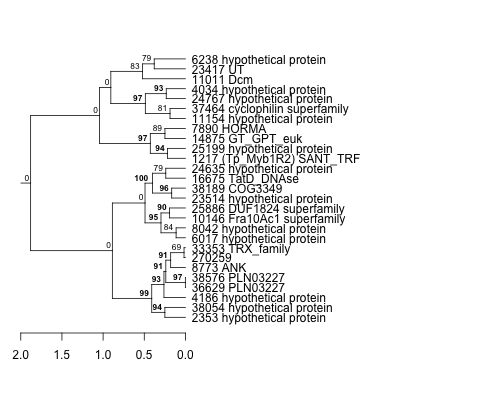
| Thaps_hclust_0215 |
 |
 |
0.000036 |
0.0000076 |
0.000057 |
co2_elevated_expo_arrays | 0.833000 | 0.0704 |
| Title | Cluster Plot | Dendrogram | e-value | e-value | e-value | Condition | Condition FDR | Condition Difference |
|---|---|---|---|---|---|---|---|---|
| Thaps_hclust_0445 |
 |
 |
0.000046 |
6.9 |
33 |
co2_elevated_expo_arrays | 0.833000 | -0.0737 |
| Thaps_hclust_0445 |
|
|
0.000046 |
6.9 |
33 |
lowSi_TMEVA | 0.832000 | -0.234 |
| Title | Cluster Plot | Dendrogram | e-value | e-value | e-value | Condition | Condition FDR | Condition Difference |
|---|---|---|---|---|---|---|---|---|
| Thaps_hclust_0016 |
 |
 |
0.000000000083 |
0.00000025 |
0.00000028 |
co2_elevated_expo_arrays | 0.833000 | 0.0695 |
| Title | Cluster Plot | Dendrogram | e-value | e-value | e-value | Condition | Condition FDR | Condition Difference |
|---|---|---|---|---|---|---|---|---|
| Thaps_hclust_0338 |
 |
 |
0.0000012 |
0.0000014 |
0.000012 |
co2_elevated_expo_arrays | 0.833000 | 0.0711 |
| Title | Cluster Plot | Dendrogram | e-value | e-value | e-value | Condition | Condition FDR | Condition Difference |
|---|---|---|---|---|---|---|---|---|
| Thaps_hclust_0428 |
 |
 |
0.000000076 |
0.015 |
1.9 |
exponential_vs_stationary_24light | 0.833000 | -0.0741 |
| Title | Cluster Plot | Dendrogram | e-value | e-value | e-value | Condition | Condition FDR | Condition Difference |
|---|---|---|---|---|---|---|---|---|
| Thaps_hclust_0250 |
 |
 |
0.38 |
88 |
290 |
co2_elevated_expo_arrays | 0.833000 | 0.0826 |
| Title | Cluster Plot | Dendrogram | e-value | e-value | e-value | Condition | Condition FDR | Condition Difference |
|---|---|---|---|---|---|---|---|---|
| Thaps_hclust_0430 |
 |
 |
0.0000088 |
0.0043 |
0.22 |
highlight_arrays | 0.833000 | 0.0359 |
| Title | Cluster Plot | Dendrogram | e-value | e-value | e-value | Condition | Condition FDR | Condition Difference |
|---|---|---|---|---|---|---|---|---|
| Thaps_hclust_0070 |
 |
 |
0.00015 |
0.0025 |
0.041 |
co2_elevated_expo_arrays | 0.833000 | 0.0704 |
| Title | Cluster Plot | Dendrogram | e-value | e-value | e-value | Condition | Condition FDR | Condition Difference |
|---|---|---|---|---|---|---|---|---|
| Thaps_hclust_0138 |
 |
 |
0.00000000000028 |
0.0000000011 |
0.0000065 |
co2_elevated_expo_arrays | 0.833000 | -0.0657 |
| Title | Cluster Plot | Dendrogram | e-value | e-value | e-value | Condition | Condition FDR | Condition Difference |
|---|---|---|---|---|---|---|---|---|
| Thaps_hclust_0190 |
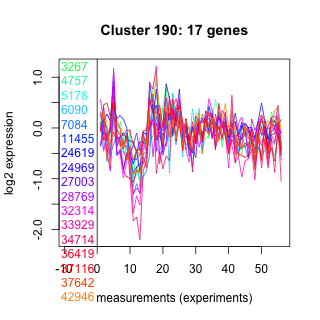 |
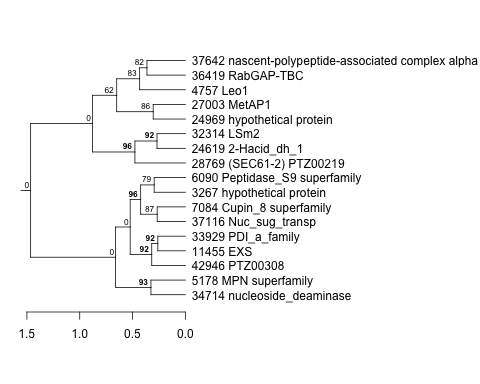 |
0.0000025 |
0.00027 |
0.93 |
co2_elevated_expo_arrays | 0.833000 | -0.0731 |
| Title | Cluster Plot | Dendrogram | e-value | e-value | e-value | Condition | Condition FDR | Condition Difference |
|---|---|---|---|---|---|---|---|---|
| Thaps_hclust_0225 |
 |
 |
0.00000024 |
0.000003 |
0.0048 |
co2_elevated_expo_arrays | 0.833000 | -0.0701 |
| Title | Cluster Plot | Dendrogram | e-value | e-value | e-value | Condition | Condition FDR | Condition Difference |
|---|---|---|---|---|---|---|---|---|
| Thaps_hclust_0136 |
 |
 |
0.0034 |
0.034 |
340 |
co2_elevated_expo_arrays | 0.833000 | -0.0685 |
| Title | Cluster Plot | Dendrogram | e-value | e-value | e-value | Condition | Condition FDR | Condition Difference |
|---|---|---|---|---|---|---|---|---|
| Thaps_hclust_0434 |
 |
 |
0.011 |
17 |
57 |
co2_elevated_expo_arrays | 0.833000 | 0.0856 |
| Title | Cluster Plot | Dendrogram | e-value | e-value | e-value | Condition | Condition FDR | Condition Difference |
|---|---|---|---|---|---|---|---|---|
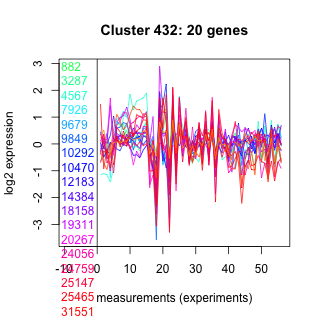
| Thaps_hclust_0432 |
 |
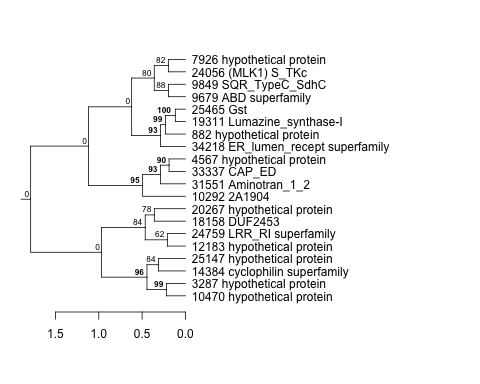 |
0.011 |
0.06 |
2.4 |
lowSi_TMEVA | 0.832000 | -0.23 |
| Title | Cluster Plot | Dendrogram | e-value | e-value | e-value | Condition | Condition FDR | Condition Difference |
|---|---|---|---|---|---|---|---|---|
| Thaps_hclust_0019 |
 |
 |
0.0000001 |
0.00000017 |
0.000037 |
lowSi_TMEVA | 0.832000 | -0.227 |
| Title | Cluster Plot | Dendrogram | e-value | e-value | e-value | Condition | Condition FDR | Condition Difference |
|---|---|---|---|---|---|---|---|---|
| Thaps_hclust_0062 |
 |
 |
0.000000026 |
0.000000021 |
0.000000000021 |
exponential_vs_stationary_24highlight | 0.832000 | 0.047 |
| Title | Cluster Plot | Dendrogram | e-value | e-value | e-value | Condition | Condition FDR | Condition Difference |
|---|---|---|---|---|---|---|---|---|
| Thaps_hclust_0342 |
 |
 |
5.79997e-41 |
2.7e-33 |
3.1e-31 |
lowSi_TMEVA | 0.832000 | -0.226 |
| Title | Cluster Plot | Dendrogram | e-value | e-value | e-value | Condition | Condition FDR | Condition Difference |
|---|---|---|---|---|---|---|---|---|
| Thaps_hclust_0036 |
 |
 |
0.0000003 |
0.00016 |
110 |
lowSi_TMEVA | 0.832000 | 0.227 |
| Title | Cluster Plot | Dendrogram | e-value | e-value | e-value | Condition | Condition FDR | Condition Difference |
|---|---|---|---|---|---|---|---|---|
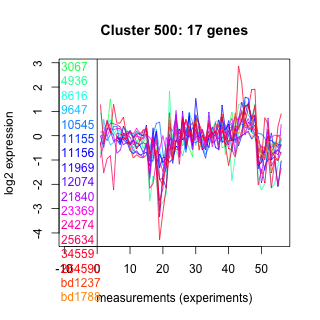
| Thaps_hclust_0500 |
 |
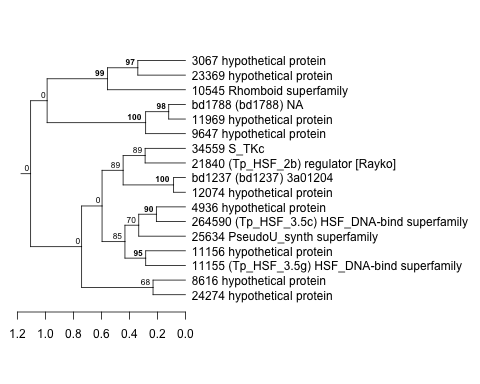 |
0.91 |
14 |
30 |
lowSi_TMEVA | 0.832000 | 0.235 |
| Title | Cluster Plot | Dendrogram | e-value | e-value | e-value | Condition | Condition FDR | Condition Difference |
|---|---|---|---|---|---|---|---|---|
| Thaps_hclust_0335 |
 |
 |
0.0000000032 |
0.000001 |
0.019 |
lowSi_TMEVA | 0.832000 | -0.227 |