Hierarchical Clusters
Displaying 901 - 1000 of 7500
| Title | Cluster Plot | Dendrogram | e-value | e-value | e-value | Condition | Condition FDR | Condition Difference |
|---|---|---|---|---|---|---|---|---|
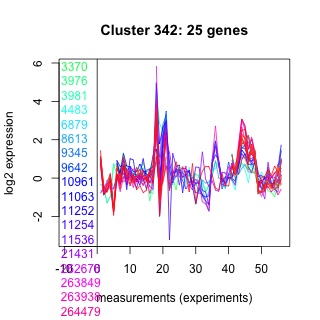
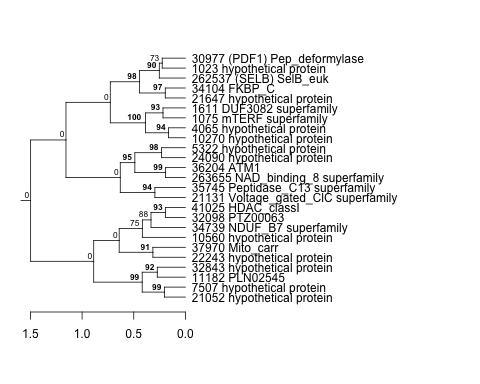
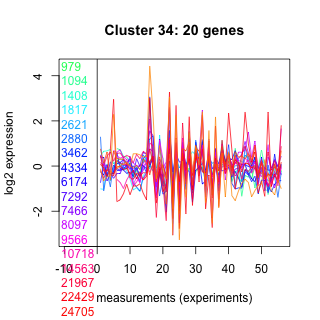
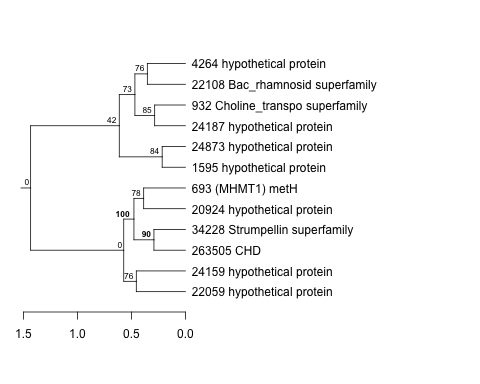
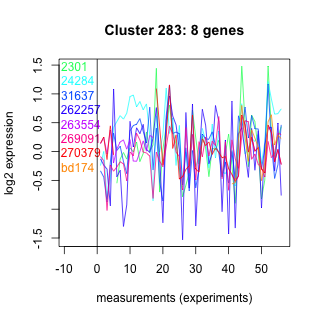
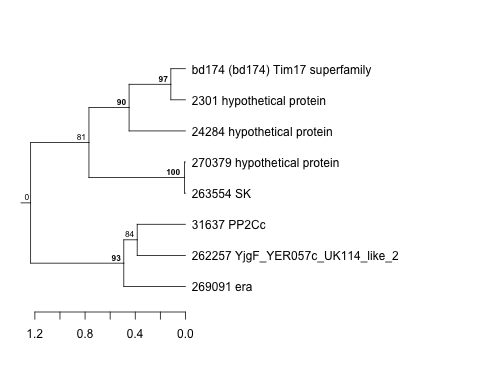
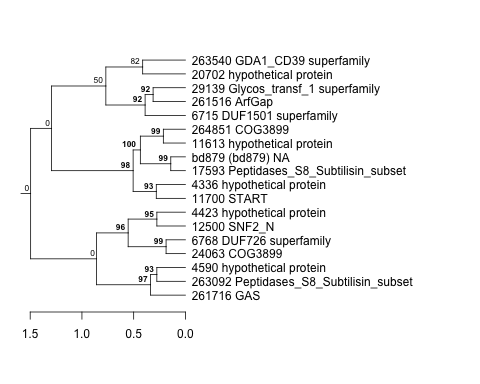
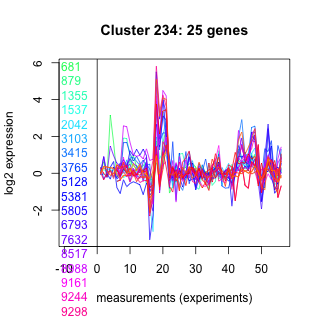
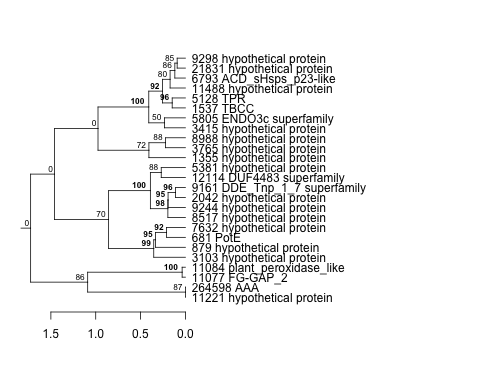
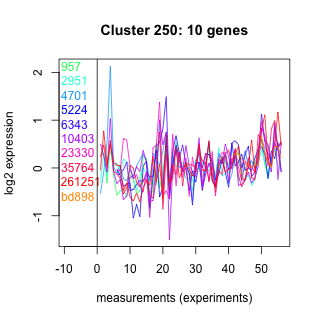
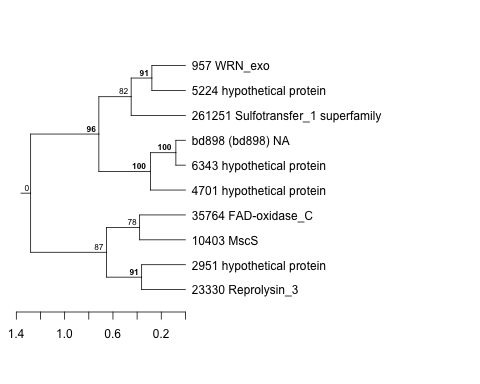
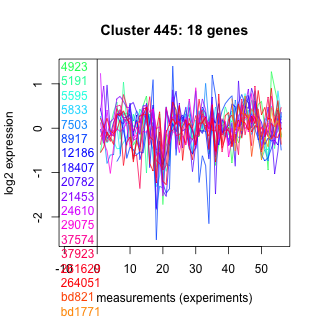
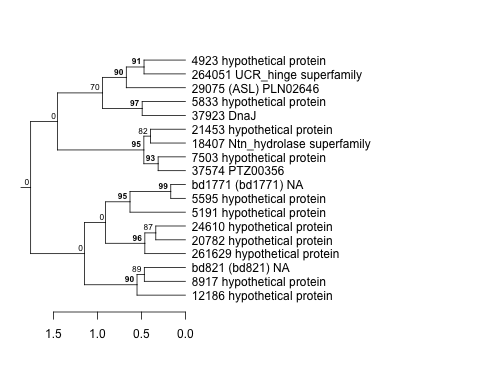
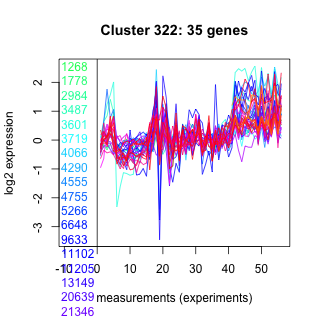
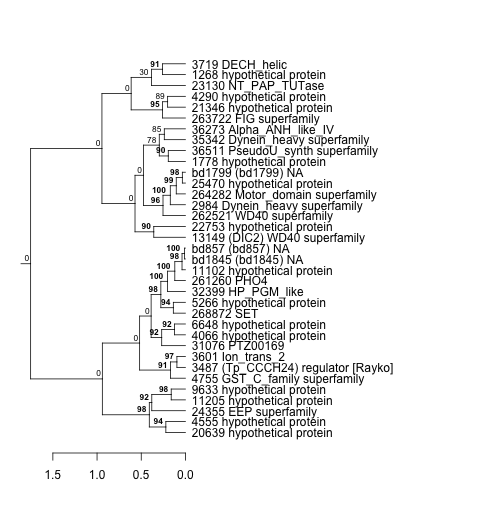
| Thaps_hclust_0342 |
 |
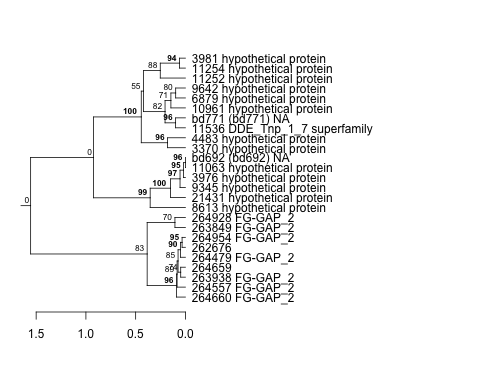 |
5.79997e-41 |
2.7e-33 |
3.1e-31 |
lowFe_KTKB_Day3 | 0.909000 | -0.0352 |
| Thaps_hclust_0342 |
|
|
5.79997e-41 |
2.7e-33 |
3.1e-31 |
diel_light_vs_dark | 0.902000 | 0.0393 |
| Title | Cluster Plot | Dendrogram | e-value | e-value | e-value | Condition | Condition FDR | Condition Difference |
|---|---|---|---|---|---|---|---|---|
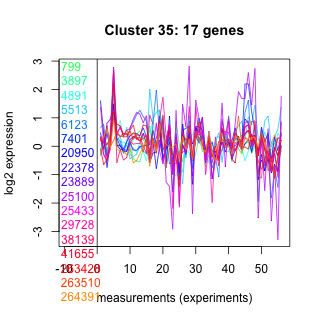
| Thaps_hclust_0035 |
 |
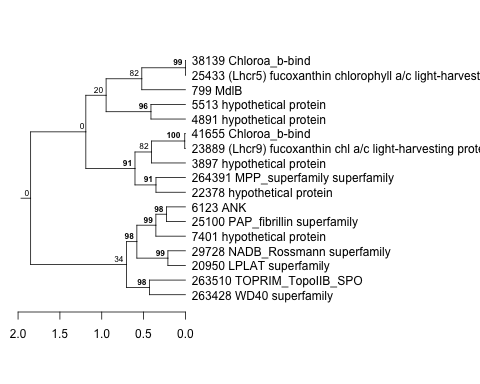 |
0.00023 |
0.0000098 |
0.064 |
lowFe_KTKB_Day3 | 0.909000 | 0.0419 |
| Title | Cluster Plot | Dendrogram | e-value | e-value | e-value | Condition | Condition FDR | Condition Difference |
|---|---|---|---|---|---|---|---|---|
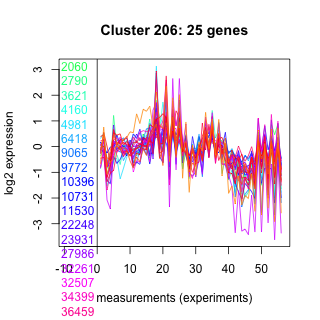
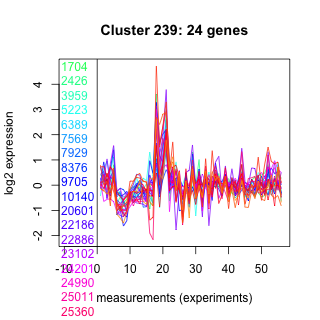
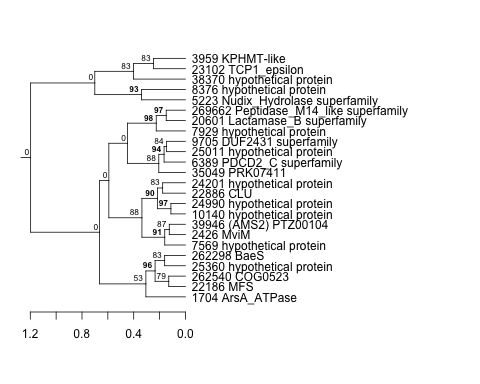
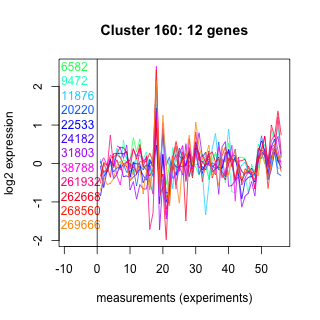
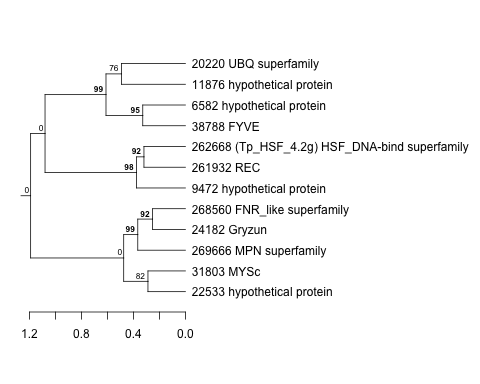
| Thaps_hclust_0206 |
 |
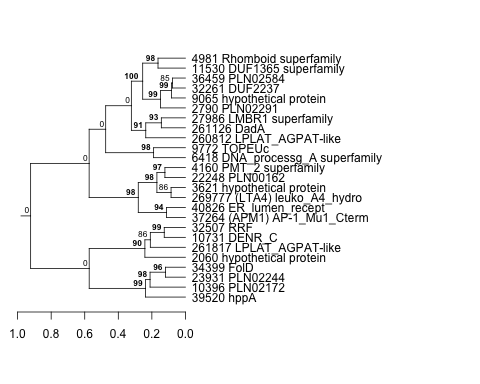 |
0.00000000000075 |
0.0000028 |
3.5 |
lowtemp_TMEVA | 0.909000 | 0.0348 |
| Title | Cluster Plot | Dendrogram | e-value | e-value | e-value | Condition | Condition FDR | Condition Difference |
|---|---|---|---|---|---|---|---|---|
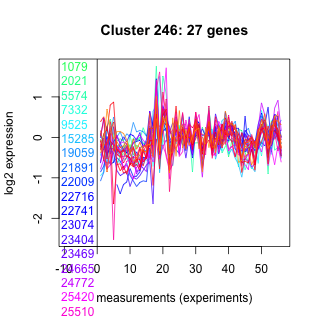
| Thaps_hclust_0246 |
 |
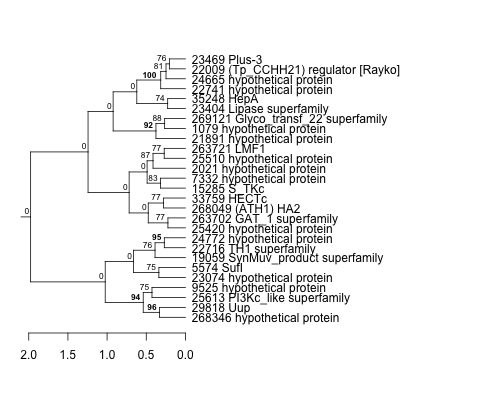 |
0.0000088 |
0.0034 |
3.7 |
lowFe_KTKB_Day3 | 0.909000 | -0.0338 |
| Thaps_hclust_0246 |
|
|
0.0000088 |
0.0034 |
3.7 |
exponential_vs_stationary_24light | 0.900000 | 0.0423 |
| Title | Cluster Plot | Dendrogram | e-value | e-value | e-value | Condition | Condition FDR | Condition Difference |
|---|---|---|---|---|---|---|---|---|
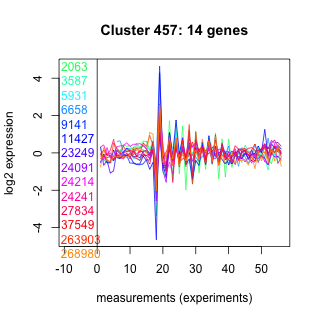
| Thaps_hclust_0457 |
 |
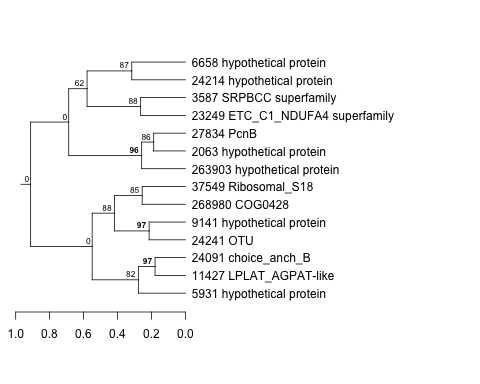 |
0.0000081 |
0.1 |
0.53 |
lowFe_KTKB_Day3 | 0.909000 | -0.0478 |
| Title | Cluster Plot | Dendrogram | e-value | e-value | e-value | Condition | Condition FDR | Condition Difference |
|---|---|---|---|---|---|---|---|---|
| Thaps_hclust_0103 |
 |
 |
3.4 |
4.8 |
21 |
lowFe_KTKB_Day5 | 0.908000 | -0.0322 |
| Title | Cluster Plot | Dendrogram | e-value | e-value | e-value | Condition | Condition FDR | Condition Difference |
|---|---|---|---|---|---|---|---|---|
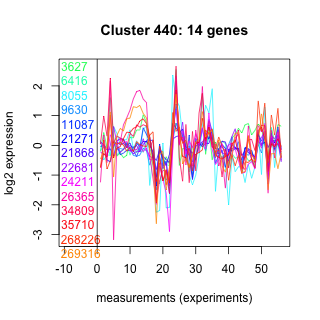
| Thaps_hclust_0440 |
 |
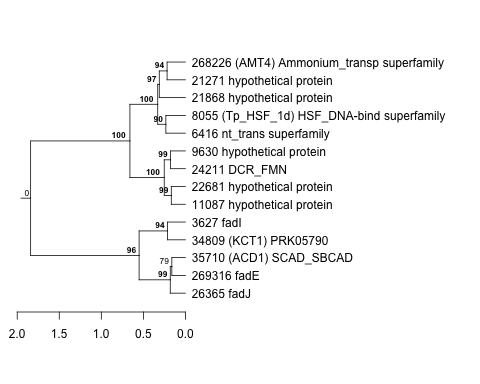 |
0.68 |
4.6 |
250 |
lowFe_TMEVA | 0.908000 | 0.051 |
| Title | Cluster Plot | Dendrogram | e-value | e-value | e-value | Condition | Condition FDR | Condition Difference |
|---|---|---|---|---|---|---|---|---|
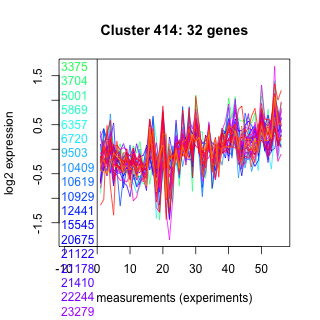
| Thaps_hclust_0414 |
 |
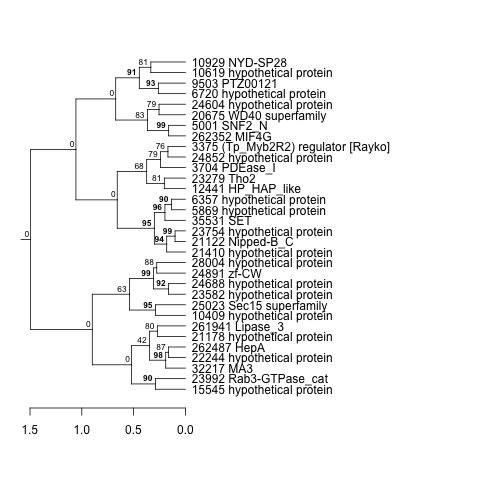 |
0.0000000000028 |
0.00000026 |
0.000019 |
lowFe_KTKB_Day5 | 0.908000 | -0.0228 |
| Title | Cluster Plot | Dendrogram | e-value | e-value | e-value | Condition | Condition FDR | Condition Difference |
|---|---|---|---|---|---|---|---|---|
| Thaps_hclust_0028 |
 |
|
1.6e-27 |
6.8e-18 |
0.0000000000000078 |
lowFe_KTKB_Day5 | 0.908000 | 0.0157 |
| Title | Cluster Plot | Dendrogram | e-value | e-value | e-value | Condition | Condition FDR | Condition Difference |
|---|---|---|---|---|---|---|---|---|
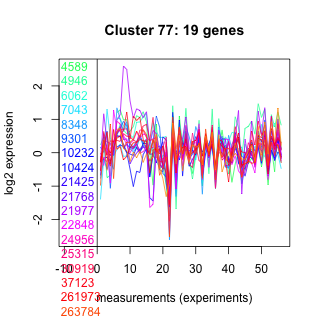
| Thaps_hclust_0077 |
 |
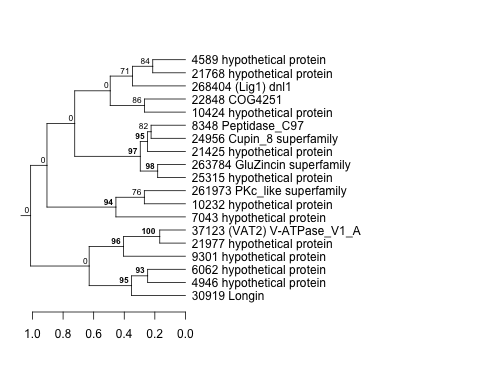 |
0.00014 |
0.91 |
2.2 |
lowFe_KTKB_Day5 | 0.908000 | 0.0291 |
| Title | Cluster Plot | Dendrogram | e-value | e-value | e-value | Condition | Condition FDR | Condition Difference |
|---|---|---|---|---|---|---|---|---|
| Thaps_hclust_0413 |
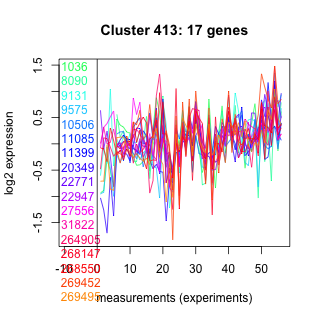 |
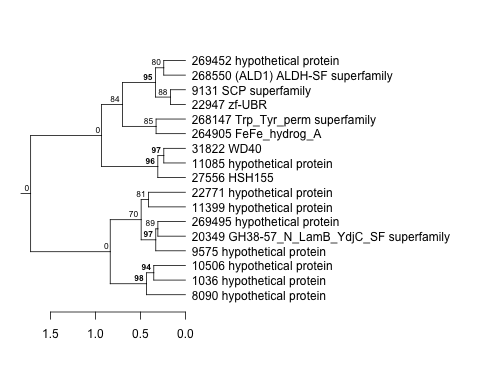 |
0.000043 |
0.0057 |
0.67 |
BaP | 0.908000 | 0.0375 |
| Title | Cluster Plot | Dendrogram | e-value | e-value | e-value | Condition | Condition FDR | Condition Difference |
|---|---|---|---|---|---|---|---|---|
| Thaps_hclust_0435 |
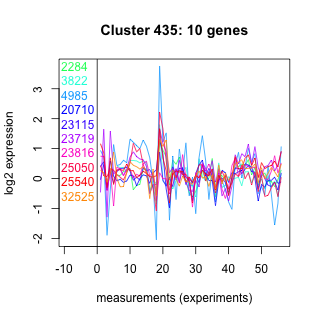 |
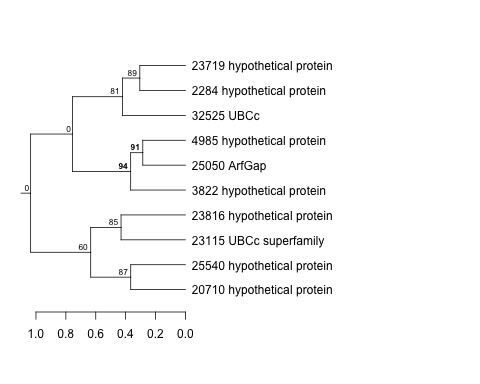 |
0.17 |
0.24 |
1.5 |
co2_elevated_expo_arrays | 0.908000 | 0.0596 |
| Title | Cluster Plot | Dendrogram | e-value | e-value | e-value | Condition | Condition FDR | Condition Difference |
|---|---|---|---|---|---|---|---|---|
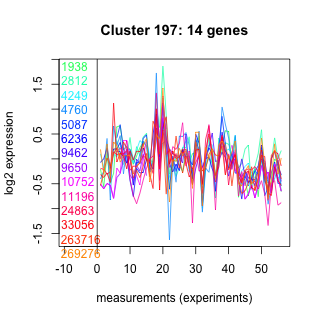
| Thaps_hclust_0197 |
 |
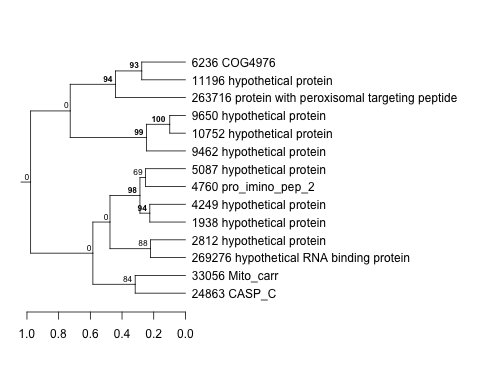 |
0.12 |
0.3 |
0.65 |
lowFe_KTKB_Day5 | 0.908000 | -0.0323 |
| Title | Cluster Plot | Dendrogram | e-value | e-value | e-value | Condition | Condition FDR | Condition Difference |
|---|---|---|---|---|---|---|---|---|
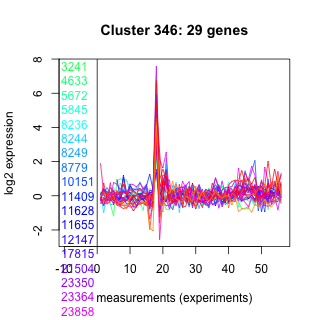
| Thaps_hclust_0346 |
 |
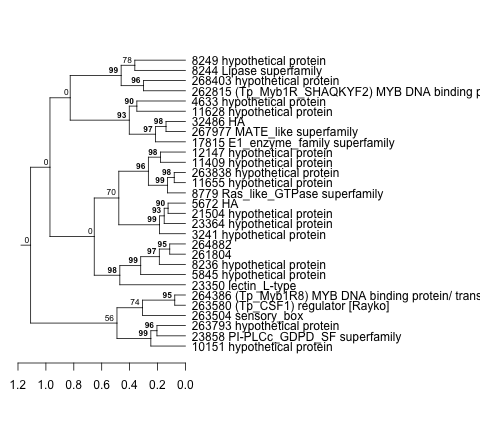 |
0.00053 |
4.7 |
80 |
diel_light_vs_dark | 0.906000 | 0.033 |
| Title | Cluster Plot | Dendrogram | e-value | e-value | e-value | Condition | Condition FDR | Condition Difference |
|---|---|---|---|---|---|---|---|---|
| Thaps_hclust_0139 |
 |
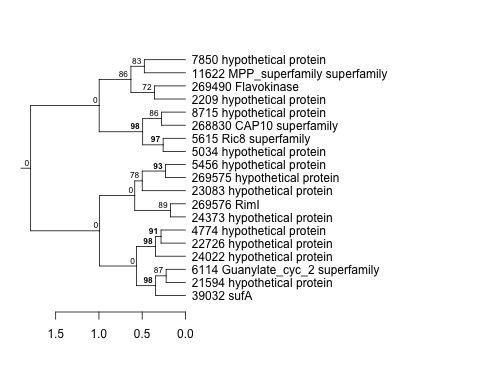 |
0.00014 |
0.00066 |
3 |
exponential_vs_stationary_24light | 0.906000 | -0.0431 |
| Title | Cluster Plot | Dendrogram | e-value | e-value | e-value | Condition | Condition FDR | Condition Difference |
|---|---|---|---|---|---|---|---|---|
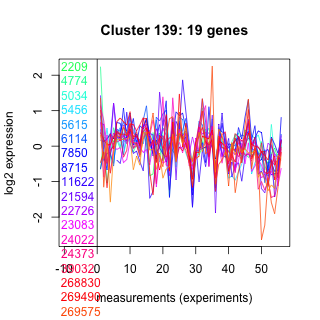
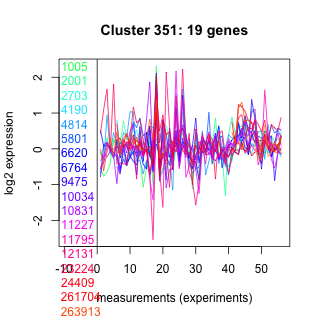
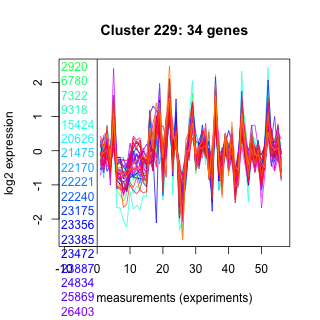
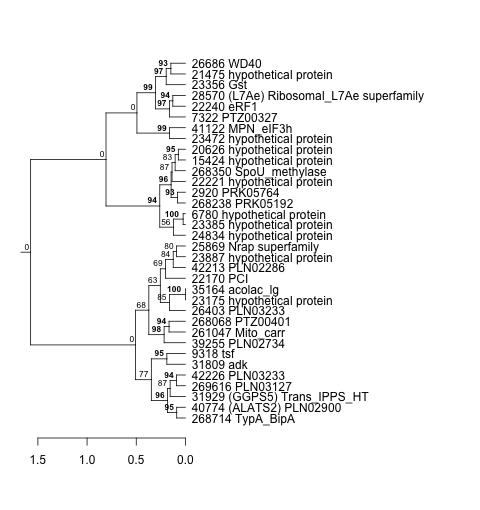
| Thaps_hclust_0351 |
 |
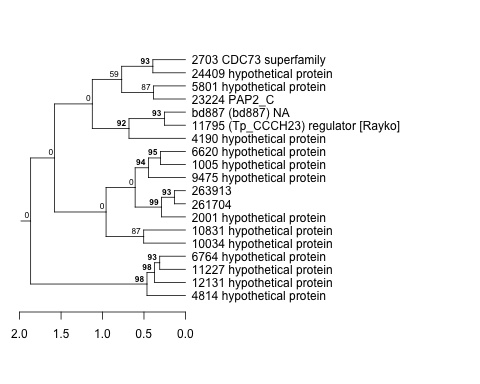 |
0.033 |
0.06 |
50 |
exponential_vs_stationary_24light | 0.906000 | 0.0436 |
| Title | Cluster Plot | Dendrogram | e-value | e-value | e-value | Condition | Condition FDR | Condition Difference |
|---|---|---|---|---|---|---|---|---|
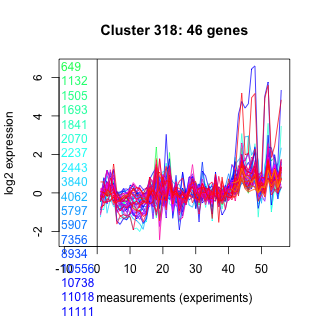
| Thaps_hclust_0318 |
 |
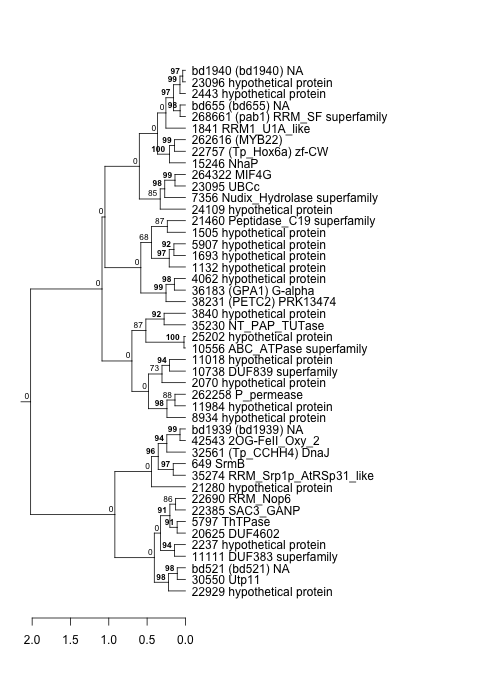 |
1.1e-17 |
0.000000015 |
0.0000081 |
lowFe_KTKB_Day5 | 0.906000 | -0.0193 |
| Thaps_hclust_0318 |
|
|
1.1e-17 |
0.000000015 |
0.0000081 |
diel_exponential_vs_stationary | 0.896000 | -0.0219 |
| Title | Cluster Plot | Dendrogram | e-value | e-value | e-value | Condition | Condition FDR | Condition Difference |
|---|---|---|---|---|---|---|---|---|
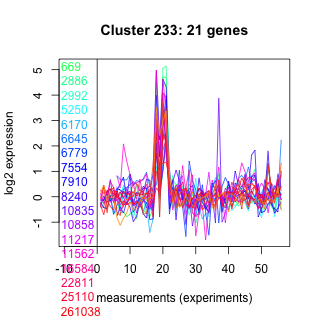
| Thaps_hclust_0233 |
 |
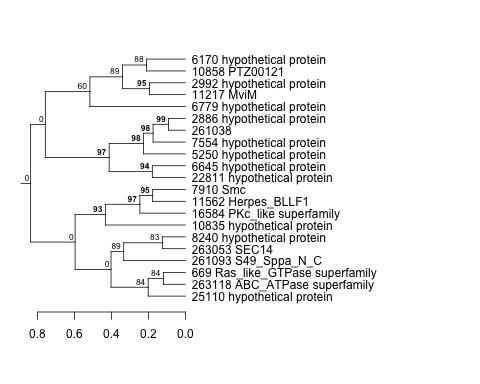 |
0.01 |
0.026 |
25 |
exponential_vs_stationary_24light | 0.905000 | -0.0443 |
| Title | Cluster Plot | Dendrogram | e-value | e-value | e-value | Condition | Condition FDR | Condition Difference |
|---|---|---|---|---|---|---|---|---|
| Thaps_hclust_0163 |
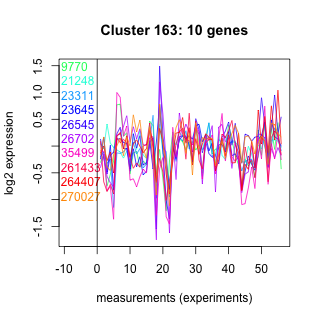 |
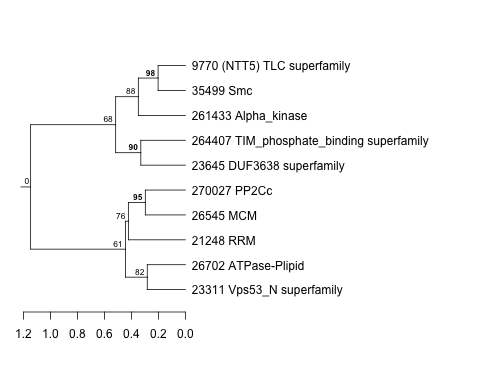 |
2.5 |
63 |
210 |
co2_elevated_expo_arrays | 0.904000 | 0.0604 |
| Thaps_hclust_0163 |
|
|
2.5 |
63 |
210 |
lowFe_KTKB_Day5 | 0.902000 | 0.0405 |
| Title | Cluster Plot | Dendrogram | e-value | e-value | e-value | Condition | Condition FDR | Condition Difference |
|---|---|---|---|---|---|---|---|---|
| Thaps_hclust_0444 |
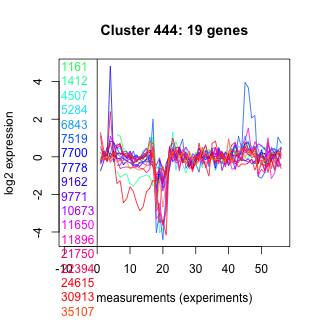 |
 |
14 |
140 |
1.6 |
lowFe_TMEVA | 0.904000 | 0.0495 |
| Title | Cluster Plot | Dendrogram | e-value | e-value | e-value | Condition | Condition FDR | Condition Difference |
|---|---|---|---|---|---|---|---|---|
| Thaps_hclust_0458 |
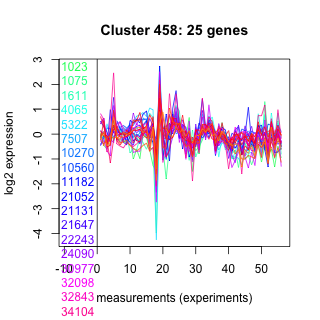 |
 |
0.0000000041 |
0.000000022 |
0.0024 |
highpH_TMEVA | 0.904000 | 0.0263 |
| Title | Cluster Plot | Dendrogram | e-value | e-value | e-value | Condition | Condition FDR | Condition Difference |
|---|---|---|---|---|---|---|---|---|
| Thaps_hclust_0034 |
 |
 |
0.000015 |
0.000083 |
0.63 |
co2_elevated_expo_arrays | 0.903000 | -0.0539 |
| Title | Cluster Plot | Dendrogram | e-value | e-value | e-value | Condition | Condition FDR | Condition Difference |
|---|---|---|---|---|---|---|---|---|
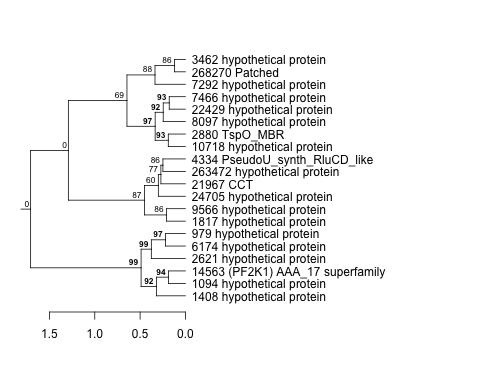
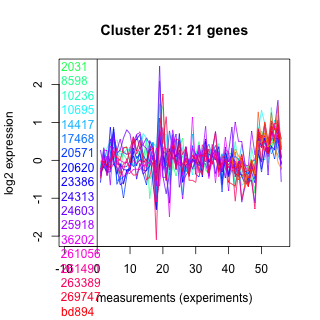
| Thaps_hclust_0251 |
 |
 |
0.027 |
0.025 |
9.3 |
co2_elevated_expo_arrays | 0.903000 | 0.0539 |
| Title | Cluster Plot | Dendrogram | e-value | e-value | e-value | Condition | Condition FDR | Condition Difference |
|---|---|---|---|---|---|---|---|---|
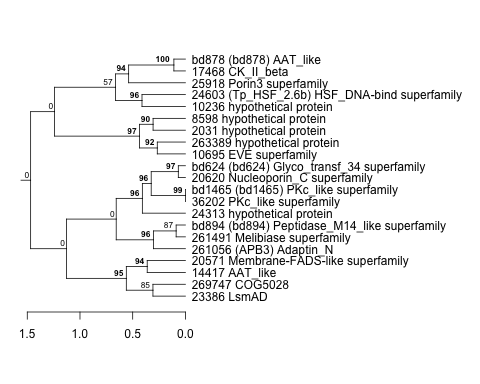
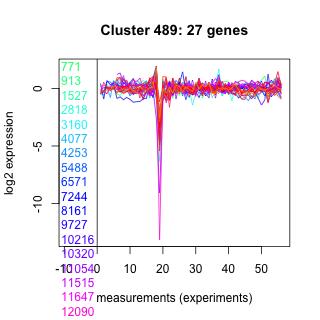
| Thaps_hclust_0489 |
 |
 |
0.00024 |
0.0048 |
0.027 |
lowFe_KTKB_Day3 | 0.903000 | -0.0353 |
| Thaps_hclust_0489 |
|
|
0.00024 |
0.0048 |
0.027 |
diel_exponential_vs_stationary | 0.896000 | -0.0268 |
| Title | Cluster Plot | Dendrogram | e-value | e-value | e-value | Condition | Condition FDR | Condition Difference |
|---|---|---|---|---|---|---|---|---|
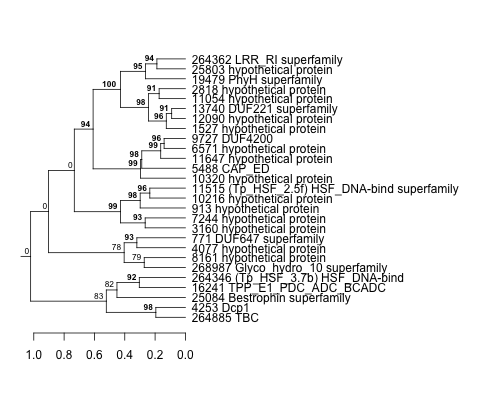
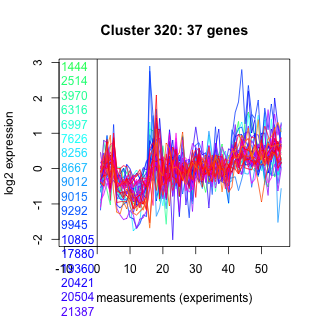
| Thaps_hclust_0320 |
 |
 |
0.0000055 |
0.32 |
8.8 |
co2_elevated_expo_arrays | 0.903000 | -0.0511 |
| Title | Cluster Plot | Dendrogram | e-value | e-value | e-value | Condition | Condition FDR | Condition Difference |
|---|---|---|---|---|---|---|---|---|
| Thaps_hclust_0045 |
 |
 |
0.0000000028 |
0.0075 |
5.4 |
co2_elevated_expo_arrays | 0.903000 | -0.0556 |
| Title | Cluster Plot | Dendrogram | e-value | e-value | e-value | Condition | Condition FDR | Condition Difference |
|---|---|---|---|---|---|---|---|---|
| Thaps_hclust_0404 |
 |
 |
0.007 |
0.025 |
0.049 |
co2_elevated_expo_arrays | 0.903000 | -0.0546 |
| Title | Cluster Plot | Dendrogram | e-value | e-value | e-value | Condition | Condition FDR | Condition Difference |
|---|---|---|---|---|---|---|---|---|
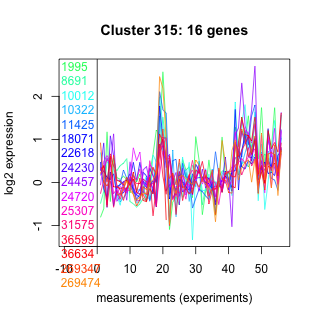
| Thaps_hclust_0315 |
 |
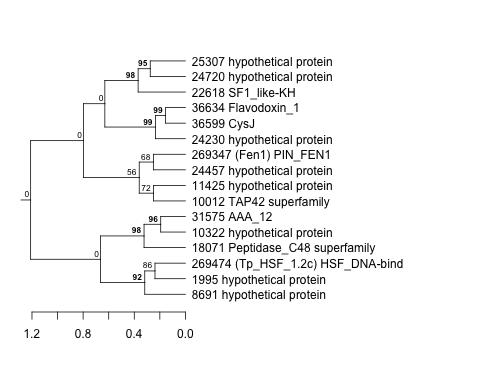 |
0.01 |
0.93 |
0.53 |
co2_elevated_expo_arrays | 0.903000 | 0.0558 |
| Title | Cluster Plot | Dendrogram | e-value | e-value | e-value | Condition | Condition FDR | Condition Difference |
|---|---|---|---|---|---|---|---|---|
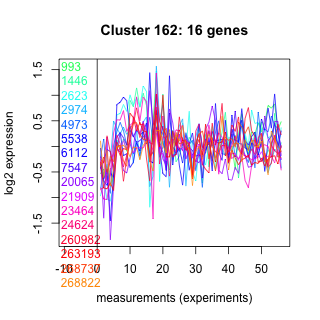
| Thaps_hclust_0162 |
 |
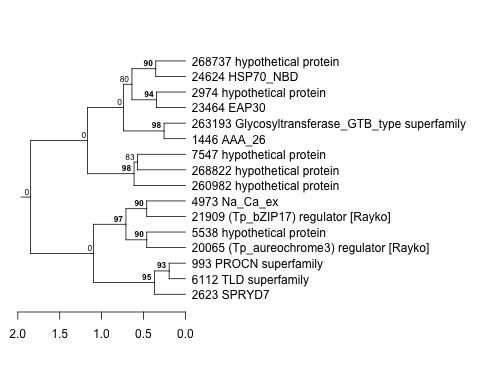 |
0.032 |
3.2 |
58 |
lowFe_KTKB_Day3 | 0.903000 | -0.0453 |
| Thaps_hclust_0162 |
|
|
0.032 |
3.2 |
58 |
exponential_vs_stationary_24light | 0.902000 | -0.0501 |
| Title | Cluster Plot | Dendrogram | e-value | e-value | e-value | Condition | Condition FDR | Condition Difference |
|---|---|---|---|---|---|---|---|---|
| Thaps_hclust_0492 |
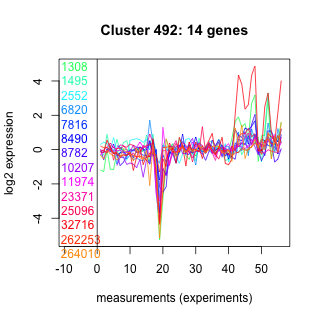 |
 |
0.29 |
0.47 |
23 |
diel_exponential_vs_stationary | 0.903000 | 0.0332 |
| Title | Cluster Plot | Dendrogram | e-value | e-value | e-value | Condition | Condition FDR | Condition Difference |
|---|---|---|---|---|---|---|---|---|
| Thaps_hclust_0186 |
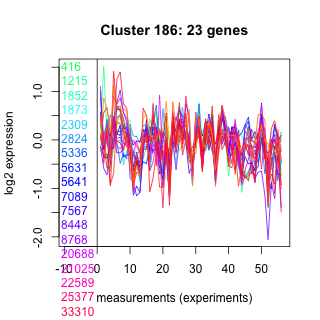 |
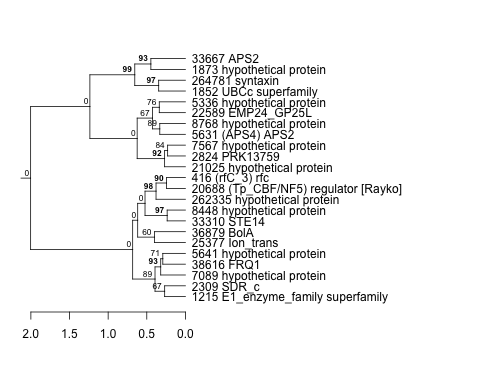 |
0.0000000043 |
0.006 |
0.0000084 |
co2_elevated_expo_arrays | 0.903000 | -0.0542 |
| Title | Cluster Plot | Dendrogram | e-value | e-value | e-value | Condition | Condition FDR | Condition Difference |
|---|---|---|---|---|---|---|---|---|
| Thaps_hclust_0255 |
 |
 |
1.4e-28 |
0.0000000000000024 |
0.000000029 |
co2_elevated_expo_arrays | 0.903000 | 0.0569 |
| Title | Cluster Plot | Dendrogram | e-value | e-value | e-value | Condition | Condition FDR | Condition Difference |
|---|---|---|---|---|---|---|---|---|
| Thaps_hclust_0378 |
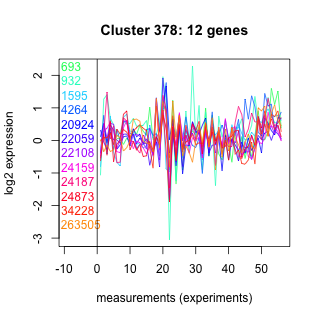 |
 |
0.0003 |
210 |
10 |
co2_elevated_expo_arrays | 0.903000 | 0.0599 |
| Title | Cluster Plot | Dendrogram | e-value | e-value | e-value | Condition | Condition FDR | Condition Difference |
|---|---|---|---|---|---|---|---|---|
| Thaps_hclust_0086 |
 |
 |
0.0000000068 |
0.01 |
0.0037 |
lowFe_KTKB_Day3 | 0.903000 | -0.0347 |
| Title | Cluster Plot | Dendrogram | e-value | e-value | e-value | Condition | Condition FDR | Condition Difference |
|---|---|---|---|---|---|---|---|---|
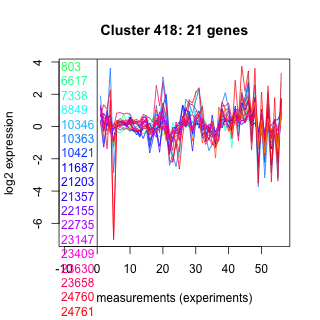
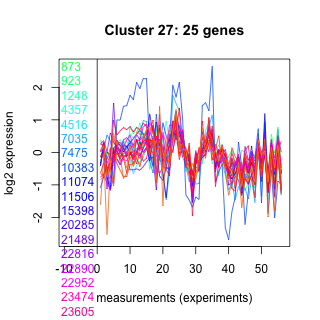
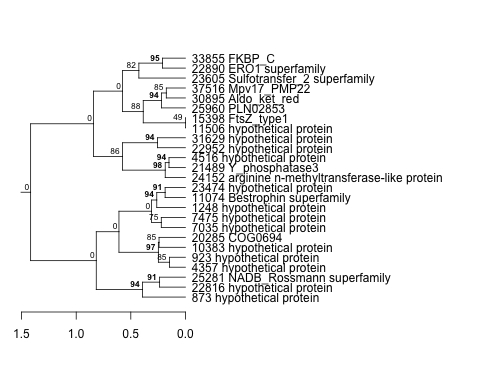
| Thaps_hclust_0418 |
 |
 |
0.00074 |
0.0098 |
0.29 |
diel_light_vs_dark | 0.902000 | -0.0398 |
| Title | Cluster Plot | Dendrogram | e-value | e-value | e-value | Condition | Condition FDR | Condition Difference |
|---|---|---|---|---|---|---|---|---|
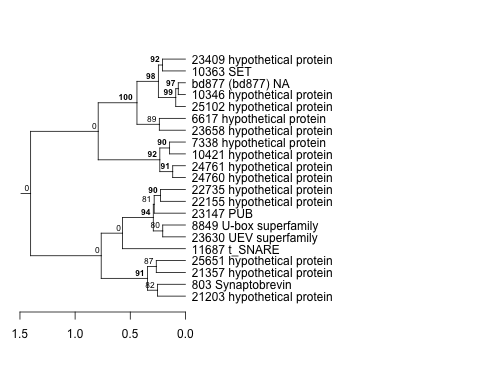
| Thaps_hclust_0118 |
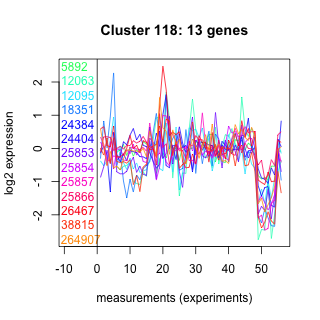 |
 |
0.0037 |
1.2 |
1.4 |
diel_light_vs_dark | 0.902000 | -0.049 |
| Title | Cluster Plot | Dendrogram | e-value | e-value | e-value | Condition | Condition FDR | Condition Difference |
|---|---|---|---|---|---|---|---|---|
| Thaps_hclust_0056 |
 |
 |
0.0000000078 |
0.077 |
1 |
exponential_vs_stationary_24light | 0.902000 | -0.0455 |
| Title | Cluster Plot | Dendrogram | e-value | e-value | e-value | Condition | Condition FDR | Condition Difference |
|---|---|---|---|---|---|---|---|---|
| Thaps_hclust_0283 |
 |
 |
0.0022 |
0.0079 |
0.019 |
lowFe_TMEVA | 0.902000 | -0.0574 |
| Title | Cluster Plot | Dendrogram | e-value | e-value | e-value | Condition | Condition FDR | Condition Difference |
|---|---|---|---|---|---|---|---|---|
| Thaps_hclust_0380 |
 |
 |
1.1 |
5 |
8.7 |
lowFe_KTKB_Day5 | 0.902000 | 0.034 |
| Title | Cluster Plot | Dendrogram | e-value | e-value | e-value | Condition | Condition FDR | Condition Difference |
|---|---|---|---|---|---|---|---|---|
| Thaps_hclust_0013 |
 |
 |
0.000000021 |
0.00018 |
0.025 |
diel_light_vs_dark | 0.902000 | 0.0326 |
| Title | Cluster Plot | Dendrogram | e-value | e-value | e-value | Condition | Condition FDR | Condition Difference |
|---|---|---|---|---|---|---|---|---|
| Thaps_hclust_0476 |
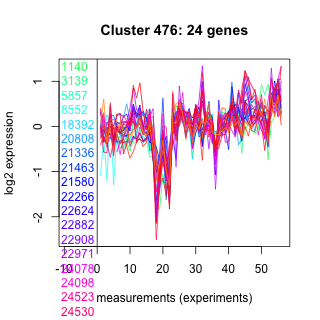 |
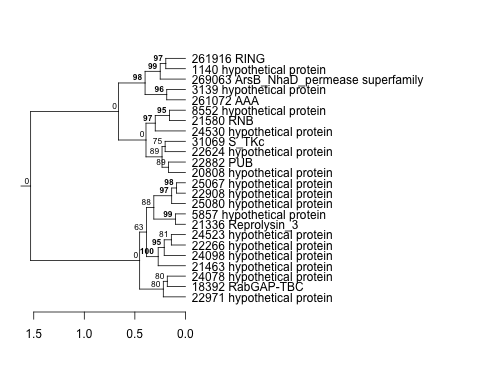 |
0.0015 |
0.56 |
2.4 |
exponential_vs_stationary_24light | 0.902000 | 0.0402 |
| Title | Cluster Plot | Dendrogram | e-value | e-value | e-value | Condition | Condition FDR | Condition Difference |
|---|---|---|---|---|---|---|---|---|
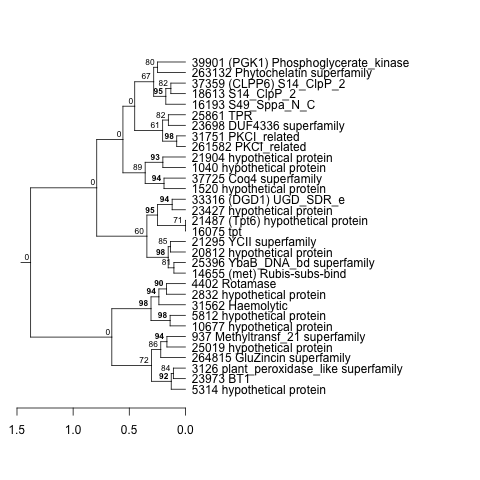
| Thaps_hclust_0151 |
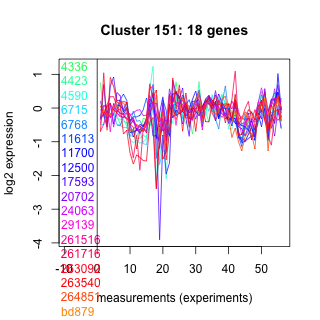 |
 |
0.015 |
0.13 |
16 |
lowtemp_TMEVA | 0.902000 | 0.041 |
| Title | Cluster Plot | Dendrogram | e-value | e-value | e-value | Condition | Condition FDR | Condition Difference |
|---|---|---|---|---|---|---|---|---|
| Thaps_hclust_0161 |
 |
 |
1.8 |
13 |
18 |
lowFe_KTKB_Day5 | 0.902000 | 0.0433 |
| Title | Cluster Plot | Dendrogram | e-value | e-value | e-value | Condition | Condition FDR | Condition Difference |
|---|---|---|---|---|---|---|---|---|
| Thaps_hclust_0352 |
 |
 |
8.7 |
78 |
79 |
diel_light_vs_dark | 0.902000 | 0.049 |
| Title | Cluster Plot | Dendrogram | e-value | e-value | e-value | Condition | Condition FDR | Condition Difference |
|---|---|---|---|---|---|---|---|---|
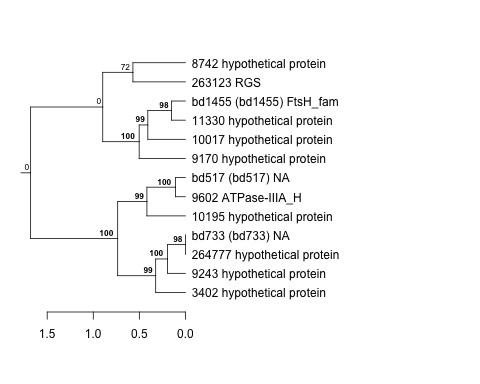
| Thaps_hclust_0192 |
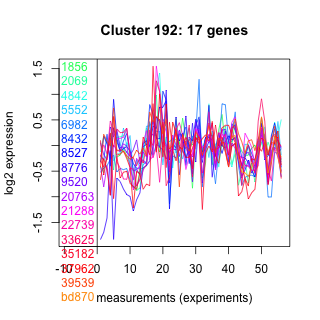 |
 |
0.000012 |
0.017 |
1.3 |
diel_light_vs_dark | 0.902000 | 0.0445 |
| Thaps_hclust_0192 |
|
|
0.000012 |
0.017 |
1.3 |
exponential_vs_stationary_24light | 0.900000 | 0.0518 |
| Title | Cluster Plot | Dendrogram | e-value | e-value | e-value | Condition | Condition FDR | Condition Difference |
|---|---|---|---|---|---|---|---|---|
| Thaps_hclust_0478 |
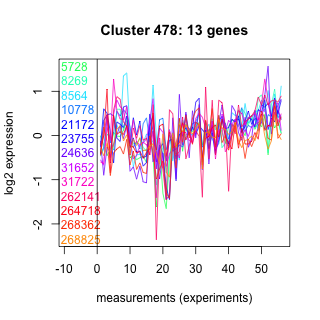 |
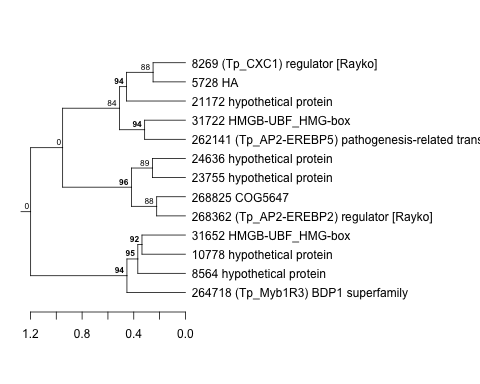 |
0.1 |
0.0096 |
3.5 |
exponential_vs_stationary_24highlight | 0.902000 | -0.0201 |
| Title | Cluster Plot | Dendrogram | e-value | e-value | e-value | Condition | Condition FDR | Condition Difference |
|---|---|---|---|---|---|---|---|---|
| Thaps_hclust_0096 |
 |
 |
0.0000028 |
0.9 |
0.38 |
exponential_vs_stationary_24light | 0.902000 | 0.0404 |
| Title | Cluster Plot | Dendrogram | e-value | e-value | e-value | Condition | Condition FDR | Condition Difference |
|---|---|---|---|---|---|---|---|---|
| Thaps_hclust_0267 |
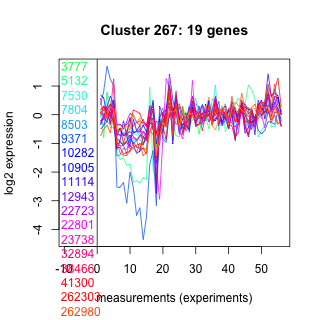 |
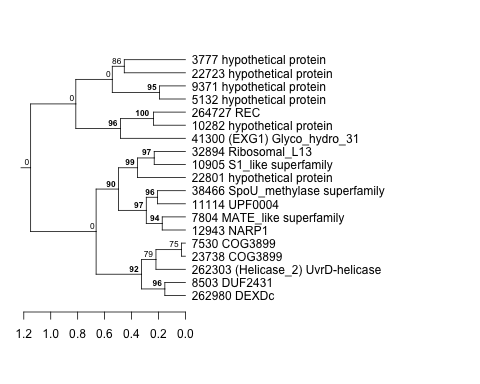 |
0.00000003 |
0.39 |
0.58 |
highpH_TMEVA | 0.901000 | -0.0307 |
| Title | Cluster Plot | Dendrogram | e-value | e-value | e-value | Condition | Condition FDR | Condition Difference |
|---|---|---|---|---|---|---|---|---|
| Thaps_hclust_0382 |
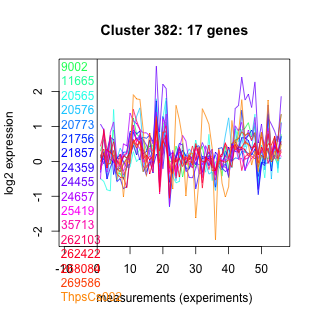 |
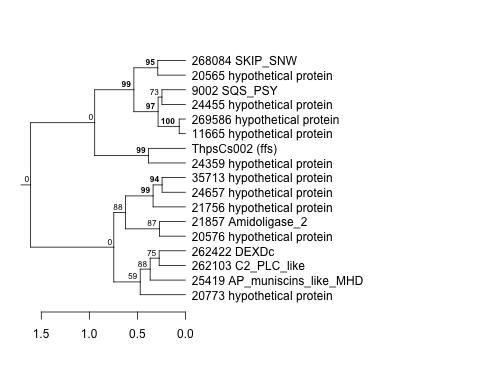 |
0.0000042 |
0.012 |
0.055 |
highpH_TMEVA | 0.901000 | 0.0312 |
| Title | Cluster Plot | Dendrogram | e-value | e-value | e-value | Condition | Condition FDR | Condition Difference |
|---|---|---|---|---|---|---|---|---|
| Thaps_hclust_0460 |
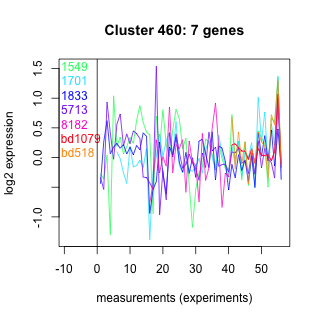 |
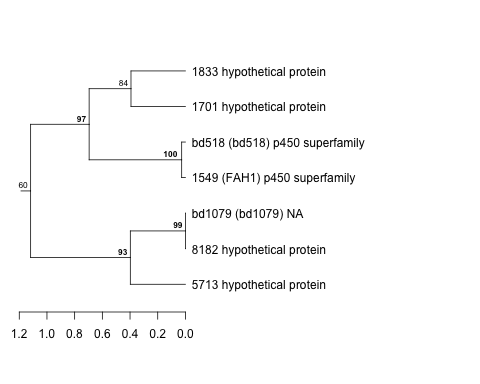 |
0.0073 |
0.0055 |
0.63 |
BaP | 0.901000 | 0.0554 |
| Title | Cluster Plot | Dendrogram | e-value | e-value | e-value | Condition | Condition FDR | Condition Difference |
|---|---|---|---|---|---|---|---|---|
| Thaps_hclust_0236 |
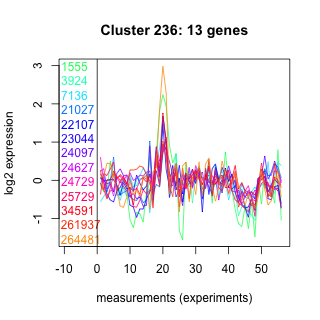 |
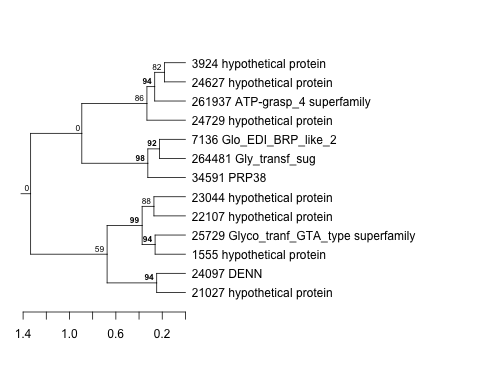 |
0.0078 |
3.3 |
1.1 |
exponential_vs_stationary_24light | 0.900000 | 0.0578 |
| Title | Cluster Plot | Dendrogram | e-value | e-value | e-value | Condition | Condition FDR | Condition Difference |
|---|---|---|---|---|---|---|---|---|
| Thaps_hclust_0111 |
 |
 |
0.00032 |
0.0074 |
0.8 |
exponential_vs_stationary_24light | 0.900000 | -0.0521 |
| Title | Cluster Plot | Dendrogram | e-value | e-value | e-value | Condition | Condition FDR | Condition Difference |
|---|---|---|---|---|---|---|---|---|
| Thaps_hclust_0321 |
 |
 |
0.000000086 |
0.0000000042 |
0.0000028 |
exponential_vs_stationary_24light | 0.900000 | -0.0432 |
| Title | Cluster Plot | Dendrogram | e-value | e-value | e-value | Condition | Condition FDR | Condition Difference |
|---|---|---|---|---|---|---|---|---|
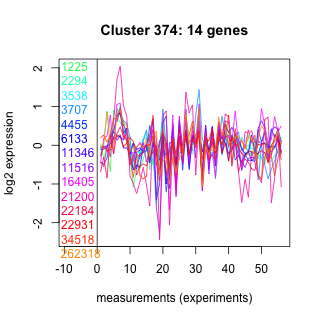
| Thaps_hclust_0374 |
 |
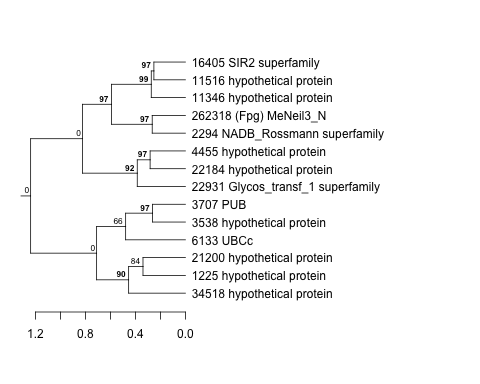 |
1.4 |
19 |
50 |
exponential_vs_stationary_24light | 0.900000 | 0.0564 |
| Title | Cluster Plot | Dendrogram | e-value | e-value | e-value | Condition | Condition FDR | Condition Difference |
|---|---|---|---|---|---|---|---|---|
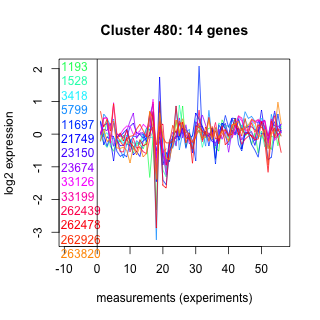
| Thaps_hclust_0480 |
 |
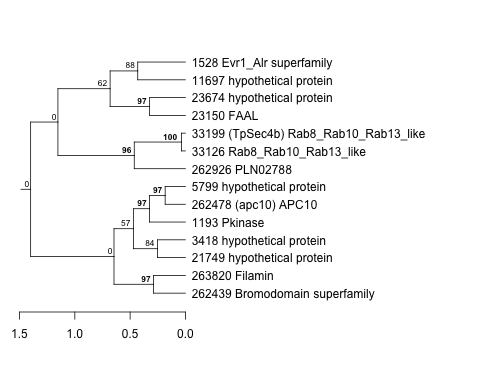 |
0.18 |
1.3 |
44 |
exponential_vs_stationary_24light | 0.900000 | 0.0573 |
| Title | Cluster Plot | Dendrogram | e-value | e-value | e-value | Condition | Condition FDR | Condition Difference |
|---|---|---|---|---|---|---|---|---|
| Thaps_hclust_0338 |
 |
 |
0.0000012 |
0.0000014 |
0.000012 |
exponential_vs_stationary_24light | 0.900000 | -0.0425 |
| Title | Cluster Plot | Dendrogram | e-value | e-value | e-value | Condition | Condition FDR | Condition Difference |
|---|---|---|---|---|---|---|---|---|
| Thaps_hclust_0229 |
 |
 |
9.9e-18 |
0.000000000000034 |
0.0000002 |
exponential_vs_stationary_24light | 0.900000 | 0.0438 |
| Title | Cluster Plot | Dendrogram | e-value | e-value | e-value | Condition | Condition FDR | Condition Difference |
|---|---|---|---|---|---|---|---|---|
| Thaps_hclust_0350 |
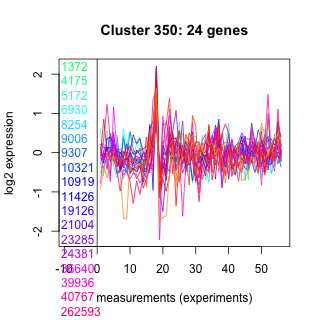 |
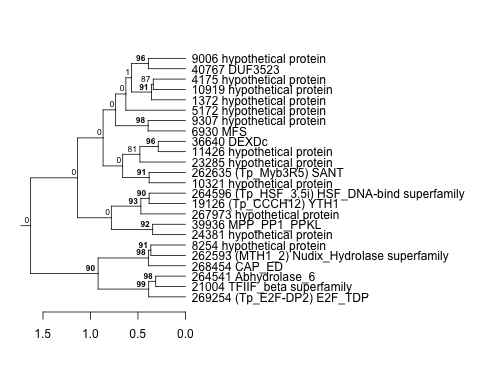 |
0.00016 |
0.13 |
7.1 |
exponential_vs_stationary_24light | 0.900000 | 0.0433 |
| Title | Cluster Plot | Dendrogram | e-value | e-value | e-value | Condition | Condition FDR | Condition Difference |
|---|---|---|---|---|---|---|---|---|
| Thaps_hclust_0136 |
 |
 |
0.0034 |
0.034 |
340 |
exponential_vs_stationary_24light | 0.900000 | -0.0484 |
| Title | Cluster Plot | Dendrogram | e-value | e-value | e-value | Condition | Condition FDR | Condition Difference |
|---|---|---|---|---|---|---|---|---|
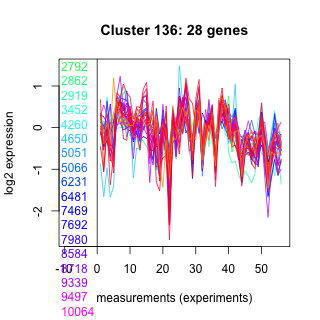
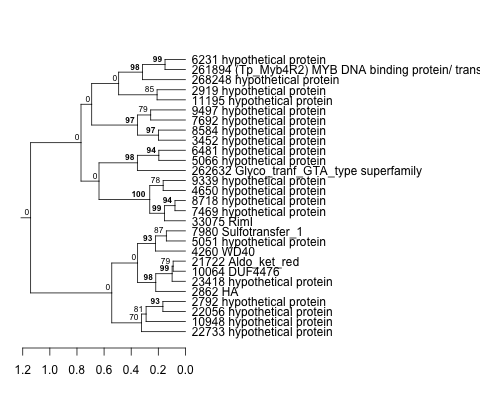
| Thaps_hclust_0219 |
 |
 |
2.8e-16 |
0.0000000055 |
0.012 |
highpH_TMEVA | 0.900000 | 0.0232 |
| Title | Cluster Plot | Dendrogram | e-value | e-value | e-value | Condition | Condition FDR | Condition Difference |
|---|---|---|---|---|---|---|---|---|
| Thaps_hclust_0239 |
 |
 |
0.000019 |
0.001 |
0.06 |
exponential_vs_stationary_24light | 0.900000 | 0.0468 |
| Title | Cluster Plot | Dendrogram | e-value | e-value | e-value | Condition | Condition FDR | Condition Difference |
|---|---|---|---|---|---|---|---|---|
| Thaps_hclust_0039 |
 |
 |
2.2e-16 |
0.000000000000049 |
0.00083 |
diel_exponential_vs_stationary | 0.900000 | -0.0196 |
| Title | Cluster Plot | Dendrogram | e-value | e-value | e-value | Condition | Condition FDR | Condition Difference |
|---|---|---|---|---|---|---|---|---|
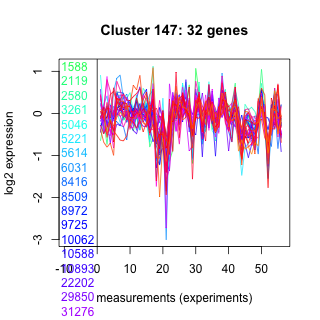
| Thaps_hclust_0147 |
 |
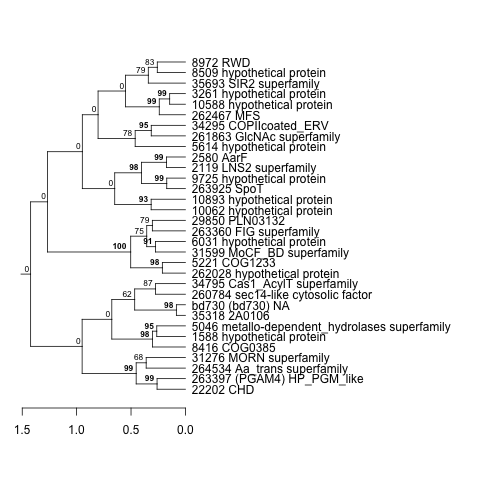 |
0.0000023 |
0.000053 |
1.9 |
exponential_vs_stationary_24light | 0.899000 | 0.0478 |
| Title | Cluster Plot | Dendrogram | e-value | e-value | e-value | Condition | Condition FDR | Condition Difference |
|---|---|---|---|---|---|---|---|---|
| Thaps_hclust_0234 |
 |
 |
0.036 |
0.063 |
0.24 |
exponential_vs_stationary_24light | 0.899000 | -0.0516 |
| Title | Cluster Plot | Dendrogram | e-value | e-value | e-value | Condition | Condition FDR | Condition Difference |
|---|---|---|---|---|---|---|---|---|
| Thaps_hclust_0072 |
 |
 |
1.2e-22 |
1.1e-16 |
0.000000000000011 |
lowFe_TMEVA | 0.899000 | -0.0587 |
| Title | Cluster Plot | Dendrogram | e-value | e-value | e-value | Condition | Condition FDR | Condition Difference |
|---|---|---|---|---|---|---|---|---|
| Thaps_hclust_0264 |
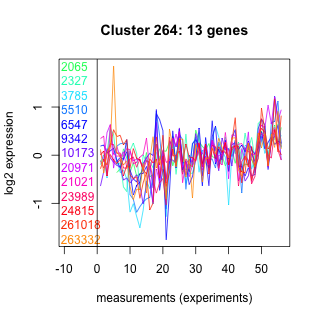 |
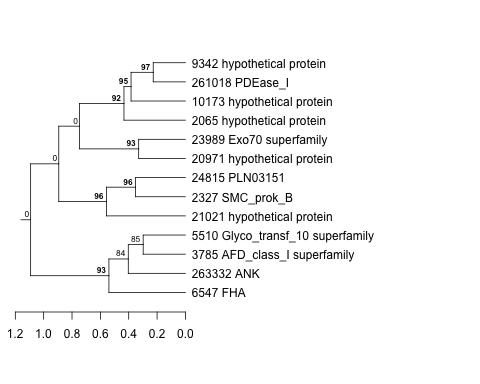 |
0.0079 |
0.24 |
5.8 |
lowFe_TMEVA | 0.899000 | -0.0549 |
| Title | Cluster Plot | Dendrogram | e-value | e-value | e-value | Condition | Condition FDR | Condition Difference |
|---|---|---|---|---|---|---|---|---|
| Thaps_hclust_0281 |
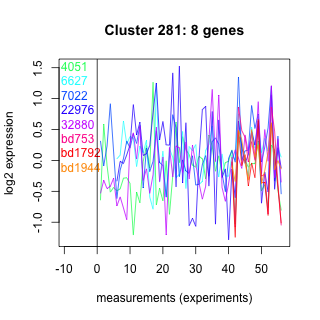 |
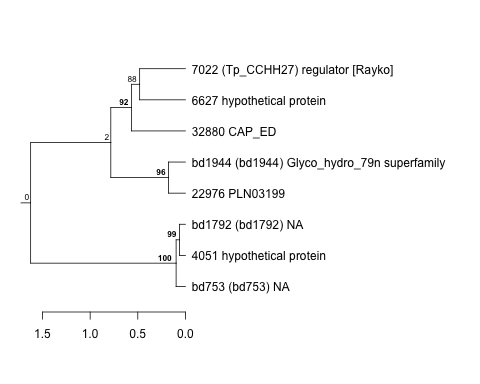 |
0.0000064 |
0.00064 |
0.03 |
lowFe_TMEVA | 0.899000 | 0.0596 |
| Title | Cluster Plot | Dendrogram | e-value | e-value | e-value | Condition | Condition FDR | Condition Difference |
|---|---|---|---|---|---|---|---|---|
| Thaps_hclust_0294 |
 |
 |
0.0033 |
0.13 |
0.53 |
lowFe_TMEVA | 0.899000 | -0.0511 |
| Title | Cluster Plot | Dendrogram | e-value | e-value | e-value | Condition | Condition FDR | Condition Difference |
|---|---|---|---|---|---|---|---|---|
| Thaps_hclust_0100 |
 |
 |
0.00000073 |
0.000076 |
2.6 |
lowFe_TMEVA | 0.899000 | -0.052 |
| Title | Cluster Plot | Dendrogram | e-value | e-value | e-value | Condition | Condition FDR | Condition Difference |
|---|---|---|---|---|---|---|---|---|
| Thaps_hclust_0479 |
 |
 |
0.11 |
0.2 |
1.5 |
exponential_vs_stationary_24highlight | 0.899000 | -0.0186 |
| Title | Cluster Plot | Dendrogram | e-value | e-value | e-value | Condition | Condition FDR | Condition Difference |
|---|---|---|---|---|---|---|---|---|
| Thaps_hclust_0166 |
 |
 |
0.001 |
5.3 |
63 |
exponential_vs_stationary_24light | 0.898000 | -0.0682 |
| Title | Cluster Plot | Dendrogram | e-value | e-value | e-value | Condition | Condition FDR | Condition Difference |
|---|---|---|---|---|---|---|---|---|
| Thaps_hclust_0146 |
 |
 |
0.00000000081 |
0.000016 |
0.0025 |
co2_elevated_expo_arrays | 0.898000 | 0.0548 |
| Title | Cluster Plot | Dendrogram | e-value | e-value | e-value | Condition | Condition FDR | Condition Difference |
|---|---|---|---|---|---|---|---|---|
| Thaps_hclust_0055 |
 |
 |
0.000000038 |
0.0000074 |
0.1 |
co2_elevated_expo_arrays | 0.898000 | -0.0565 |
| Title | Cluster Plot | Dendrogram | e-value | e-value | e-value | Condition | Condition FDR | Condition Difference |
|---|---|---|---|---|---|---|---|---|
| Thaps_hclust_0250 |
 |
 |
0.38 |
88 |
290 |
exponential_vs_stationary_24light | 0.898000 | -0.0724 |
| Title | Cluster Plot | Dendrogram | e-value | e-value | e-value | Condition | Condition FDR | Condition Difference |
|---|---|---|---|---|---|---|---|---|
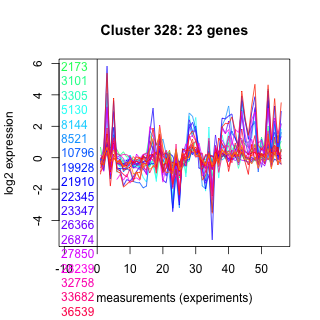
| Thaps_hclust_0328 |
 |
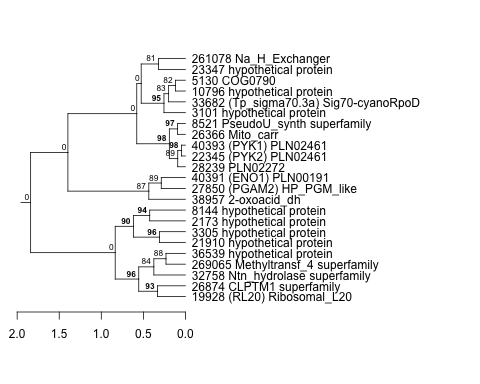 |
0.00013 |
0.00001 |
0.46 |
BaP | 0.898000 | -0.0338 |
| Title | Cluster Plot | Dendrogram | e-value | e-value | e-value | Condition | Condition FDR | Condition Difference |
|---|---|---|---|---|---|---|---|---|
| Thaps_hclust_0429 |
 |
 |
0.0000000033 |
0.00000039 |
0.000054 |
lowtemp_TMEVA | 0.898000 | -0.0385 |
| Title | Cluster Plot | Dendrogram | e-value | e-value | e-value | Condition | Condition FDR | Condition Difference |
|---|---|---|---|---|---|---|---|---|
| Thaps_hclust_0173 |
 |
 |
0.013 |
0.83 |
0.45 |
BaP | 0.897000 | -0.0343 |
| Title | Cluster Plot | Dendrogram | e-value | e-value | e-value | Condition | Condition FDR | Condition Difference |
|---|---|---|---|---|---|---|---|---|
| Thaps_hclust_0182 |
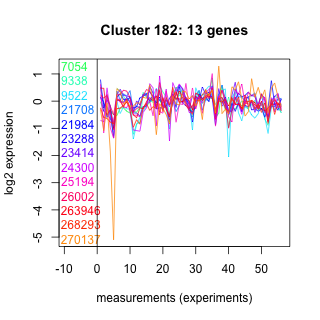 |
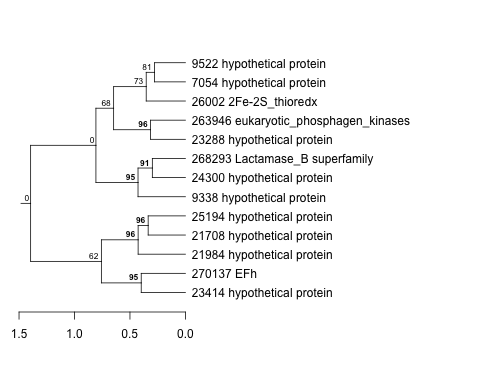 |
0.13 |
130 |
0.14 |
BaP | 0.897000 | -0.0419 |
| Title | Cluster Plot | Dendrogram | e-value | e-value | e-value | Condition | Condition FDR | Condition Difference |
|---|---|---|---|---|---|---|---|---|
| Thaps_hclust_0316 |
 |
 |
0.14 |
2.2 |
4.4 |
highlight_arrays | 0.897000 | -0.0325 |
| Title | Cluster Plot | Dendrogram | e-value | e-value | e-value | Condition | Condition FDR | Condition Difference |
|---|---|---|---|---|---|---|---|---|
| Thaps_hclust_0160 |
 |
 |
0.35 |
66 |
160 |
BaP | 0.897000 | 0.0464 |
| Title | Cluster Plot | Dendrogram | e-value | e-value | e-value | Condition | Condition FDR | Condition Difference |
|---|---|---|---|---|---|---|---|---|
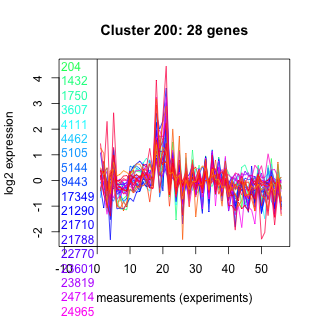
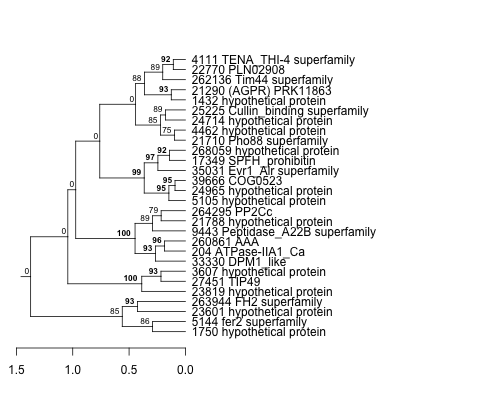
| Thaps_hclust_0200 |
 |
 |
0.0000013 |
0.00018 |
0.000045 |
diel_exponential_vs_stationary | 0.896000 | 0.0273 |
| Title | Cluster Plot | Dendrogram | e-value | e-value | e-value | Condition | Condition FDR | Condition Difference |
|---|---|---|---|---|---|---|---|---|
| Thaps_hclust_0445 |
 |
 |
0.000046 |
6.9 |
33 |
diel_exponential_vs_stationary | 0.896000 | 0.0307 |
| Title | Cluster Plot | Dendrogram | e-value | e-value | e-value | Condition | Condition FDR | Condition Difference |
|---|---|---|---|---|---|---|---|---|
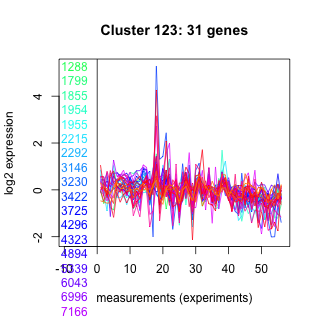
| Thaps_hclust_0123 |
 |
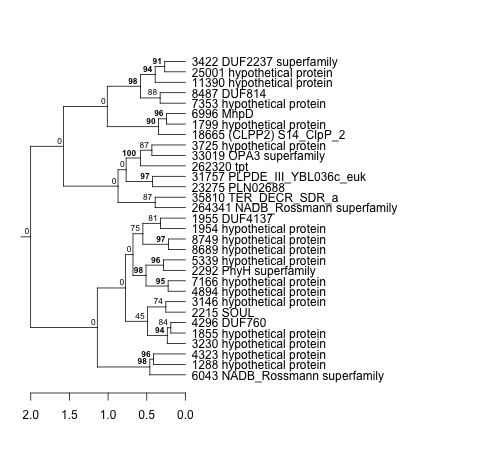 |
0.000073 |
0.05 |
0.076 |
co2_elevated_expo_arrays | 0.896000 | 0.0551 |
| Title | Cluster Plot | Dendrogram | e-value | e-value | e-value | Condition | Condition FDR | Condition Difference |
|---|---|---|---|---|---|---|---|---|
| Thaps_hclust_0322 |
 |
 |
0.0000000021 |
0.0000000053 |
0.0051 |
highlight_arrays | 0.896000 | -0.019 |
| Title | Cluster Plot | Dendrogram | e-value | e-value | e-value | Condition | Condition FDR | Condition Difference |
|---|---|---|---|---|---|---|---|---|
| Thaps_hclust_0442 |
 |
 |
0.045 |
2.3 |
2.8 |
diel_exponential_vs_stationary | 0.896000 | 0.0453 |
| Title | Cluster Plot | Dendrogram | e-value | e-value | e-value | Condition | Condition FDR | Condition Difference |
|---|---|---|---|---|---|---|---|---|
| Thaps_hclust_0089 |
 |
 |
0.000036 |
0.00054 |
0.075 |
diel_exponential_vs_stationary | 0.896000 | 0.0326 |
| Title | Cluster Plot | Dendrogram | e-value | e-value | e-value | Condition | Condition FDR | Condition Difference |
|---|---|---|---|---|---|---|---|---|
| Thaps_hclust_0349 |
 |
 |
360 |
5.4 |
67 |
exponential_vs_stationary_24light | 0.896000 | -0.0595 |
| Title | Cluster Plot | Dendrogram | e-value | e-value | e-value | Condition | Condition FDR | Condition Difference |
|---|---|---|---|---|---|---|---|---|
| Thaps_hclust_0027 |
 |
 |
0.0000000084 |
0.0086 |
0.069 |
BaP | 0.896000 | -0.0337 |
| Title | Cluster Plot | Dendrogram | e-value | e-value | e-value | Condition | Condition FDR | Condition Difference |
|---|---|---|---|---|---|---|---|---|
| Thaps_hclust_0468 |
 |
 |
0.0023 |
0.08 |
2.3 |
highpH_TMEVA | 0.896000 | 0.0283 |
| Title | Cluster Plot | Dendrogram | e-value | e-value | e-value | Condition | Condition FDR | Condition Difference |
|---|---|---|---|---|---|---|---|---|
| Thaps_hclust_0385 |
 |
 |
0.000029 |
2.1 |
2.2 |
diel_exponential_vs_stationary | 0.896000 | 0.0311 |
| Title | Cluster Plot | Dendrogram | e-value | e-value | e-value | Condition | Condition FDR | Condition Difference |
|---|---|---|---|---|---|---|---|---|
| Thaps_hclust_0042 |
 |
 |
0.26 |
5.9 |
0.46 |
diel_exponential_vs_stationary | 0.896000 | 0.0361 |
| Title | Cluster Plot | Dendrogram | e-value | e-value | e-value | Condition | Condition FDR | Condition Difference |
|---|---|---|---|---|---|---|---|---|
| Thaps_hclust_0190 |
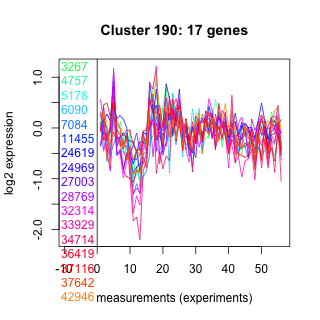 |
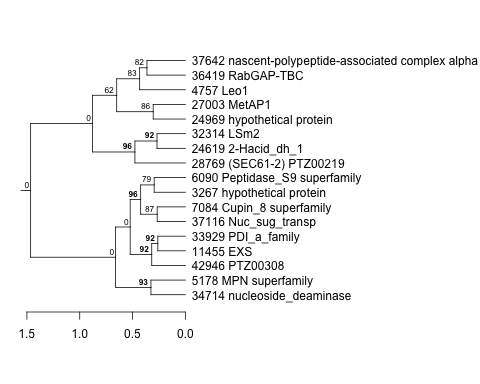 |
0.0000025 |
0.00027 |
0.93 |
BaP | 0.895000 | 0.0437 |
| Title | Cluster Plot | Dendrogram | e-value | e-value | e-value | Condition | Condition FDR | Condition Difference |
|---|---|---|---|---|---|---|---|---|
| Thaps_hclust_0171 |
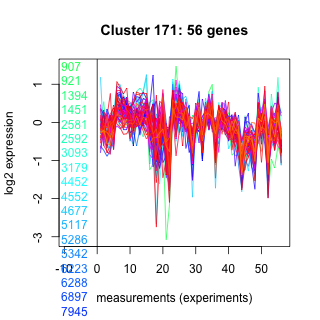 |
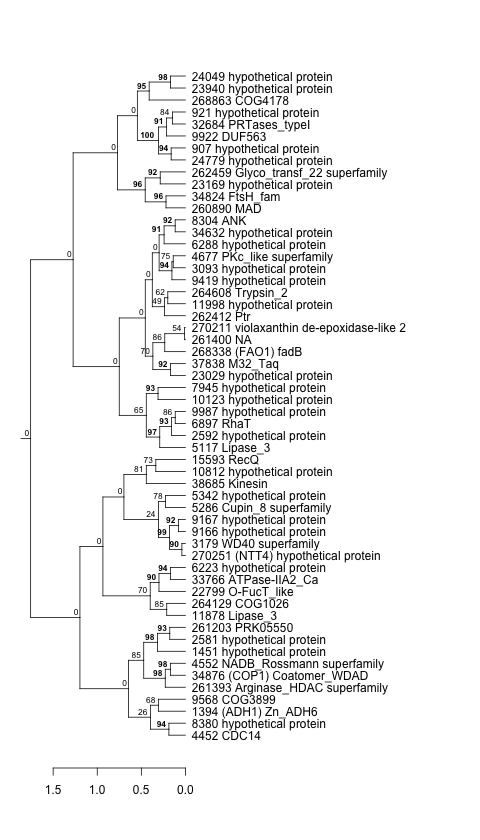 |
0.0000000000052 |
0.000000000056 |
0.000000000083 |
lowSi_TMEVA | 0.895000 | -0.196 |