Hierarchical Clusters
Displaying 1801 - 1900 of 7500
| Title | Cluster Plot | Dendrogram | e-value | e-value | e-value | Condition | Condition FDR | Condition Difference |
|---|---|---|---|---|---|---|---|---|
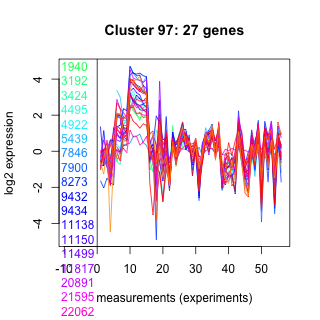
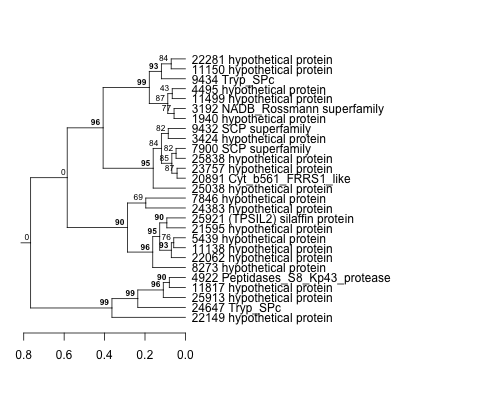
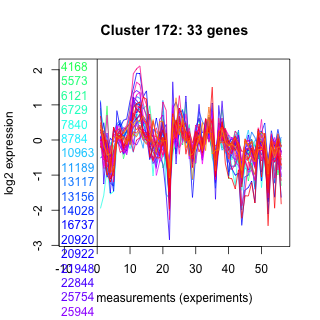
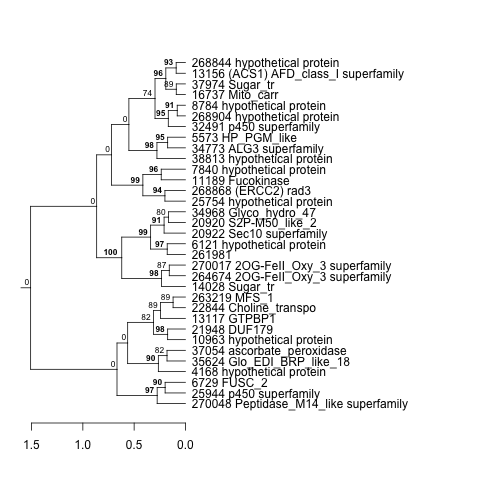
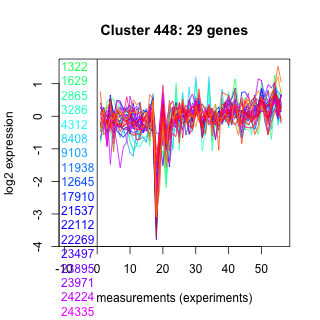
| Thaps_hclust_0042 |
 |
 |
0.26 |
5.9 |
0.46 |
highpH_TMEVA | 0.118000 | -0.27 |
| Thaps_hclust_0042 |
|
|
0.26 |
5.9 |
0.46 |
exponential_vs_stationary_24light | 0.503000 | -0.258 |
| Title | Cluster Plot | Dendrogram | e-value | e-value | e-value | Condition | Condition FDR | Condition Difference |
|---|---|---|---|---|---|---|---|---|
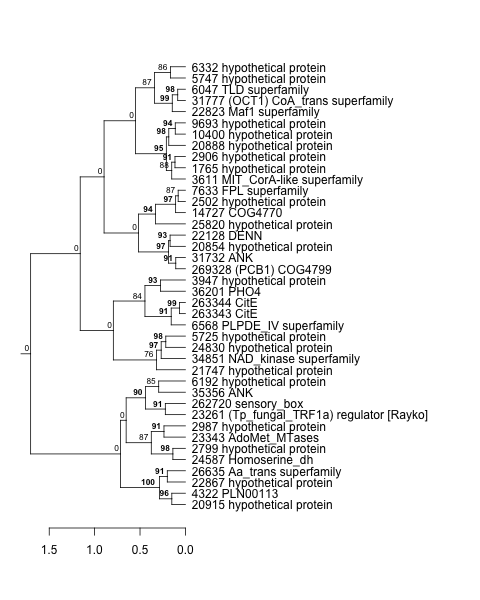
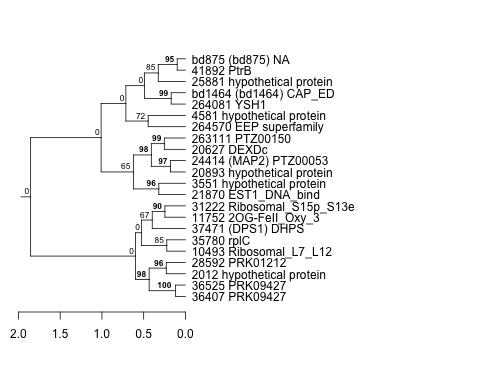
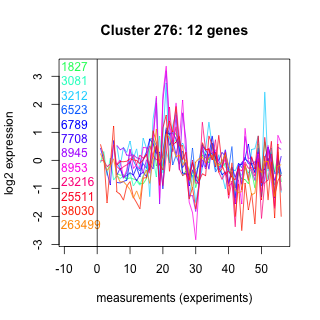
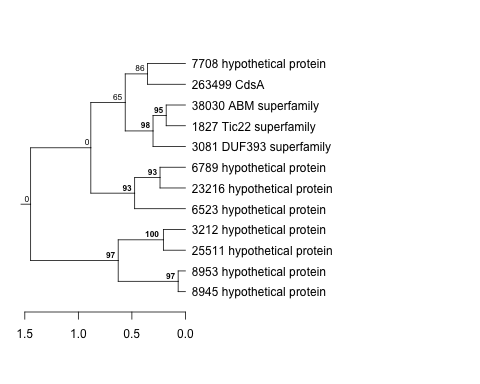
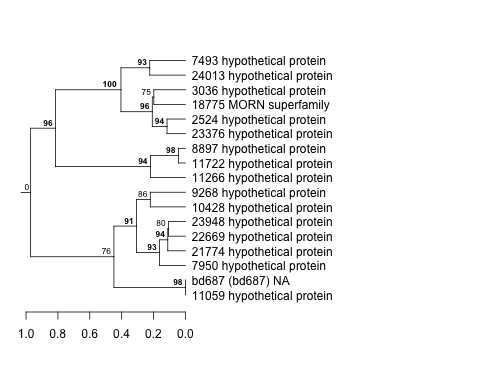
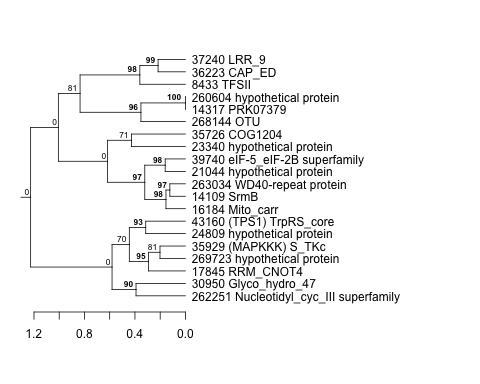
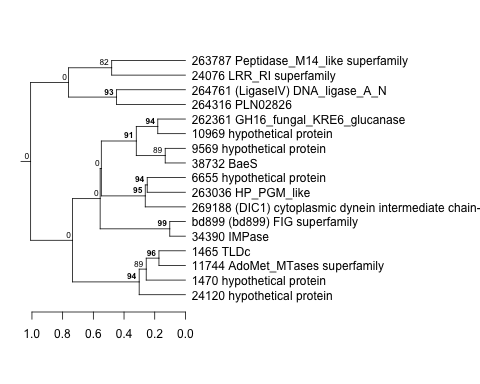
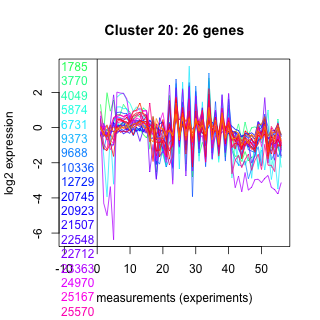
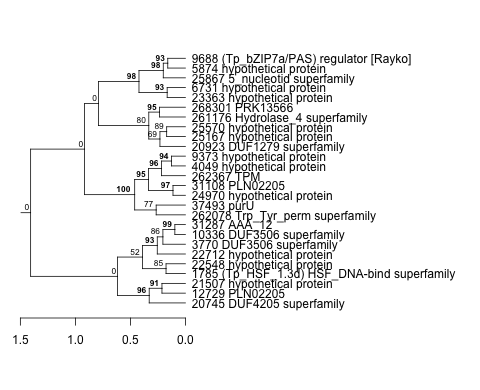
| Thaps_hclust_0229 |
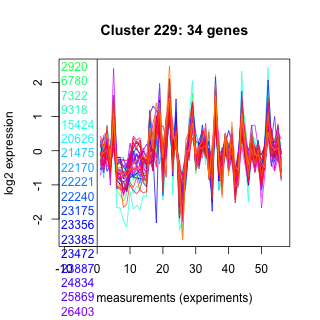 |
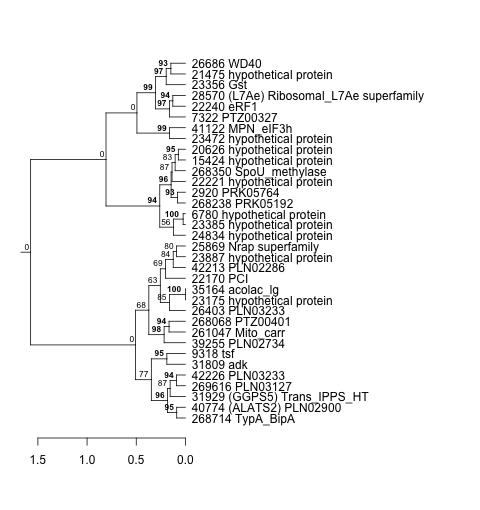 |
9.9e-18 |
0.000000000000034 |
0.0000002 |
diel_light_vs_dark | 0.075900 | -0.27 |
| Title | Cluster Plot | Dendrogram | e-value | e-value | e-value | Condition | Condition FDR | Condition Difference |
|---|---|---|---|---|---|---|---|---|
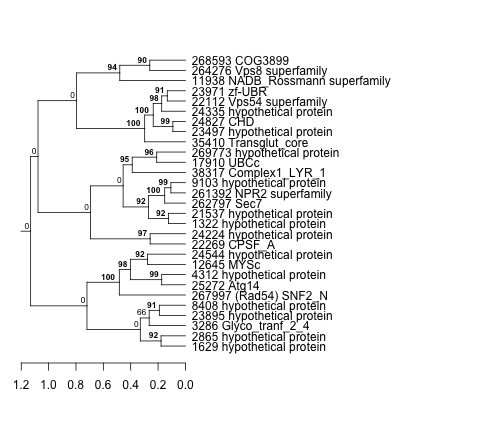
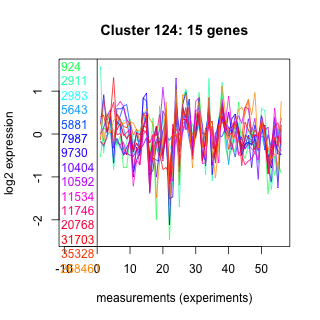
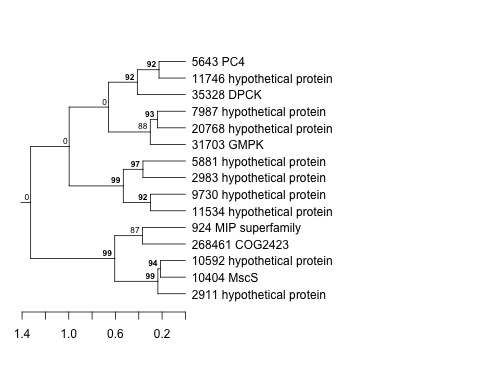
| Thaps_hclust_0420 |
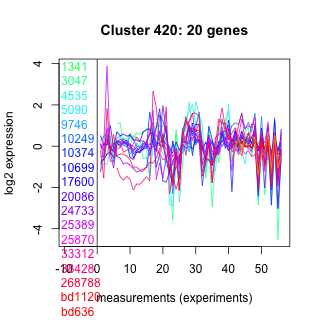 |
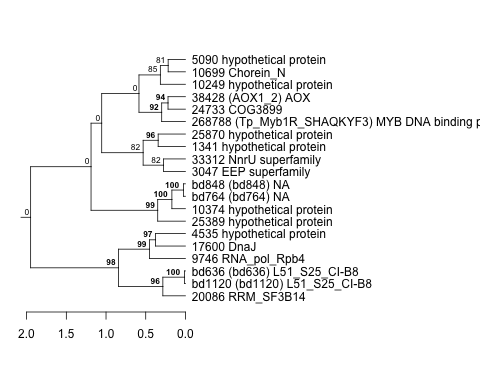 |
0.000009 |
0.00077 |
0.53 |
diel_light_vs_dark | 0.204000 | -0.27 |
| Thaps_hclust_0420 |
|
|
0.000009 |
0.00077 |
0.53 |
lowFe_TMEVA | 0.343000 | -0.266 |
| Title | Cluster Plot | Dendrogram | e-value | e-value | e-value | Condition | Condition FDR | Condition Difference |
|---|---|---|---|---|---|---|---|---|
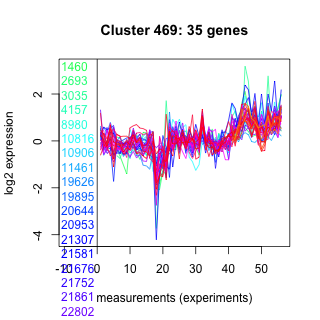
| Thaps_hclust_0319 |
 |
 |
2.4 |
46 |
70 |
co2_elevated_stat_arrays | 0.365000 | -0.27 |
| Title | Cluster Plot | Dendrogram | e-value | e-value | e-value | Condition | Condition FDR | Condition Difference |
|---|---|---|---|---|---|---|---|---|
| Thaps_hclust_0485 |
 |
 |
0.0012 |
0.0078 |
0.16 |
exponential_vs_stationary_24highlight | 0.000526 | -0.27 |
| Title | Cluster Plot | Dendrogram | e-value | e-value | e-value | Condition | Condition FDR | Condition Difference |
|---|---|---|---|---|---|---|---|---|
| Thaps_hclust_0030 |
 |
 |
0.000056 |
0.048 |
0.088 |
lowtemp_TMEVA | 0.263000 | -0.269 |
| Title | Cluster Plot | Dendrogram | e-value | e-value | e-value | Condition | Condition FDR | Condition Difference |
|---|---|---|---|---|---|---|---|---|
| Thaps_hclust_0464 |
 |
 |
0.0002 |
14 |
31 |
lowtemp_TMEVA | 0.241000 | -0.269 |
| Title | Cluster Plot | Dendrogram | e-value | e-value | e-value | Condition | Condition FDR | Condition Difference |
|---|---|---|---|---|---|---|---|---|
| Thaps_hclust_0208 |
 |
|
1.2e-20 |
0.0000000000000057 |
0.0000000099 |
highlight_arrays | 0.002290 | -0.269 |
| Title | Cluster Plot | Dendrogram | e-value | e-value | e-value | Condition | Condition FDR | Condition Difference |
|---|---|---|---|---|---|---|---|---|
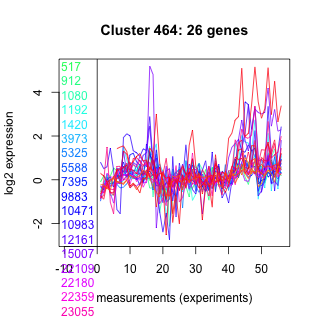
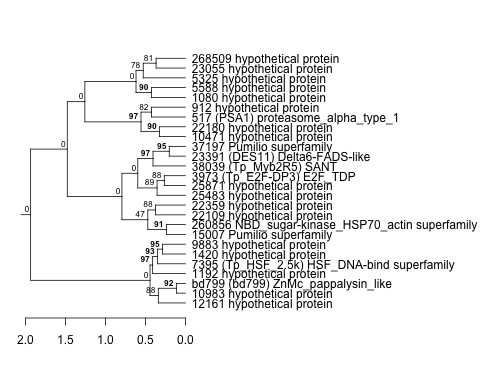
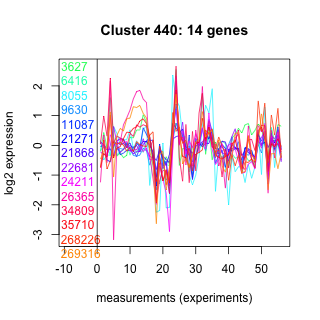
| Thaps_hclust_0440 |
 |
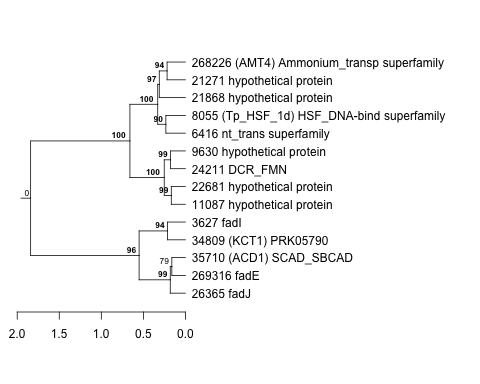 |
0.68 |
4.6 |
250 |
lowtemp_TMEVA | 0.377000 | -0.269 |
| Title | Cluster Plot | Dendrogram | e-value | e-value | e-value | Condition | Condition FDR | Condition Difference |
|---|---|---|---|---|---|---|---|---|
| Thaps_hclust_0465 |
 |
 |
0.011 |
0.053 |
0.75 |
highlight_arrays | 0.031500 | -0.269 |
| Title | Cluster Plot | Dendrogram | e-value | e-value | e-value | Condition | Condition FDR | Condition Difference |
|---|---|---|---|---|---|---|---|---|
| Thaps_hclust_0244 |
 |
 |
0.000000057 |
0.0001 |
4.1 |
highpH_TMEVA | 0.064900 | -0.269 |
| Title | Cluster Plot | Dendrogram | e-value | e-value | e-value | Condition | Condition FDR | Condition Difference |
|---|---|---|---|---|---|---|---|---|
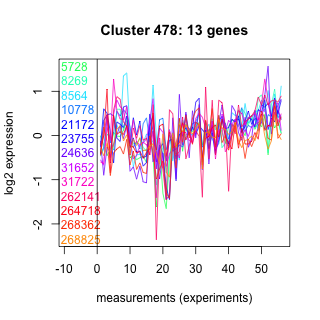
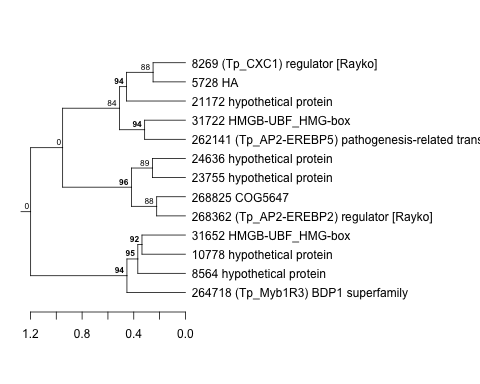
| Thaps_hclust_0478 |
 |
 |
0.1 |
0.0096 |
3.5 |
diel_exponential_vs_stationary | 0.241000 | -0.269 |
| Title | Cluster Plot | Dendrogram | e-value | e-value | e-value | Condition | Condition FDR | Condition Difference |
|---|---|---|---|---|---|---|---|---|
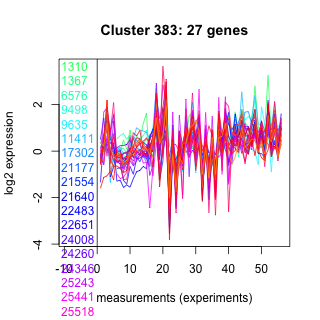
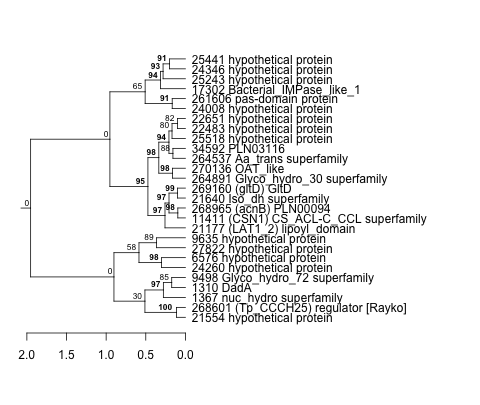
| Thaps_hclust_0383 |
 |
 |
0.00049 |
0.088 |
0.58 |
highpH_TMEVA | 0.053600 | -0.269 |
| Title | Cluster Plot | Dendrogram | e-value | e-value | e-value | Condition | Condition FDR | Condition Difference |
|---|---|---|---|---|---|---|---|---|
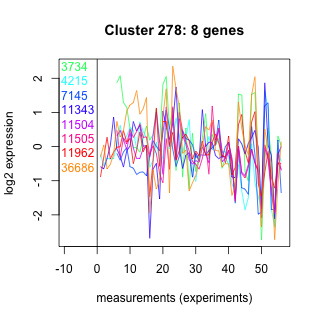
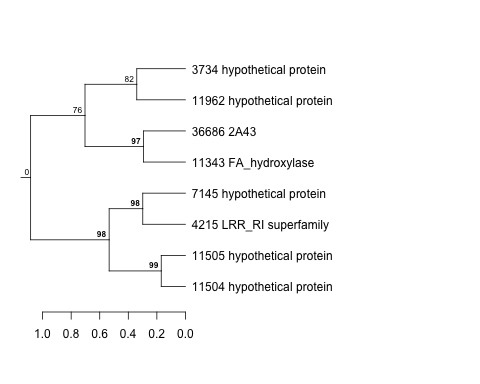
| Thaps_hclust_0278 |
 |
 |
0.093 |
0.57 |
39 |
lowN_TMEVA | 0.564000 | -0.268 |
| Title | Cluster Plot | Dendrogram | e-value | e-value | e-value | Condition | Condition FDR | Condition Difference |
|---|---|---|---|---|---|---|---|---|
| Thaps_hclust_0386 |
 |
 |
0.00000064 |
0.00000005 |
0.00054 |
lowFe_TMEVA | 0.243000 | -0.268 |
| Title | Cluster Plot | Dendrogram | e-value | e-value | e-value | Condition | Condition FDR | Condition Difference |
|---|---|---|---|---|---|---|---|---|
| Thaps_hclust_0499 |
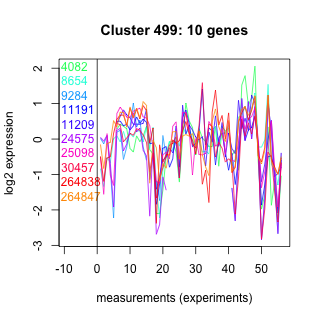 |
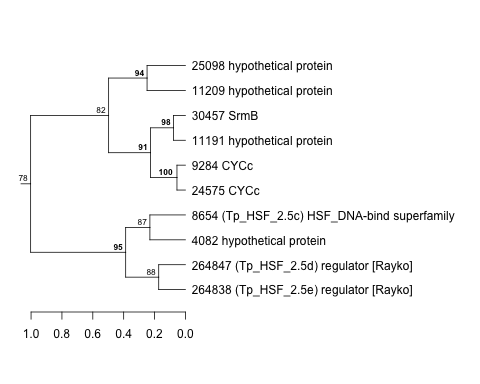 |
0.13 |
5.4 |
18 |
exponential_vs_stationary_24highlight | 0.075700 | -0.267 |
| Title | Cluster Plot | Dendrogram | e-value | e-value | e-value | Condition | Condition FDR | Condition Difference |
|---|---|---|---|---|---|---|---|---|
| Thaps_hclust_0123 |
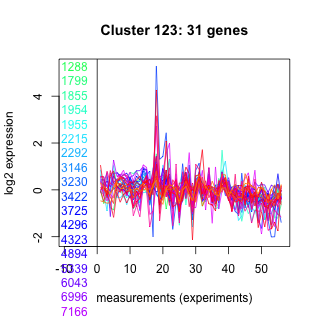 |
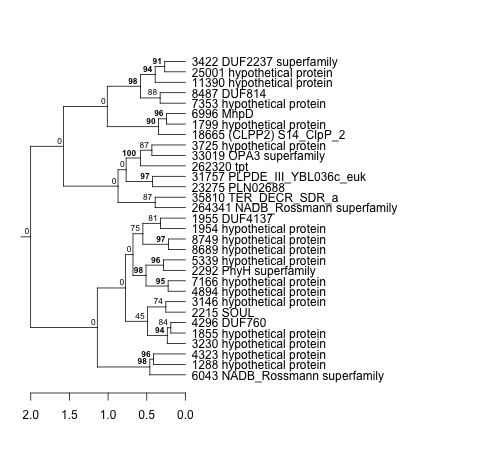 |
0.000073 |
0.05 |
0.076 |
diel_light_vs_dark | 0.097300 | -0.267 |
| Title | Cluster Plot | Dendrogram | e-value | e-value | e-value | Condition | Condition FDR | Condition Difference |
|---|---|---|---|---|---|---|---|---|
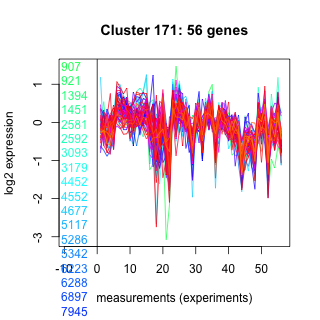
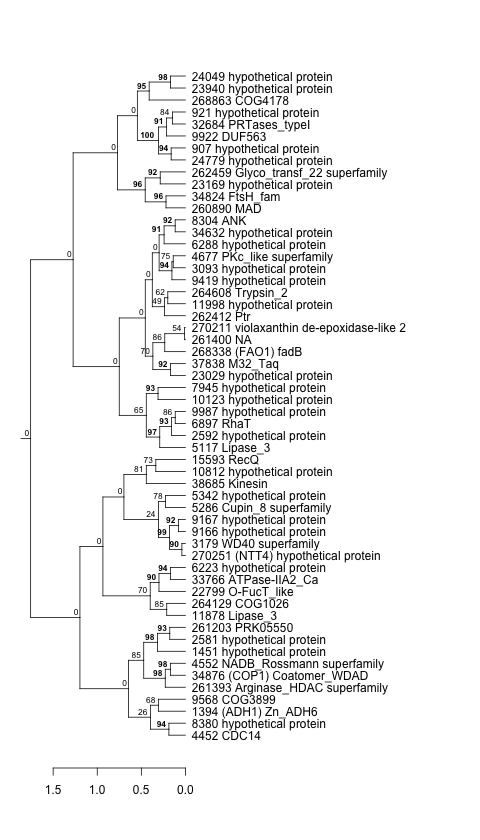
| Thaps_hclust_0171 |
 |
 |
0.0000000000052 |
0.000000000056 |
0.000000000083 |
lowN_TMEVA | 0.279000 | -0.267 |
| Title | Cluster Plot | Dendrogram | e-value | e-value | e-value | Condition | Condition FDR | Condition Difference |
|---|---|---|---|---|---|---|---|---|
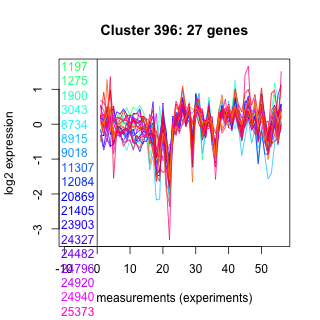
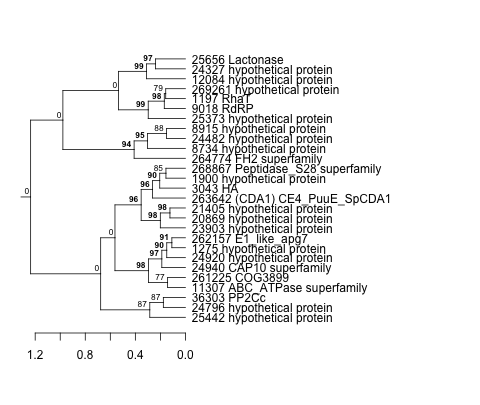
| Thaps_hclust_0396 |
 |
 |
0.082 |
10 |
29 |
lowFe_KTKB_Day5 | 0.124000 | -0.267 |
| Thaps_hclust_0396 |
|
|
0.082 |
10 |
29 |
lowtemp_TMEVA | 0.247000 | -0.254 |
| Title | Cluster Plot | Dendrogram | e-value | e-value | e-value | Condition | Condition FDR | Condition Difference |
|---|---|---|---|---|---|---|---|---|
| Thaps_hclust_0380 |
 |
 |
1.1 |
5 |
8.7 |
exponential_vs_stationary_24highlight | 0.023300 | -0.267 |
| Title | Cluster Plot | Dendrogram | e-value | e-value | e-value | Condition | Condition FDR | Condition Difference |
|---|---|---|---|---|---|---|---|---|
| Thaps_hclust_0279 |
 |
 |
2.7 |
22 |
38 |
exponential_vs_stationary_24light | 0.545000 | -0.267 |
| Title | Cluster Plot | Dendrogram | e-value | e-value | e-value | Condition | Condition FDR | Condition Difference |
|---|---|---|---|---|---|---|---|---|
| Thaps_hclust_0236 |
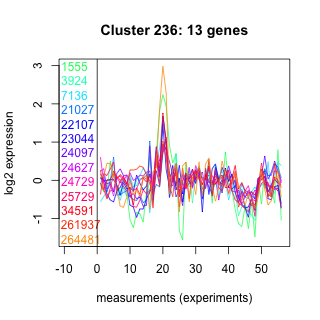 |
 |
0.0078 |
3.3 |
1.1 |
co2_elevated_stat_arrays | 0.311000 | -0.266 |
| Thaps_hclust_0236 |
|
|
0.0078 |
3.3 |
1.1 |
lowFe_KTKB_Day5 | 0.290000 | -0.266 |
| Title | Cluster Plot | Dendrogram | e-value | e-value | e-value | Condition | Condition FDR | Condition Difference |
|---|---|---|---|---|---|---|---|---|
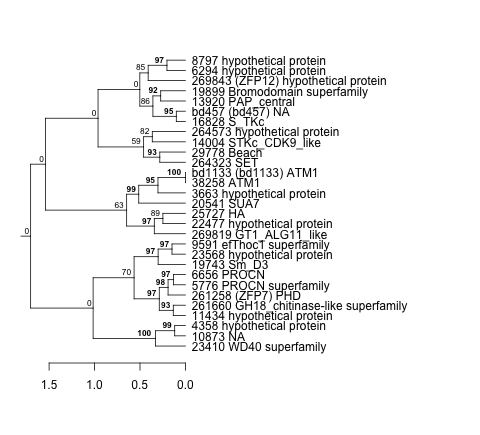
| Thaps_hclust_0267 |
 |
 |
0.00000003 |
0.39 |
0.58 |
lowFe_KTKB_Day5 | 0.190000 | -0.266 |
| Title | Cluster Plot | Dendrogram | e-value | e-value | e-value | Condition | Condition FDR | Condition Difference |
|---|---|---|---|---|---|---|---|---|
| Thaps_hclust_0190 |
 |
 |
0.0000025 |
0.00027 |
0.93 |
lowSi_TMEVA | 0.781000 | -0.266 |
| Title | Cluster Plot | Dendrogram | e-value | e-value | e-value | Condition | Condition FDR | Condition Difference |
|---|---|---|---|---|---|---|---|---|
| Thaps_hclust_0094 |
 |
 |
0.0000000025 |
0.000014 |
0.0000045 |
lowN_TMEVA | 0.310000 | -0.266 |
| Title | Cluster Plot | Dendrogram | e-value | e-value | e-value | Condition | Condition FDR | Condition Difference |
|---|---|---|---|---|---|---|---|---|
| Thaps_hclust_0039 |
 |
 |
2.2e-16 |
0.000000000000049 |
0.00083 |
lowFe_TMEVA | 0.195000 | -0.266 |
| Title | Cluster Plot | Dendrogram | e-value | e-value | e-value | Condition | Condition FDR | Condition Difference |
|---|---|---|---|---|---|---|---|---|
| Thaps_hclust_0405 |
 |
 |
0.00000000036 |
0.0000000063 |
0.005 |
lowFe_TMEVA | 0.218000 | -0.266 |
| Title | Cluster Plot | Dendrogram | e-value | e-value | e-value | Condition | Condition FDR | Condition Difference |
|---|---|---|---|---|---|---|---|---|
| Thaps_hclust_0167 |
 |
 |
1 |
15 |
160 |
co2_elevated_stat_arrays | 0.329000 | -0.266 |
| Title | Cluster Plot | Dendrogram | e-value | e-value | e-value | Condition | Condition FDR | Condition Difference |
|---|---|---|---|---|---|---|---|---|
| Thaps_hclust_0050 |
 |
 |
0.0000000011 |
0.0000042 |
0.00021 |
lowN_TMEVA | 0.440000 | -0.266 |
| Title | Cluster Plot | Dendrogram | e-value | e-value | e-value | Condition | Condition FDR | Condition Difference |
|---|---|---|---|---|---|---|---|---|
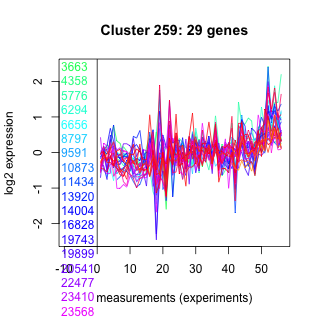
| Thaps_hclust_0259 |
 |
 |
0.000051 |
0.026 |
17 |
exponential_vs_stationary_24light | 0.365000 | -0.265 |
| Title | Cluster Plot | Dendrogram | e-value | e-value | e-value | Condition | Condition FDR | Condition Difference |
|---|---|---|---|---|---|---|---|---|
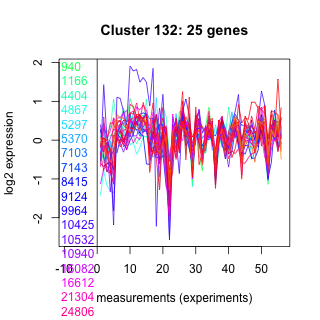
| Thaps_hclust_0132 |
 |
 |
0.00017 |
0.000096 |
26 |
highpH_TMEVA | 0.063400 | -0.265 |
| Title | Cluster Plot | Dendrogram | e-value | e-value | e-value | Condition | Condition FDR | Condition Difference |
|---|---|---|---|---|---|---|---|---|
| Thaps_hclust_0060 |
 |
 |
0.00000047 |
0.00077 |
0.0075 |
lowFe_TMEVA | 0.275000 | -0.265 |
| Title | Cluster Plot | Dendrogram | e-value | e-value | e-value | Condition | Condition FDR | Condition Difference |
|---|---|---|---|---|---|---|---|---|
| Thaps_hclust_0216 |
 |
 |
0.0000076 |
0.019 |
0.0036 |
lowFe_TMEVA | 0.258000 | -0.265 |
| Title | Cluster Plot | Dendrogram | e-value | e-value | e-value | Condition | Condition FDR | Condition Difference |
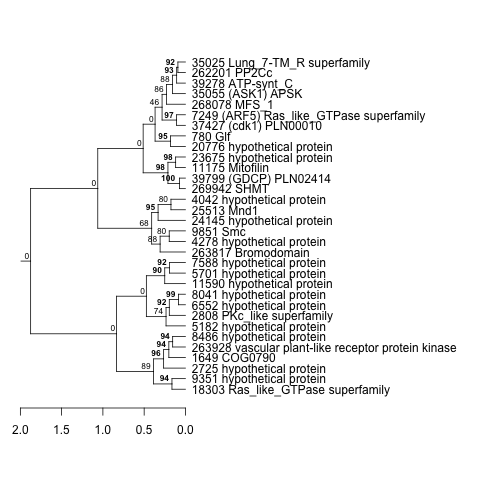
|---|---|---|---|---|---|---|---|---|
| Thaps_hclust_0326 |
 |
 |
0.000000000000042 |
0.00000000011 |
0.00000051 |
diel_light_vs_dark | 0.022900 | -0.265 |
| Title | Cluster Plot | Dendrogram | e-value | e-value | e-value | Condition | Condition FDR | Condition Difference |
|---|---|---|---|---|---|---|---|---|
| Thaps_hclust_0182 |
 |
 |
0.13 |
130 |
0.14 |
co2_elevated_stat_arrays | 0.315000 | -0.264 |
| Title | Cluster Plot | Dendrogram | e-value | e-value | e-value | Condition | Condition FDR | Condition Difference |
|---|---|---|---|---|---|---|---|---|
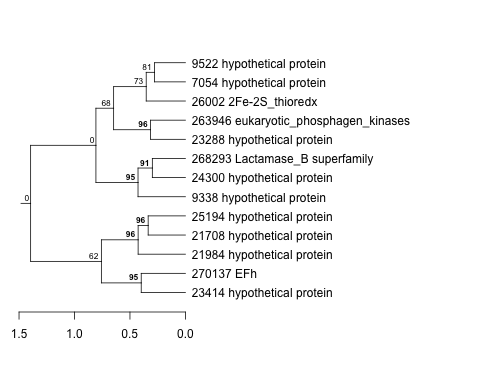
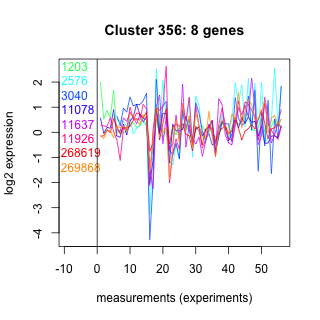
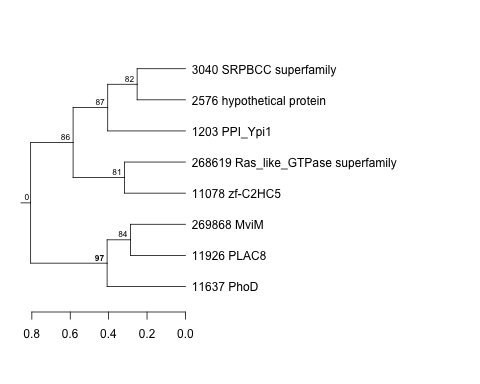
| Thaps_hclust_0356 |
 |
 |
2.1 |
41 |
71 |
exponential_vs_stationary_24highlight | 0.112000 | -0.264 |
| Title | Cluster Plot | Dendrogram | e-value | e-value | e-value | Condition | Condition FDR | Condition Difference |
|---|---|---|---|---|---|---|---|---|
| Thaps_hclust_0258 |
 |
 |
0.027 |
0.021 |
0.036 |
lowSi_TMEVA | 0.806000 | -0.264 |
| Title | Cluster Plot | Dendrogram | e-value | e-value | e-value | Condition | Condition FDR | Condition Difference |
|---|---|---|---|---|---|---|---|---|
| Thaps_hclust_0363 |
 |
 |
0.56 |
1.4 |
2.1 |
diel_exponential_vs_stationary | 0.302000 | -0.264 |
| Title | Cluster Plot | Dendrogram | e-value | e-value | e-value | Condition | Condition FDR | Condition Difference |
|---|---|---|---|---|---|---|---|---|
| Thaps_hclust_0181 |
 |
 |
0.000000035 |
0.14 |
0.84 |
lowFe_TMEVA | 0.382000 | -0.264 |
| Title | Cluster Plot | Dendrogram | e-value | e-value | e-value | Condition | Condition FDR | Condition Difference |
|---|---|---|---|---|---|---|---|---|
| Thaps_hclust_0154 |
 |
 |
0.00015 |
0.0049 |
0.29 |
highpH_TMEVA | 0.092900 | -0.264 |
| Title | Cluster Plot | Dendrogram | e-value | e-value | e-value | Condition | Condition FDR | Condition Difference |
|---|---|---|---|---|---|---|---|---|
| Thaps_hclust_0073 |
 |
 |
0.013 |
0.043 |
210 |
lowFe_KTKB_Day3 | 0.319000 | -0.264 |
| Title | Cluster Plot | Dendrogram | e-value | e-value | e-value | Condition | Condition FDR | Condition Difference |
|---|---|---|---|---|---|---|---|---|
| Thaps_hclust_0434 |
 |
 |
0.011 |
17 |
57 |
lowN_TMEVA | 0.564000 | -0.263 |
| Title | Cluster Plot | Dendrogram | e-value | e-value | e-value | Condition | Condition FDR | Condition Difference |
|---|---|---|---|---|---|---|---|---|
| Thaps_hclust_0097 |
 |
 |
0.02 |
1.4 |
3.4 |
lowN_TMEVA | 0.411000 | -0.263 |
| Title | Cluster Plot | Dendrogram | e-value | e-value | e-value | Condition | Condition FDR | Condition Difference |
|---|---|---|---|---|---|---|---|---|
| Thaps_hclust_0276 |
 |
 |
0.063 |
39 |
53 |
lowSi_TMEVA | 0.806000 | -0.263 |
| Title | Cluster Plot | Dendrogram | e-value | e-value | e-value | Condition | Condition FDR | Condition Difference |
|---|---|---|---|---|---|---|---|---|
| Thaps_hclust_0144 |
 |
 |
0.000000001 |
0.0000000019 |
0.00000019 |
lowFe_TMEVA | 0.215000 | -0.263 |
| Title | Cluster Plot | Dendrogram | e-value | e-value | e-value | Condition | Condition FDR | Condition Difference |
|---|---|---|---|---|---|---|---|---|
| Thaps_hclust_0131 |
 |
 |
260 |
48 |
370 |
highlight_arrays | 0.236000 | -0.263 |
| Title | Cluster Plot | Dendrogram | e-value | e-value | e-value | Condition | Condition FDR | Condition Difference |
|---|---|---|---|---|---|---|---|---|
| Thaps_hclust_0077 |
 |
 |
0.00014 |
0.91 |
2.2 |
lowFe_KTKB_Day3 | 0.287000 | -0.263 |
| Title | Cluster Plot | Dendrogram | e-value | e-value | e-value | Condition | Condition FDR | Condition Difference |
|---|---|---|---|---|---|---|---|---|
| Thaps_hclust_0332 |
 |
 |
0.000000055 |
0.0000013 |
0.0037 |
diel_exponential_vs_stationary | 0.057400 | -0.262 |
| Title | Cluster Plot | Dendrogram | e-value | e-value | e-value | Condition | Condition FDR | Condition Difference |
|---|---|---|---|---|---|---|---|---|
| Thaps_hclust_0101 |
 |
 |
0.000000016 |
0.0000038 |
0.014 |
lowFe_KTKB_Day3 | 0.212000 | -0.262 |
| Title | Cluster Plot | Dendrogram | e-value | e-value | e-value | Condition | Condition FDR | Condition Difference |
|---|---|---|---|---|---|---|---|---|
| Thaps_hclust_0172 |
 |
 |
0.000001 |
0.000011 |
0.014 |
lowFe_TMEVA | 0.257000 | -0.262 |
| Title | Cluster Plot | Dendrogram | e-value | e-value | e-value | Condition | Condition FDR | Condition Difference |
|---|---|---|---|---|---|---|---|---|
| Thaps_hclust_0103 |
 |
 |
3.4 |
4.8 |
21 |
lowN_TMEVA | 0.510000 | -0.262 |
| Title | Cluster Plot | Dendrogram | e-value | e-value | e-value | Condition | Condition FDR | Condition Difference |
|---|---|---|---|---|---|---|---|---|
| Thaps_hclust_0145 |
 |
 |
0.015 |
1.6 |
11 |
BaP | 0.498000 | -0.261 |
| Title | Cluster Plot | Dendrogram | e-value | e-value | e-value | Condition | Condition FDR | Condition Difference |
|---|---|---|---|---|---|---|---|---|
| Thaps_hclust_0435 |
 |
 |
0.17 |
0.24 |
1.5 |
exponential_vs_stationary_24light | 0.571000 | -0.261 |
| Title | Cluster Plot | Dendrogram | e-value | e-value | e-value | Condition | Condition FDR | Condition Difference |
|---|---|---|---|---|---|---|---|---|
| Thaps_hclust_0446 |
 |
 |
0.0000045 |
0.018 |
0.021 |
co2_elevated_stat_arrays | 0.296000 | -0.261 |
| Title | Cluster Plot | Dendrogram | e-value | e-value | e-value | Condition | Condition FDR | Condition Difference |
|---|---|---|---|---|---|---|---|---|
| Thaps_hclust_0185 |
 |
 |
0.000039 |
1.8 |
5.8 |
lowN_TMEVA | 0.505000 | -0.261 |
| Title | Cluster Plot | Dendrogram | e-value | e-value | e-value | Condition | Condition FDR | Condition Difference |
|---|---|---|---|---|---|---|---|---|
| Thaps_hclust_0067 |
 |
 |
0.0036 |
0.86 |
0.11 |
co2_elevated_stat_arrays | 0.302000 | -0.261 |
| Title | Cluster Plot | Dendrogram | e-value | e-value | e-value | Condition | Condition FDR | Condition Difference |
|---|---|---|---|---|---|---|---|---|
| Thaps_hclust_0296 |
 |
 |
0.17 |
1.8 |
0.83 |
highpH_TMEVA | 0.187000 | -0.261 |
| Title | Cluster Plot | Dendrogram | e-value | e-value | e-value | Condition | Condition FDR | Condition Difference |
|---|---|---|---|---|---|---|---|---|
| Thaps_hclust_0476 |
 |
 |
0.0015 |
0.56 |
2.4 |
lowN_TMEVA | 0.440000 | -0.261 |
| Title | Cluster Plot | Dendrogram | e-value | e-value | e-value | Condition | Condition FDR | Condition Difference |
|---|---|---|---|---|---|---|---|---|
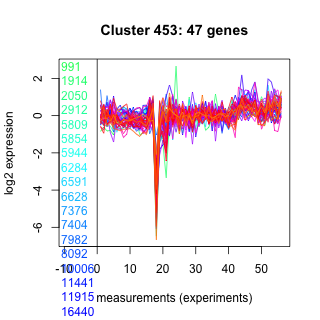
| Thaps_hclust_0453 |
 |
 |
0.000000000093 |
0.000000041 |
0.00016 |
exponential_vs_stationary_24light | 0.269000 | -0.26 |
| Title | Cluster Plot | Dendrogram | e-value | e-value | e-value | Condition | Condition FDR | Condition Difference |
|---|---|---|---|---|---|---|---|---|
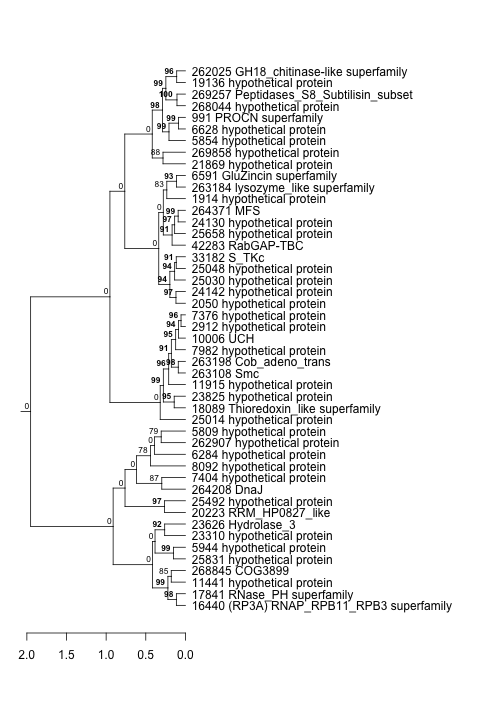
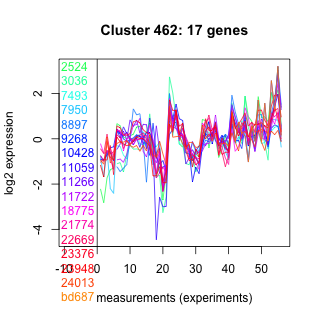
| Thaps_hclust_0462 |
 |
 |
0.0000000094 |
0.0000011 |
0.000046 |
co2_elevated_stat_arrays | 0.292000 | -0.26 |
| Title | Cluster Plot | Dendrogram | e-value | e-value | e-value | Condition | Condition FDR | Condition Difference |
|---|---|---|---|---|---|---|---|---|
| Thaps_hclust_0272 |
 |
 |
0.0048 |
0.01 |
0.059 |
exponential_vs_stationary_24light | 0.453000 | -0.26 |
| Title | Cluster Plot | Dendrogram | e-value | e-value | e-value | Condition | Condition FDR | Condition Difference |
|---|---|---|---|---|---|---|---|---|
| Thaps_hclust_0031 |
 |
 |
0.00000077 |
0.000041 |
6.3 |
lowSi_TMEVA | 0.769000 | -0.26 |
| Title | Cluster Plot | Dendrogram | e-value | e-value | e-value | Condition | Condition FDR | Condition Difference |
|---|---|---|---|---|---|---|---|---|
| Thaps_hclust_0059 |
 |
 |
0.0000000000000026 |
0.000000000024 |
0.0000014 |
BaP | 0.071500 | -0.26 |
| Title | Cluster Plot | Dendrogram | e-value | e-value | e-value | Condition | Condition FDR | Condition Difference |
|---|---|---|---|---|---|---|---|---|
| Thaps_hclust_0018 |
 |
 |
0.065 |
0.38 |
0.16 |
BaP | 0.284000 | -0.259 |
| Title | Cluster Plot | Dendrogram | e-value | e-value | e-value | Condition | Condition FDR | Condition Difference |
|---|---|---|---|---|---|---|---|---|
| Thaps_hclust_0178 |
 |
 |
0.0000000019 |
0.00000047 |
0.000019 |
highpH_TMEVA | 0.126000 | -0.259 |
| Title | Cluster Plot | Dendrogram | e-value | e-value | e-value | Condition | Condition FDR | Condition Difference |
|---|---|---|---|---|---|---|---|---|
| Thaps_hclust_0448 |
 |
 |
0.0000000026 |
0.00021 |
8.2 |
highlight_arrays | 0.043100 | -0.259 |
| Title | Cluster Plot | Dendrogram | e-value | e-value | e-value | Condition | Condition FDR | Condition Difference |
|---|---|---|---|---|---|---|---|---|
| Thaps_hclust_0469 |
 |
 |
0.000013 |
0.00011 |
0.00029 |
lowtemp_TMEVA | 0.186000 | -0.259 |
| Title | Cluster Plot | Dendrogram | e-value | e-value | e-value | Condition | Condition FDR | Condition Difference |
|---|---|---|---|---|---|---|---|---|
| Thaps_hclust_0428 |
 |
 |
0.000000076 |
0.015 |
1.9 |
BaP | 0.109000 | -0.258 |
| Title | Cluster Plot | Dendrogram | e-value | e-value | e-value | Condition | Condition FDR | Condition Difference |
|---|---|---|---|---|---|---|---|---|
| Thaps_hclust_0389 |
 |
 |
0.00000008 |
0.00077 |
340 |
lowFe_KTKB_Day5 | 0.162000 | -0.258 |
| Title | Cluster Plot | Dendrogram | e-value | e-value | e-value | Condition | Condition FDR | Condition Difference |
|---|---|---|---|---|---|---|---|---|
| Thaps_hclust_0331 |
 |
 |
0.000000000011 |
20 |
1600 |
lowFe_KTKB_Day3 | 0.157000 | -0.258 |
| Title | Cluster Plot | Dendrogram | e-value | e-value | e-value | Condition | Condition FDR | Condition Difference |
|---|---|---|---|---|---|---|---|---|
| Thaps_hclust_0102 |
 |
 |
3.2e-16 |
0.00000000002 |
0.0000006 |
BaP | 0.101000 | -0.258 |
| Title | Cluster Plot | Dendrogram | e-value | e-value | e-value | Condition | Condition FDR | Condition Difference |
|---|---|---|---|---|---|---|---|---|
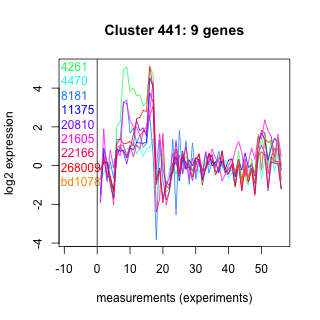
| Thaps_hclust_0441 |
 |
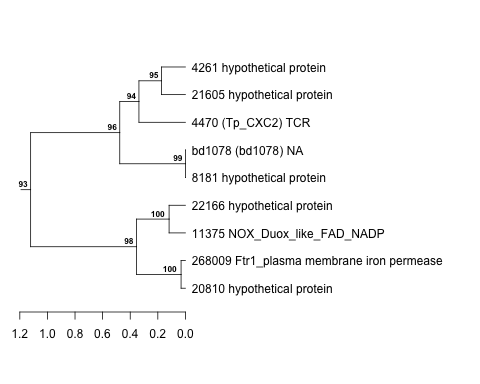 |
0.00081 |
0.001 |
0.0015 |
lowN_TMEVA | 0.572000 | -0.258 |
| Title | Cluster Plot | Dendrogram | e-value | e-value | e-value | Condition | Condition FDR | Condition Difference |
|---|---|---|---|---|---|---|---|---|
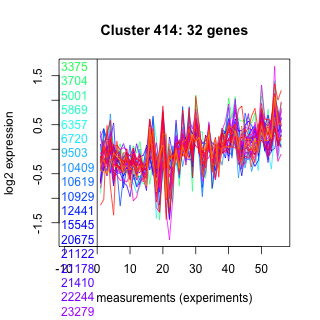
| Thaps_hclust_0414 |
 |
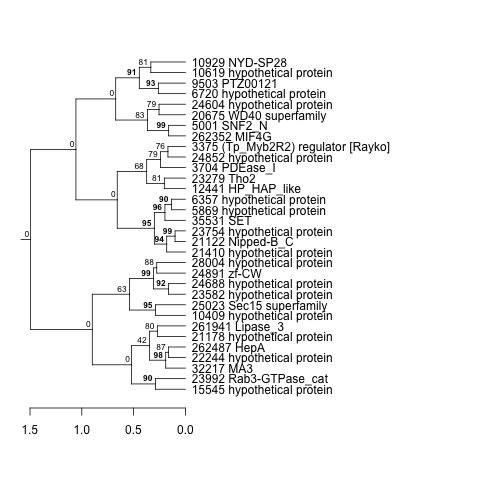 |
0.0000000000028 |
0.00000026 |
0.000019 |
lowtemp_TMEVA | 0.200000 | -0.257 |
| Title | Cluster Plot | Dendrogram | e-value | e-value | e-value | Condition | Condition FDR | Condition Difference |
|---|---|---|---|---|---|---|---|---|
| Thaps_hclust_0156 |
 |
 |
0.00054 |
0.00071 |
0.0013 |
lowSi_TMEVA | 0.769000 | -0.257 |
| Title | Cluster Plot | Dendrogram | e-value | e-value | e-value | Condition | Condition FDR | Condition Difference |
|---|---|---|---|---|---|---|---|---|
| Thaps_hclust_0014 |
 |
 |
Not available | Not available | Not available | BaP | 0.027000 | -0.257 |
| Title | Cluster Plot | Dendrogram | e-value | e-value | e-value | Condition | Condition FDR | Condition Difference |
|---|---|---|---|---|---|---|---|---|
| Thaps_hclust_0352 |
 |
 |
8.7 |
78 |
79 |
highpH_TMEVA | 0.182000 | -0.257 |
| Title | Cluster Plot | Dendrogram | e-value | e-value | e-value | Condition | Condition FDR | Condition Difference |
|---|---|---|---|---|---|---|---|---|
| Thaps_hclust_0192 |
 |
 |
0.000012 |
0.017 |
1.3 |
lowN_TMEVA | 0.489000 | -0.257 |
| Title | Cluster Plot | Dendrogram | e-value | e-value | e-value | Condition | Condition FDR | Condition Difference |
|---|---|---|---|---|---|---|---|---|
| Thaps_hclust_0470 |
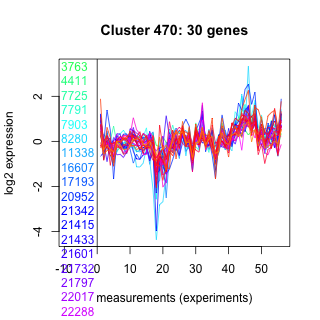 |
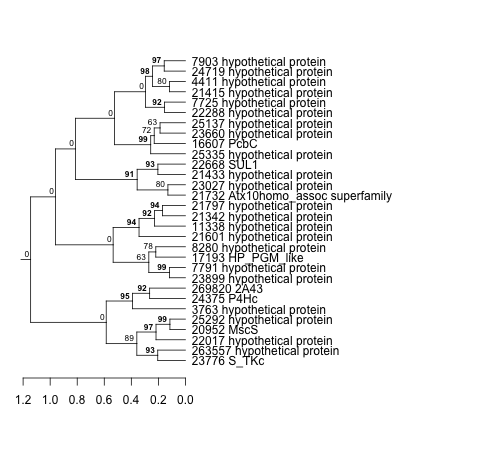 |
0.0000048 |
0.00021 |
0.086 |
lowFe_TMEVA | 0.300000 | -0.256 |
| Title | Cluster Plot | Dendrogram | e-value | e-value | e-value | Condition | Condition FDR | Condition Difference |
|---|---|---|---|---|---|---|---|---|
| Thaps_hclust_0199 |
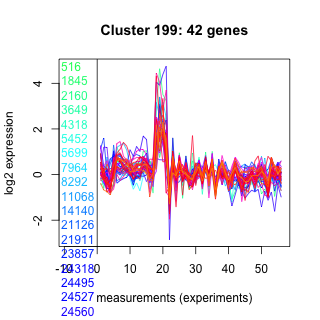 |
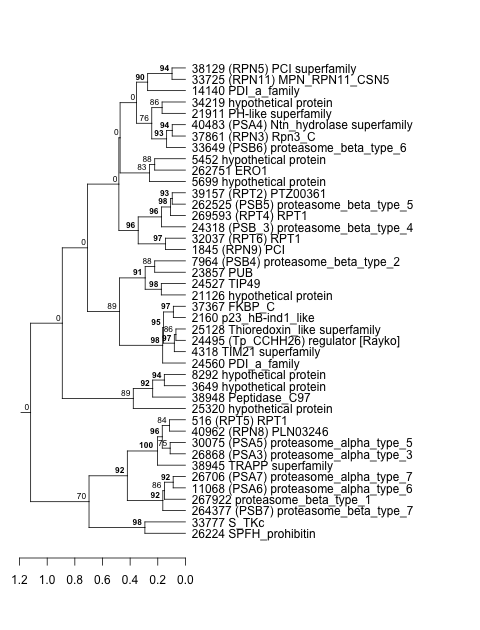 |
2.7e-19 |
0.000000062 |
0.00000065 |
co2_elevated_stat_arrays | 0.154000 | -0.256 |
| Title | Cluster Plot | Dendrogram | e-value | e-value | e-value | Condition | Condition FDR | Condition Difference |
|---|---|---|---|---|---|---|---|---|
| Thaps_hclust_0467 |
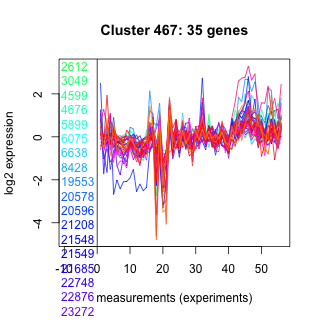 |
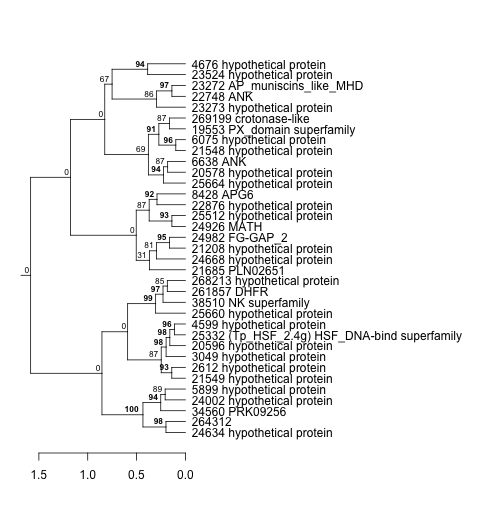 |
0.000000000002 |
0.0000014 |
0.035 |
lowFe_TMEVA | 0.274000 | -0.256 |
| Title | Cluster Plot | Dendrogram | e-value | e-value | e-value | Condition | Condition FDR | Condition Difference |
|---|---|---|---|---|---|---|---|---|
| Thaps_hclust_0322 |
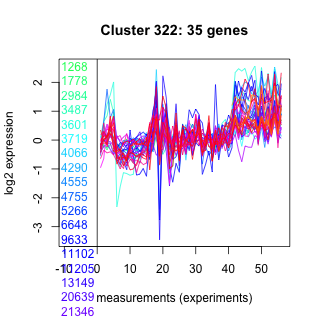 |
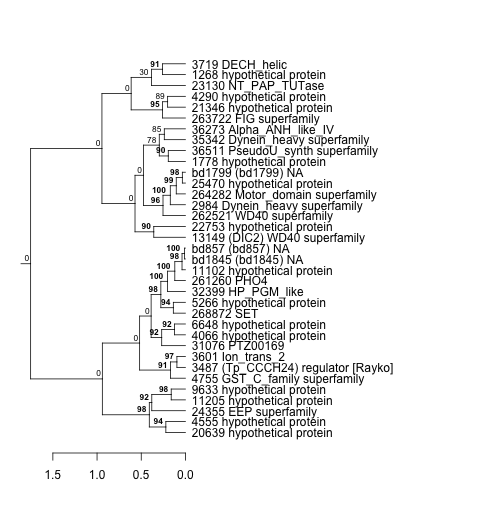 |
0.0000000021 |
0.0000000053 |
0.0051 |
highpH_TMEVA | 0.036600 | -0.256 |
| Title | Cluster Plot | Dendrogram | e-value | e-value | e-value | Condition | Condition FDR | Condition Difference |
|---|---|---|---|---|---|---|---|---|
| Thaps_hclust_0086 |
 |
 |
0.0000000068 |
0.01 |
0.0037 |
co2_elevated_stat_arrays | 0.206000 | -0.256 |
| Title | Cluster Plot | Dendrogram | e-value | e-value | e-value | Condition | Condition FDR | Condition Difference |
|---|---|---|---|---|---|---|---|---|
| Thaps_hclust_0165 |
 |
 |
0.00011 |
2.3 |
3.9 |
lowSi_TMEVA | 0.806000 | -0.256 |
| Title | Cluster Plot | Dendrogram | e-value | e-value | e-value | Condition | Condition FDR | Condition Difference |
|---|---|---|---|---|---|---|---|---|
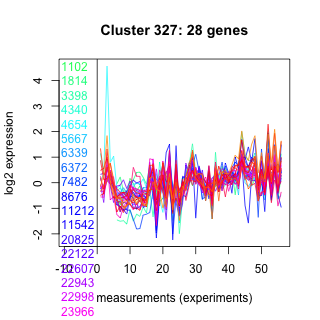
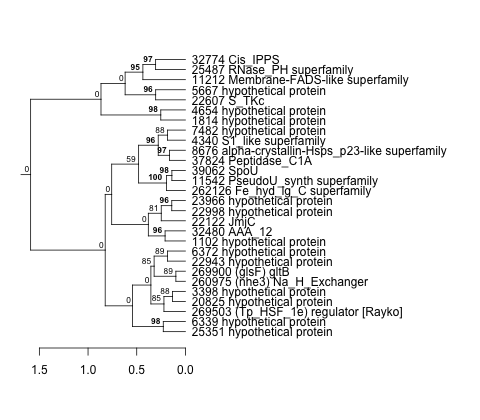
| Thaps_hclust_0327 |
 |
 |
0.0000000037 |
0.013 |
3.8 |
exponential_vs_stationary_24highlight | 0.003970 | -0.256 |
| Title | Cluster Plot | Dendrogram | e-value | e-value | e-value | Condition | Condition FDR | Condition Difference |
|---|---|---|---|---|---|---|---|---|
| Thaps_hclust_0025 |
 |
 |
0.14 |
0.45 |
4.6 |
highlight_arrays | 0.187000 | -0.256 |
| Title | Cluster Plot | Dendrogram | e-value | e-value | e-value | Condition | Condition FDR | Condition Difference |
|---|---|---|---|---|---|---|---|---|
| Thaps_hclust_0217 |
 |
 |
0.00000028 |
0.95 |
9.7 |
lowFe_KTKB_Day5 | 0.146000 | -0.256 |
| Title | Cluster Plot | Dendrogram | e-value | e-value | e-value | Condition | Condition FDR | Condition Difference |
|---|---|---|---|---|---|---|---|---|
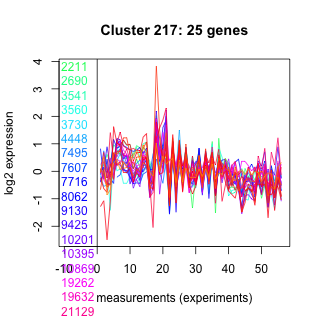
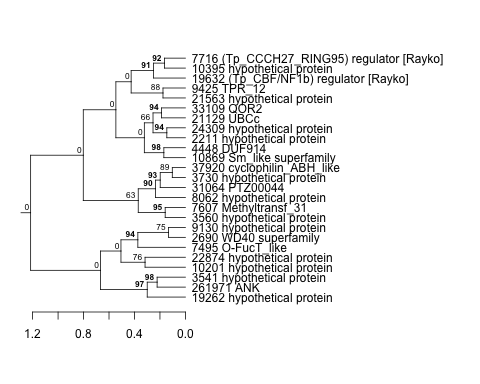
| Thaps_hclust_0298 |
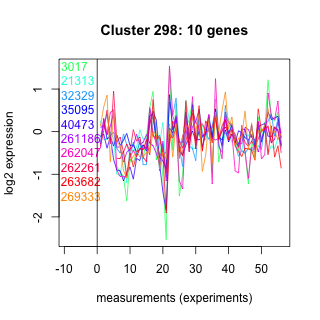 |
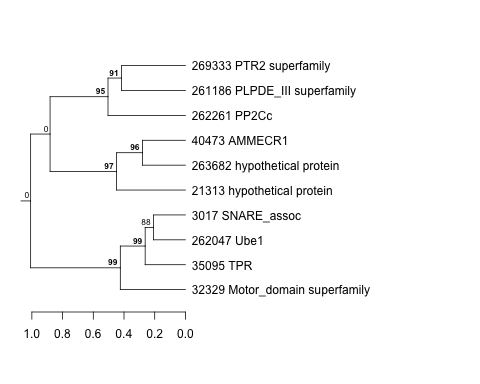 |
0.035 |
0.58 |
41 |
highlight_arrays | 0.250000 | -0.255 |
| Title | Cluster Plot | Dendrogram | e-value | e-value | e-value | Condition | Condition FDR | Condition Difference |
|---|---|---|---|---|---|---|---|---|
| Thaps_hclust_0158 |
 |
 |
0.007 |
0.55 |
1.2 |
highpH_TMEVA | 0.138000 | -0.255 |
| Title | Cluster Plot | Dendrogram | e-value | e-value | e-value | Condition | Condition FDR | Condition Difference |
|---|---|---|---|---|---|---|---|---|
| Thaps_hclust_0408 |
 |
 |
0.3 |
4.9 |
5.3 |
diel_exponential_vs_stationary | 0.153000 | -0.255 |
| Title | Cluster Plot | Dendrogram | e-value | e-value | e-value | Condition | Condition FDR | Condition Difference |
|---|---|---|---|---|---|---|---|---|
| Thaps_hclust_0220 |
 |
|
|
2.4e-19 |
3.2e-19 |
lowFe_KTKB_Day5 | 0.003410 | -0.255 |
| Title | Cluster Plot | Dendrogram | e-value | e-value | e-value | Condition | Condition FDR | Condition Difference |
|---|---|---|---|---|---|---|---|---|
| Thaps_hclust_0106 |
 |
 |
0.48 |
3.7 |
8.9 |
highlight_arrays | 0.125000 | -0.255 |
| Title | Cluster Plot | Dendrogram | e-value | e-value | e-value | Condition | Condition FDR | Condition Difference |
|---|---|---|---|---|---|---|---|---|
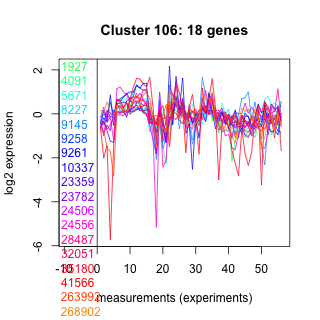
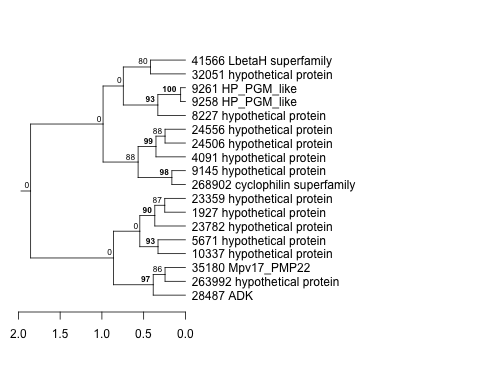
| Thaps_hclust_0219 |
 |
 |
2.8e-16 |
0.0000000055 |
0.012 |
exponential_vs_stationary_24highlight | 0.000526 | -0.255 |
| Title | Cluster Plot | Dendrogram | e-value | e-value | e-value | Condition | Condition FDR | Condition Difference |
|---|---|---|---|---|---|---|---|---|
| Thaps_hclust_0020 |
 |
 |
0.004 |
0.15 |
3.3 |
co2_elevated_stat_arrays | 0.229000 | -0.254 |
| Title | Cluster Plot | Dendrogram | e-value | e-value | e-value | Condition | Condition FDR | Condition Difference |
|---|---|---|---|---|---|---|---|---|
| Thaps_hclust_0028 |
 |
|
1.6e-27 |
6.8e-18 |
0.0000000000000078 |
lowtemp_TMEVA | 0.061100 | -0.254 |
| Title | Cluster Plot | Dendrogram | e-value | e-value | e-value | Condition | Condition FDR | Condition Difference |
|---|---|---|---|---|---|---|---|---|
| Thaps_hclust_0124 |
 |
 |
1 |
0.23 |
42 |
lowFe_KTKB_Day5 | 0.284000 | -0.254 |
| Title | Cluster Plot | Dendrogram | e-value | e-value | e-value | Condition | Condition FDR | Condition Difference |
|---|---|---|---|---|---|---|---|---|
| Thaps_hclust_0265 |
 |
 |
0.02 |
0.000051 |
27 |
lowFe_KTKB_Day5 | 0.284000 | -0.254 |