Hierarchical Clusters
Displaying 1301 - 1400 of 7500
| Title | Cluster Plot | Dendrogram | e-value | e-value | e-value | Condition | Condition FDR | Condition Difference |
|---|---|---|---|---|---|---|---|---|
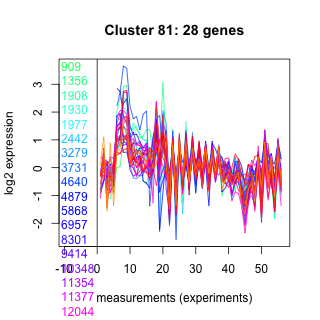
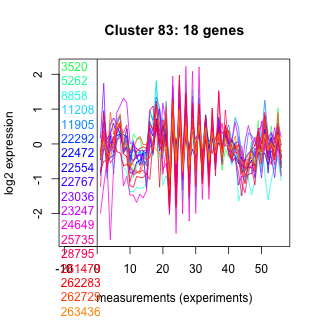
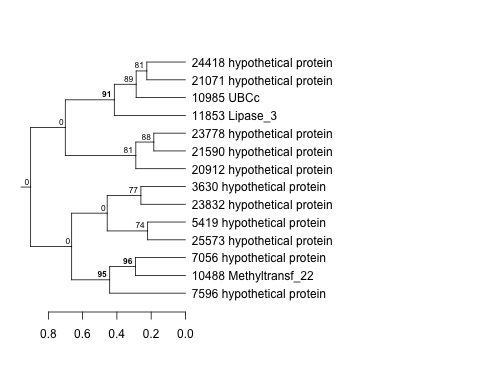
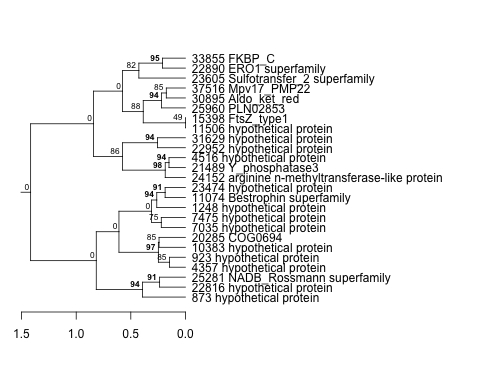
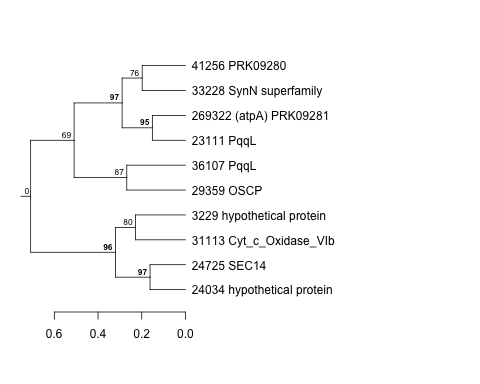
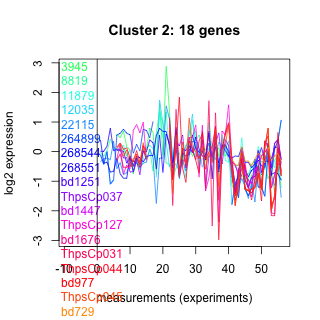
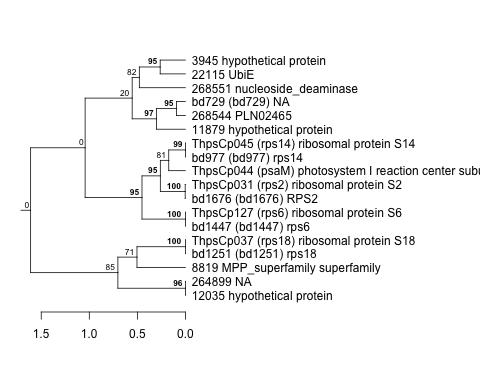
| Thaps_hclust_0081 |
 |
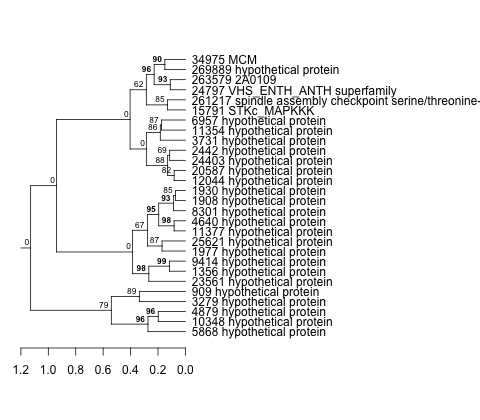 |
0.000000001 |
0.000000000027 |
0.28 |
lowtemp_TMEVA | 0.078500 | -0.365 |
| Title | Cluster Plot | Dendrogram | e-value | e-value | e-value | Condition | Condition FDR | Condition Difference |
|---|---|---|---|---|---|---|---|---|
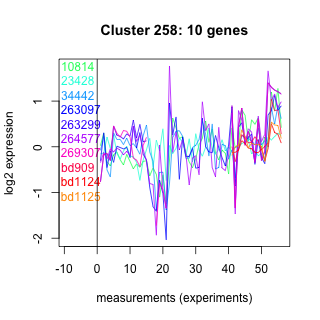
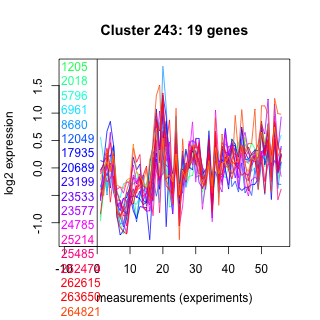
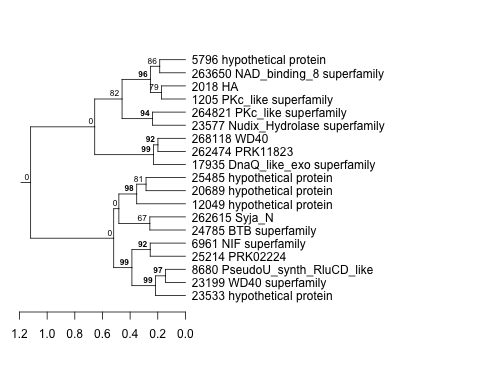
| Thaps_hclust_0258 |
 |
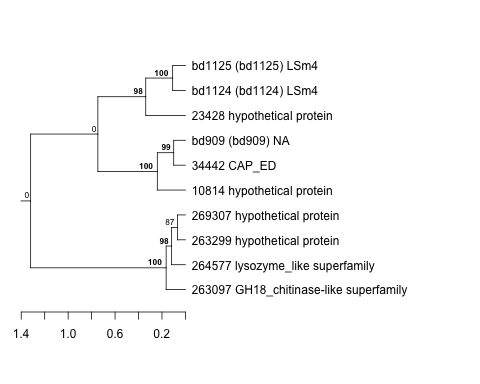 |
0.027 |
0.021 |
0.036 |
highlight_arrays | 0.094500 | -0.365 |
| Title | Cluster Plot | Dendrogram | e-value | e-value | e-value | Condition | Condition FDR | Condition Difference |
|---|---|---|---|---|---|---|---|---|
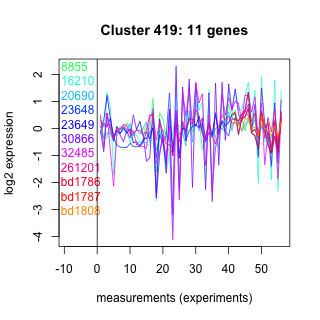
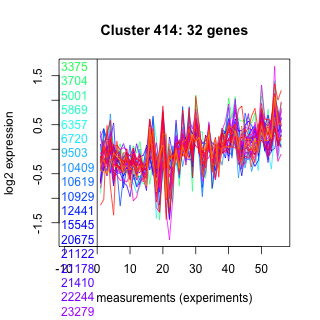
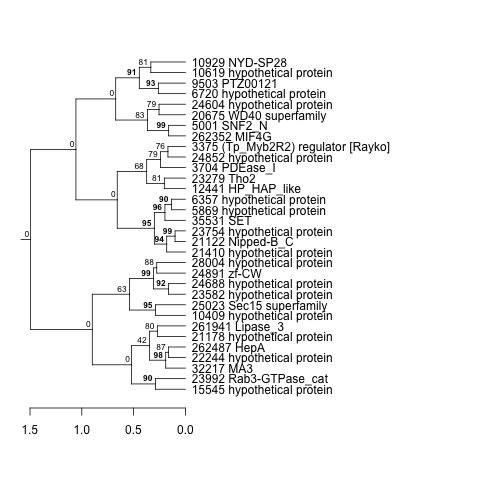
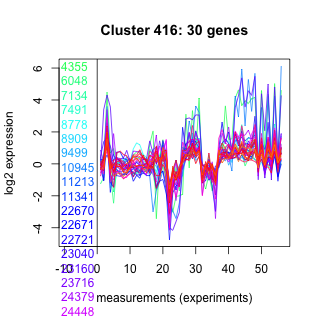
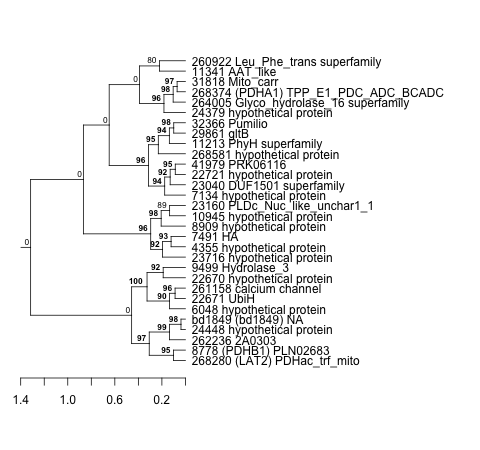
| Thaps_hclust_0419 |
 |
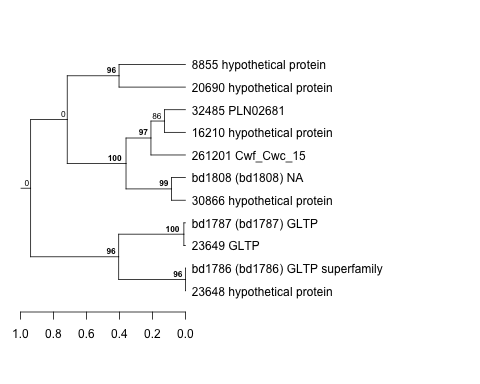 |
0.0014 |
0.00031 |
0.0014 |
co2_elevated_stat_arrays | 0.189000 | -0.364 |
| Title | Cluster Plot | Dendrogram | e-value | e-value | e-value | Condition | Condition FDR | Condition Difference |
|---|---|---|---|---|---|---|---|---|
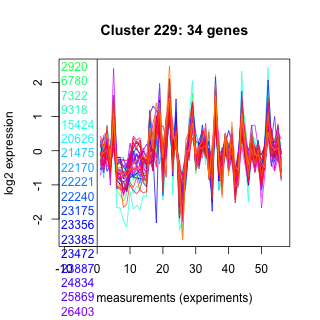
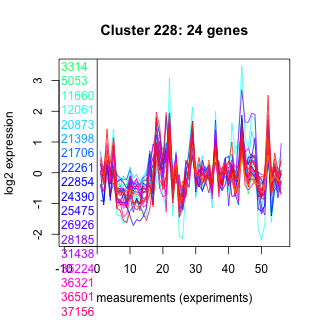
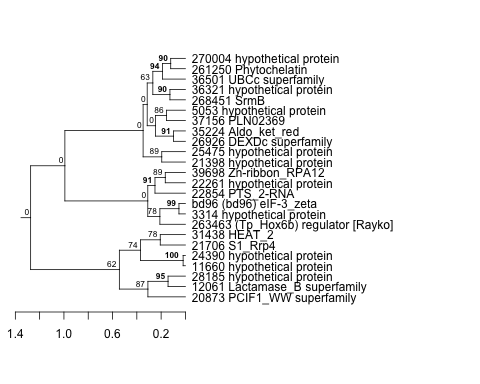
| Thaps_hclust_0229 |
 |
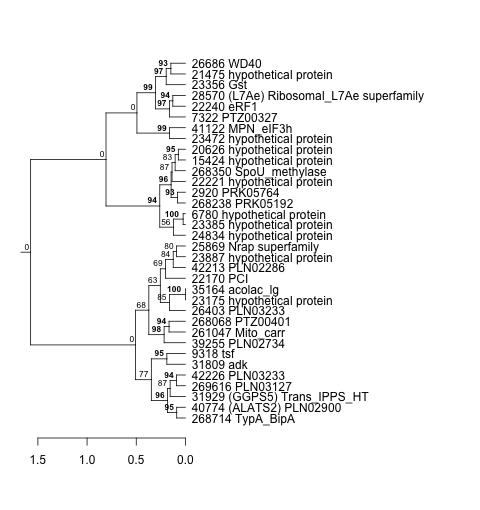 |
9.9e-18 |
0.000000000000034 |
0.0000002 |
lowSi_TMEVA | 0.500000 | -0.364 |
| Title | Cluster Plot | Dendrogram | e-value | e-value | e-value | Condition | Condition FDR | Condition Difference |
|---|---|---|---|---|---|---|---|---|
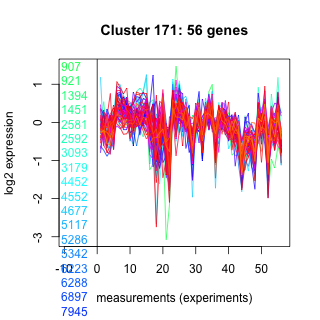
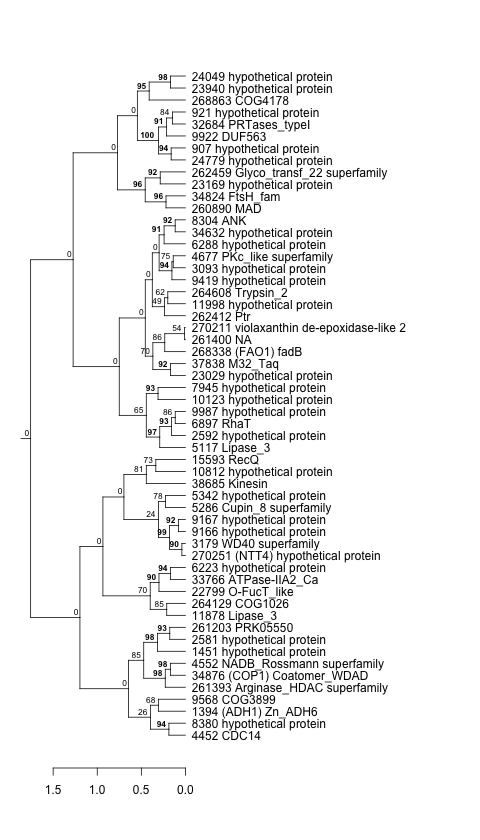
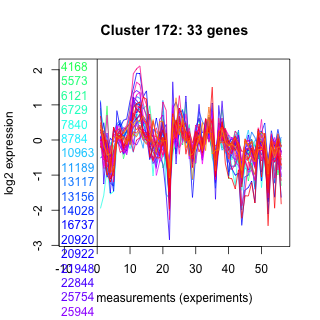
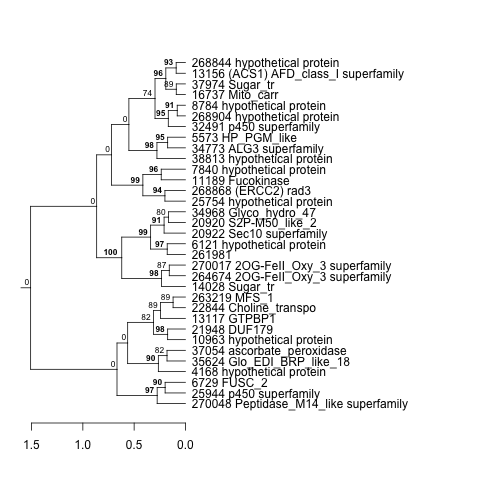
| Thaps_hclust_0171 |
 |
 |
0.0000000000052 |
0.000000000056 |
0.000000000083 |
highlight_arrays | 0.000442 | -0.364 |
| Title | Cluster Plot | Dendrogram | e-value | e-value | e-value | Condition | Condition FDR | Condition Difference |
|---|---|---|---|---|---|---|---|---|
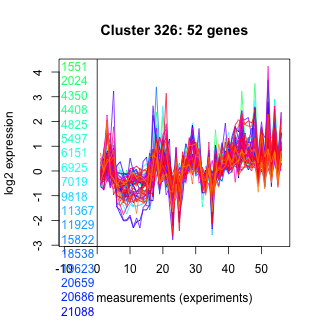
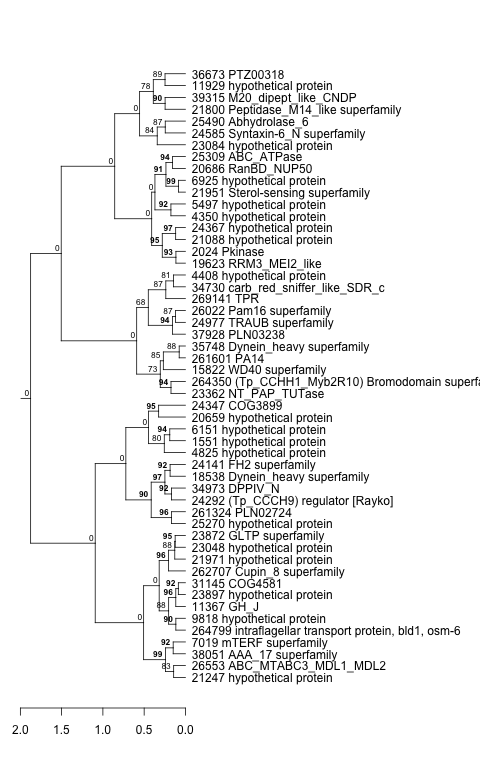
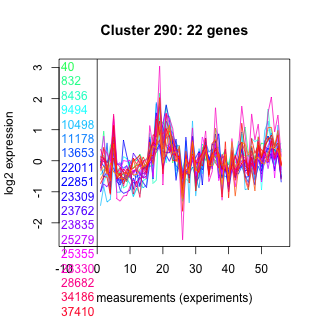
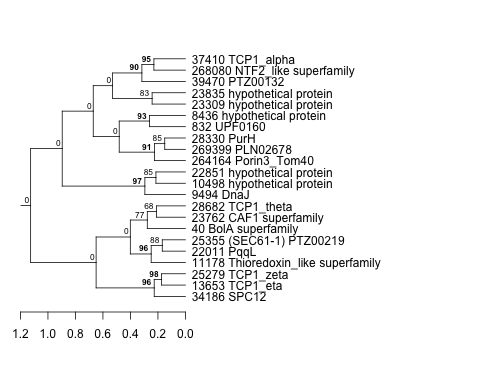
| Thaps_hclust_0326 |
 |
 |
0.000000000000042 |
0.00000000011 |
0.00000051 |
exponential_vs_stationary_24highlight | 0.000526 | -0.363 |
| Title | Cluster Plot | Dendrogram | e-value | e-value | e-value | Condition | Condition FDR | Condition Difference |
|---|---|---|---|---|---|---|---|---|
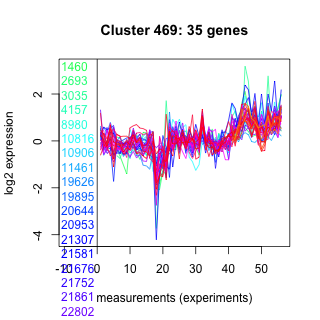
| Thaps_hclust_0469 |
 |
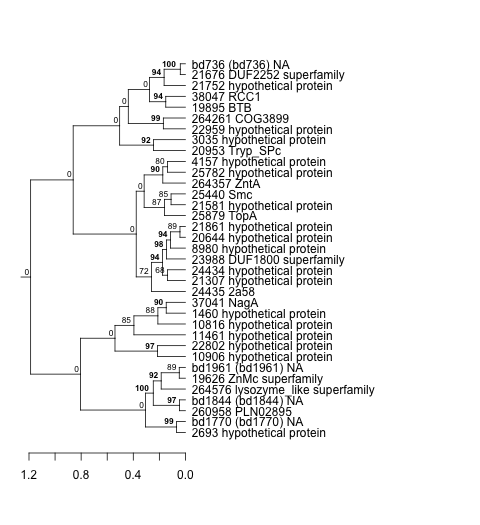 |
0.000013 |
0.00011 |
0.00029 |
exponential_vs_stationary_24light | 0.147000 | -0.363 |
| Thaps_hclust_0469 |
|
|
0.000013 |
0.00011 |
0.00029 |
lowFe_KTKB_Day5 | 0.010200 | -0.353 |
| Title | Cluster Plot | Dendrogram | e-value | e-value | e-value | Condition | Condition FDR | Condition Difference |
|---|---|---|---|---|---|---|---|---|
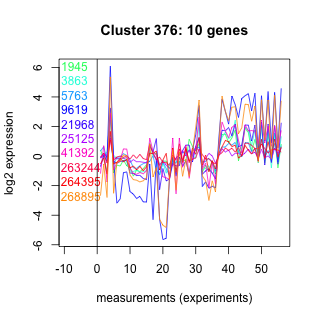
| Thaps_hclust_0376 |
 |
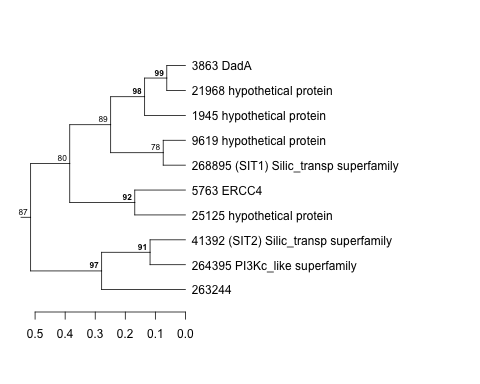 |
0.42 |
3.3 |
2.4 |
co2_elevated_expo_arrays | 0.061000 | -0.363 |
| Title | Cluster Plot | Dendrogram | e-value | e-value | e-value | Condition | Condition FDR | Condition Difference |
|---|---|---|---|---|---|---|---|---|
| Thaps_hclust_0045 |
 |
 |
0.0000000028 |
0.0075 |
5.4 |
lowN_TMEVA | 0.310000 | -0.362 |
| Title | Cluster Plot | Dendrogram | e-value | e-value | e-value | Condition | Condition FDR | Condition Difference |
|---|---|---|---|---|---|---|---|---|
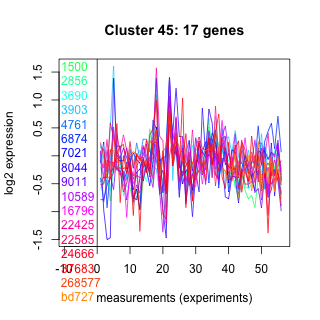
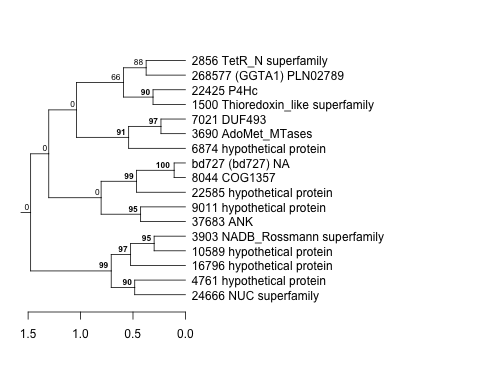
| Thaps_hclust_0439 |
 |
 |
0.00085 |
0.014 |
0.032 |
lowSi_TMEVA | 0.557000 | -0.362 |
| Title | Cluster Plot | Dendrogram | e-value | e-value | e-value | Condition | Condition FDR | Condition Difference |
|---|---|---|---|---|---|---|---|---|
| Thaps_hclust_0288 |
 |
 |
0.032 |
0.0067 |
0.047 |
highpH_TMEVA | 0.042600 | -0.362 |
| Title | Cluster Plot | Dendrogram | e-value | e-value | e-value | Condition | Condition FDR | Condition Difference |
|---|---|---|---|---|---|---|---|---|
| Thaps_hclust_0001 |
 |
 |
0.0033 |
0.052 |
2 |
highlight_arrays | 0.019800 | -0.362 |
| Title | Cluster Plot | Dendrogram | e-value | e-value | e-value | Condition | Condition FDR | Condition Difference |
|---|---|---|---|---|---|---|---|---|
| Thaps_hclust_0064 |
 |
 |
0.000000012 |
0.00000073 |
0.0000002 |
lowN_TMEVA | 0.341000 | -0.362 |
| Thaps_hclust_0064 |
|
|
0.000000012 |
0.00000073 |
0.0000002 |
BaP | 0.153000 | -0.346 |
| Title | Cluster Plot | Dendrogram | e-value | e-value | e-value | Condition | Condition FDR | Condition Difference |
|---|---|---|---|---|---|---|---|---|
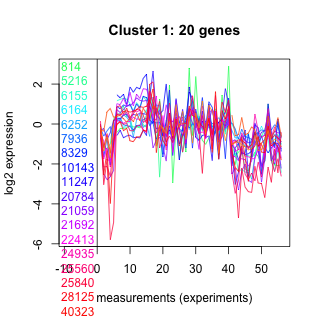
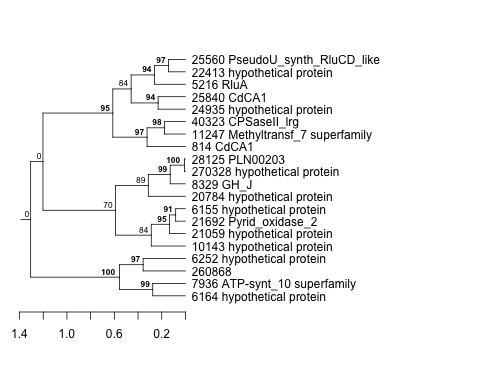
| Thaps_hclust_0364 |
 |
 |
4.5 |
28 |
590 |
exponential_vs_stationary_24highlight | 0.012200 | -0.361 |
| Title | Cluster Plot | Dendrogram | e-value | e-value | e-value | Condition | Condition FDR | Condition Difference |
|---|---|---|---|---|---|---|---|---|
| Thaps_hclust_0163 |
 |
 |
2.5 |
63 |
210 |
lowSi_TMEVA | 0.638000 | -0.361 |
| Title | Cluster Plot | Dendrogram | e-value | e-value | e-value | Condition | Condition FDR | Condition Difference |
|---|---|---|---|---|---|---|---|---|
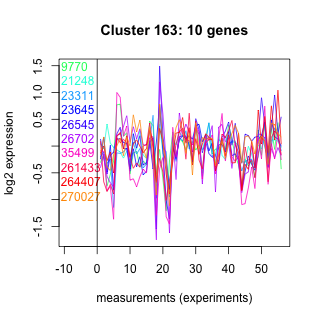
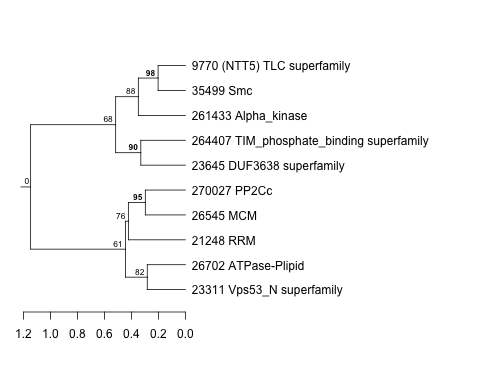
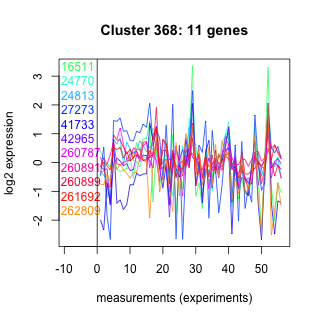
| Thaps_hclust_0368 |
 |
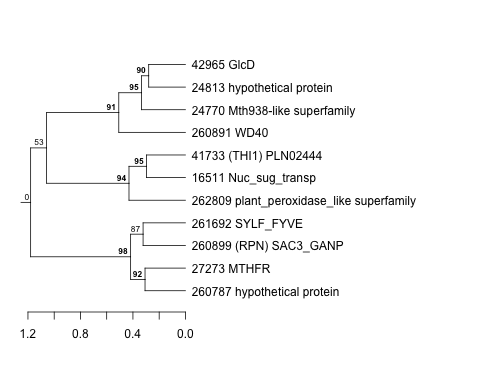 |
0.0078 |
2.5 |
3.1 |
highpH_TMEVA | 0.079900 | -0.361 |
| Title | Cluster Plot | Dendrogram | e-value | e-value | e-value | Condition | Condition FDR | Condition Difference |
|---|---|---|---|---|---|---|---|---|
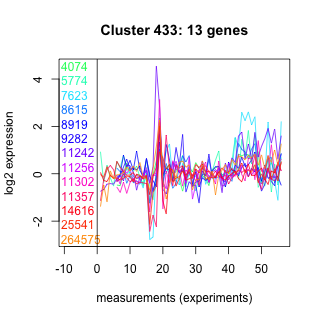
| Thaps_hclust_0433 |
 |
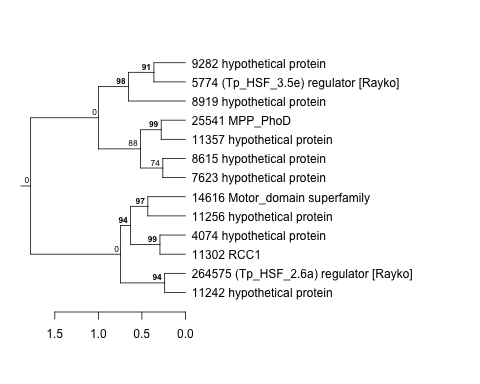 |
14 |
54 |
440 |
lowFe_TMEVA | 0.257000 | -0.361 |
| Title | Cluster Plot | Dendrogram | e-value | e-value | e-value | Condition | Condition FDR | Condition Difference |
|---|---|---|---|---|---|---|---|---|
| Thaps_hclust_0304 |
 |
 |
0.16 |
1.3 |
16 |
lowSi_TMEVA | 0.486000 | -0.36 |
| Title | Cluster Plot | Dendrogram | e-value | e-value | e-value | Condition | Condition FDR | Condition Difference |
|---|---|---|---|---|---|---|---|---|
| Thaps_hclust_0255 |
 |
 |
1.4e-28 |
0.0000000000000024 |
0.000000029 |
exponential_vs_stationary_24highlight | 0.002870 | -0.36 |
| Title | Cluster Plot | Dendrogram | e-value | e-value | e-value | Condition | Condition FDR | Condition Difference |
|---|---|---|---|---|---|---|---|---|
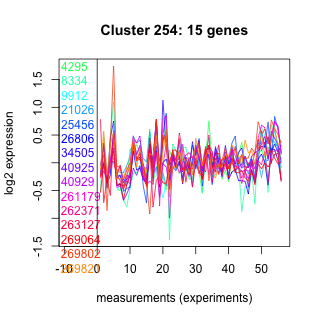
| Thaps_hclust_0254 |
 |
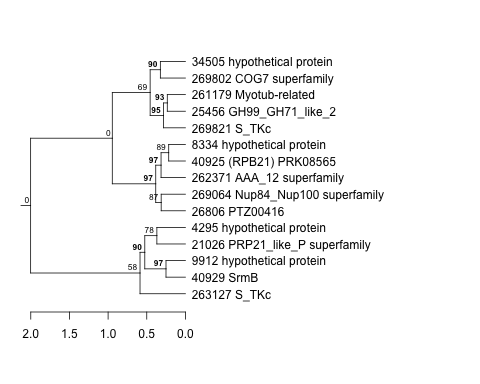 |
0.00045 |
0.0045 |
5.8 |
lowN_TMEVA | 0.339000 | -0.36 |
| Title | Cluster Plot | Dendrogram | e-value | e-value | e-value | Condition | Condition FDR | Condition Difference |
|---|---|---|---|---|---|---|---|---|
| Thaps_hclust_0016 |
 |
 |
0.000000000083 |
0.00000025 |
0.00000028 |
highlight_arrays | 0.001240 | -0.36 |
| Title | Cluster Plot | Dendrogram | e-value | e-value | e-value | Condition | Condition FDR | Condition Difference |
|---|---|---|---|---|---|---|---|---|
| Thaps_hclust_0075 |
 |
 |
0.069 |
53 |
33 |
lowSi_TMEVA | 0.631000 | -0.359 |
| Title | Cluster Plot | Dendrogram | e-value | e-value | e-value | Condition | Condition FDR | Condition Difference |
|---|---|---|---|---|---|---|---|---|
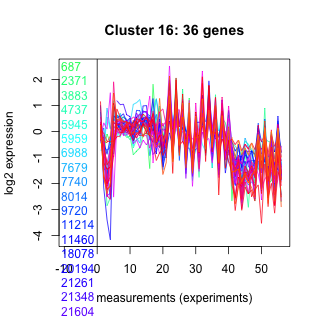
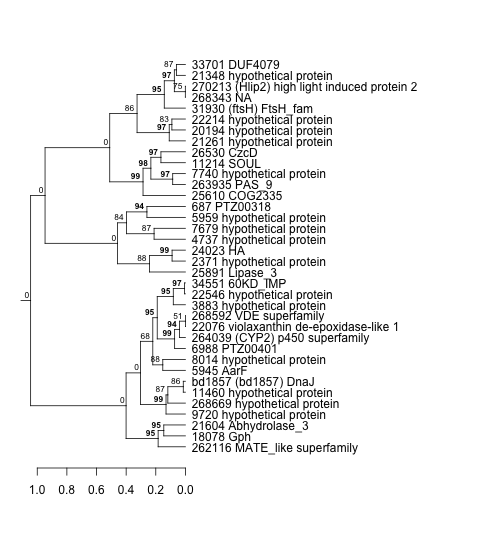
| Thaps_hclust_0412 |
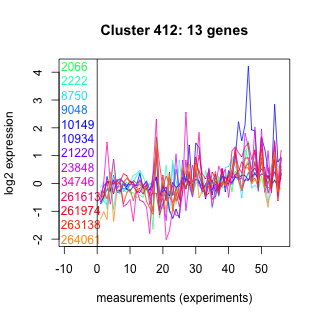 |
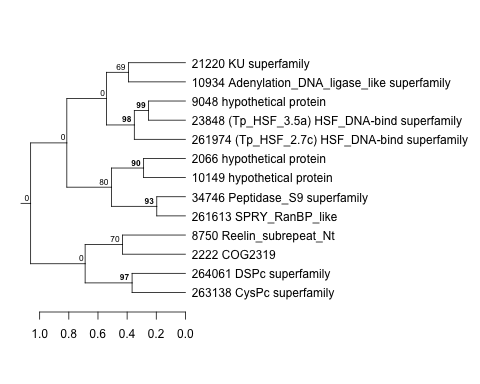 |
0.39 |
17 |
2.9 |
lowFe_KTKB_Day5 | 0.157000 | -0.359 |
| Thaps_hclust_0412 |
|
|
0.39 |
17 |
2.9 |
diel_exponential_vs_stationary | 0.109000 | -0.356 |
| Title | Cluster Plot | Dendrogram | e-value | e-value | e-value | Condition | Condition FDR | Condition Difference |
|---|---|---|---|---|---|---|---|---|
| Thaps_hclust_0066 |
 |
 |
0.0000000000000019 |
0.00000025 |
0.00000047 |
highpH_TMEVA | 0.004020 | -0.359 |
| Title | Cluster Plot | Dendrogram | e-value | e-value | e-value | Condition | Condition FDR | Condition Difference |
|---|---|---|---|---|---|---|---|---|
| Thaps_hclust_0158 |
 |
 |
0.007 |
0.55 |
1.2 |
lowFe_KTKB_Day3 | 0.165000 | -0.359 |
| Title | Cluster Plot | Dendrogram | e-value | e-value | e-value | Condition | Condition FDR | Condition Difference |
|---|---|---|---|---|---|---|---|---|
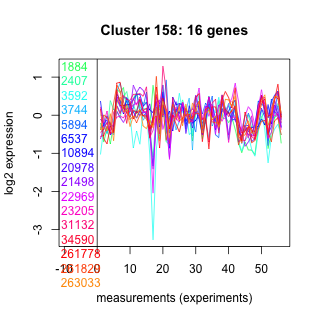
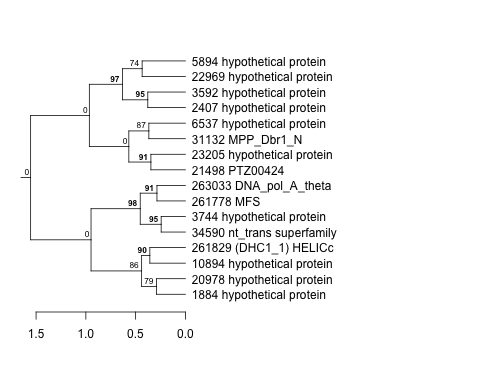
| Thaps_hclust_0472 |
 |
 |
0.00000011 |
0.000015 |
0.00015 |
highlight_arrays | 0.020300 | -0.359 |
| Title | Cluster Plot | Dendrogram | e-value | e-value | e-value | Condition | Condition FDR | Condition Difference |
|---|---|---|---|---|---|---|---|---|
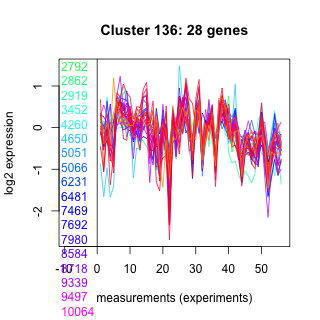
| Thaps_hclust_0136 |
 |
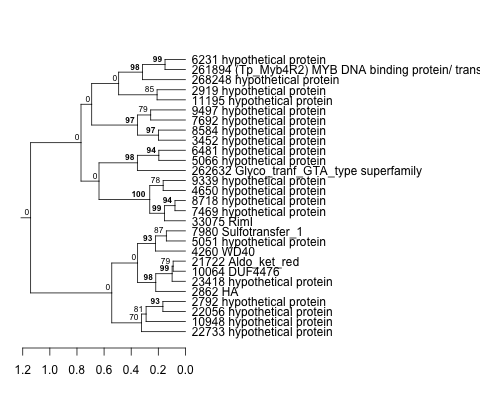 |
0.0034 |
0.034 |
340 |
lowSi_TMEVA | 0.518000 | -0.359 |
| Thaps_hclust_0136 |
|
|
0.0034 |
0.034 |
340 |
lowtemp_TMEVA | 0.086800 | -0.356 |
| Title | Cluster Plot | Dendrogram | e-value | e-value | e-value | Condition | Condition FDR | Condition Difference |
|---|---|---|---|---|---|---|---|---|
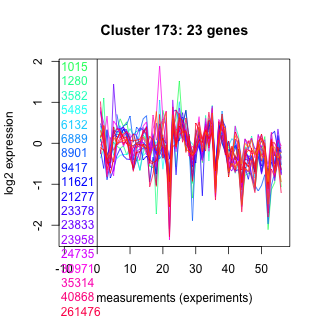
| Thaps_hclust_0173 |
 |
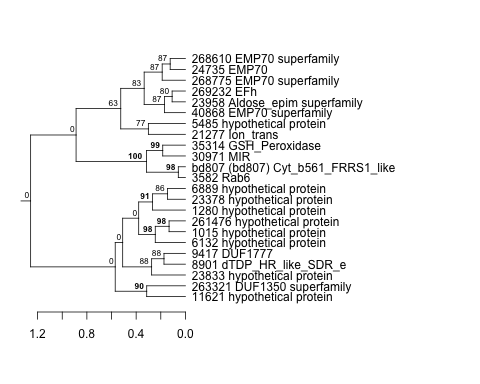 |
0.013 |
0.83 |
0.45 |
lowSi_TMEVA | 0.557000 | -0.358 |
| Title | Cluster Plot | Dendrogram | e-value | e-value | e-value | Condition | Condition FDR | Condition Difference |
|---|---|---|---|---|---|---|---|---|
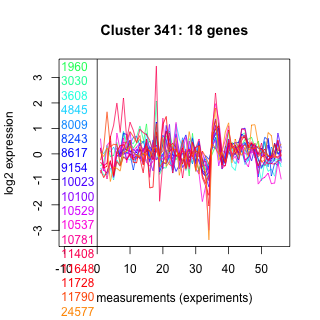
| Thaps_hclust_0341 |
 |
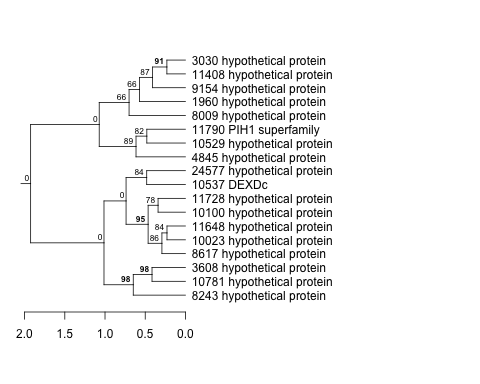 |
74 |
110 |
130 |
lowtemp_TMEVA | 0.185000 | -0.358 |
| Title | Cluster Plot | Dendrogram | e-value | e-value | e-value | Condition | Condition FDR | Condition Difference |
|---|---|---|---|---|---|---|---|---|
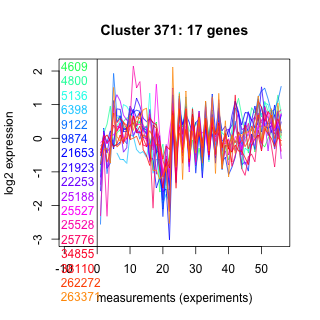
| Thaps_hclust_0371 |
 |
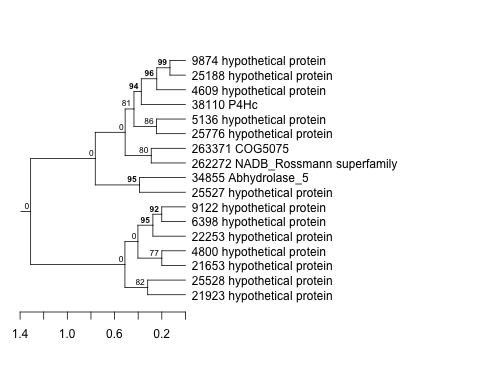 |
0.0051 |
0.11 |
1.1 |
lowFe_KTKB_Day5 | 0.093800 | -0.358 |
| Title | Cluster Plot | Dendrogram | e-value | e-value | e-value | Condition | Condition FDR | Condition Difference |
|---|---|---|---|---|---|---|---|---|
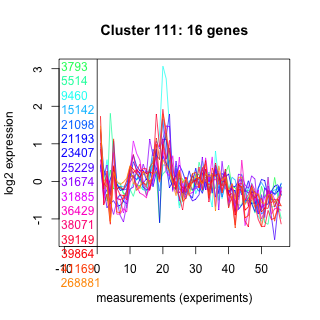
| Thaps_hclust_0111 |
 |
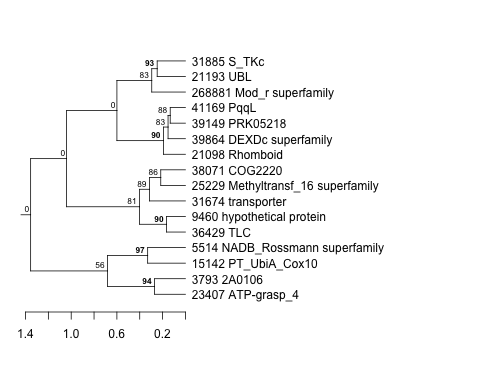 |
0.00032 |
0.0074 |
0.8 |
lowSi_TMEVA | 0.613000 | -0.357 |
| Title | Cluster Plot | Dendrogram | e-value | e-value | e-value | Condition | Condition FDR | Condition Difference |
|---|---|---|---|---|---|---|---|---|
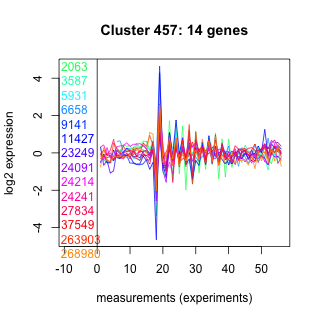
| Thaps_hclust_0457 |
 |
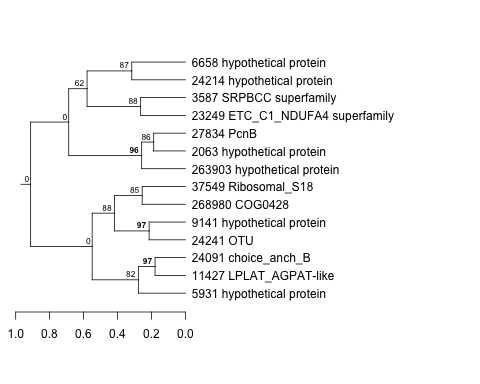 |
0.0000081 |
0.1 |
0.53 |
lowSi_TMEVA | 0.614000 | -0.357 |
| Title | Cluster Plot | Dendrogram | e-value | e-value | e-value | Condition | Condition FDR | Condition Difference |
|---|---|---|---|---|---|---|---|---|
| Thaps_hclust_0004 |
 |
 |
0.000000074 |
0.0000031 |
0.0000044 |
lowN_TMEVA | 0.179000 | -0.357 |
| Title | Cluster Plot | Dendrogram | e-value | e-value | e-value | Condition | Condition FDR | Condition Difference |
|---|---|---|---|---|---|---|---|---|
| Thaps_hclust_0178 |
 |
 |
0.0000000019 |
0.00000047 |
0.000019 |
co2_elevated_stat_arrays | 0.128000 | -0.357 |
| Title | Cluster Plot | Dendrogram | e-value | e-value | e-value | Condition | Condition FDR | Condition Difference |
|---|---|---|---|---|---|---|---|---|
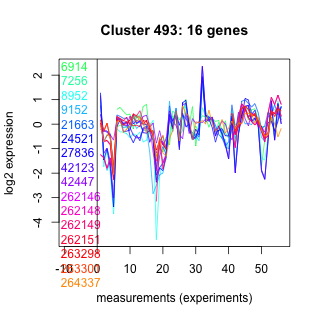
| Thaps_hclust_0493 |
 |
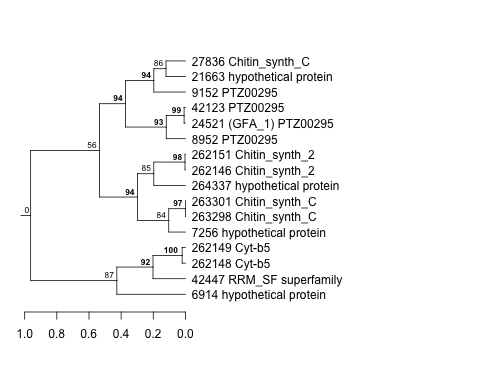 |
0.00000036 |
0.0000009 |
0.000056 |
co2_elevated_expo_arrays | 0.012300 | -0.356 |
| Title | Cluster Plot | Dendrogram | e-value | e-value | e-value | Condition | Condition FDR | Condition Difference |
|---|---|---|---|---|---|---|---|---|
| Thaps_hclust_0491 |
 |
 |
0.35 |
17 |
52 |
lowFe_TMEVA | 0.300000 | -0.356 |
| Title | Cluster Plot | Dendrogram | e-value | e-value | e-value | Condition | Condition FDR | Condition Difference |
|---|---|---|---|---|---|---|---|---|
| Thaps_hclust_0343 |
 |
 |
9.7e-16 |
0.000000023 |
0.0000000024 |
lowtemp_TMEVA | 0.088300 | -0.356 |
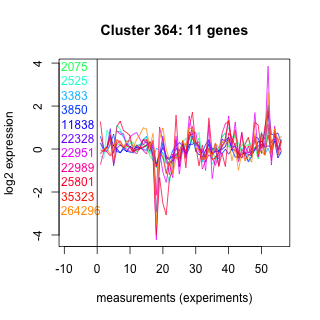
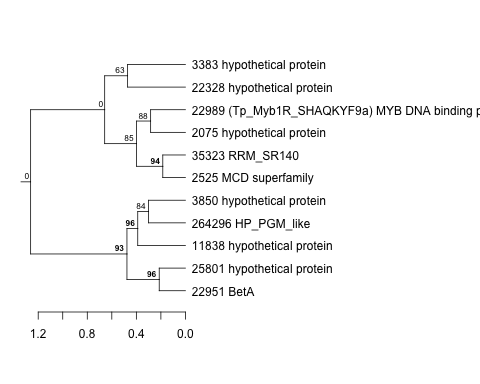
| Title | Cluster Plot | Dendrogram | e-value | e-value | e-value | Condition | Condition FDR | Condition Difference |
|---|---|---|---|---|---|---|---|---|
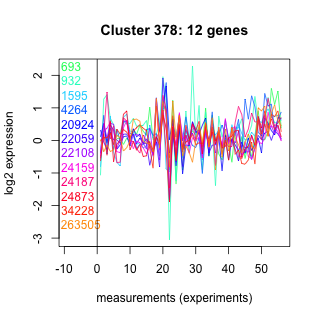
| Thaps_hclust_0378 |
 |
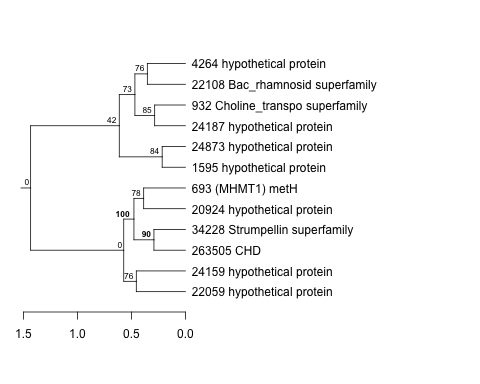 |
0.0003 |
210 |
10 |
highpH_TMEVA | 0.074500 | -0.356 |
| Title | Cluster Plot | Dendrogram | e-value | e-value | e-value | Condition | Condition FDR | Condition Difference |
|---|---|---|---|---|---|---|---|---|
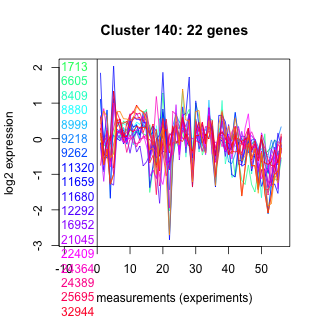
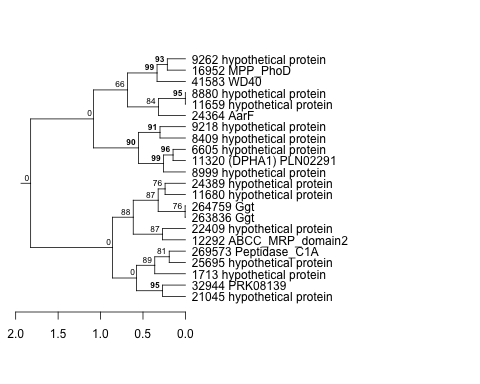
| Thaps_hclust_0140 |
 |
 |
0.0000000084 |
0.000091 |
0.0000072 |
lowFe_KTKB_Day3 | 0.102000 | -0.356 |
| Title | Cluster Plot | Dendrogram | e-value | e-value | e-value | Condition | Condition FDR | Condition Difference |
|---|---|---|---|---|---|---|---|---|
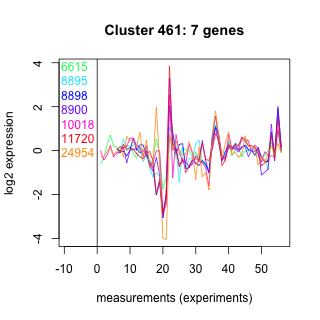
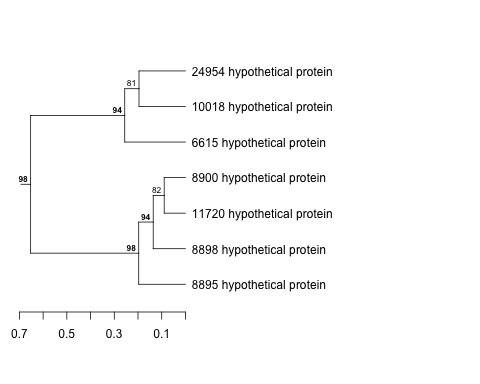
| Thaps_hclust_0461 |
 |
 |
0.00000000082 |
0.01 |
0.079 |
lowFe_TMEVA | 0.383000 | -0.356 |
| Title | Cluster Plot | Dendrogram | e-value | e-value | e-value | Condition | Condition FDR | Condition Difference |
|---|---|---|---|---|---|---|---|---|
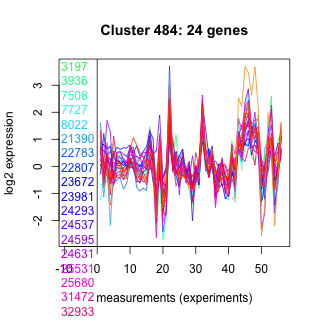
| Thaps_hclust_0484 |
 |
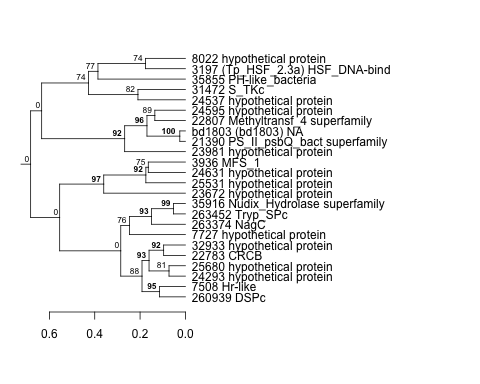 |
0.024 |
0.26 |
5.1 |
diel_light_vs_dark | 0.051600 | -0.355 |
| Title | Cluster Plot | Dendrogram | e-value | e-value | e-value | Condition | Condition FDR | Condition Difference |
|---|---|---|---|---|---|---|---|---|
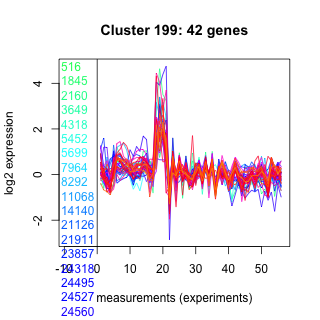
| Thaps_hclust_0199 |
 |
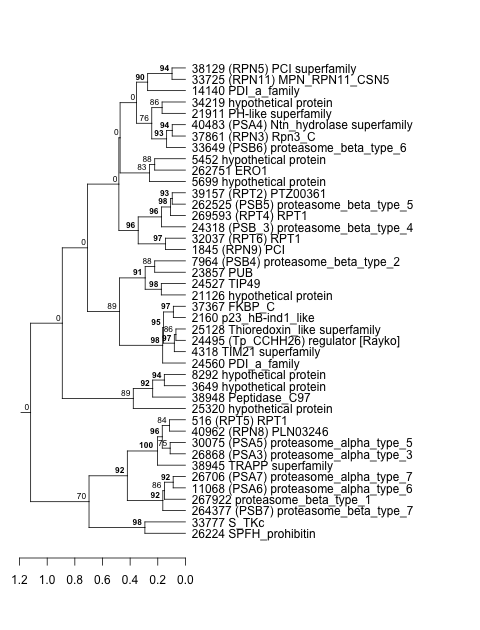 |
2.7e-19 |
0.000000062 |
0.00000065 |
lowSi_TMEVA | 0.478000 | -0.355 |
| Title | Cluster Plot | Dendrogram | e-value | e-value | e-value | Condition | Condition FDR | Condition Difference |
|---|---|---|---|---|---|---|---|---|
| Thaps_hclust_0414 |
 |
 |
0.0000000000028 |
0.00000026 |
0.000019 |
BaP | 0.029900 | -0.355 |
| Title | Cluster Plot | Dendrogram | e-value | e-value | e-value | Condition | Condition FDR | Condition Difference |
|---|---|---|---|---|---|---|---|---|
| Thaps_hclust_0404 |
 |
 |
0.007 |
0.025 |
0.049 |
lowSi_TMEVA | 0.549000 | -0.355 |
| Thaps_hclust_0404 |
|
|
0.007 |
0.025 |
0.049 |
lowtemp_TMEVA | 0.119000 | -0.352 |
| Title | Cluster Plot | Dendrogram | e-value | e-value | e-value | Condition | Condition FDR | Condition Difference |
|---|---|---|---|---|---|---|---|---|
| Thaps_hclust_0083 |
 |
 |
0.0039 |
6.3 |
14 |
highlight_arrays | 0.028100 | -0.355 |
| Thaps_hclust_0083 |
|
|
0.0039 |
6.3 |
14 |
diel_exponential_vs_stationary | 0.058500 | -0.347 |
| Title | Cluster Plot | Dendrogram | e-value | e-value | e-value | Condition | Condition FDR | Condition Difference |
|---|---|---|---|---|---|---|---|---|
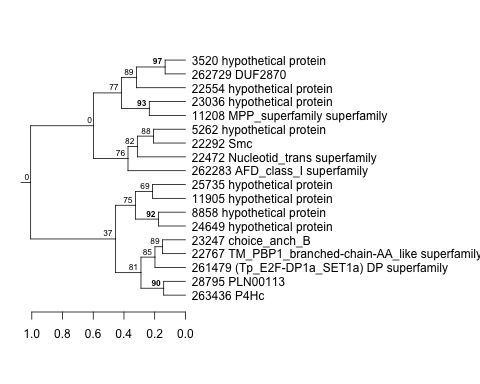
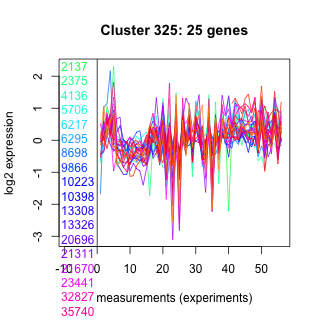
| Thaps_hclust_0325 |
 |
 |
0.00000000000002 |
0.000000076 |
0.17 |
diel_exponential_vs_stationary | 0.017700 | -0.355 |
| Title | Cluster Plot | Dendrogram | e-value | e-value | e-value | Condition | Condition FDR | Condition Difference |
|---|---|---|---|---|---|---|---|---|
| Thaps_hclust_0164 |
 |
 |
13 |
58 |
65 |
exponential_vs_stationary_24light | 0.399000 | -0.355 |
| Title | Cluster Plot | Dendrogram | e-value | e-value | e-value | Condition | Condition FDR | Condition Difference |
|---|---|---|---|---|---|---|---|---|
| Thaps_hclust_0046 |
 |
 |
0.00000051 |
0.000067 |
0.29 |
lowSi_TMEVA | 0.557000 | -0.354 |
| Title | Cluster Plot | Dendrogram | e-value | e-value | e-value | Condition | Condition FDR | Condition Difference |
|---|---|---|---|---|---|---|---|---|
| Thaps_hclust_0465 |
 |
 |
0.011 |
0.053 |
0.75 |
lowFe_KTKB_Day5 | 0.022100 | -0.354 |
| Title | Cluster Plot | Dendrogram | e-value | e-value | e-value | Condition | Condition FDR | Condition Difference |
|---|---|---|---|---|---|---|---|---|
| Thaps_hclust_0253 |
 |
 |
1.5 |
61 |
370 |
co2_elevated_stat_arrays | 0.161000 | -0.354 |
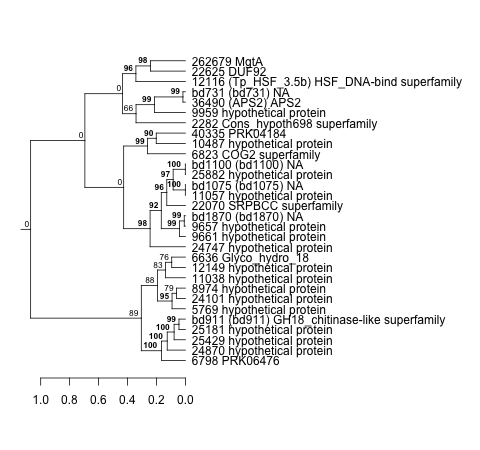
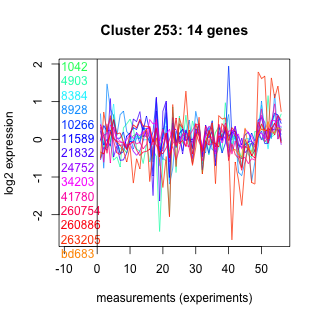
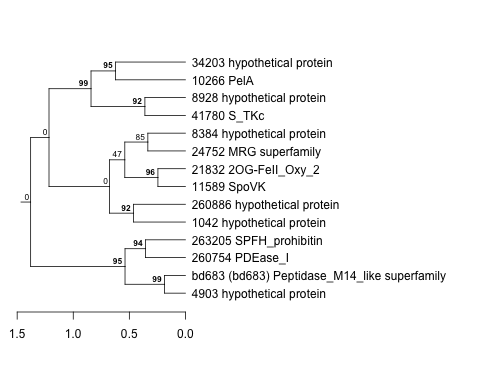
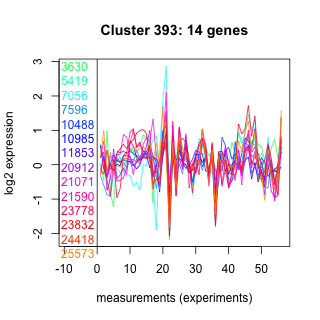
| Title | Cluster Plot | Dendrogram | e-value | e-value | e-value | Condition | Condition FDR | Condition Difference |
|---|---|---|---|---|---|---|---|---|
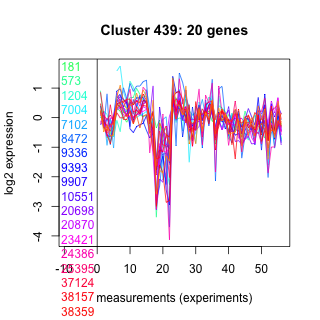
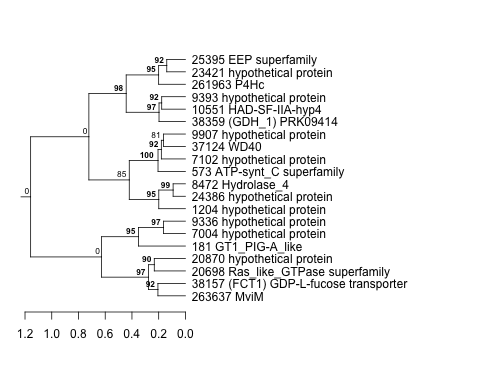
| Thaps_hclust_0393 |
 |
 |
2 |
16 |
16 |
exponential_vs_stationary_24light | 0.346000 | -0.354 |
| Title | Cluster Plot | Dendrogram | e-value | e-value | e-value | Condition | Condition FDR | Condition Difference |
|---|---|---|---|---|---|---|---|---|
| Thaps_hclust_0161 |
 |
 |
1.8 |
13 |
18 |
exponential_vs_stationary_24light | 0.449000 | -0.354 |
| Thaps_hclust_0161 |
|
|
1.8 |
13 |
18 |
lowSi_TMEVA | 0.663000 | -0.351 |
| Thaps_hclust_0161 |
|
|
1.8 |
13 |
18 |
lowtemp_TMEVA | 0.339000 | -0.35 |
| Title | Cluster Plot | Dendrogram | e-value | e-value | e-value | Condition | Condition FDR | Condition Difference |
|---|---|---|---|---|---|---|---|---|
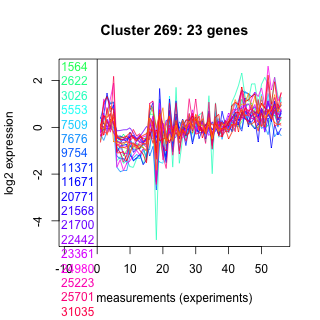
| Thaps_hclust_0269 |
 |
 |
0.0025 |
0.032 |
0.077 |
exponential_vs_stationary_24light | 0.235000 | -0.353 |
| Title | Cluster Plot | Dendrogram | e-value | e-value | e-value | Condition | Condition FDR | Condition Difference |
|---|---|---|---|---|---|---|---|---|
| Thaps_hclust_0427 |
 |
 |
0.0000022 |
8.8 |
40 |
exponential_vs_stationary_24light | 0.230000 | -0.353 |
| Title | Cluster Plot | Dendrogram | e-value | e-value | e-value | Condition | Condition FDR | Condition Difference |
|---|---|---|---|---|---|---|---|---|
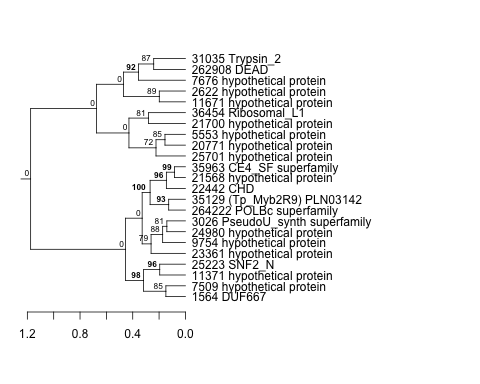
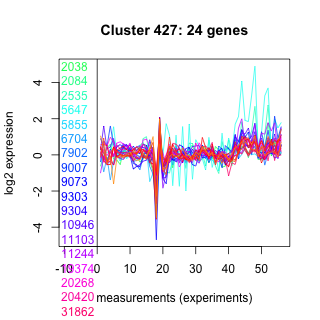
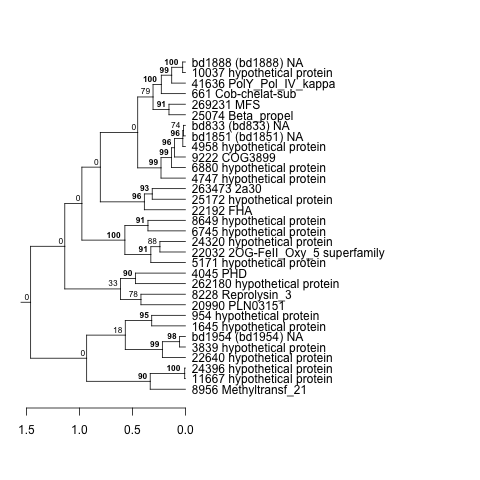
| Thaps_hclust_0331 |
 |
 |
0.000000000011 |
20 |
1600 |
highpH_TMEVA | 0.006190 | -0.352 |
| Title | Cluster Plot | Dendrogram | e-value | e-value | e-value | Condition | Condition FDR | Condition Difference |
|---|---|---|---|---|---|---|---|---|
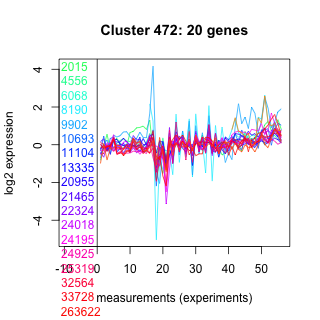
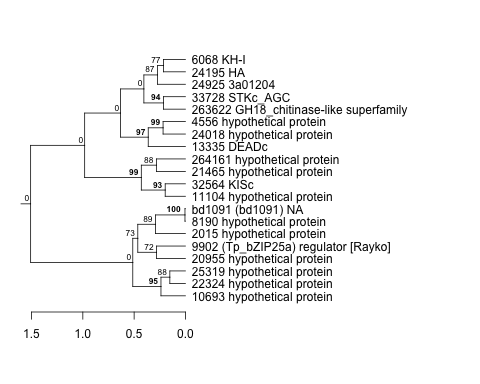
| Thaps_hclust_0500 |
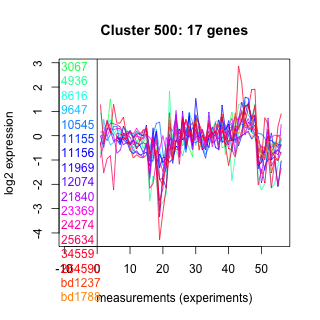 |
 |
0.91 |
14 |
30 |
diel_light_vs_dark | 0.108000 | -0.352 |
| Title | Cluster Plot | Dendrogram | e-value | e-value | e-value | Condition | Condition FDR | Condition Difference |
|---|---|---|---|---|---|---|---|---|
| Thaps_hclust_0460 |
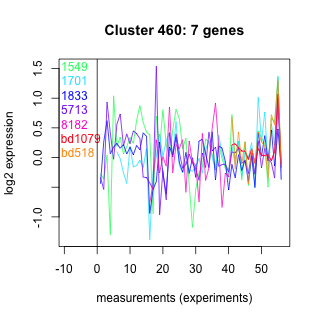 |
 |
0.0073 |
0.0055 |
0.63 |
highpH_TMEVA | 0.165000 | -0.352 |
| Title | Cluster Plot | Dendrogram | e-value | e-value | e-value | Condition | Condition FDR | Condition Difference |
|---|---|---|---|---|---|---|---|---|
| Thaps_hclust_0332 |
 |
 |
0.000000055 |
0.0000013 |
0.0037 |
highpH_TMEVA | 0.006190 | -0.351 |
| Title | Cluster Plot | Dendrogram | e-value | e-value | e-value | Condition | Condition FDR | Condition Difference |
|---|---|---|---|---|---|---|---|---|
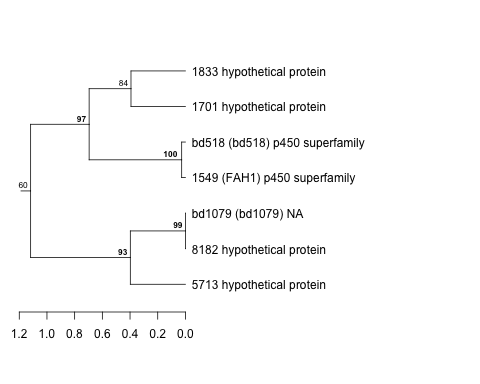
| Thaps_hclust_0192 |
 |
 |
0.000012 |
0.017 |
1.3 |
lowFe_TMEVA | 0.232000 | -0.351 |
| Title | Cluster Plot | Dendrogram | e-value | e-value | e-value | Condition | Condition FDR | Condition Difference |
|---|---|---|---|---|---|---|---|---|
| Thaps_hclust_0447 |
 |
 |
0.0005 |
0.0031 |
0.0041 |
lowFe_KTKB_Day5 | 0.023600 | -0.351 |
| Title | Cluster Plot | Dendrogram | e-value | e-value | e-value | Condition | Condition FDR | Condition Difference |
|---|---|---|---|---|---|---|---|---|
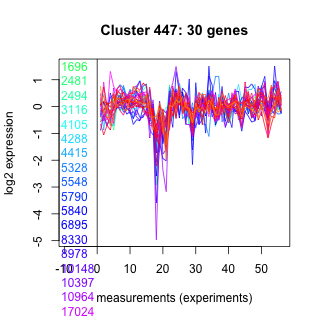
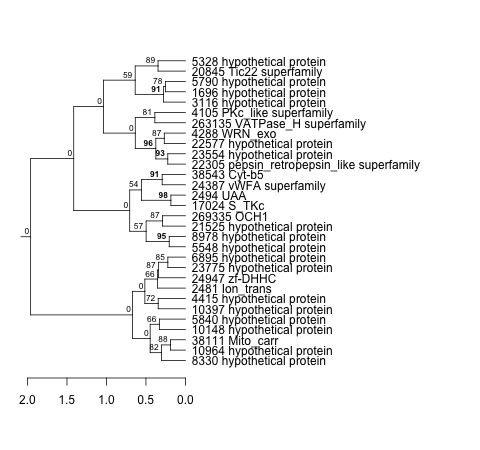
| Thaps_hclust_0410 |
 |
 |
0.065 |
0.56 |
0.36 |
lowtemp_TMEVA | 0.091300 | -0.351 |
| Title | Cluster Plot | Dendrogram | e-value | e-value | e-value | Condition | Condition FDR | Condition Difference |
|---|---|---|---|---|---|---|---|---|
| Thaps_hclust_0131 |
 |
 |
260 |
48 |
370 |
lowN_TMEVA | 0.411000 | -0.351 |
| Title | Cluster Plot | Dendrogram | e-value | e-value | e-value | Condition | Condition FDR | Condition Difference |
|---|---|---|---|---|---|---|---|---|
| Thaps_hclust_0478 |
 |
 |
0.1 |
0.0096 |
3.5 |
highpH_TMEVA | 0.072300 | -0.35 |
| Title | Cluster Plot | Dendrogram | e-value | e-value | e-value | Condition | Condition FDR | Condition Difference |
|---|---|---|---|---|---|---|---|---|
| Thaps_hclust_0384 |
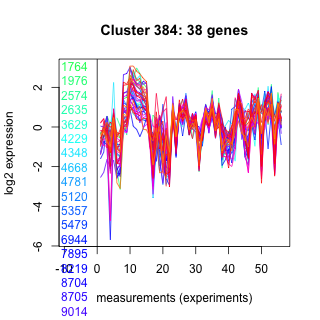 |
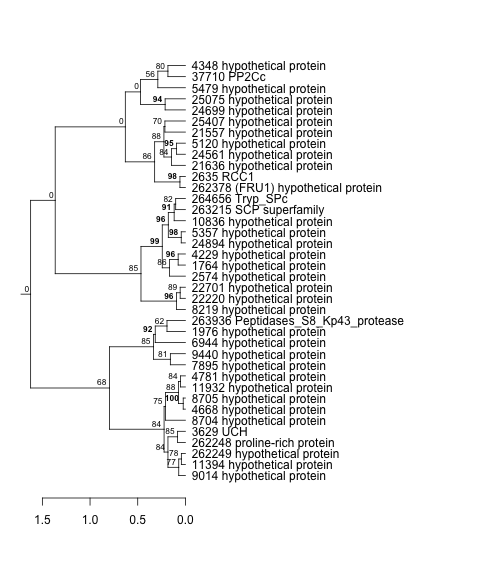 |
0.0000000074 |
0.000000031 |
0.12 |
lowFe_TMEVA | 0.074400 | -0.349 |
| Title | Cluster Plot | Dendrogram | e-value | e-value | e-value | Condition | Condition FDR | Condition Difference |
|---|---|---|---|---|---|---|---|---|
| Thaps_hclust_0449 |
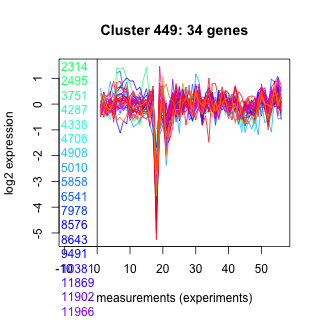 |
 |
0.0000000011 |
0.012 |
3.5 |
co2_elevated_stat_arrays | 0.044700 | -0.349 |
| Title | Cluster Plot | Dendrogram | e-value | e-value | e-value | Condition | Condition FDR | Condition Difference |
|---|---|---|---|---|---|---|---|---|
| Thaps_hclust_0027 |
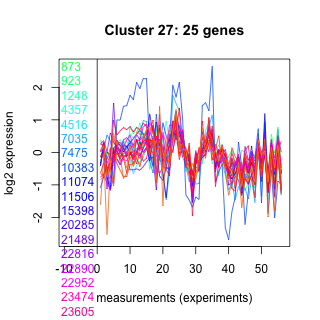 |
 |
0.0000000084 |
0.0086 |
0.069 |
lowSi_TMEVA | 0.558000 | -0.349 |
| Title | Cluster Plot | Dendrogram | e-value | e-value | e-value | Condition | Condition FDR | Condition Difference |
|---|---|---|---|---|---|---|---|---|
| Thaps_hclust_0065 |
 |
 |
1.5e-32 |
2.5e-32 |
9.9e-33 |
BaP | 0.025500 | -0.349 |
| Title | Cluster Plot | Dendrogram | e-value | e-value | e-value | Condition | Condition FDR | Condition Difference |
|---|---|---|---|---|---|---|---|---|
| Thaps_hclust_0071 |
 |
 |
0.0000019 |
0.0000028 |
0.00008 |
lowSi_TMEVA | 0.557000 | -0.349 |
| Title | Cluster Plot | Dendrogram | e-value | e-value | e-value | Condition | Condition FDR | Condition Difference |
|---|---|---|---|---|---|---|---|---|
| Thaps_hclust_0180 |
 |
 |
1.5 |
1.7 |
12 |
co2_elevated_stat_arrays | 0.213000 | -0.349 |
| Title | Cluster Plot | Dendrogram | e-value | e-value | e-value | Condition | Condition FDR | Condition Difference |
|---|---|---|---|---|---|---|---|---|
| Thaps_hclust_0137 |
 |
|
2.3e-18 |
0.00000000000062 |
0.000025 |
diel_exponential_vs_stationary | 0.000602 | -0.349 |
| Title | Cluster Plot | Dendrogram | e-value | e-value | e-value | Condition | Condition FDR | Condition Difference |
|---|---|---|---|---|---|---|---|---|
| Thaps_hclust_0236 |
 |
 |
0.0078 |
3.3 |
1.1 |
highlight_arrays | 0.073700 | -0.349 |
| Title | Cluster Plot | Dendrogram | e-value | e-value | e-value | Condition | Condition FDR | Condition Difference |
|---|---|---|---|---|---|---|---|---|
| Thaps_hclust_0416 |
 |
 |
0.00000015 |
0.00000035 |
0.7 |
lowtemp_TMEVA | 0.097200 | -0.348 |
| Title | Cluster Plot | Dendrogram | e-value | e-value | e-value | Condition | Condition FDR | Condition Difference |
|---|---|---|---|---|---|---|---|---|
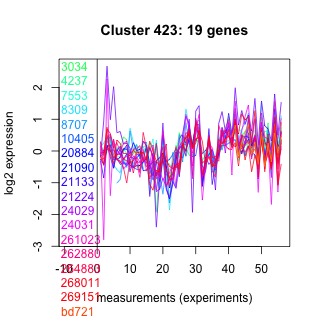
| Thaps_hclust_0423 |
 |
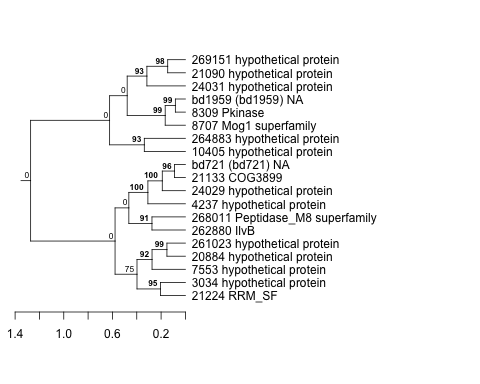 |
0.00046 |
0.13 |
9.2 |
lowFe_KTKB_Day5 | 0.090100 | -0.348 |
| Thaps_hclust_0423 |
|
|
0.00046 |
0.13 |
9.2 |
co2_elevated_stat_arrays | 0.122000 | -0.348 |
| Title | Cluster Plot | Dendrogram | e-value | e-value | e-value | Condition | Condition FDR | Condition Difference |
|---|---|---|---|---|---|---|---|---|
| Thaps_hclust_0002 |
 |
 |
0.00000029 |
0.000000009 |
0.000055 |
highlight_arrays | 0.031600 | -0.348 |
| Title | Cluster Plot | Dendrogram | e-value | e-value | e-value | Condition | Condition FDR | Condition Difference |
|---|---|---|---|---|---|---|---|---|
| Thaps_hclust_0030 |
 |
 |
0.000056 |
0.048 |
0.088 |
lowSi_TMEVA | 0.574000 | -0.347 |
| Title | Cluster Plot | Dendrogram | e-value | e-value | e-value | Condition | Condition FDR | Condition Difference |
|---|---|---|---|---|---|---|---|---|
| Thaps_hclust_0069 |
 |
 |
1.2e-26 |
2.6e-24 |
2.4e-20 |
lowtemp_TMEVA | 0.041200 | -0.347 |
| Title | Cluster Plot | Dendrogram | e-value | e-value | e-value | Condition | Condition FDR | Condition Difference |
|---|---|---|---|---|---|---|---|---|
| Thaps_hclust_0092 |
 |
|
1.3e-37 |
4.2e-20 |
0.0000000000000013 |
highlight_arrays | 0.000442 | -0.346 |
| Title | Cluster Plot | Dendrogram | e-value | e-value | e-value | Condition | Condition FDR | Condition Difference |
|---|---|---|---|---|---|---|---|---|
| Thaps_hclust_0290 |
 |
 |
3e-16 |
0.014 |
0.072 |
highpH_TMEVA | 0.021300 | -0.346 |
| Title | Cluster Plot | Dendrogram | e-value | e-value | e-value | Condition | Condition FDR | Condition Difference |
|---|---|---|---|---|---|---|---|---|
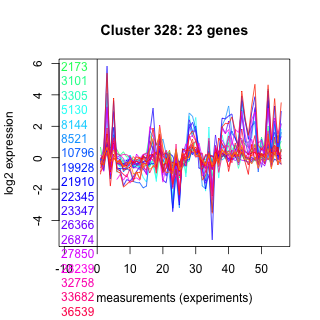
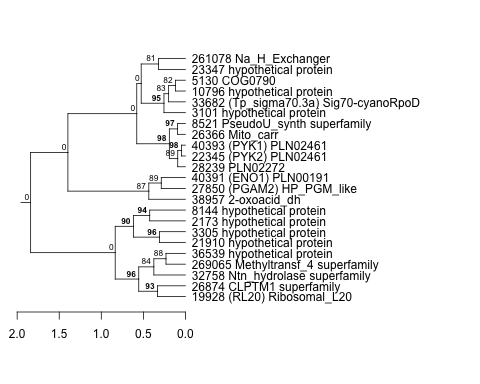
| Thaps_hclust_0328 |
 |
 |
0.00013 |
0.00001 |
0.46 |
lowSi_TMEVA | 0.574000 | -0.346 |
| Title | Cluster Plot | Dendrogram | e-value | e-value | e-value | Condition | Condition FDR | Condition Difference |
|---|---|---|---|---|---|---|---|---|
| Thaps_hclust_0359 |
 |
 |
0.5 |
11 |
31 |
lowSi_TMEVA | 0.616000 | -0.346 |
| Title | Cluster Plot | Dendrogram | e-value | e-value | e-value | Condition | Condition FDR | Condition Difference |
|---|---|---|---|---|---|---|---|---|
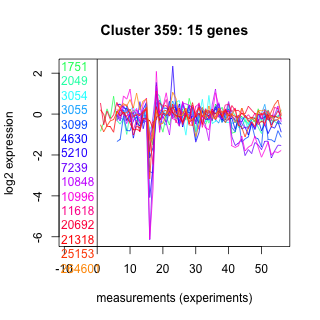
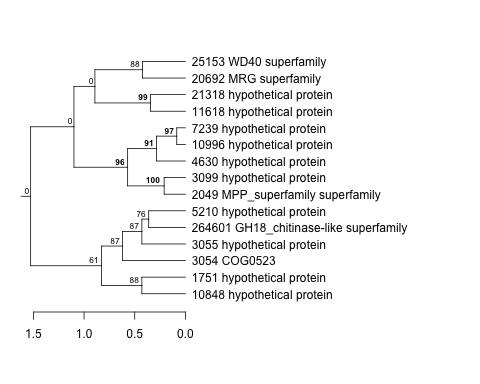
| Thaps_hclust_0311 |
 |
 |
4.1 |
0.64 |
12 |
exponential_vs_stationary_24highlight | 0.003230 | -0.345 |
| Title | Cluster Plot | Dendrogram | e-value | e-value | e-value | Condition | Condition FDR | Condition Difference |
|---|---|---|---|---|---|---|---|---|
| Thaps_hclust_0243 |
 |
 |
0.00018 |
0.14 |
0.0019 |
highpH_TMEVA | 0.035300 | -0.345 |
| Title | Cluster Plot | Dendrogram | e-value | e-value | e-value | Condition | Condition FDR | Condition Difference |
|---|---|---|---|---|---|---|---|---|
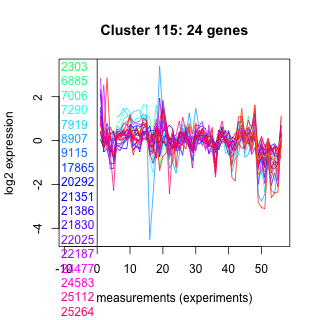
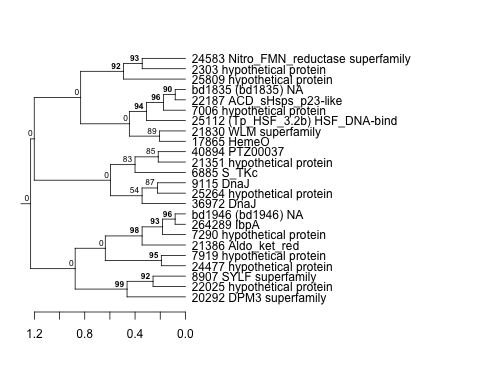
| Thaps_hclust_0115 |
 |
 |
0.00037 |
0.044 |
0.46 |
lowFe_KTKB_Day3 | 0.096700 | -0.345 |
| Title | Cluster Plot | Dendrogram | e-value | e-value | e-value | Condition | Condition FDR | Condition Difference |
|---|---|---|---|---|---|---|---|---|
| Thaps_hclust_0494 |
 |
 |
6.7 |
15 |
60 |
lowFe_KTKB_Day3 | 0.133000 | -0.345 |
| Title | Cluster Plot | Dendrogram | e-value | e-value | e-value | Condition | Condition FDR | Condition Difference |
|---|---|---|---|---|---|---|---|---|
| Thaps_hclust_0122 |
 |
 |
0.0000037 |
0.061 |
0.0018 |
lowtemp_TMEVA | 0.109000 | -0.344 |
| Title | Cluster Plot | Dendrogram | e-value | e-value | e-value | Condition | Condition FDR | Condition Difference |
|---|---|---|---|---|---|---|---|---|
| Thaps_hclust_0402 |
 |
 |
0.0022 |
5.7 |
0.07 |
lowFe_TMEVA | 0.211000 | -0.344 |
| Title | Cluster Plot | Dendrogram | e-value | e-value | e-value | Condition | Condition FDR | Condition Difference |
|---|---|---|---|---|---|---|---|---|
| Thaps_hclust_0329 |
 |
 |
0.0000000004 |
0.00000034 |
0.000023 |
diel_light_vs_dark | 0.019300 | -0.344 |
| Title | Cluster Plot | Dendrogram | e-value | e-value | e-value | Condition | Condition FDR | Condition Difference |
|---|---|---|---|---|---|---|---|---|
| Thaps_hclust_0228 |
 |
 |
0.00000000000028 |
0.0027 |
0.016 |
lowFe_TMEVA | 0.177000 | -0.343 |
| Title | Cluster Plot | Dendrogram | e-value | e-value | e-value | Condition | Condition FDR | Condition Difference |
|---|---|---|---|---|---|---|---|---|
| Thaps_hclust_0385 |
 |
 |
0.000029 |
2.1 |
2.2 |
exponential_vs_stationary_24light | 0.294000 | -0.343 |
| Title | Cluster Plot | Dendrogram | e-value | e-value | e-value | Condition | Condition FDR | Condition Difference |
|---|---|---|---|---|---|---|---|---|
| Thaps_hclust_0172 |
 |
 |
0.000001 |
0.000011 |
0.014 |
lowN_TMEVA | 0.214000 | -0.343 |
| Title | Cluster Plot | Dendrogram | e-value | e-value | e-value | Condition | Condition FDR | Condition Difference |
|---|---|---|---|---|---|---|---|---|
| Thaps_hclust_0146 |
 |
 |
0.00000000081 |
0.000016 |
0.0025 |
exponential_vs_stationary_24light | 0.222000 | -0.343 |