Hierarchical Clusters
Displaying 2001 - 2100 of 7500
| Title | Cluster Plot | Dendrogram | e-value | e-value | e-value | Condition | Condition FDR | Condition Difference |
|---|---|---|---|---|---|---|---|---|
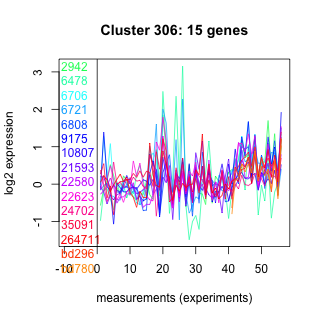
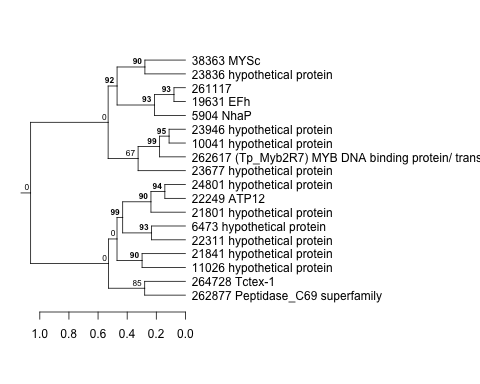
| Thaps_hclust_0306 |
 |
 |
0.001 |
0.26 |
5.3 |
BaP | 0.040400 | 0.493 |
| Title | Cluster Plot | Dendrogram | e-value | e-value | e-value | Condition | Condition FDR | Condition Difference |
|---|---|---|---|---|---|---|---|---|
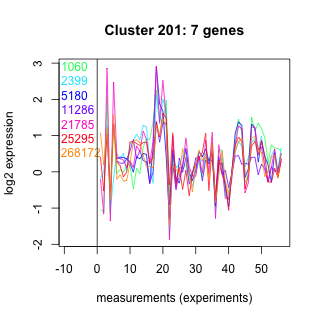
| Thaps_hclust_0201 |
 |
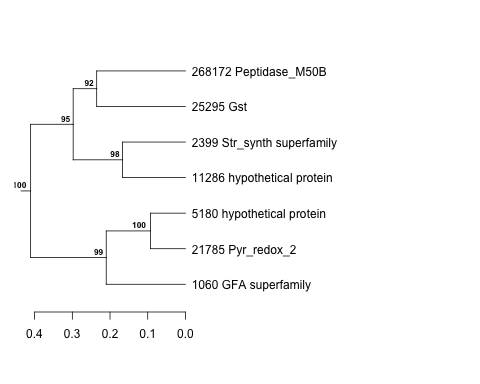 |
0.11 |
7.6 |
12 |
co2_elevated_expo_arrays | 0.040600 | 0.449 |
| Title | Cluster Plot | Dendrogram | e-value | e-value | e-value | Condition | Condition FDR | Condition Difference |
|---|---|---|---|---|---|---|---|---|
| Thaps_hclust_0096 |
 |
 |
0.0000028 |
0.9 |
0.38 |
highlight_arrays | 0.040800 | 0.255 |
| Title | Cluster Plot | Dendrogram | e-value | e-value | e-value | Condition | Condition FDR | Condition Difference |
|---|---|---|---|---|---|---|---|---|
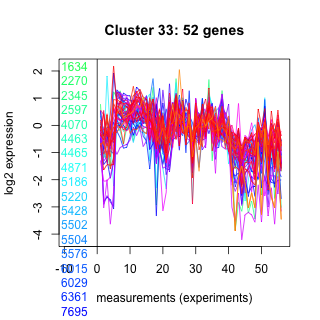
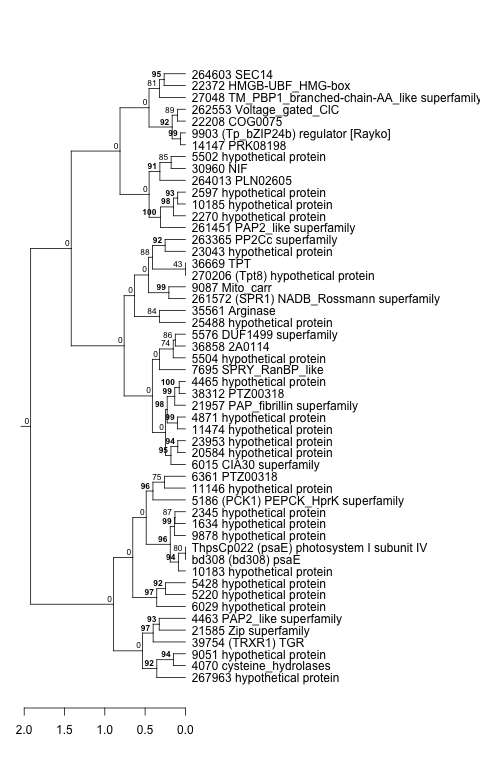
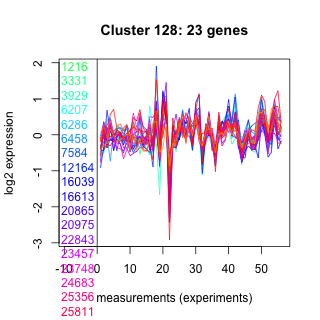
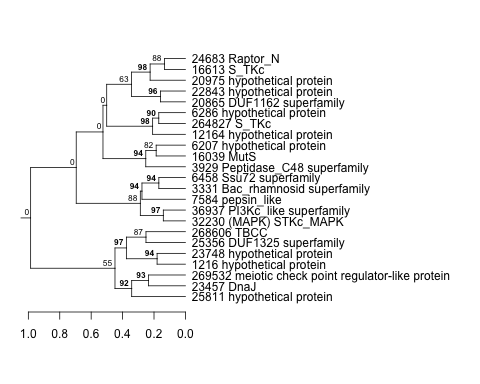
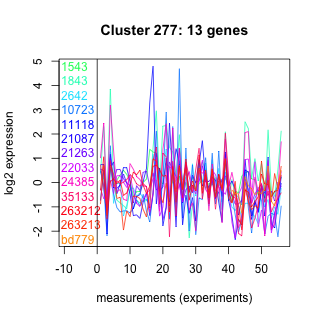
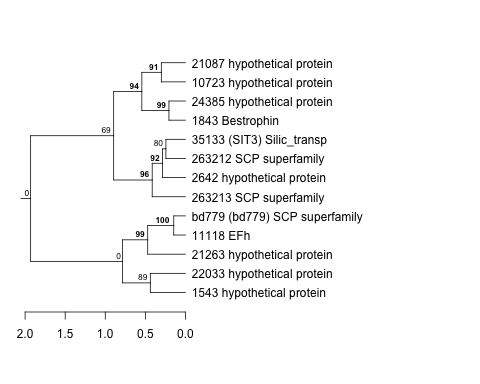
| Thaps_hclust_0288 |
 |
 |
0.032 |
0.0067 |
0.047 |
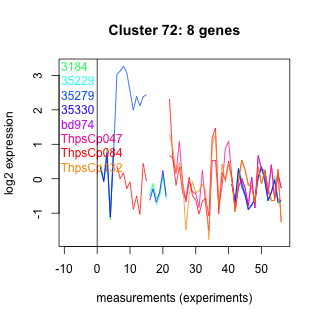
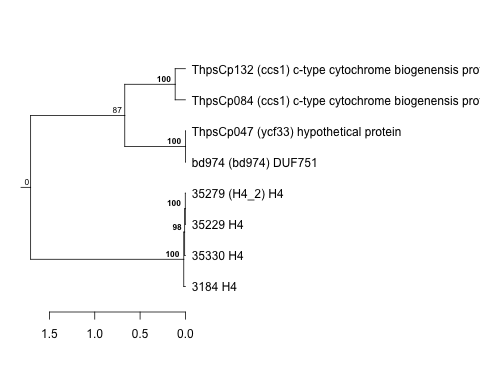
exponential_vs_stationary_24light | 0.040900 | 0.713 |
| Thaps_hclust_0288 |
|
|
0.032 |
0.0067 |
0.047 |
lowtemp_TMEVA | 0.042100 | 0.587 |
| Thaps_hclust_0288 |
|
|
0.032 |
0.0067 |
0.047 |
highpH_TMEVA | 0.042600 | -0.362 |
| Title | Cluster Plot | Dendrogram | e-value | e-value | e-value | Condition | Condition FDR | Condition Difference |
|---|---|---|---|---|---|---|---|---|
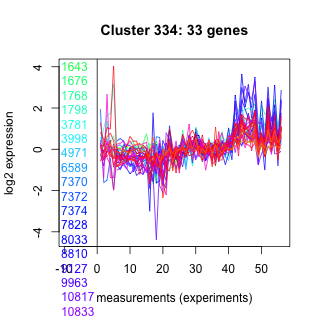
| Thaps_hclust_0334 |
 |
 |
0.51 |
0.00047 |
0.25 |
highpH_TMEVA | 0.041200 | 0.254 |
| Title | Cluster Plot | Dendrogram | e-value | e-value | e-value | Condition | Condition FDR | Condition Difference |
|---|---|---|---|---|---|---|---|---|
| Thaps_hclust_0069 |
 |
 |
1.2e-26 |
2.6e-24 |
2.4e-20 |
lowtemp_TMEVA | 0.041200 | -0.347 |
| Title | Cluster Plot | Dendrogram | e-value | e-value | e-value | Condition | Condition FDR | Condition Difference |
|---|---|---|---|---|---|---|---|---|
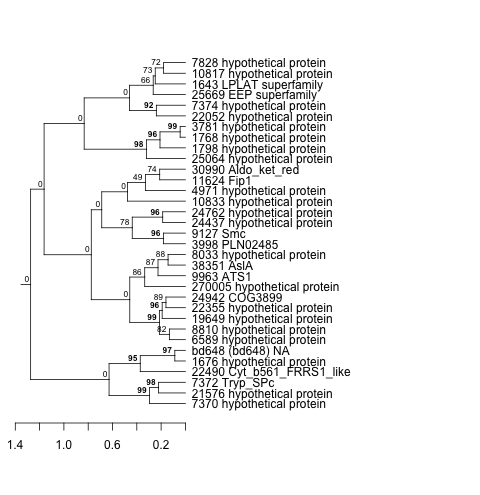
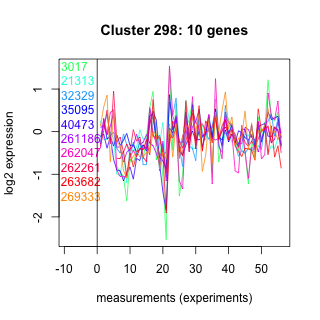
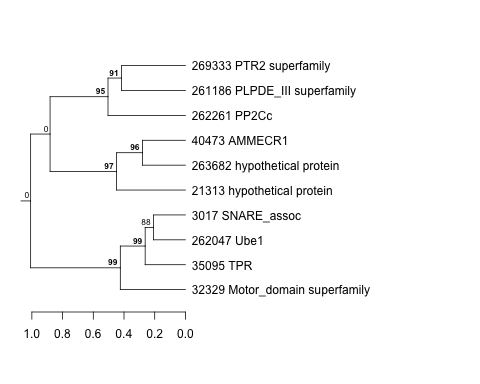
| Thaps_hclust_0298 |
 |
 |
0.035 |
0.58 |
41 |
BaP | 0.041300 | -0.621 |
| Title | Cluster Plot | Dendrogram | e-value | e-value | e-value | Condition | Condition FDR | Condition Difference |
|---|---|---|---|---|---|---|---|---|
| Thaps_hclust_0304 |
 |
 |
0.16 |
1.3 |
16 |
BaP | 0.041300 | 0.32 |
| Thaps_hclust_0304 |
|
|
0.16 |
1.3 |
16 |
lowFe_TMEVA | 0.047400 | -0.377 |
| Title | Cluster Plot | Dendrogram | e-value | e-value | e-value | Condition | Condition FDR | Condition Difference |
|---|---|---|---|---|---|---|---|---|
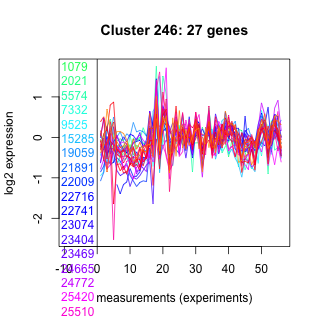
| Thaps_hclust_0246 |
 |
 |
0.0000088 |
0.0034 |
3.7 |
BaP | 0.041300 | 0.363 |
| Thaps_hclust_0246 |
|
|
0.0000088 |
0.0034 |
3.7 |
highlight_arrays | 0.046900 | -0.27 |
| Title | Cluster Plot | Dendrogram | e-value | e-value | e-value | Condition | Condition FDR | Condition Difference |
|---|---|---|---|---|---|---|---|---|
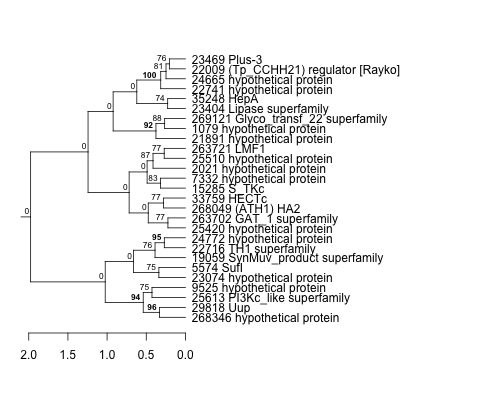
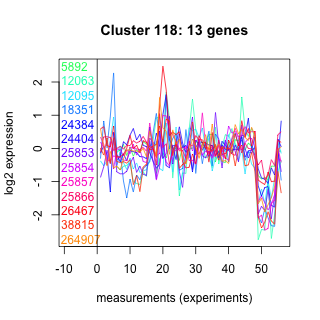
| Thaps_hclust_0118 |
 |
 |
0.0037 |
1.2 |
1.4 |
co2_elevated_expo_arrays | 0.041400 | 0.333 |
| Title | Cluster Plot | Dendrogram | e-value | e-value | e-value | Condition | Condition FDR | Condition Difference |
|---|---|---|---|---|---|---|---|---|
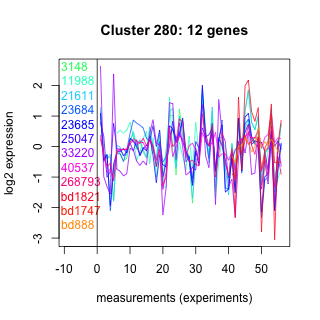
| Thaps_hclust_0280 |
 |
 |
0.75 |
0.64 |
81 |
BaP | 0.041600 | -0.564 |
| Thaps_hclust_0280 |
|
|
0.75 |
0.64 |
81 |
co2_elevated_stat_arrays | 0.044700 | 0.526 |
| Title | Cluster Plot | Dendrogram | e-value | e-value | e-value | Condition | Condition FDR | Condition Difference |
|---|---|---|---|---|---|---|---|---|
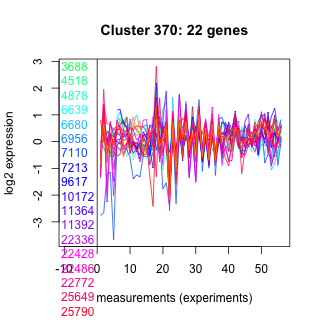
| Thaps_hclust_0370 |
 |
 |
0.55 |
1 |
7 |
lowtemp_TMEVA | 0.041600 | -0.49 |
| Title | Cluster Plot | Dendrogram | e-value | e-value | e-value | Condition | Condition FDR | Condition Difference |
|---|---|---|---|---|---|---|---|---|
| Thaps_hclust_0027 |
 |
 |
0.0000000084 |
0.0086 |
0.069 |
highlight_arrays | 0.041800 | -0.286 |
| Thaps_hclust_0027 |
|
|
0.0000000084 |
0.0086 |
0.069 |
lowN_TMEVA | 0.043500 | -0.555 |
| Title | Cluster Plot | Dendrogram | e-value | e-value | e-value | Condition | Condition FDR | Condition Difference |
|---|---|---|---|---|---|---|---|---|
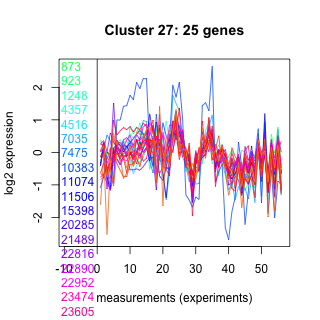
| Thaps_hclust_0175 |
 |
 |
0.00000000000027 |
0.0000042 |
0.58 |
lowtemp_TMEVA | 0.042100 | 0.374 |
| Title | Cluster Plot | Dendrogram | e-value | e-value | e-value | Condition | Condition FDR | Condition Difference |
|---|---|---|---|---|---|---|---|---|
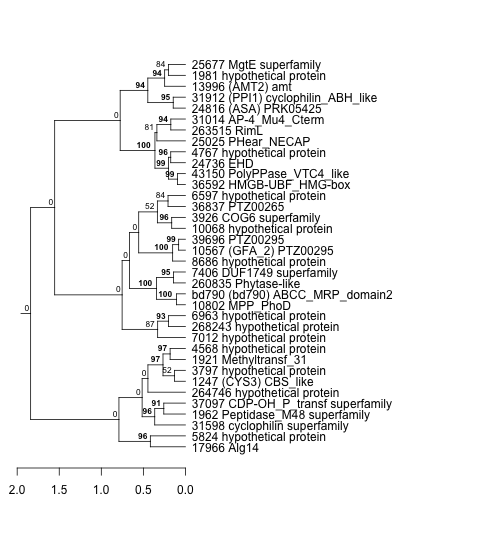
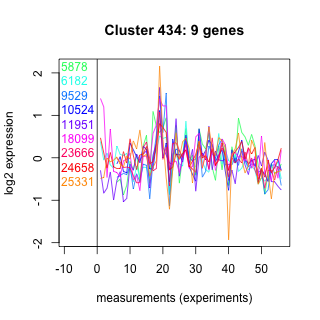
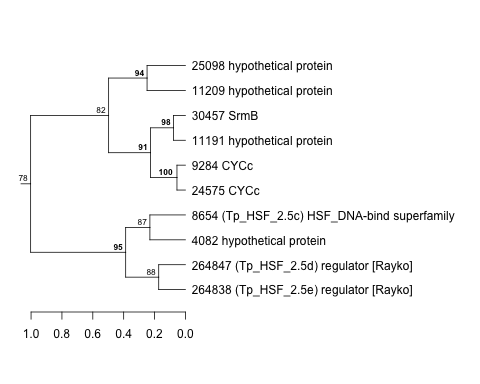
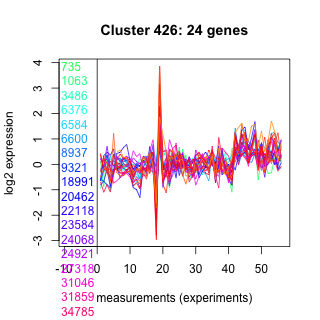
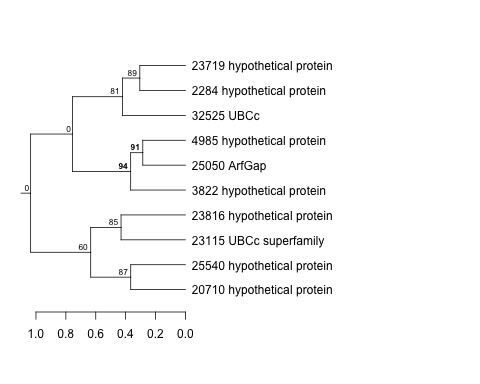
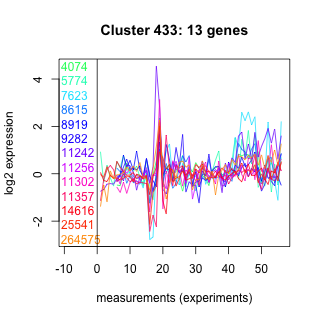
| Thaps_hclust_0434 |
 |
 |
0.011 |
17 |
57 |
BaP | 0.042100 | 0.638 |
| Title | Cluster Plot | Dendrogram | e-value | e-value | e-value | Condition | Condition FDR | Condition Difference |
|---|---|---|---|---|---|---|---|---|
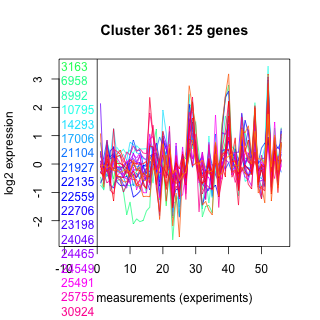
| Thaps_hclust_0361 |
 |
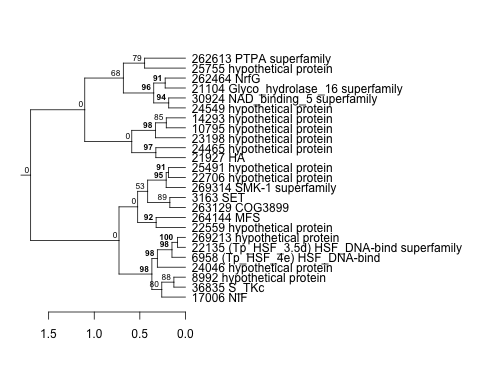 |
0.00000000081 |
0.14 |
2.1 |
lowFe_KTKB_Day5 | 0.042100 | 0.347 |
| Title | Cluster Plot | Dendrogram | e-value | e-value | e-value | Condition | Condition FDR | Condition Difference |
|---|---|---|---|---|---|---|---|---|
| Thaps_hclust_0167 |
 |
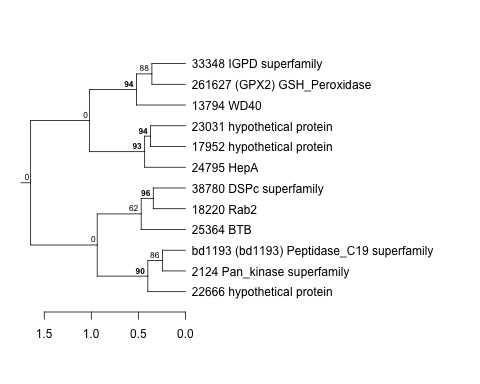 |
1 |
15 |
160 |
lowFe_KTKB_Day5 | 0.042100 | 0.546 |
| Title | Cluster Plot | Dendrogram | e-value | e-value | e-value | Condition | Condition FDR | Condition Difference |
|---|---|---|---|---|---|---|---|---|
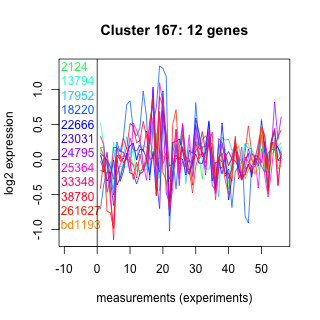
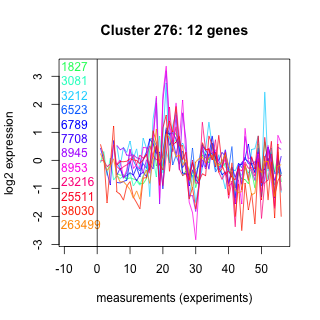
| Thaps_hclust_0276 |
 |
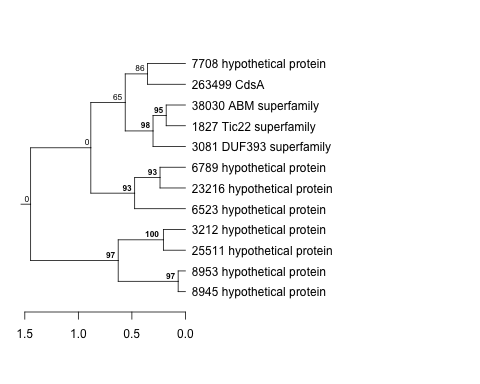 |
0.063 |
39 |
53 |
BaP | 0.042100 | 0.562 |
| Thaps_hclust_0276 |
|
|
0.063 |
39 |
53 |
exponential_vs_stationary_24light | 0.044000 | 0.777 |
| Thaps_hclust_0276 |
|
|
0.063 |
39 |
53 |
lowFe_KTKB_Day5 | 0.045800 | 0.538 |
| Title | Cluster Plot | Dendrogram | e-value | e-value | e-value | Condition | Condition FDR | Condition Difference |
|---|---|---|---|---|---|---|---|---|
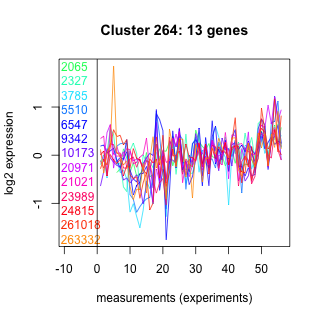
| Thaps_hclust_0264 |
 |
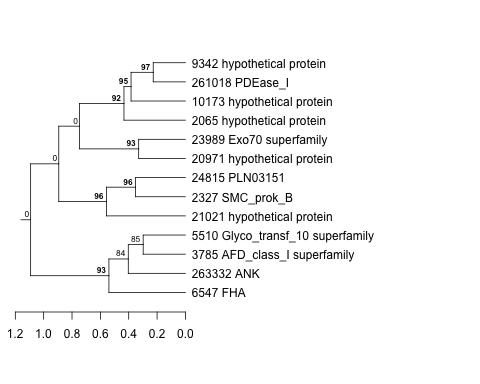 |
0.0079 |
0.24 |
5.8 |
highlight_arrays | 0.042100 | -0.397 |
| Title | Cluster Plot | Dendrogram | e-value | e-value | e-value | Condition | Condition FDR | Condition Difference |
|---|---|---|---|---|---|---|---|---|
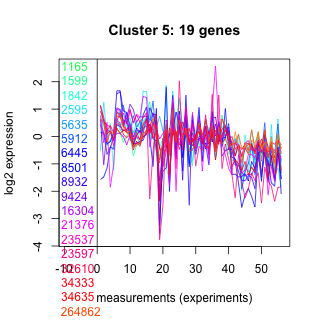
| Thaps_hclust_0005 |
 |
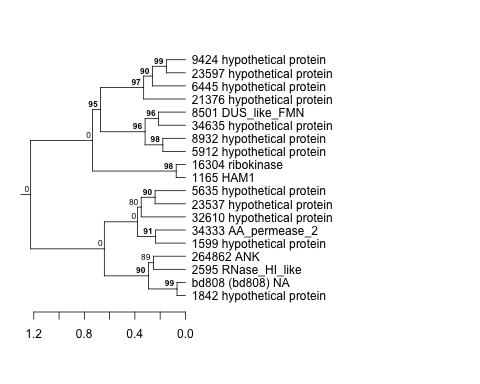 |
0.00013 |
0.0027 |
2 |
BaP | 0.042100 | -0.446 |
| Thaps_hclust_0005 |
|
|
0.00013 |
0.0027 |
2 |
exponential_vs_stationary_24light | 0.044400 | 0.64 |
| Title | Cluster Plot | Dendrogram | e-value | e-value | e-value | Condition | Condition FDR | Condition Difference |
|---|---|---|---|---|---|---|---|---|
| Thaps_hclust_0056 |
 |
 |
0.0000000078 |
0.077 |
1 |
lowtemp_TMEVA | 0.042100 | 0.525 |
| Title | Cluster Plot | Dendrogram | e-value | e-value | e-value | Condition | Condition FDR | Condition Difference |
|---|---|---|---|---|---|---|---|---|
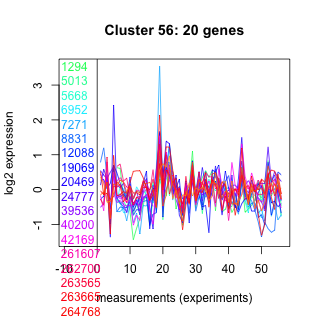
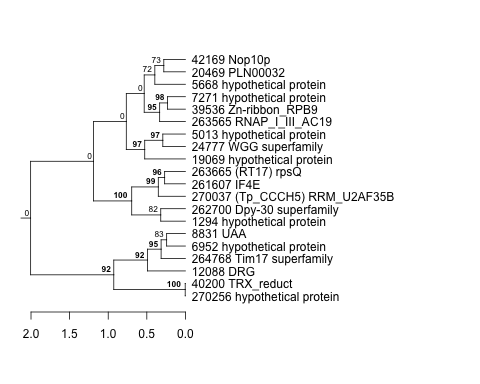
| Thaps_hclust_0322 |
 |
 |
0.0000000021 |
0.0000000053 |
0.0051 |
BaP | 0.042100 | 0.317 |
| Title | Cluster Plot | Dendrogram | e-value | e-value | e-value | Condition | Condition FDR | Condition Difference |
|---|---|---|---|---|---|---|---|---|
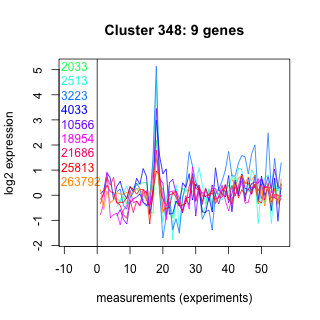
| Thaps_hclust_0348 |
 |
 |
8.7 |
34 |
60 |
BaP | 0.042300 | 0.635 |
| Title | Cluster Plot | Dendrogram | e-value | e-value | e-value | Condition | Condition FDR | Condition Difference |
|---|---|---|---|---|---|---|---|---|
| Thaps_hclust_0003 |
 |
 |
0.24 |
16 |
240 |
exponential_vs_stationary_24highlight | 0.042300 | -0.23 |
| Title | Cluster Plot | Dendrogram | e-value | e-value | e-value | Condition | Condition FDR | Condition Difference |
|---|---|---|---|---|---|---|---|---|
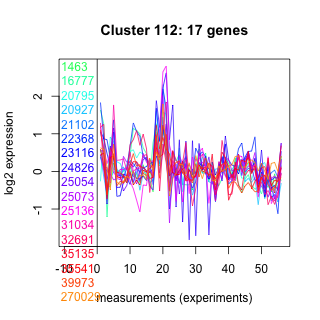
| Thaps_hclust_0112 |
 |
 |
0.00000035 |
0.017 |
0.34 |
lowtemp_TMEVA | 0.042500 | 0.565 |
| Thaps_hclust_0112 |
|
|
0.00000035 |
0.017 |
0.34 |
lowFe_TMEVA | 0.049400 | 0.528 |
| Title | Cluster Plot | Dendrogram | e-value | e-value | e-value | Condition | Condition FDR | Condition Difference |
|---|---|---|---|---|---|---|---|---|
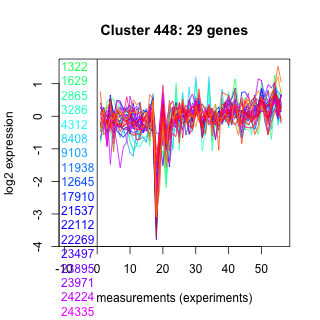
| Thaps_hclust_0448 |
 |
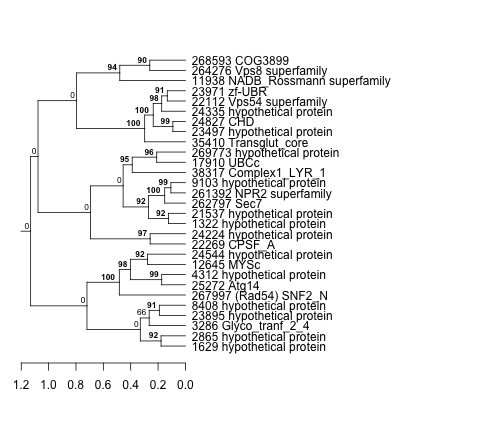 |
0.0000000026 |
0.00021 |
8.2 |
highlight_arrays | 0.043100 | -0.259 |
| Title | Cluster Plot | Dendrogram | e-value | e-value | e-value | Condition | Condition FDR | Condition Difference |
|---|---|---|---|---|---|---|---|---|
| Thaps_hclust_0033 |
 |
 |
0.000000000000011 |
0.0012 |
0.0073 |
co2_elevated_stat_arrays | 0.043500 | -0.307 |
| Title | Cluster Plot | Dendrogram | e-value | e-value | e-value | Condition | Condition FDR | Condition Difference |
|---|---|---|---|---|---|---|---|---|
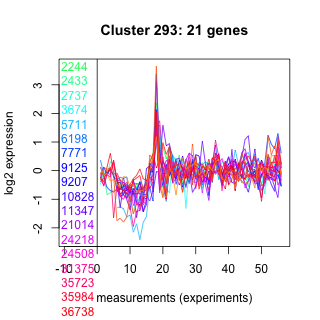
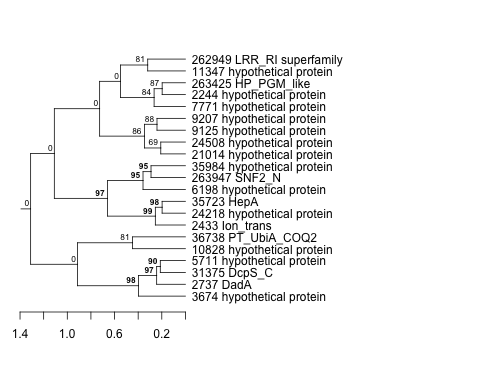
| Thaps_hclust_0293 |
 |
 |
0.16 |
120 |
360 |
BaP | 0.043600 | 0.402 |
| Title | Cluster Plot | Dendrogram | e-value | e-value | e-value | Condition | Condition FDR | Condition Difference |
|---|---|---|---|---|---|---|---|---|
| Thaps_hclust_0006 |
 |
 |
0.0000000000025 |
0.000000092 |
0.000086 |
diel_light_vs_dark | 0.043600 | 0.274 |
| Title | Cluster Plot | Dendrogram | e-value | e-value | e-value | Condition | Condition FDR | Condition Difference |
|---|---|---|---|---|---|---|---|---|
| Thaps_hclust_0447 |
 |
 |
0.0005 |
0.0031 |
0.0041 |
co2_elevated_stat_arrays | 0.043600 | -0.376 |
| Title | Cluster Plot | Dendrogram | e-value | e-value | e-value | Condition | Condition FDR | Condition Difference |
|---|---|---|---|---|---|---|---|---|
| Thaps_hclust_0339 |
 |
 |
0.000016 |
0.00038 |
0.0017 |
highpH_TMEVA | 0.043600 | -0.324 |
| Title | Cluster Plot | Dendrogram | e-value | e-value | e-value | Condition | Condition FDR | Condition Difference |
|---|---|---|---|---|---|---|---|---|
| Thaps_hclust_0092 |
 |
|
1.3e-37 |
4.2e-20 |
0.0000000000000013 |
diel_exponential_vs_stationary | 0.043600 | 0.159 |
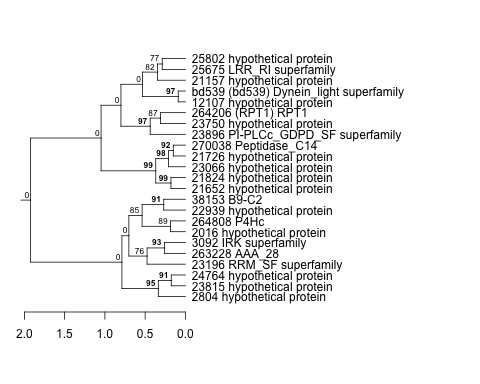
| Title | Cluster Plot | Dendrogram | e-value | e-value | e-value | Condition | Condition FDR | Condition Difference |
|---|---|---|---|---|---|---|---|---|
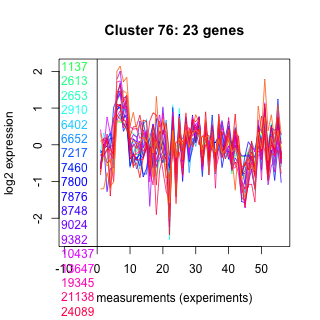
| Thaps_hclust_0076 |
 |
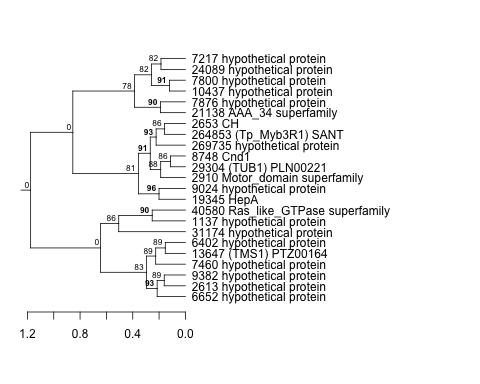 |
0.0047 |
0.13 |
1.2 |
co2_elevated_stat_arrays | 0.043600 | -0.403 |
| Title | Cluster Plot | Dendrogram | e-value | e-value | e-value | Condition | Condition FDR | Condition Difference |
|---|---|---|---|---|---|---|---|---|
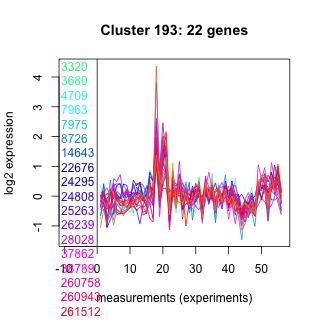
| Thaps_hclust_0193 |
 |
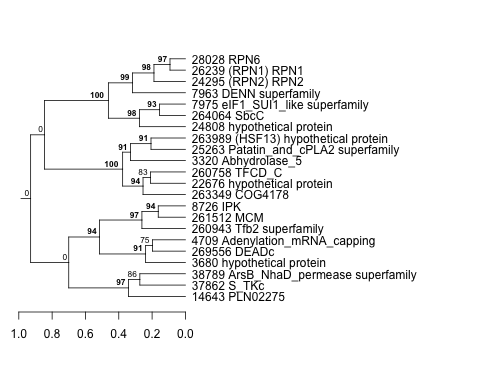 |
0.00027 |
0.013 |
6.2 |
diel_light_vs_dark | 0.043700 | 0.378 |
| Title | Cluster Plot | Dendrogram | e-value | e-value | e-value | Condition | Condition FDR | Condition Difference |
|---|---|---|---|---|---|---|---|---|
| Thaps_hclust_0054 |
 |
 |
1.6e-17 |
0.0000000000053 |
0.000000000000024 |
exponential_vs_stationary_24highlight | 0.043700 | 0.228 |
| Title | Cluster Plot | Dendrogram | e-value | e-value | e-value | Condition | Condition FDR | Condition Difference |
|---|---|---|---|---|---|---|---|---|
| Thaps_hclust_0496 |
 |
 |
0.00082 |
0.0031 |
0.43 |
exponential_vs_stationary_24highlight | 0.043800 | -0.186 |
| Title | Cluster Plot | Dendrogram | e-value | e-value | e-value | Condition | Condition FDR | Condition Difference |
|---|---|---|---|---|---|---|---|---|
| Thaps_hclust_0128 |
 |
 |
0.0000000058 |
0.00033 |
21 |
highlight_arrays | 0.043900 | -0.293 |
| Title | Cluster Plot | Dendrogram | e-value | e-value | e-value | Condition | Condition FDR | Condition Difference |
|---|---|---|---|---|---|---|---|---|
| Thaps_hclust_0009 |
 |
 |
0.0000023 |
0.0000027 |
0.000035 |
diel_light_vs_dark | 0.044000 | 0.307 |
| Title | Cluster Plot | Dendrogram | e-value | e-value | e-value | Condition | Condition FDR | Condition Difference |
|---|---|---|---|---|---|---|---|---|
| Thaps_hclust_0194 |
 |
 |
0.27 |
0.6 |
1.5 |
diel_exponential_vs_stationary | 0.044300 | -0.368 |
| Title | Cluster Plot | Dendrogram | e-value | e-value | e-value | Condition | Condition FDR | Condition Difference |
|---|---|---|---|---|---|---|---|---|
| Thaps_hclust_0130 |
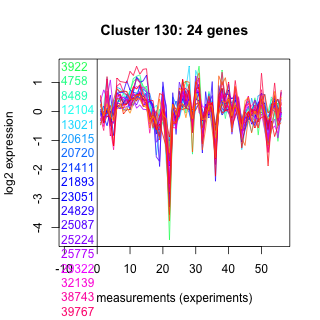 |
 |
0.64 |
15 |
13 |
BaP | 0.044400 | -0.385 |
| Title | Cluster Plot | Dendrogram | e-value | e-value | e-value | Condition | Condition FDR | Condition Difference |
|---|---|---|---|---|---|---|---|---|
| Thaps_hclust_0375 |
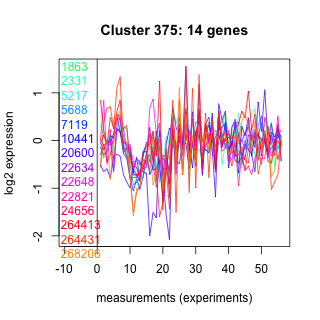 |
 |
1.8 |
2.9 |
40 |
BaP | 0.044400 | -0.499 |
| Title | Cluster Plot | Dendrogram | e-value | e-value | e-value | Condition | Condition FDR | Condition Difference |
|---|---|---|---|---|---|---|---|---|
| Thaps_hclust_0333 |
 |
 |
0.00062 |
4 |
17 |
BaP | 0.044400 | -0.37 |
| Title | Cluster Plot | Dendrogram | e-value | e-value | e-value | Condition | Condition FDR | Condition Difference |
|---|---|---|---|---|---|---|---|---|
| Thaps_hclust_0378 |
 |
 |
0.0003 |
210 |
10 |
BaP | 0.044500 | 0.553 |
| Title | Cluster Plot | Dendrogram | e-value | e-value | e-value | Condition | Condition FDR | Condition Difference |
|---|---|---|---|---|---|---|---|---|
| Thaps_hclust_0072 |
 |
 |
1.2e-22 |
1.1e-16 |
0.000000000000011 |
lowtemp_TMEVA | 0.044600 | 0.856 |
| Title | Cluster Plot | Dendrogram | e-value | e-value | e-value | Condition | Condition FDR | Condition Difference |
|---|---|---|---|---|---|---|---|---|
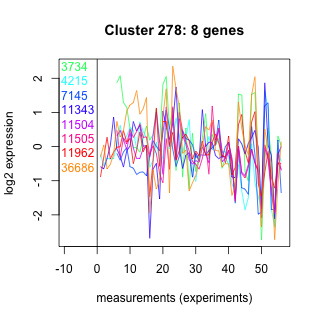
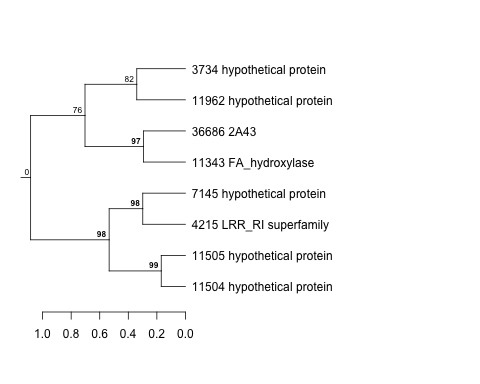
| Thaps_hclust_0278 |
 |
 |
0.093 |
0.57 |
39 |
highpH_TMEVA | 0.044600 | -0.505 |
| Title | Cluster Plot | Dendrogram | e-value | e-value | e-value | Condition | Condition FDR | Condition Difference |
|---|---|---|---|---|---|---|---|---|
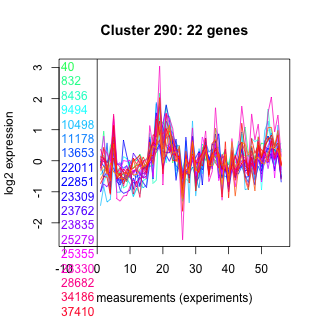
| Thaps_hclust_0191 |
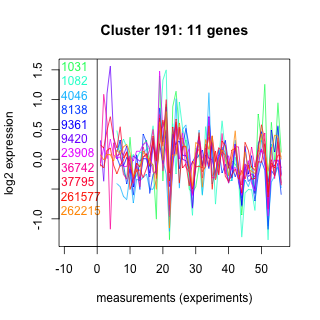 |
 |
1.5 |
3.5 |
44 |
co2_elevated_stat_arrays | 0.044700 | -0.542 |
| Title | Cluster Plot | Dendrogram | e-value | e-value | e-value | Condition | Condition FDR | Condition Difference |
|---|---|---|---|---|---|---|---|---|
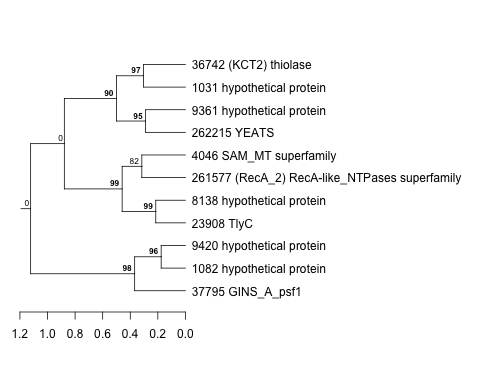
| Thaps_hclust_0449 |
 |
 |
0.0000000011 |
0.012 |
3.5 |
co2_elevated_stat_arrays | 0.044700 | -0.349 |
| Title | Cluster Plot | Dendrogram | e-value | e-value | e-value | Condition | Condition FDR | Condition Difference |
|---|---|---|---|---|---|---|---|---|
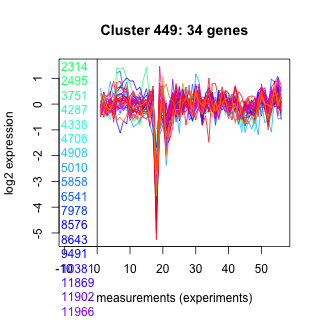
| Thaps_hclust_0290 |
 |
 |
3e-16 |
0.014 |
0.072 |
diel_exponential_vs_stationary | 0.044900 | 0.324 |
| Title | Cluster Plot | Dendrogram | e-value | e-value | e-value | Condition | Condition FDR | Condition Difference |
|---|---|---|---|---|---|---|---|---|
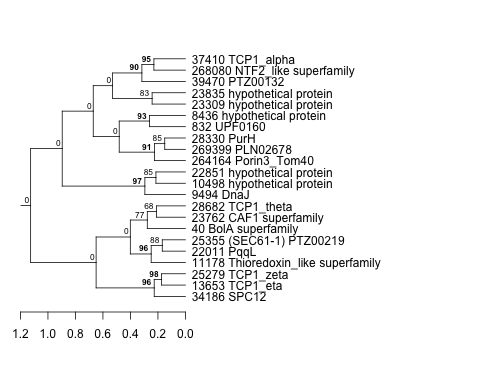
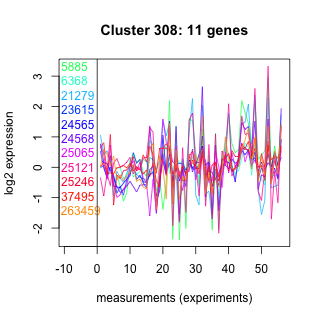
| Thaps_hclust_0308 |
 |
 |
0.37 |
17 |
1.6 |
highlight_arrays | 0.045100 | 0.419 |
| Title | Cluster Plot | Dendrogram | e-value | e-value | e-value | Condition | Condition FDR | Condition Difference |
|---|---|---|---|---|---|---|---|---|
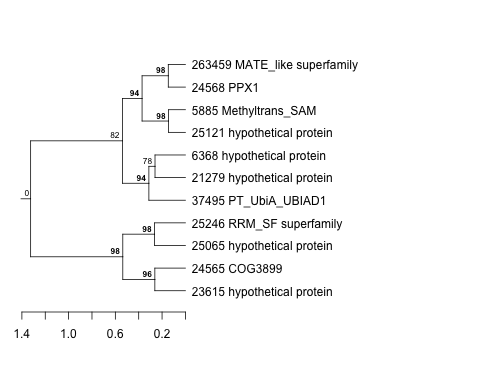
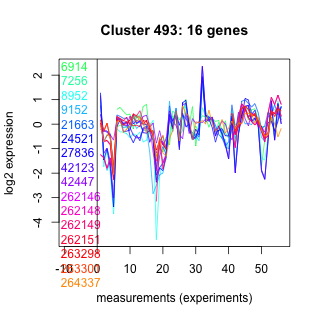
| Thaps_hclust_0493 |
 |
 |
0.00000036 |
0.0000009 |
0.000056 |
co2_elevated_stat_arrays | 0.045100 | 0.463 |
| Title | Cluster Plot | Dendrogram | e-value | e-value | e-value | Condition | Condition FDR | Condition Difference |
|---|---|---|---|---|---|---|---|---|
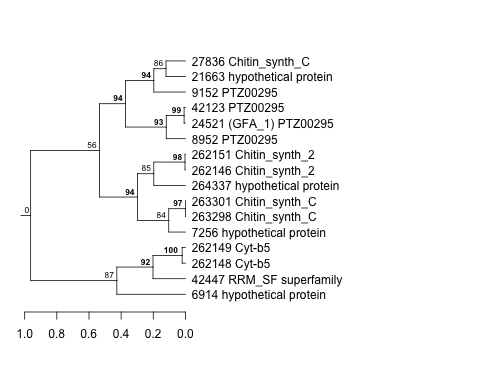
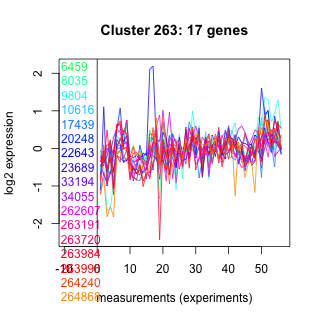
| Thaps_hclust_0263 |
 |
 |
0.15 |
0.25 |
1.4 |
lowtemp_TMEVA | 0.045600 | -0.557 |
| Title | Cluster Plot | Dendrogram | e-value | e-value | e-value | Condition | Condition FDR | Condition Difference |
|---|---|---|---|---|---|---|---|---|
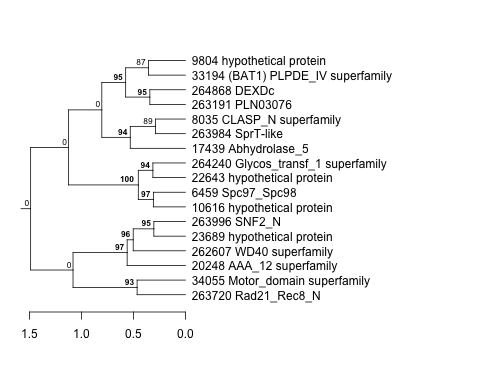
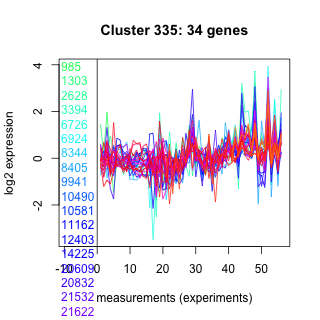
| Thaps_hclust_0335 |
 |
 |
0.0000000032 |
0.000001 |
0.019 |
lowFe_KTKB_Day5 | 0.045800 | -0.302 |
| Title | Cluster Plot | Dendrogram | e-value | e-value | e-value | Condition | Condition FDR | Condition Difference |
|---|---|---|---|---|---|---|---|---|
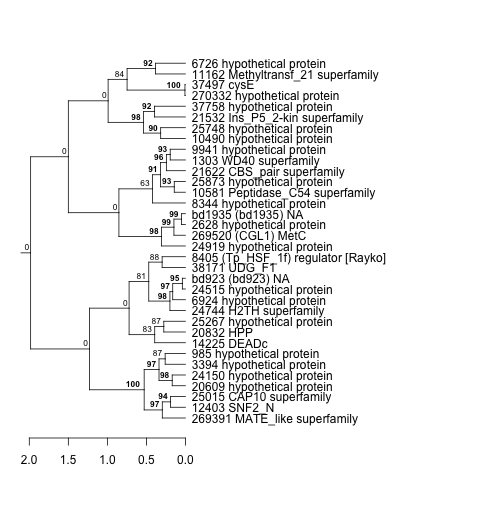
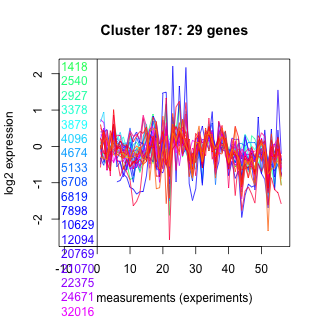
| Thaps_hclust_0187 |
 |
 |
0.000000024 |
0.034 |
0.66 |
diel_light_vs_dark | 0.046000 | 0.323 |
| Title | Cluster Plot | Dendrogram | e-value | e-value | e-value | Condition | Condition FDR | Condition Difference |
|---|---|---|---|---|---|---|---|---|
| Thaps_hclust_0309 |
 |
 |
0.0000055 |
0.015 |
1.1 |
lowSi_TMEVA | 0.046100 | 0.843 |
| Title | Cluster Plot | Dendrogram | e-value | e-value | e-value | Condition | Condition FDR | Condition Difference |
|---|---|---|---|---|---|---|---|---|
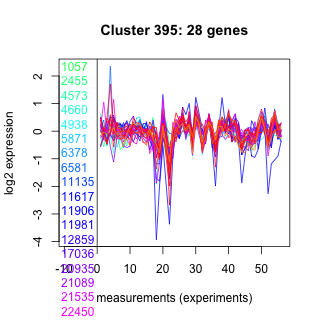
| Thaps_hclust_0395 |
 |
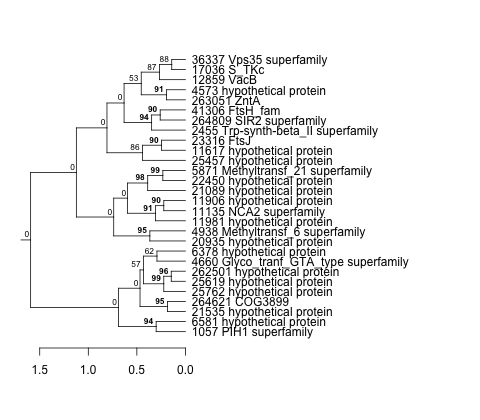 |
0.0015 |
0.0018 |
0.48 |
diel_exponential_vs_stationary | 0.046400 | -0.289 |
| Title | Cluster Plot | Dendrogram | e-value | e-value | e-value | Condition | Condition FDR | Condition Difference |
|---|---|---|---|---|---|---|---|---|
| Thaps_hclust_0082 |
 |
|
8.89825e-43 |
2e-27 |
1.3e-16 |
co2_elevated_stat_arrays | 0.046800 | 0.253 |
| Title | Cluster Plot | Dendrogram | e-value | e-value | e-value | Condition | Condition FDR | Condition Difference |
|---|---|---|---|---|---|---|---|---|
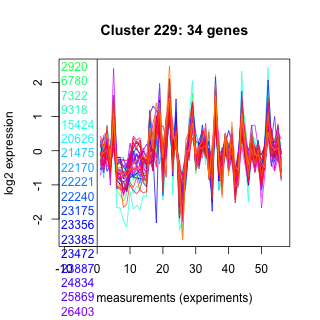
| Thaps_hclust_0229 |
 |
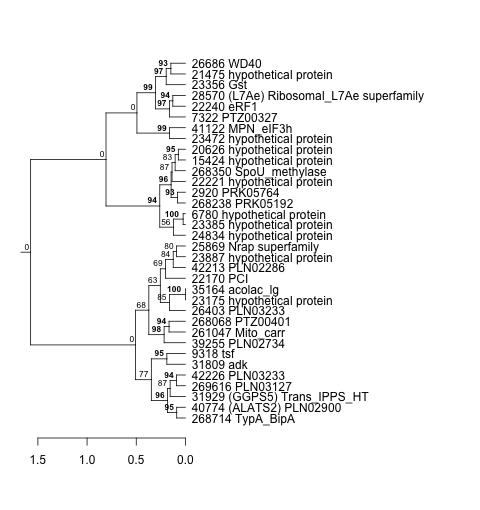 |
9.9e-18 |
0.000000000000034 |
0.0000002 |
lowFe_KTKB_Day3 | 0.046800 | 0.345 |
| Title | Cluster Plot | Dendrogram | e-value | e-value | e-value | Condition | Condition FDR | Condition Difference |
|---|---|---|---|---|---|---|---|---|
| Thaps_hclust_0203 |
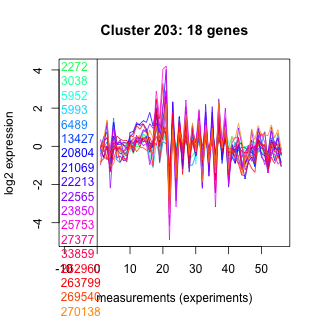 |
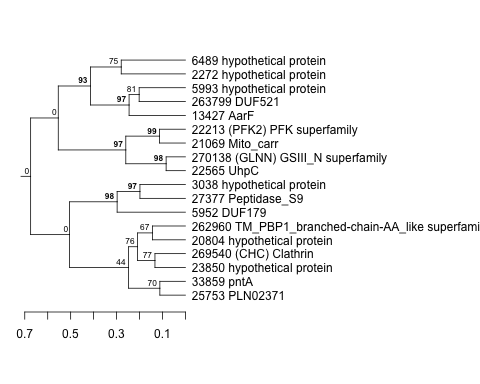 |
0.00051 |
1.2 |
1.3 |
lowSi_TMEVA | 0.046800 | -0.839 |
| Title | Cluster Plot | Dendrogram | e-value | e-value | e-value | Condition | Condition FDR | Condition Difference |
|---|---|---|---|---|---|---|---|---|
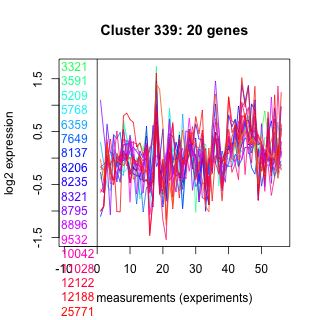
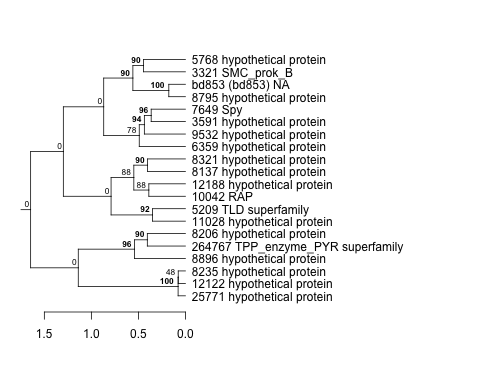
| Thaps_hclust_0321 |
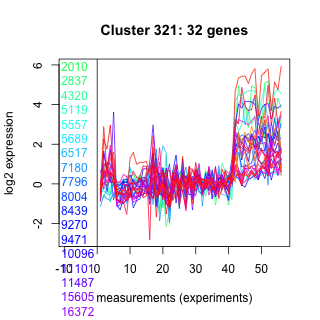 |
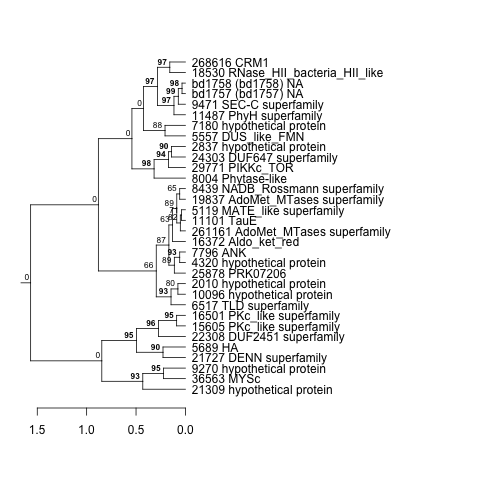 |
0.000000086 |
0.0000000042 |
0.0000028 |
highlight_arrays | 0.046900 | -0.251 |
| Title | Cluster Plot | Dendrogram | e-value | e-value | e-value | Condition | Condition FDR | Condition Difference |
|---|---|---|---|---|---|---|---|---|
| Thaps_hclust_0150 |
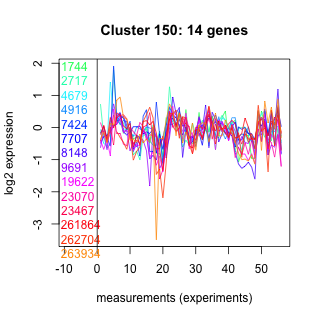 |
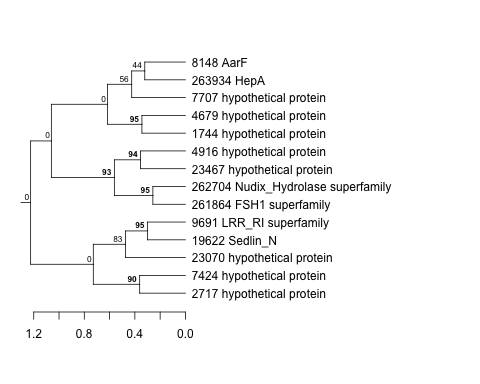 |
0.16 |
0.73 |
6.8 |
highlight_arrays | 0.047100 | -0.366 |
| Title | Cluster Plot | Dendrogram | e-value | e-value | e-value | Condition | Condition FDR | Condition Difference |
|---|---|---|---|---|---|---|---|---|
| Thaps_hclust_0152 |
 |
 |
0.00015 |
0.00023 |
0.031 |
lowFe_TMEVA | 0.047400 | -0.755 |
| Title | Cluster Plot | Dendrogram | e-value | e-value | e-value | Condition | Condition FDR | Condition Difference |
|---|---|---|---|---|---|---|---|---|
| Thaps_hclust_0136 |
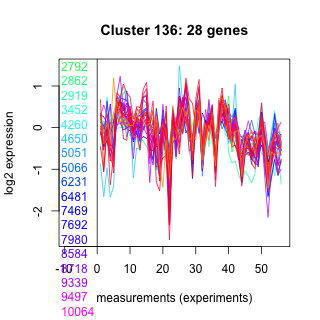 |
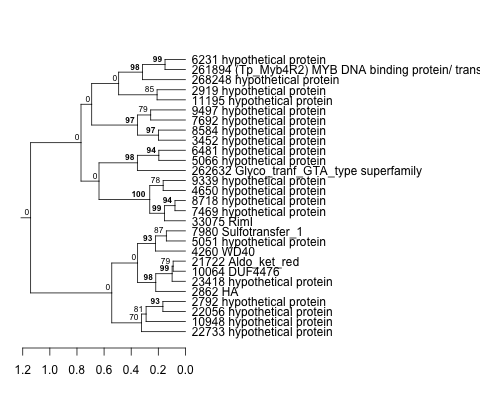 |
0.0034 |
0.034 |
340 |
diel_light_vs_dark | 0.047500 | 0.323 |
| Title | Cluster Plot | Dendrogram | e-value | e-value | e-value | Condition | Condition FDR | Condition Difference |
|---|---|---|---|---|---|---|---|---|
| Thaps_hclust_0257 |
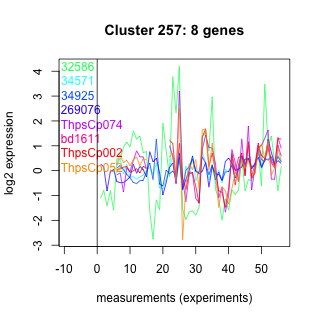 |
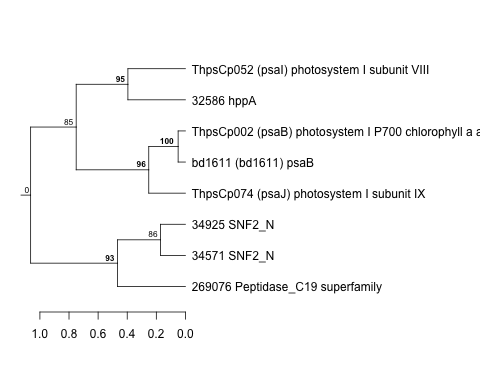 |
Not available | Not available | Not available | highlight_arrays | 0.047600 | -0.481 |
| Title | Cluster Plot | Dendrogram | e-value | e-value | e-value | Condition | Condition FDR | Condition Difference |
|---|---|---|---|---|---|---|---|---|
| Thaps_hclust_0252 |
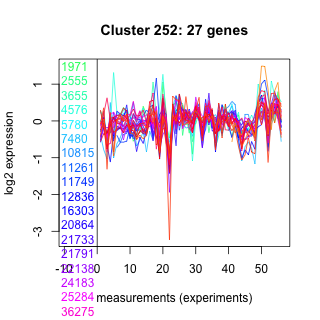 |
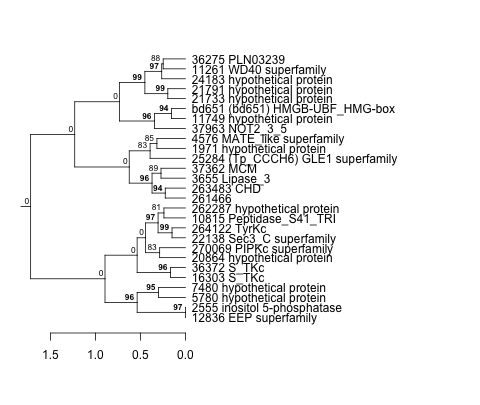 |
0.000053 |
0.0057 |
2.1 |
lowN_TMEVA | 0.047600 | -0.525 |
| Title | Cluster Plot | Dendrogram | e-value | e-value | e-value | Condition | Condition FDR | Condition Difference |
|---|---|---|---|---|---|---|---|---|
| Thaps_hclust_0392 |
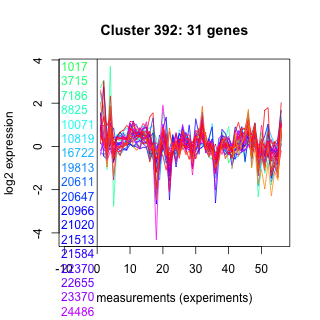 |
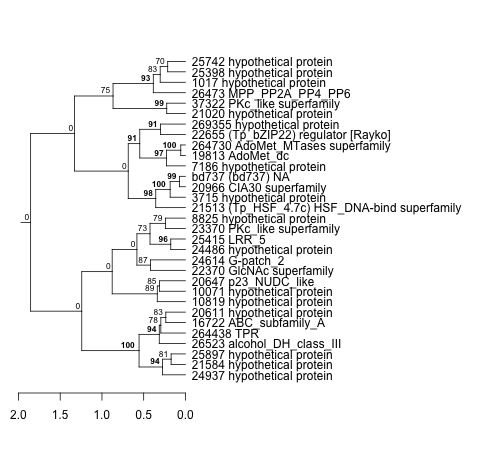 |
0.00055 |
0.0027 |
0.19 |
lowtemp_TMEVA | 0.047700 | -0.393 |
| Title | Cluster Plot | Dendrogram | e-value | e-value | e-value | Condition | Condition FDR | Condition Difference |
|---|---|---|---|---|---|---|---|---|
| Thaps_hclust_0008 |
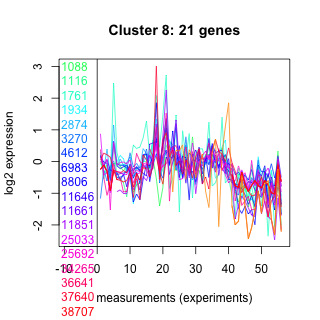 |
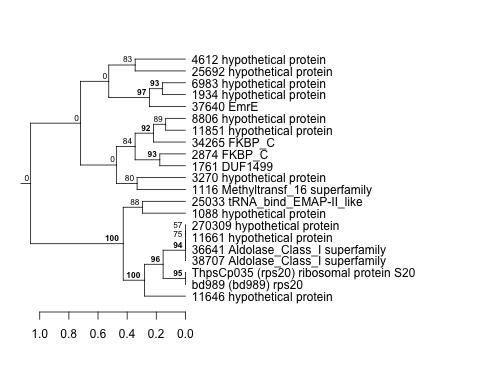 |
0.000000000000034 |
0.0000000000037 |
0.0000000000018 |
exponential_vs_stationary_24highlight | 0.047800 | 0.197 |
| Title | Cluster Plot | Dendrogram | e-value | e-value | e-value | Condition | Condition FDR | Condition Difference |
|---|---|---|---|---|---|---|---|---|
| Thaps_hclust_0277 |
 |
 |
0.00036 |
6.6 |
7.6 |
exponential_vs_stationary_24light | 0.047800 | -0.758 |
| Title | Cluster Plot | Dendrogram | e-value | e-value | e-value | Condition | Condition FDR | Condition Difference |
|---|---|---|---|---|---|---|---|---|
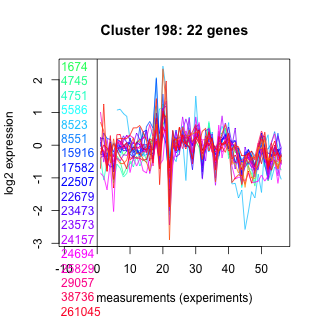
| Thaps_hclust_0198 |
 |
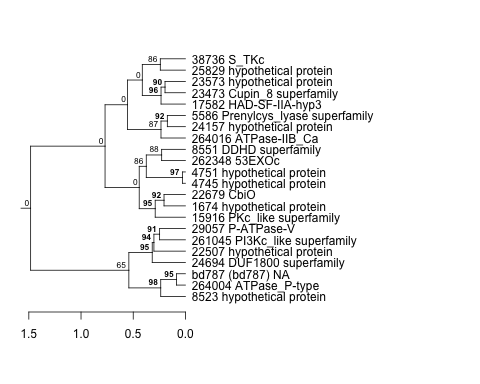 |
0.00091 |
0.017 |
0.0046 |
diel_exponential_vs_stationary | 0.047900 | -0.32 |
| Title | Cluster Plot | Dendrogram | e-value | e-value | e-value | Condition | Condition FDR | Condition Difference |
|---|---|---|---|---|---|---|---|---|
| Thaps_hclust_0148 |
 |
 |
4.7 |
39 |
51 |
highlight_arrays | 0.047900 | -0.304 |
| Title | Cluster Plot | Dendrogram | e-value | e-value | e-value | Condition | Condition FDR | Condition Difference |
|---|---|---|---|---|---|---|---|---|
| Thaps_hclust_0088 |
 |
 |
0.036 |
27 |
18 |
co2_elevated_expo_arrays | 0.047900 | 0.295 |
| Title | Cluster Plot | Dendrogram | e-value | e-value | e-value | Condition | Condition FDR | Condition Difference |
|---|---|---|---|---|---|---|---|---|
| Thaps_hclust_0485 |
 |
 |
0.0012 |
0.0078 |
0.16 |
lowFe_KTKB_Day3 | 0.048400 | 0.269 |
| Title | Cluster Plot | Dendrogram | e-value | e-value | e-value | Condition | Condition FDR | Condition Difference |
|---|---|---|---|---|---|---|---|---|
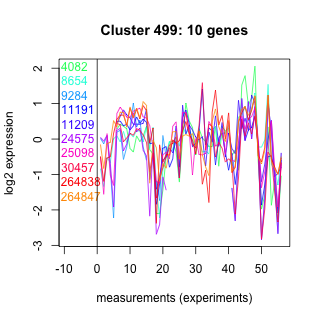
| Thaps_hclust_0499 |
 |
 |
0.13 |
5.4 |
18 |
lowFe_KTKB_Day3 | 0.048400 | -0.655 |
| Title | Cluster Plot | Dendrogram | e-value | e-value | e-value | Condition | Condition FDR | Condition Difference |
|---|---|---|---|---|---|---|---|---|
| Thaps_hclust_0426 |
 |
 |
0.0000000000000021 |
0.00000000000026 |
0.000025 |
highpH_TMEVA | 0.048400 | -0.286 |
| Title | Cluster Plot | Dendrogram | e-value | e-value | e-value | Condition | Condition FDR | Condition Difference |
|---|---|---|---|---|---|---|---|---|
| Thaps_hclust_0052 |
 |
 |
1.4e-22 |
3.3e-19 |
0.0000000000037 |
co2_elevated_stat_arrays | 0.048700 | 0.324 |
| Title | Cluster Plot | Dendrogram | e-value | e-value | e-value | Condition | Condition FDR | Condition Difference |
|---|---|---|---|---|---|---|---|---|
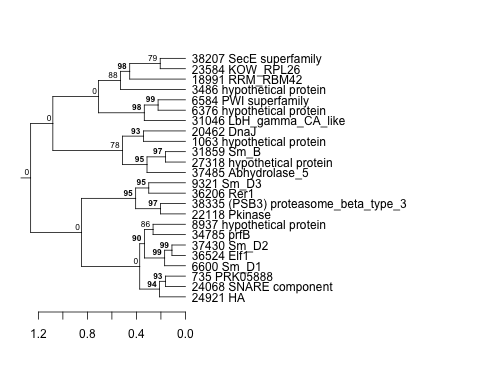
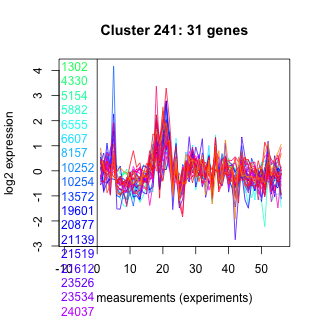
| Thaps_hclust_0241 |
 |
 |
0.0000000022 |
0.0000017 |
0.68 |
diel_light_vs_dark | 0.048900 | -0.308 |
| Title | Cluster Plot | Dendrogram | e-value | e-value | e-value | Condition | Condition FDR | Condition Difference |
|---|---|---|---|---|---|---|---|---|
| Thaps_hclust_0443 |
 |
 |
0.96 |
9.8 |
42 |
diel_light_vs_dark | 0.048900 | 0.498 |
| Title | Cluster Plot | Dendrogram | e-value | e-value | e-value | Condition | Condition FDR | Condition Difference |
|---|---|---|---|---|---|---|---|---|
| Thaps_hclust_0109 |
 |
 |
17 |
32 |
5.5 |
co2_elevated_stat_arrays | 0.049000 | 0.516 |
| Title | Cluster Plot | Dendrogram | e-value | e-value | e-value | Condition | Condition FDR | Condition Difference |
|---|---|---|---|---|---|---|---|---|
| Thaps_hclust_0490 |
 |
 |
0.6 |
9.5 |
74 |
highlight_arrays | 0.049300 | 0.343 |
| Title | Cluster Plot | Dendrogram | e-value | e-value | e-value | Condition | Condition FDR | Condition Difference |
|---|---|---|---|---|---|---|---|---|
| Thaps_hclust_0472 |
 |
 |
0.00000011 |
0.000015 |
0.00015 |
highpH_TMEVA | 0.049400 | -0.313 |
| Title | Cluster Plot | Dendrogram | e-value | e-value | e-value | Condition | Condition FDR | Condition Difference |
|---|---|---|---|---|---|---|---|---|
| Thaps_hclust_0435 |
 |
 |
0.17 |
0.24 |
1.5 |
highpH_TMEVA | 0.049400 | 0.432 |
| Title | Cluster Plot | Dendrogram | e-value | e-value | e-value | Condition | Condition FDR | Condition Difference |
|---|---|---|---|---|---|---|---|---|
| Thaps_hclust_0433 |
 |
 |
14 |
54 |
440 |
highpH_TMEVA | 0.049400 | -0.386 |
| Title | Cluster Plot | Dendrogram | e-value | e-value | e-value | Condition | Condition FDR | Condition Difference |
|---|---|---|---|---|---|---|---|---|
| Thaps_hclust_0022 |
 |
|
1.9e-31 |
2.4e-22 |
6.4e-20 |
lowFe_KTKB_Day3 | 0.049500 | 0.245 |
| Title | Cluster Plot | Dendrogram | e-value | e-value | e-value | Condition | Condition FDR | Condition Difference |
|---|---|---|---|---|---|---|---|---|
| Thaps_hclust_0010 |
 |
 |
0.0000000000019 |
0.000000000035 |
0.013 |
exponential_vs_stationary_24highlight | 0.049700 | 0.139 |
| Title | Cluster Plot | Dendrogram | e-value | e-value | e-value | Condition | Condition FDR | Condition Difference |
|---|---|---|---|---|---|---|---|---|
| Thaps_hclust_0410 |
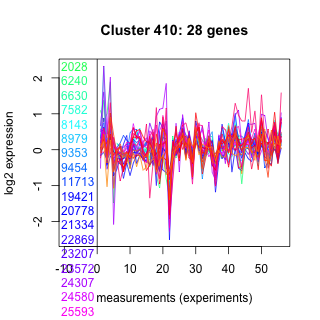 |
 |
0.065 |
0.56 |
0.36 |
lowSi_TMEVA | 0.050000 | 0.638 |
| Title | Cluster Plot | Dendrogram | e-value | e-value | e-value | Condition | Condition FDR | Condition Difference |
|---|---|---|---|---|---|---|---|---|
| Thaps_hclust_0411 |
 |
 |
0.00079 |
0.0092 |
0.029 |
lowSi_TMEVA | 0.050000 | 0.62 |
| Thaps_hclust_0411 |
|
|
0.00079 |
0.0092 |
0.029 |
highlight_arrays | 0.050500 | 0.232 |
| Title | Cluster Plot | Dendrogram | e-value | e-value | e-value | Condition | Condition FDR | Condition Difference |
|---|---|---|---|---|---|---|---|---|
| Thaps_hclust_0268 |
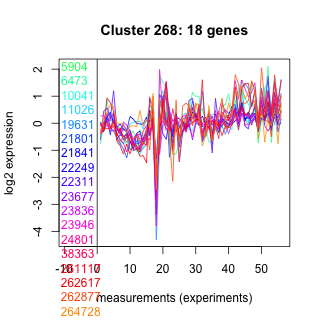 |
 |
0.17 |
14 |
60 |
exponential_vs_stationary_24light | 0.050000 | -0.638 |
| Title | Cluster Plot | Dendrogram | e-value | e-value | e-value | Condition | Condition FDR | Condition Difference |
|---|---|---|---|---|---|---|---|---|
| Thaps_hclust_0494 |
 |
 |
6.7 |
15 |
60 |
lowSi_TMEVA | 0.050000 | -0.762 |
| Title | Cluster Plot | Dendrogram | e-value | e-value | e-value | Condition | Condition FDR | Condition Difference |
|---|---|---|---|---|---|---|---|---|
| Thaps_hclust_0389 |
 |
 |
0.00000008 |
0.00077 |
340 |
highlight_arrays | 0.050500 | 0.285 |
| Title | Cluster Plot | Dendrogram | e-value | e-value | e-value | Condition | Condition FDR | Condition Difference |
|---|---|---|---|---|---|---|---|---|
| Thaps_hclust_0403 |
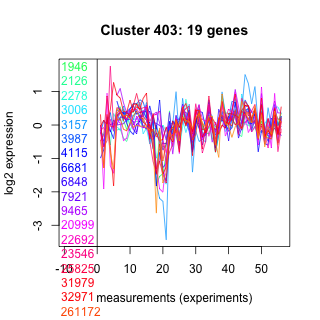 |
 |
0.83 |
0.015 |
0.016 |
highlight_arrays | 0.050500 | 0.306 |