Hierarchical Clusters
Displaying 1101 - 1200 of 7500
| Title | Cluster Plot | Dendrogram | e-value | e-value | e-value | Condition | Condition FDR | Condition Difference |
|---|---|---|---|---|---|---|---|---|
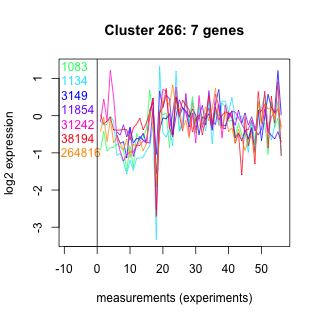
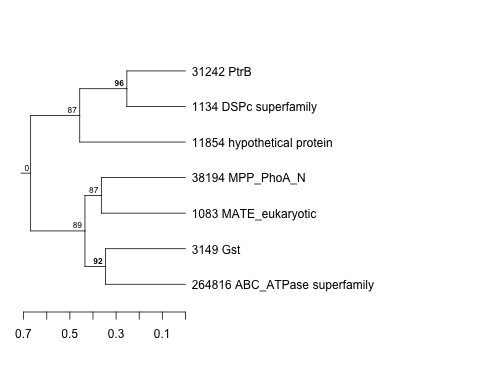
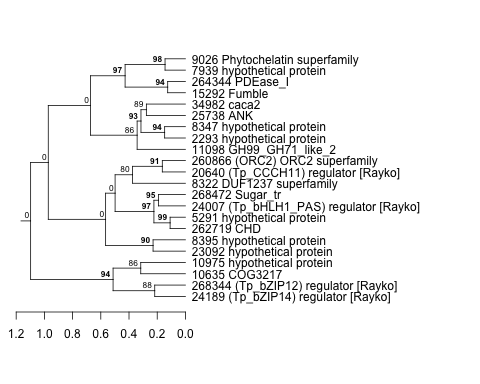
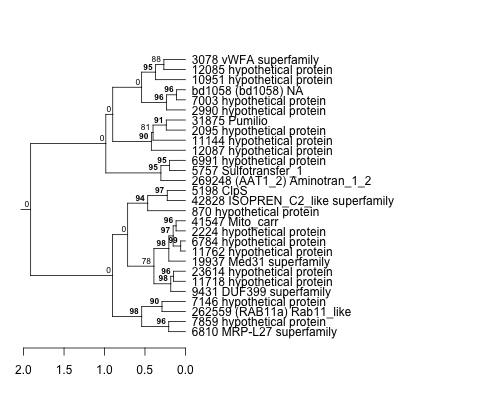
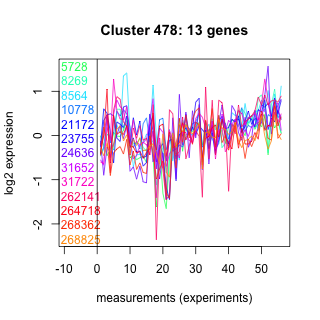
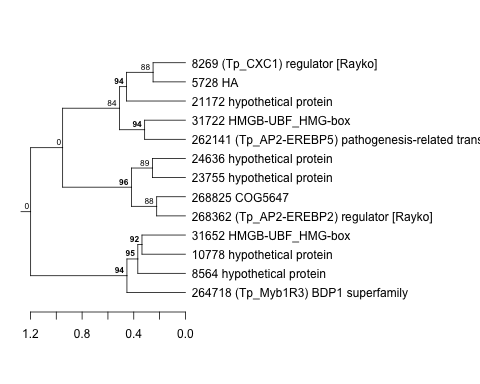
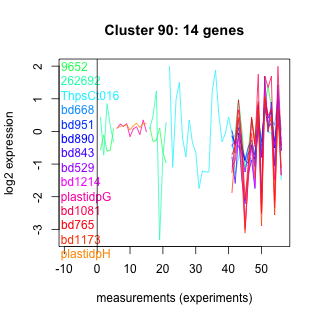
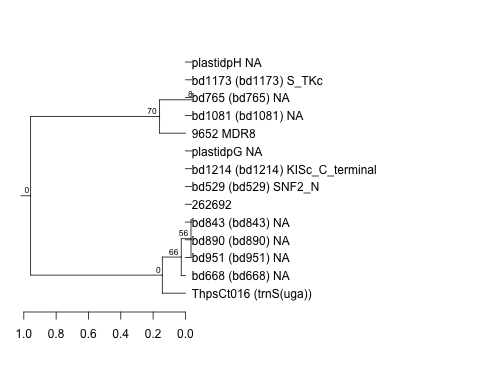
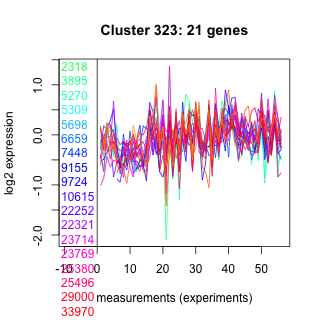
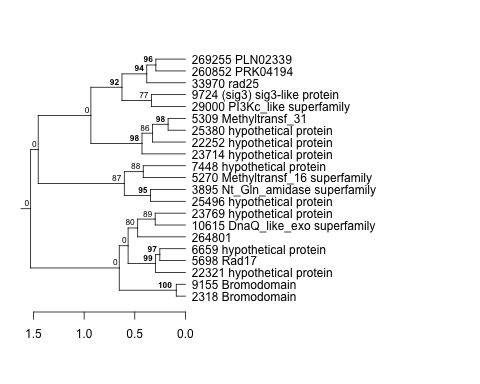
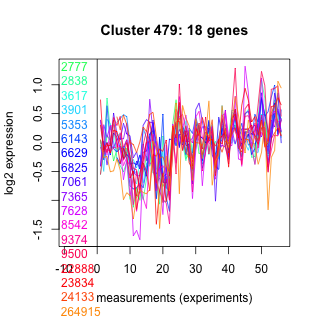
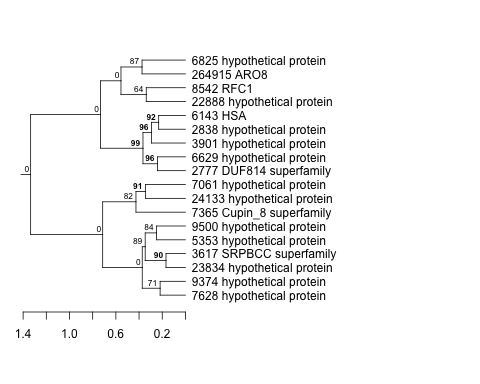
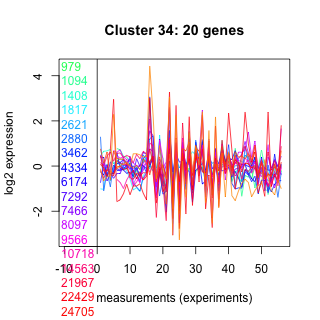
| Thaps_hclust_0266 |
 |
 |
0.44 |
17 |
30 |
co2_elevated_expo_arrays | 0.873000 | 0.0807 |
| Thaps_hclust_0266 |
|
|
0.44 |
17 |
30 |
lowFe_KTKB_Day3 | 0.863000 | -0.0809 |
| Title | Cluster Plot | Dendrogram | e-value | e-value | e-value | Condition | Condition FDR | Condition Difference |
|---|---|---|---|---|---|---|---|---|
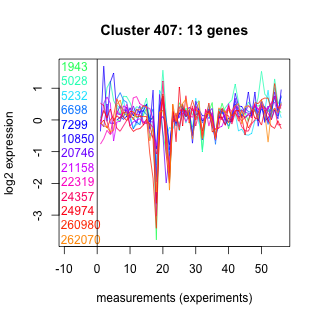
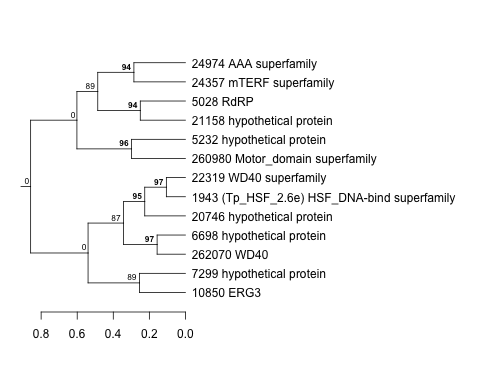
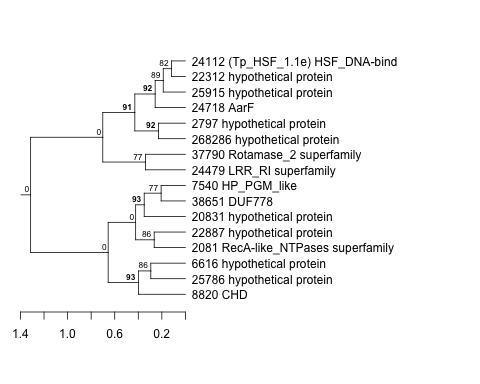
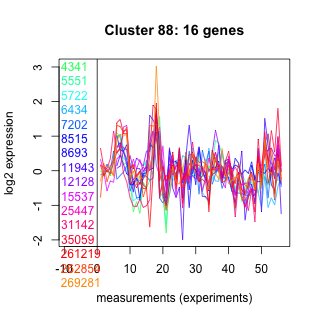
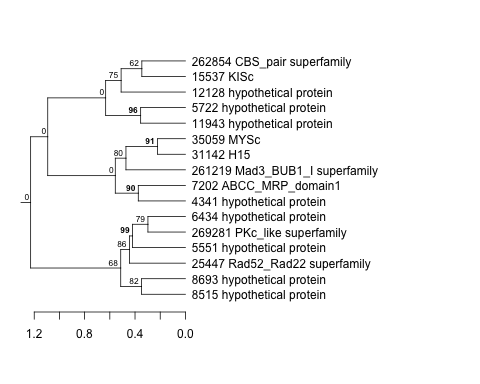
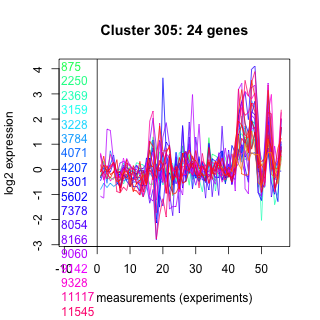
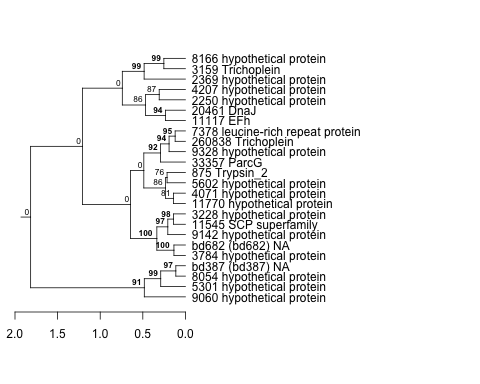
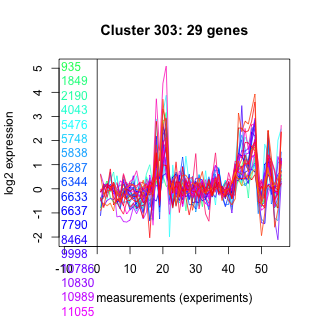
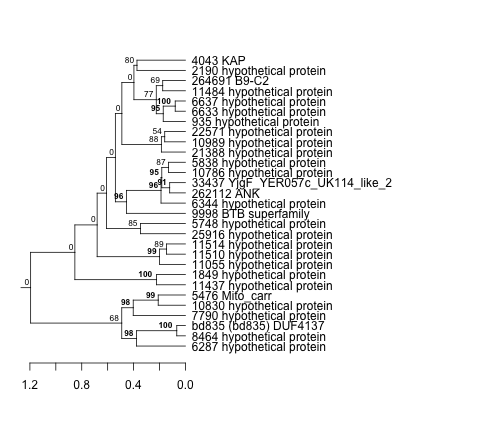
| Thaps_hclust_0407 |
 |
 |
25 |
77 |
290 |
co2_elevated_expo_arrays | 0.873000 | 0.0689 |
| Title | Cluster Plot | Dendrogram | e-value | e-value | e-value | Condition | Condition FDR | Condition Difference |
|---|---|---|---|---|---|---|---|---|
| Thaps_hclust_0061 |
 |
 |
0.000000062 |
0.00063 |
0.032 |
co2_elevated_expo_arrays | 0.873000 | 0.0678 |
| Title | Cluster Plot | Dendrogram | e-value | e-value | e-value | Condition | Condition FDR | Condition Difference |
|---|---|---|---|---|---|---|---|---|
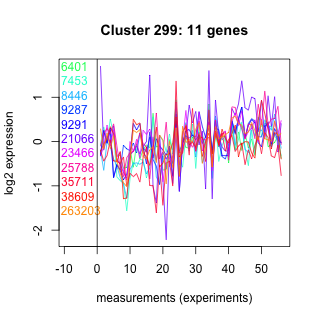
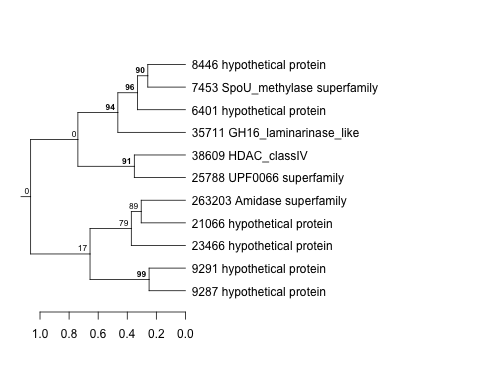
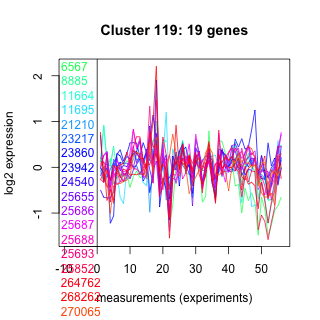
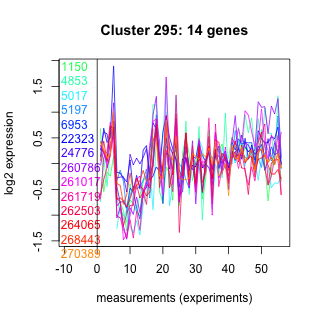
| Thaps_hclust_0299 |
 |
 |
0.0056 |
1.7 |
6.7 |
co2_elevated_expo_arrays | 0.873000 | 0.0692 |
| Thaps_hclust_0299 |
|
|
0.0056 |
1.7 |
6.7 |
lowN_TMEVA | 0.861000 | 0.0641 |
| Thaps_hclust_0299 |
|
|
0.0056 |
1.7 |
6.7 |
highlight_arrays | 0.860000 | 0.0411 |
| Title | Cluster Plot | Dendrogram | e-value | e-value | e-value | Condition | Condition FDR | Condition Difference |
|---|---|---|---|---|---|---|---|---|
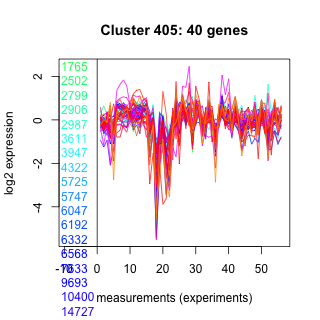
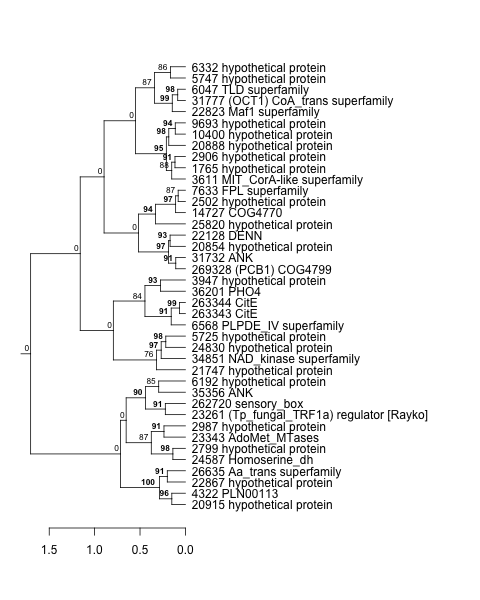
| Thaps_hclust_0405 |
 |
 |
0.00000000036 |
0.0000000063 |
0.005 |
co2_elevated_expo_arrays | 0.873000 | 0.0584 |
| Title | Cluster Plot | Dendrogram | e-value | e-value | e-value | Condition | Condition FDR | Condition Difference |
|---|---|---|---|---|---|---|---|---|
| Thaps_hclust_0457 |
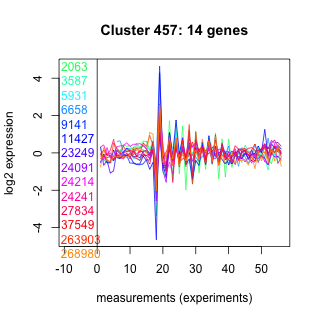 |
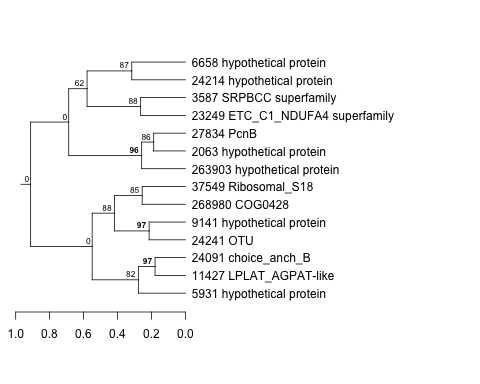 |
0.0000081 |
0.1 |
0.53 |
co2_elevated_expo_arrays | 0.873000 | 0.0687 |
| Thaps_hclust_0457 |
|
|
0.0000081 |
0.1 |
0.53 |
exponential_vs_stationary_24highlight | 0.862000 | -0.0263 |
| Title | Cluster Plot | Dendrogram | e-value | e-value | e-value | Condition | Condition FDR | Condition Difference |
|---|---|---|---|---|---|---|---|---|
| Thaps_hclust_0083 |
 |
 |
0.0039 |
6.3 |
14 |
lowtemp_TMEVA | 0.873000 | -0.05 |
| Title | Cluster Plot | Dendrogram | e-value | e-value | e-value | Condition | Condition FDR | Condition Difference |
|---|---|---|---|---|---|---|---|---|
| Thaps_hclust_0473 |
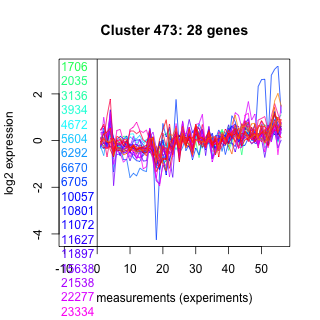 |
 |
0.00036 |
0.0036 |
0.68 |
co2_elevated_expo_arrays | 0.873000 | -0.0596 |
| Title | Cluster Plot | Dendrogram | e-value | e-value | e-value | Condition | Condition FDR | Condition Difference |
|---|---|---|---|---|---|---|---|---|
| Thaps_hclust_0166 |
 |
 |
0.001 |
5.3 |
63 |
lowFe_KTKB_Day5 | 0.872000 | -0.0467 |
| Title | Cluster Plot | Dendrogram | e-value | e-value | e-value | Condition | Condition FDR | Condition Difference |
|---|---|---|---|---|---|---|---|---|
| Thaps_hclust_0274 |
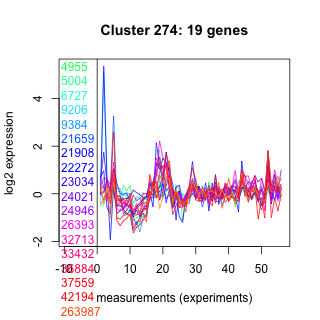 |
 |
0.0000064 |
0.048 |
6.7 |
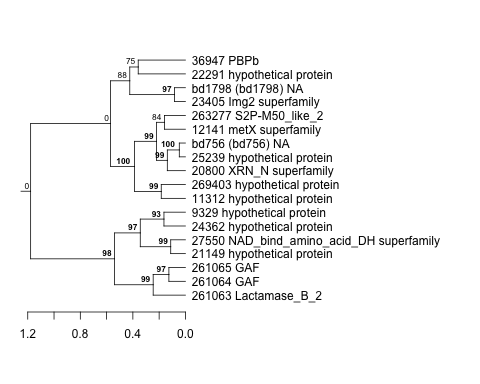
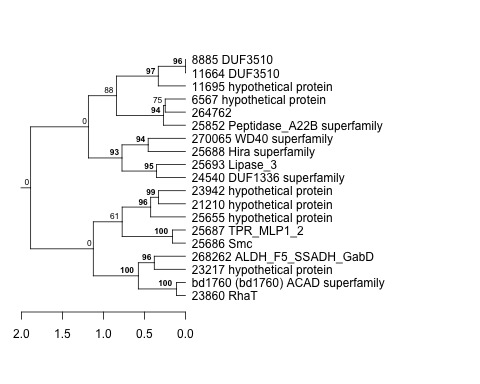
diel_light_vs_dark | 0.872000 | -0.0508 |
| Title | Cluster Plot | Dendrogram | e-value | e-value | e-value | Condition | Condition FDR | Condition Difference |
|---|---|---|---|---|---|---|---|---|
| Thaps_hclust_0261 |
 |
 |
0.00000000025 |
0.000000005 |
0.0000069 |
lowtemp_TMEVA | 0.872000 | 0.0392 |
| Title | Cluster Plot | Dendrogram | e-value | e-value | e-value | Condition | Condition FDR | Condition Difference |
|---|---|---|---|---|---|---|---|---|
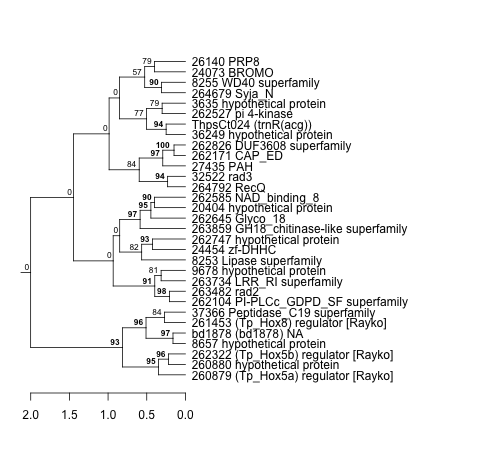
| Thaps_hclust_0310 |
 |
 |
4.9 |
19 |
86 |
diel_light_vs_dark | 0.871000 | -0.0732 |
| Title | Cluster Plot | Dendrogram | e-value | e-value | e-value | Condition | Condition FDR | Condition Difference |
|---|---|---|---|---|---|---|---|---|
| Thaps_hclust_0050 |
 |
 |
0.0000000011 |
0.0000042 |
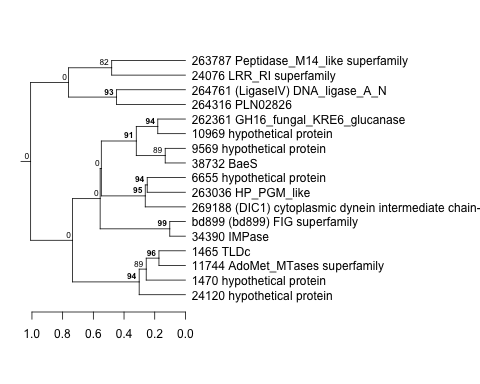
0.00021 |
lowFe_KTKB_Day5 | 0.870000 | -0.0368 |
| Title | Cluster Plot | Dendrogram | e-value | e-value | e-value | Condition | Condition FDR | Condition Difference |
|---|---|---|---|---|---|---|---|---|
| Thaps_hclust_0207 |
 |
 |
0.0000000025 |
0.0000000037 |
0.1 |
lowFe_TMEVA | 0.869000 | 0.0624 |
| Title | Cluster Plot | Dendrogram | e-value | e-value | e-value | Condition | Condition FDR | Condition Difference |
|---|---|---|---|---|---|---|---|---|
| Thaps_hclust_0434 |
 |
 |
0.011 |
17 |
57 |
exponential_vs_stationary_24light | 0.869000 | -0.091 |
| Title | Cluster Plot | Dendrogram | e-value | e-value | e-value | Condition | Condition FDR | Condition Difference |
|---|---|---|---|---|---|---|---|---|
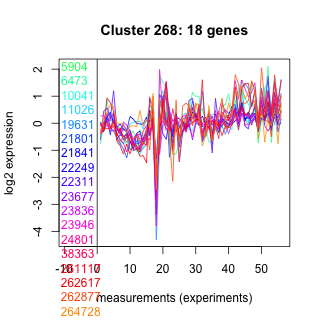
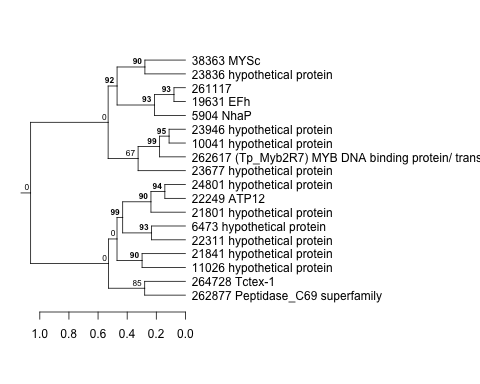
| Thaps_hclust_0268 |
 |
 |
0.17 |
14 |
60 |
lowFe_TMEVA | 0.869000 | -0.0669 |
| Title | Cluster Plot | Dendrogram | e-value | e-value | e-value | Condition | Condition FDR | Condition Difference |
|---|---|---|---|---|---|---|---|---|
| Thaps_hclust_0086 |
 |
 |
0.0000000068 |
0.01 |
0.0037 |
diel_exponential_vs_stationary | 0.868000 | 0.0336 |
| Title | Cluster Plot | Dendrogram | e-value | e-value | e-value | Condition | Condition FDR | Condition Difference |
|---|---|---|---|---|---|---|---|---|
| Thaps_hclust_0238 |
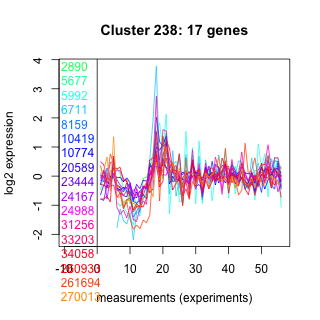 |
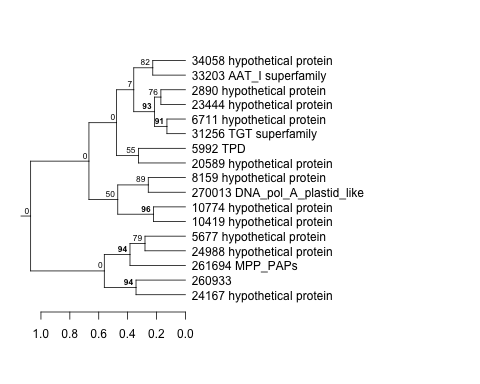 |
0.0018 |
0.095 |
0.069 |
co2_elevated_stat_arrays | 0.867000 | 0.0493 |
| Title | Cluster Plot | Dendrogram | e-value | e-value | e-value | Condition | Condition FDR | Condition Difference |
|---|---|---|---|---|---|---|---|---|
| Thaps_hclust_0001 |
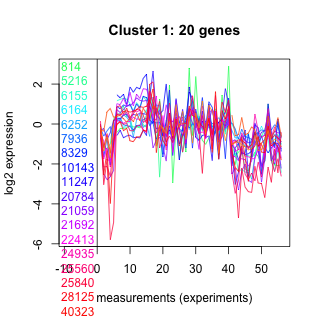 |
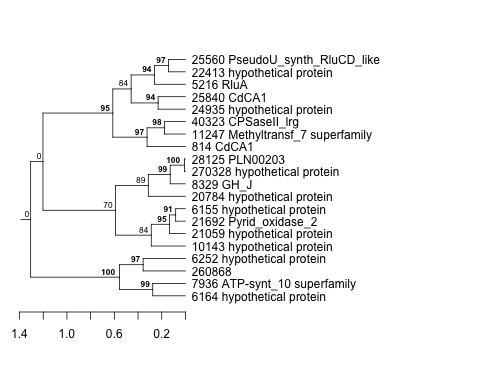 |
0.0033 |
0.052 |
2 |
exponential_vs_stationary_24light | 0.867000 | -0.0688 |
| Title | Cluster Plot | Dendrogram | e-value | e-value | e-value | Condition | Condition FDR | Condition Difference |
|---|---|---|---|---|---|---|---|---|
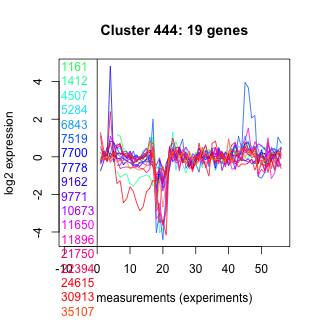
| Thaps_hclust_0444 |
 |
 |
14 |
140 |
1.6 |
diel_light_vs_dark | 0.867000 | 0.0526 |
| Title | Cluster Plot | Dendrogram | e-value | e-value | e-value | Condition | Condition FDR | Condition Difference |
|---|---|---|---|---|---|---|---|---|
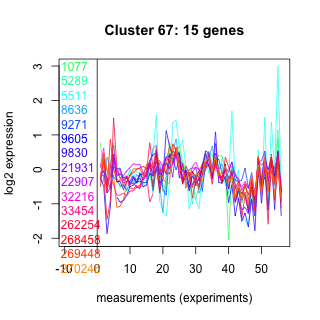
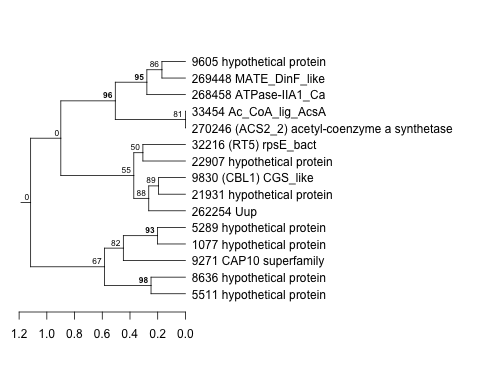
| Thaps_hclust_0067 |
 |
 |
0.0036 |
0.86 |
0.11 |
lowSi_TMEVA | 0.867000 | -0.196 |
| Title | Cluster Plot | Dendrogram | e-value | e-value | e-value | Condition | Condition FDR | Condition Difference |
|---|---|---|---|---|---|---|---|---|
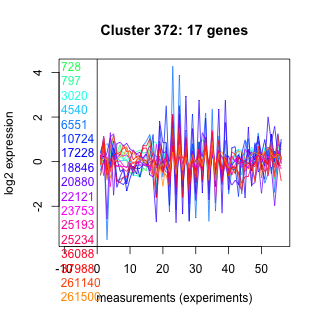
| Thaps_hclust_0372 |
 |
 |
0.0016 |
0.064 |
18 |
highpH_TMEVA | 0.867000 | -0.038 |
| Title | Cluster Plot | Dendrogram | e-value | e-value | e-value | Condition | Condition FDR | Condition Difference |
|---|---|---|---|---|---|---|---|---|
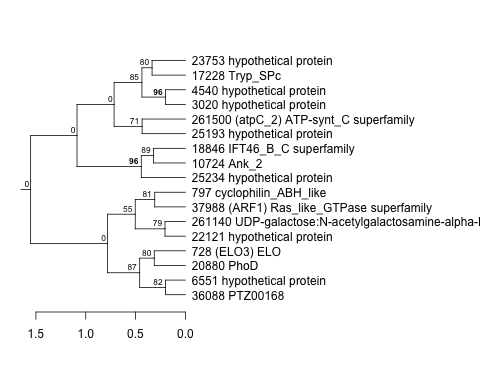
| Thaps_hclust_0296 |
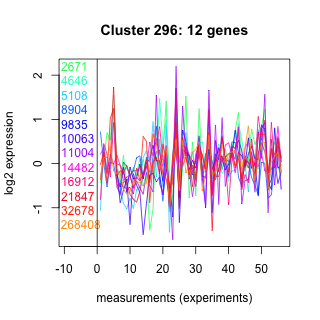 |
 |
0.17 |
1.8 |
0.83 |
lowN_TMEVA | 0.866000 | -0.062 |
| Title | Cluster Plot | Dendrogram | e-value | e-value | e-value | Condition | Condition FDR | Condition Difference |
|---|---|---|---|---|---|---|---|---|
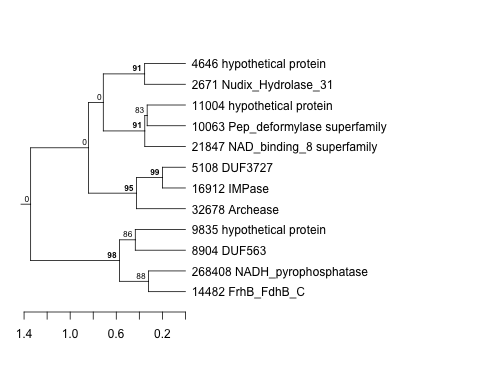
| Thaps_hclust_0189 |
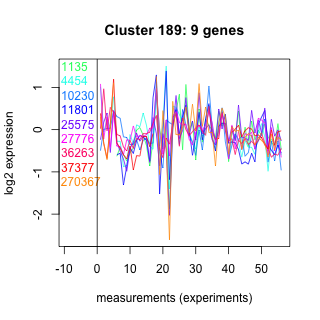 |
 |
0.0012 |
0.00048 |
0.015 |
lowN_TMEVA | 0.866000 | -0.0656 |
| Thaps_hclust_0189 |
|
|
0.0012 |
0.00048 |
0.015 |
BaP | 0.865000 | 0.0662 |
| Title | Cluster Plot | Dendrogram | e-value | e-value | e-value | Condition | Condition FDR | Condition Difference |
|---|---|---|---|---|---|---|---|---|
| Thaps_hclust_0053 |
 |
 |
0.000012 |
0.000065 |
0.009 |
lowN_TMEVA | 0.866000 | -0.0648 |
| Title | Cluster Plot | Dendrogram | e-value | e-value | e-value | Condition | Condition FDR | Condition Difference |
|---|---|---|---|---|---|---|---|---|
| Thaps_hclust_0126 |
 |
 |
0.025 |
1.3 |
0.6 |
lowN_TMEVA | 0.866000 | 0.0539 |
| Title | Cluster Plot | Dendrogram | e-value | e-value | e-value | Condition | Condition FDR | Condition Difference |
|---|---|---|---|---|---|---|---|---|
| Thaps_hclust_0011 |
 |
 |
0.000023 |
10 |
1.3 |
lowFe_KTKB_Day3 | 0.866000 | -0.0531 |
| Title | Cluster Plot | Dendrogram | e-value | e-value | e-value | Condition | Condition FDR | Condition Difference |
|---|---|---|---|---|---|---|---|---|
| Thaps_hclust_0095 |
 |
 |
5.3e-28 |
1.7e-25 |
1.6e-17 |
lowFe_KTKB_Day5 | 0.865000 | -0.0291 |
| Title | Cluster Plot | Dendrogram | e-value | e-value | e-value | Condition | Condition FDR | Condition Difference |
|---|---|---|---|---|---|---|---|---|
| Thaps_hclust_0066 |
 |
 |
0.0000000000000019 |
0.00000025 |
0.00000047 |
BaP | 0.865000 | -0.0346 |
| Title | Cluster Plot | Dendrogram | e-value | e-value | e-value | Condition | Condition FDR | Condition Difference |
|---|---|---|---|---|---|---|---|---|
| Thaps_hclust_0282 |
 |
 |
0.0005 |
0.0059 |
0.15 |
lowFe_KTKB_Day5 | 0.864000 | -0.0393 |
| Title | Cluster Plot | Dendrogram | e-value | e-value | e-value | Condition | Condition FDR | Condition Difference |
|---|---|---|---|---|---|---|---|---|
| Thaps_hclust_0311 |
 |
 |
4.1 |
0.64 |
12 |
lowFe_KTKB_Day3 | 0.864000 | -0.0564 |
| Title | Cluster Plot | Dendrogram | e-value | e-value | e-value | Condition | Condition FDR | Condition Difference |
|---|---|---|---|---|---|---|---|---|
| Thaps_hclust_0224 |
 |
 |
9.3e-28 |
1.9e-21 |
0.046 |
lowFe_KTKB_Day5 | 0.864000 | -0.0242 |
| Title | Cluster Plot | Dendrogram | e-value | e-value | e-value | Condition | Condition FDR | Condition Difference |
|---|---|---|---|---|---|---|---|---|
| Thaps_hclust_0399 |
 |
 |
0.0039 |
0.16 |
0.0016 |
exponential_vs_stationary_24highlight | 0.864000 | -0.0166 |
| Title | Cluster Plot | Dendrogram | e-value | e-value | e-value | Condition | Condition FDR | Condition Difference |
|---|---|---|---|---|---|---|---|---|
| Thaps_hclust_0183 |
 |
 |
0.000026 |
0.000017 |
0.00004 |
lowFe_KTKB_Day3 | 0.864000 | -0.0846 |
| Thaps_hclust_0183 |
|
|
0.000026 |
0.000017 |
0.00004 |
co2_elevated_stat_arrays | 0.861000 | -0.0722 |
| Title | Cluster Plot | Dendrogram | e-value | e-value | e-value | Condition | Condition FDR | Condition Difference |
|---|---|---|---|---|---|---|---|---|
| Thaps_hclust_0160 |
 |
 |
0.35 |
66 |
160 |
diel_light_vs_dark | 0.863000 | -0.0662 |
| Title | Cluster Plot | Dendrogram | e-value | e-value | e-value | Condition | Condition FDR | Condition Difference |
|---|---|---|---|---|---|---|---|---|
| Thaps_hclust_0158 |
 |
 |
0.007 |
0.55 |
1.2 |
diel_light_vs_dark | 0.863000 | 0.0594 |
| Title | Cluster Plot | Dendrogram | e-value | e-value | e-value | Condition | Condition FDR | Condition Difference |
|---|---|---|---|---|---|---|---|---|
| Thaps_hclust_0326 |
 |
 |
0.000000000000042 |
0.00000000011 |
0.00000051 |
lowSi_TMEVA | 0.863000 | 0.204 |
| Title | Cluster Plot | Dendrogram | e-value | e-value | e-value | Condition | Condition FDR | Condition Difference |
|---|---|---|---|---|---|---|---|---|
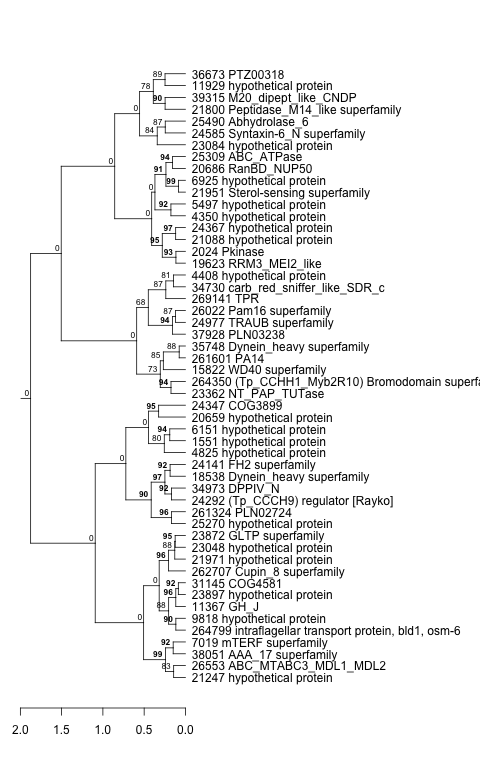
| Thaps_hclust_0400 |
 |
 |
Not available | Not available | Not available | exponential_vs_stationary_24highlight | 0.863000 | -0.0167 |
| Title | Cluster Plot | Dendrogram | e-value | e-value | e-value | Condition | Condition FDR | Condition Difference |
|---|---|---|---|---|---|---|---|---|
| Thaps_hclust_0480 |
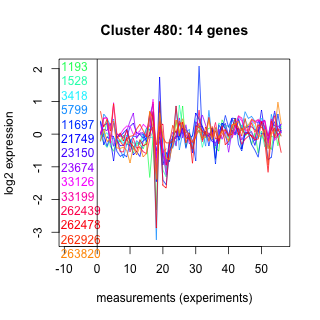 |
 |
0.18 |
1.3 |
44 |
diel_exponential_vs_stationary | 0.863000 | -0.048 |
| Title | Cluster Plot | Dendrogram | e-value | e-value | e-value | Condition | Condition FDR | Condition Difference |
|---|---|---|---|---|---|---|---|---|
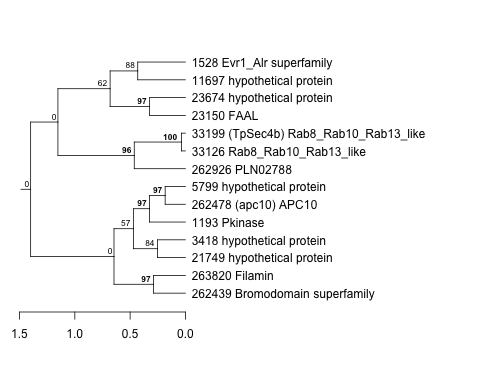
| Thaps_hclust_0245 |
 |
 |
0.52 |
100 |
150 |
exponential_vs_stationary_24light | 0.862000 | -0.0867 |
| Title | Cluster Plot | Dendrogram | e-value | e-value | e-value | Condition | Condition FDR | Condition Difference |
|---|---|---|---|---|---|---|---|---|
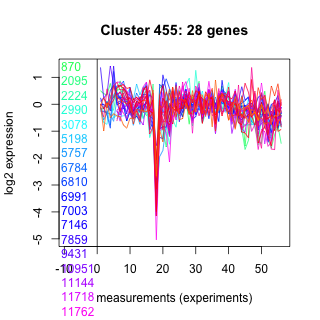
| Thaps_hclust_0455 |
 |
 |
0.00038 |
0.18 |
0.01 |
lowN_TMEVA | 0.862000 | -0.0538 |
| Title | Cluster Plot | Dendrogram | e-value | e-value | e-value | Condition | Condition FDR | Condition Difference |
|---|---|---|---|---|---|---|---|---|
| Thaps_hclust_0038 |
 |
 |
0.0016 |
0.024 |
17 |
exponential_vs_stationary_24highlight | 0.862000 | 0.0275 |
| Thaps_hclust_0038 |
|
|
0.0016 |
0.024 |
17 |
exponential_vs_stationary_24light | 0.862000 | 0.0875 |
| Title | Cluster Plot | Dendrogram | e-value | e-value | e-value | Condition | Condition FDR | Condition Difference |
|---|---|---|---|---|---|---|---|---|
| Thaps_hclust_0118 |
 |
 |
0.0037 |
1.2 |
1.4 |
exponential_vs_stationary_24light | 0.862000 | -0.0823 |
| Title | Cluster Plot | Dendrogram | e-value | e-value | e-value | Condition | Condition FDR | Condition Difference |
|---|---|---|---|---|---|---|---|---|
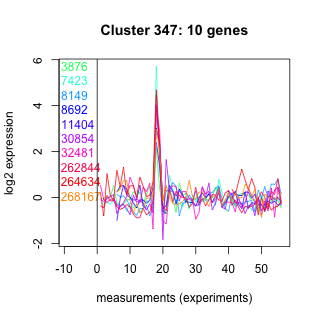
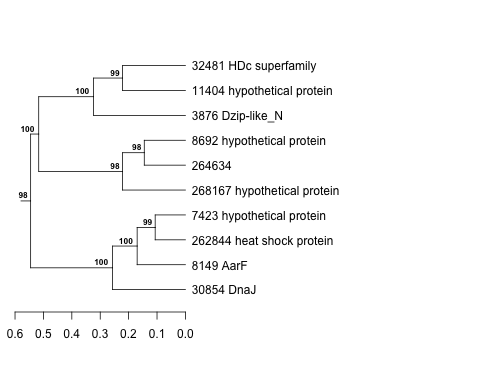
| Thaps_hclust_0347 |
 |
 |
1.2 |
0.85 |
91 |
exponential_vs_stationary_24light | 0.862000 | 0.0909 |
| Title | Cluster Plot | Dendrogram | e-value | e-value | e-value | Condition | Condition FDR | Condition Difference |
|---|---|---|---|---|---|---|---|---|
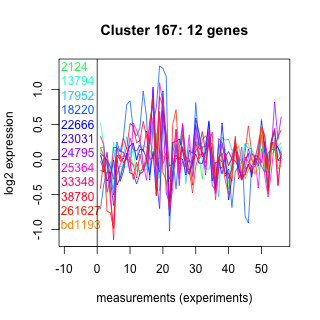
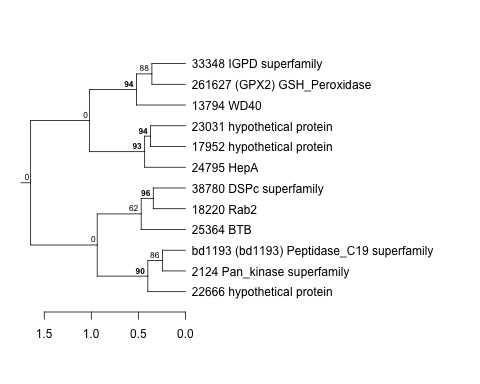
| Thaps_hclust_0167 |
 |
 |
1 |
15 |
160 |
exponential_vs_stationary_24light | 0.862000 | -0.084 |
| Title | Cluster Plot | Dendrogram | e-value | e-value | e-value | Condition | Condition FDR | Condition Difference |
|---|---|---|---|---|---|---|---|---|
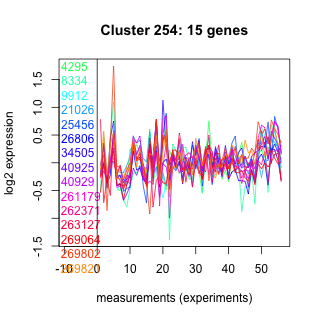
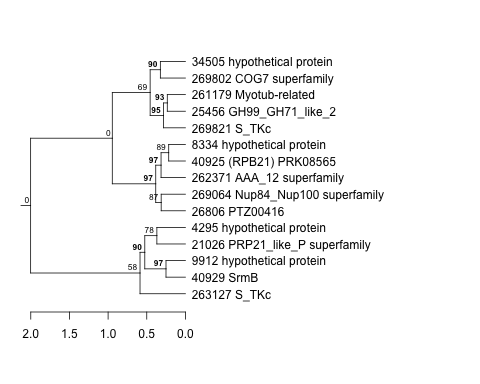
| Thaps_hclust_0254 |
 |
 |
0.00045 |
0.0045 |
5.8 |
exponential_vs_stationary_24light | 0.862000 | 0.0799 |
| Title | Cluster Plot | Dendrogram | e-value | e-value | e-value | Condition | Condition FDR | Condition Difference |
|---|---|---|---|---|---|---|---|---|
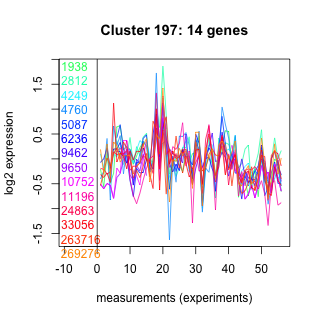
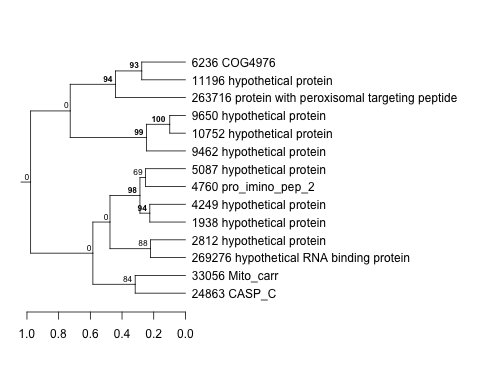
| Thaps_hclust_0197 |
 |
 |
0.12 |
0.3 |
0.65 |
exponential_vs_stationary_24light | 0.862000 | -0.0844 |
| Title | Cluster Plot | Dendrogram | e-value | e-value | e-value | Condition | Condition FDR | Condition Difference |
|---|---|---|---|---|---|---|---|---|
| Thaps_hclust_0478 |
 |
 |
0.1 |
0.0096 |
3.5 |
exponential_vs_stationary_24light | 0.862000 | -0.0838 |
| Title | Cluster Plot | Dendrogram | e-value | e-value | e-value | Condition | Condition FDR | Condition Difference |
|---|---|---|---|---|---|---|---|---|
| Thaps_hclust_0088 |
 |
 |
0.036 |
27 |
18 |
lowN_TMEVA | 0.861000 | -0.0633 |
| Title | Cluster Plot | Dendrogram | e-value | e-value | e-value | Condition | Condition FDR | Condition Difference |
|---|---|---|---|---|---|---|---|---|
| Thaps_hclust_0140 |
 |
 |
0.0000000084 |
0.000091 |
0.0000072 |
lowN_TMEVA | 0.861000 | 0.0589 |
| Title | Cluster Plot | Dendrogram | e-value | e-value | e-value | Condition | Condition FDR | Condition Difference |
|---|---|---|---|---|---|---|---|---|
| Thaps_hclust_0352 |
 |
 |
8.7 |
78 |
79 |
lowN_TMEVA | 0.861000 | 0.0675 |
| Title | Cluster Plot | Dendrogram | e-value | e-value | e-value | Condition | Condition FDR | Condition Difference |
|---|---|---|---|---|---|---|---|---|
| Thaps_hclust_0090 |
 |
 |
0.23 |
2.7 |
11 |
lowSi_TMEVA | 0.861000 | -0.201 |
| Title | Cluster Plot | Dendrogram | e-value | e-value | e-value | Condition | Condition FDR | Condition Difference |
|---|---|---|---|---|---|---|---|---|
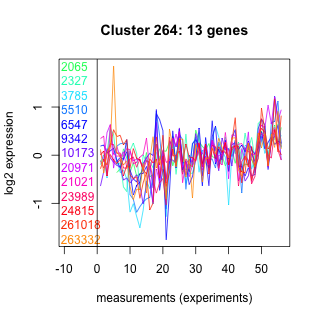
| Thaps_hclust_0264 |
 |
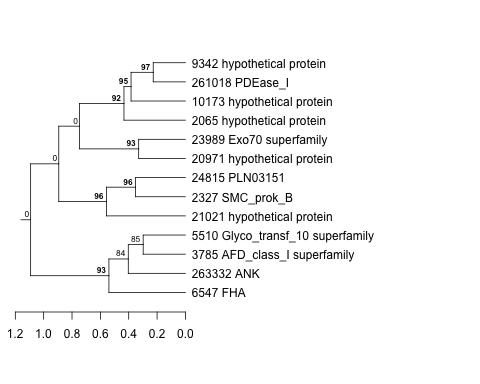 |
0.0079 |
0.24 |
5.8 |
lowN_TMEVA | 0.861000 | -0.0733 |
| Title | Cluster Plot | Dendrogram | e-value | e-value | e-value | Condition | Condition FDR | Condition Difference |
|---|---|---|---|---|---|---|---|---|
| Thaps_hclust_0003 |
 |
 |
0.24 |
16 |
240 |
lowN_TMEVA | 0.861000 | -0.0674 |
| Title | Cluster Plot | Dendrogram | e-value | e-value | e-value | Condition | Condition FDR | Condition Difference |
|---|---|---|---|---|---|---|---|---|
| Thaps_hclust_0002 |
 |
 |
0.00000029 |
0.000000009 |
0.000055 |
lowN_TMEVA | 0.861000 | -0.0606 |
| Title | Cluster Plot | Dendrogram | e-value | e-value | e-value | Condition | Condition FDR | Condition Difference |
|---|---|---|---|---|---|---|---|---|
| Thaps_hclust_0404 |
 |
 |
0.007 |
0.025 |
0.049 |
lowN_TMEVA | 0.861000 | 0.0657 |
| Title | Cluster Plot | Dendrogram | e-value | e-value | e-value | Condition | Condition FDR | Condition Difference |
|---|---|---|---|---|---|---|---|---|
| Thaps_hclust_0076 |
 |
 |
0.0047 |
0.13 |
1.2 |
BaP | 0.861000 | -0.0436 |
| Title | Cluster Plot | Dendrogram | e-value | e-value | e-value | Condition | Condition FDR | Condition Difference |
|---|---|---|---|---|---|---|---|---|
| Thaps_hclust_0378 |
 |
 |
0.0003 |
210 |
10 |
co2_elevated_stat_arrays | 0.861000 | 0.0537 |
| Title | Cluster Plot | Dendrogram | e-value | e-value | e-value | Condition | Condition FDR | Condition Difference |
|---|---|---|---|---|---|---|---|---|
| Thaps_hclust_0317 |
 |
 |
0.000000000082 |
0.00000001 |
0.00000042 |
lowSi_TMEVA | 0.861000 | 0.197 |
| Title | Cluster Plot | Dendrogram | e-value | e-value | e-value | Condition | Condition FDR | Condition Difference |
|---|---|---|---|---|---|---|---|---|
| Thaps_hclust_0119 |
 |
 |
0.000017 |
0.0015 |
0.0058 |
lowN_TMEVA | 0.861000 | -0.0611 |
| Title | Cluster Plot | Dendrogram | e-value | e-value | e-value | Condition | Condition FDR | Condition Difference |
|---|---|---|---|---|---|---|---|---|
| Thaps_hclust_0295 |
 |
 |
0.0000053 |
0.00095 |
0.0005 |
lowN_TMEVA | 0.861000 | 0.0677 |
| Title | Cluster Plot | Dendrogram | e-value | e-value | e-value | Condition | Condition FDR | Condition Difference |
|---|---|---|---|---|---|---|---|---|
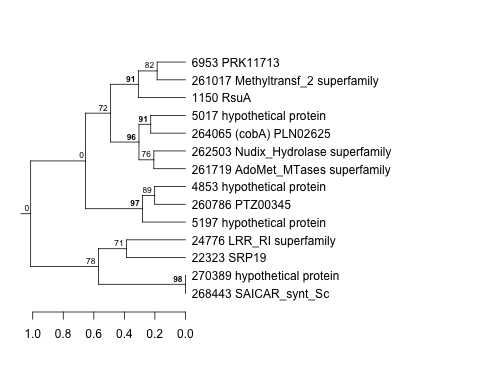
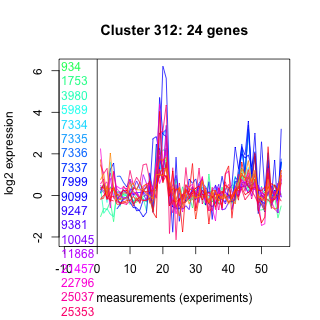
| Thaps_hclust_0312 |
 |
 |
1.6e-19 |
9.9e-16 |
0.000000000033 |
lowN_TMEVA | 0.861000 | 0.0571 |
| Title | Cluster Plot | Dendrogram | e-value | e-value | e-value | Condition | Condition FDR | Condition Difference |
|---|---|---|---|---|---|---|---|---|
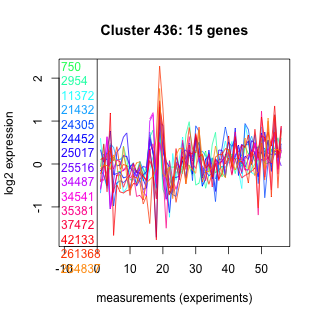
| Thaps_hclust_0436 |
 |
 |
0.067 |
0.93 |
0.55 |
lowN_TMEVA | 0.861000 | -0.0707 |
| Title | Cluster Plot | Dendrogram | e-value | e-value | e-value | Condition | Condition FDR | Condition Difference |
|---|---|---|---|---|---|---|---|---|
| Thaps_hclust_0188 |
 |
 |
0.0058 |
0.31 |
0.34 |
lowN_TMEVA | 0.861000 | 0.0669 |
| Title | Cluster Plot | Dendrogram | e-value | e-value | e-value | Condition | Condition FDR | Condition Difference |
|---|---|---|---|---|---|---|---|---|
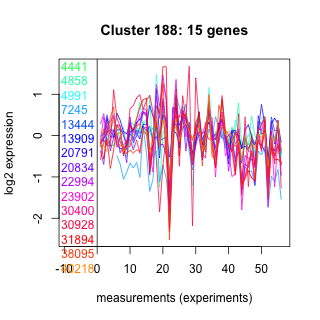
| Thaps_hclust_0267 |
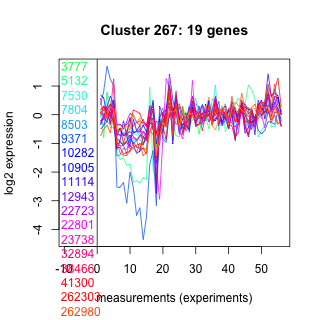 |
 |
0.00000003 |
0.39 |
0.58 |
exponential_vs_stationary_24highlight | 0.861000 | 0.023 |
| Title | Cluster Plot | Dendrogram | e-value | e-value | e-value | Condition | Condition FDR | Condition Difference |
|---|---|---|---|---|---|---|---|---|
| Thaps_hclust_0109 |
 |
 |
17 |
32 |
5.5 |
exponential_vs_stationary_24highlight | 0.861000 | -0.0284 |
| Title | Cluster Plot | Dendrogram | e-value | e-value | e-value | Condition | Condition FDR | Condition Difference |
|---|---|---|---|---|---|---|---|---|
| Thaps_hclust_0485 |
 |
 |
0.0012 |
0.0078 |
0.16 |
lowN_TMEVA | 0.861000 | 0.0612 |
| Title | Cluster Plot | Dendrogram | e-value | e-value | e-value | Condition | Condition FDR | Condition Difference |
|---|---|---|---|---|---|---|---|---|
| Thaps_hclust_0308 |
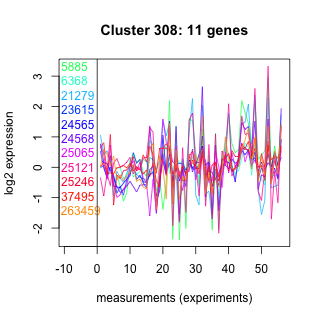 |
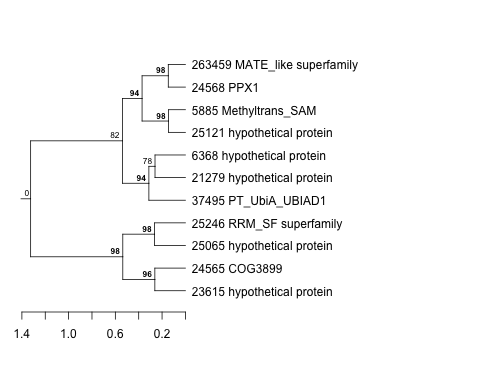 |
0.37 |
17 |
1.6 |
lowN_TMEVA | 0.861000 | -0.0666 |
| Title | Cluster Plot | Dendrogram | e-value | e-value | e-value | Condition | Condition FDR | Condition Difference |
|---|---|---|---|---|---|---|---|---|
| Thaps_hclust_0450 |
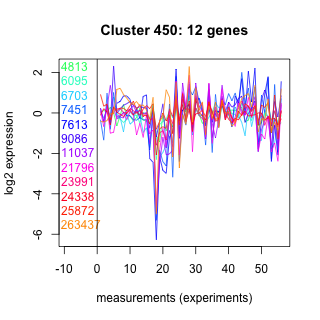 |
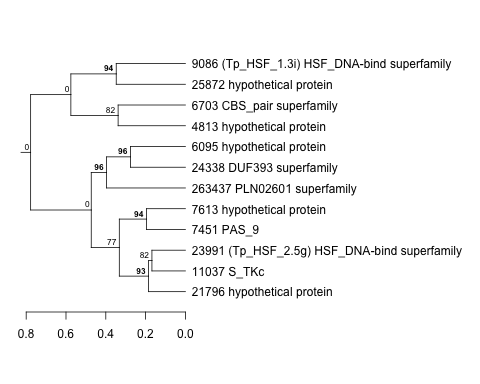 |
0.00076 |
0.024 |
0.16 |
lowSi_TMEVA | 0.861000 | -0.202 |
| Title | Cluster Plot | Dendrogram | e-value | e-value | e-value | Condition | Condition FDR | Condition Difference |
|---|---|---|---|---|---|---|---|---|
| Thaps_hclust_0395 |
 |
 |
0.0015 |
0.0018 |
0.48 |
lowN_TMEVA | 0.861000 | -0.0617 |
| Title | Cluster Plot | Dendrogram | e-value | e-value | e-value | Condition | Condition FDR | Condition Difference |
|---|---|---|---|---|---|---|---|---|
| Thaps_hclust_0004 |
 |
 |
0.000000074 |
0.0000031 |
0.0000044 |
lowtemp_TMEVA | 0.861000 | 0.0388 |
| Title | Cluster Plot | Dendrogram | e-value | e-value | e-value | Condition | Condition FDR | Condition Difference |
|---|---|---|---|---|---|---|---|---|
| Thaps_hclust_0323 |
 |
 |
0.0011 |
0.014 |
36 |
lowN_TMEVA | 0.861000 | -0.0621 |
| Title | Cluster Plot | Dendrogram | e-value | e-value | e-value | Condition | Condition FDR | Condition Difference |
|---|---|---|---|---|---|---|---|---|
| Thaps_hclust_0305 |
 |
 |
0.66 |
3.2 |
6.5 |
lowN_TMEVA | 0.861000 | -0.058 |
| Title | Cluster Plot | Dendrogram | e-value | e-value | e-value | Condition | Condition FDR | Condition Difference |
|---|---|---|---|---|---|---|---|---|
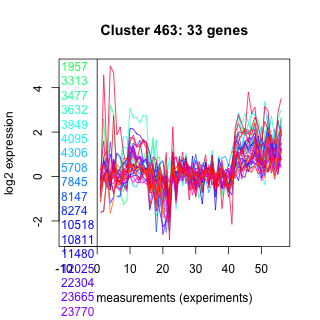
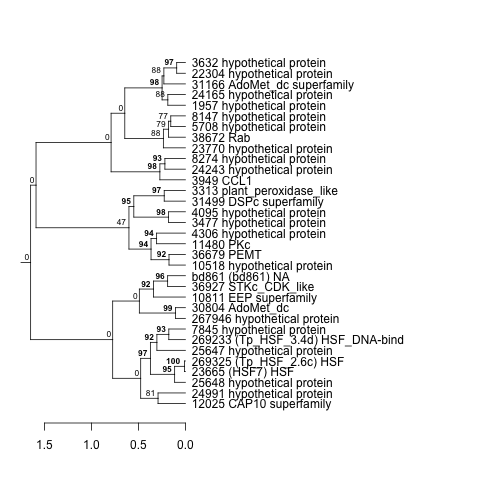
| Thaps_hclust_0463 |
 |
 |
0.0000000063 |
0.000000075 |
0.78 |
lowN_TMEVA | 0.861000 | 0.0576 |
| Title | Cluster Plot | Dendrogram | e-value | e-value | e-value | Condition | Condition FDR | Condition Difference |
|---|---|---|---|---|---|---|---|---|
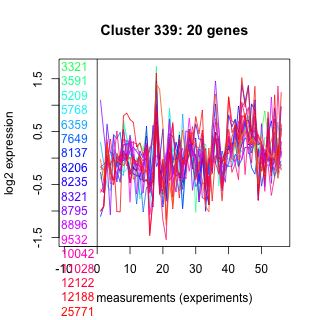
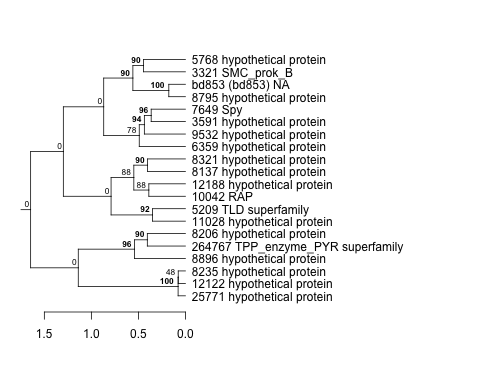
| Thaps_hclust_0339 |
 |
 |
0.000016 |
0.00038 |
0.0017 |
lowN_TMEVA | 0.861000 | 0.0668 |
| Title | Cluster Plot | Dendrogram | e-value | e-value | e-value | Condition | Condition FDR | Condition Difference |
|---|---|---|---|---|---|---|---|---|
| Thaps_hclust_0479 |
 |
 |
0.11 |
0.2 |
1.5 |
lowN_TMEVA | 0.861000 | 0.0641 |
| Title | Cluster Plot | Dendrogram | e-value | e-value | e-value | Condition | Condition FDR | Condition Difference |
|---|---|---|---|---|---|---|---|---|
| Thaps_hclust_0303 |
 |
 |
0.00096 |
0.0021 |
0.0014 |
lowN_TMEVA | 0.861000 | -0.0653 |
| Title | Cluster Plot | Dendrogram | e-value | e-value | e-value | Condition | Condition FDR | Condition Difference |
|---|---|---|---|---|---|---|---|---|
| Thaps_hclust_0034 |
 |
 |
0.000015 |
0.000083 |
0.63 |
lowN_TMEVA | 0.861000 | -0.0642 |
| Title | Cluster Plot | Dendrogram | e-value | e-value | e-value | Condition | Condition FDR | Condition Difference |
|---|---|---|---|---|---|---|---|---|
| Thaps_hclust_0213 |
 |
 |
0.0000045 |
0.075 |
0.54 |
lowN_TMEVA | 0.861000 | -0.0585 |
| Title | Cluster Plot | Dendrogram | e-value | e-value | e-value | Condition | Condition FDR | Condition Difference |
|---|---|---|---|---|---|---|---|---|
| Thaps_hclust_0074 |
 |
 |
77 |
130 |
300 |
lowSi_TMEVA | 0.861000 | -0.2 |
| Title | Cluster Plot | Dendrogram | e-value | e-value | e-value | Condition | Condition FDR | Condition Difference |
|---|---|---|---|---|---|---|---|---|
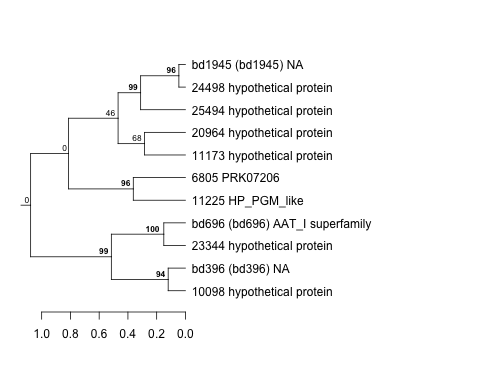
| Thaps_hclust_0353 |
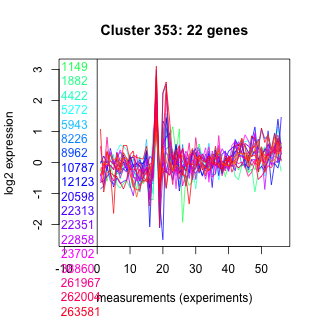 |
 |
0.076 |
1.5 |
0.87 |
lowN_TMEVA | 0.861000 | -0.0641 |
| Thaps_hclust_0353 |
|
|
0.076 |
1.5 |
0.87 |
highlight_arrays | 0.860000 | -0.0306 |
| Title | Cluster Plot | Dendrogram | e-value | e-value | e-value | Condition | Condition FDR | Condition Difference |
|---|---|---|---|---|---|---|---|---|
| Thaps_hclust_0153 |
 |
 |
0.0000021 |
0.0049 |
0.015 |
exponential_vs_stationary_24light | 0.860000 | 0.0725 |
| Title | Cluster Plot | Dendrogram | e-value | e-value | e-value | Condition | Condition FDR | Condition Difference |
|---|---|---|---|---|---|---|---|---|
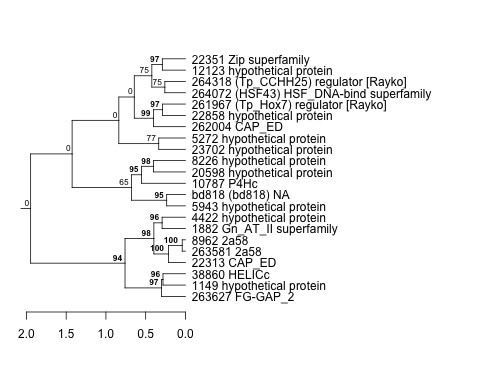
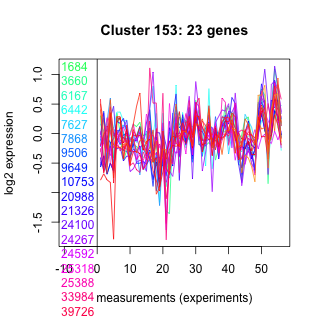
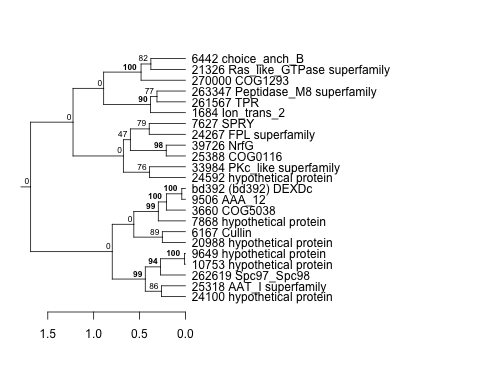
| Thaps_hclust_0293 |
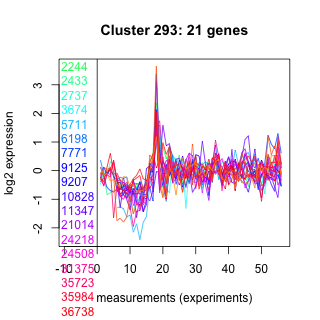 |
 |
0.16 |
120 |
360 |
diel_exponential_vs_stationary | 0.860000 | 0.0414 |
| Thaps_hclust_0293 |
|
|
0.16 |
120 |
360 |
highlight_arrays | 0.860000 | 0.0307 |
| Title | Cluster Plot | Dendrogram | e-value | e-value | e-value | Condition | Condition FDR | Condition Difference |
|---|---|---|---|---|---|---|---|---|
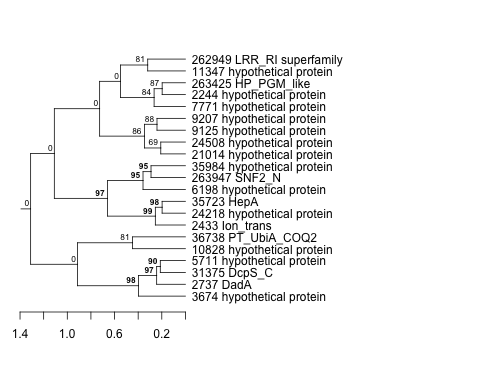
| Thaps_hclust_0362 |
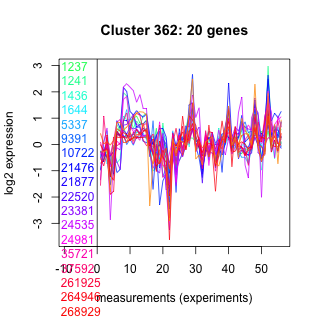 |
 |
0.00003 |
0.0033 |
0.66 |
lowN_TMEVA | 0.860000 | -0.0709 |
| Title | Cluster Plot | Dendrogram | e-value | e-value | e-value | Condition | Condition FDR | Condition Difference |
|---|---|---|---|---|---|---|---|---|
| Thaps_hclust_0077 |
 |
 |
0.00014 |
0.91 |
2.2 |
lowN_TMEVA | 0.860000 | 0.0696 |
| Title | Cluster Plot | Dendrogram | e-value | e-value | e-value | Condition | Condition FDR | Condition Difference |
|---|---|---|---|---|---|---|---|---|
| Thaps_hclust_0178 |
 |
 |
0.0000000019 |
0.00000047 |
0.000019 |
lowFe_TMEVA | 0.860000 | -0.0694 |
| Title | Cluster Plot | Dendrogram | e-value | e-value | e-value | Condition | Condition FDR | Condition Difference |
|---|---|---|---|---|---|---|---|---|
| Thaps_hclust_0145 |
 |
 |
0.015 |
1.6 |
11 |
diel_exponential_vs_stationary | 0.860000 | -0.0623 |
| Title | Cluster Plot | Dendrogram | e-value | e-value | e-value | Condition | Condition FDR | Condition Difference |
|---|---|---|---|---|---|---|---|---|
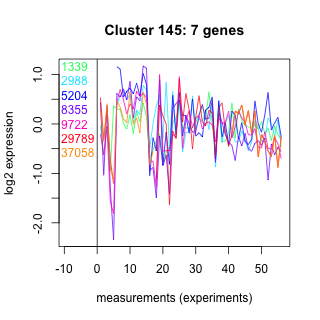
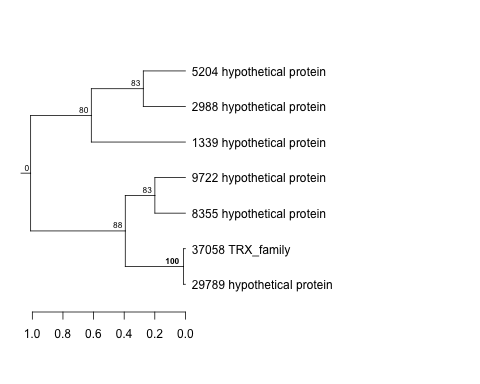
| Thaps_hclust_0375 |
 |
 |
1.8 |
2.9 |
40 |
highlight_arrays | 0.860000 | 0.037 |
| Title | Cluster Plot | Dendrogram | e-value | e-value | e-value | Condition | Condition FDR | Condition Difference |
|---|---|---|---|---|---|---|---|---|
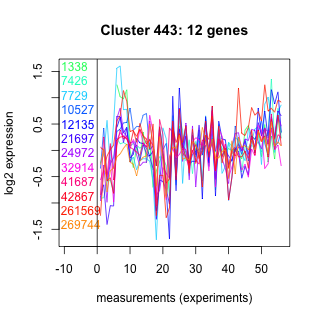
| Thaps_hclust_0443 |
 |
 |
0.96 |
9.8 |
42 |
diel_exponential_vs_stationary | 0.860000 | 0.0509 |
| Title | Cluster Plot | Dendrogram | e-value | e-value | e-value | Condition | Condition FDR | Condition Difference |
|---|---|---|---|---|---|---|---|---|
| Thaps_hclust_0411 |
 |
 |
0.00079 |
0.0092 |
0.029 |
lowFe_KTKB_Day3 | 0.859000 | 0.0409 |
| Title | Cluster Plot | Dendrogram | e-value | e-value | e-value | Condition | Condition FDR | Condition Difference |
|---|---|---|---|---|---|---|---|---|
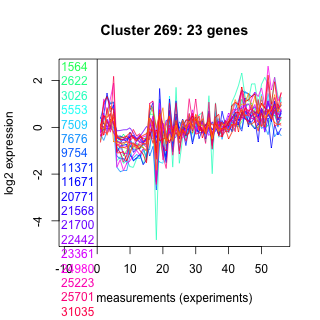
| Thaps_hclust_0269 |
 |
 |
0.0025 |
0.032 |
0.077 |
lowFe_KTKB_Day3 | 0.859000 | 0.0502 |