Hierarchical Clusters
Displaying 501 - 600 of 7500
| Title | Cluster Plot | Dendrogram | e-value | e-value | e-value | Condition | Condition FDR | Condition Difference |
|---|---|---|---|---|---|---|---|---|
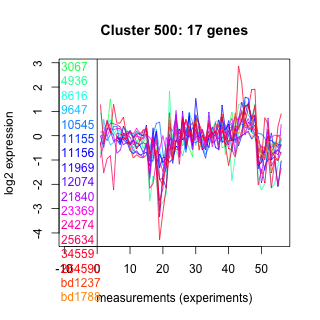
| Thaps_hclust_0500 |
 |
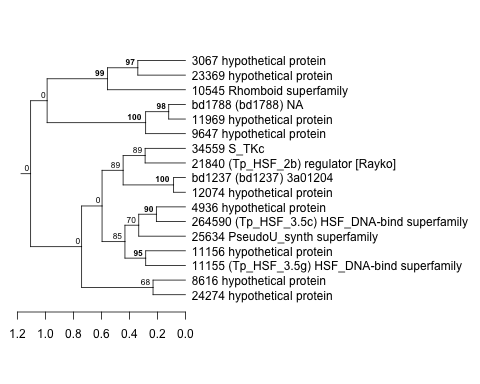 |
0.91 |
14 |
30 |
lowtemp_TMEVA | 0.966000 | -0.0151 |
| Title | Cluster Plot | Dendrogram | e-value | e-value | e-value | Condition | Condition FDR | Condition Difference |
|---|---|---|---|---|---|---|---|---|
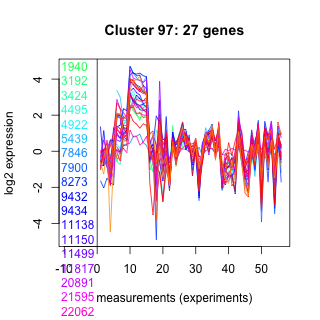
| Thaps_hclust_0097 |
 |
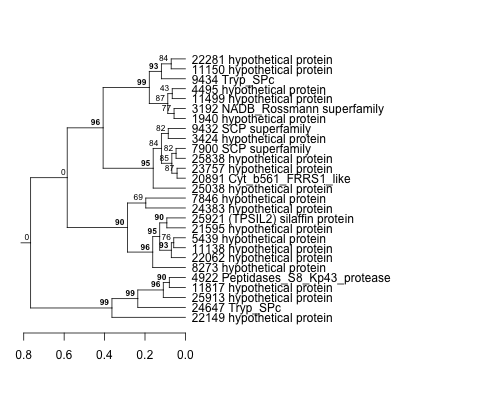 |
0.02 |
1.4 |
3.4 |
lowtemp_TMEVA | 0.966000 | 0.0114 |
| Title | Cluster Plot | Dendrogram | e-value | e-value | e-value | Condition | Condition FDR | Condition Difference |
|---|---|---|---|---|---|---|---|---|
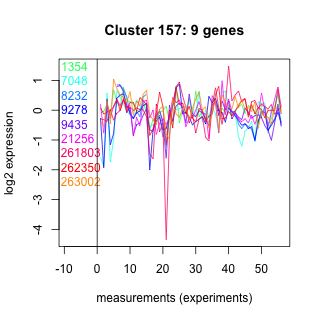
| Thaps_hclust_0157 |
 |
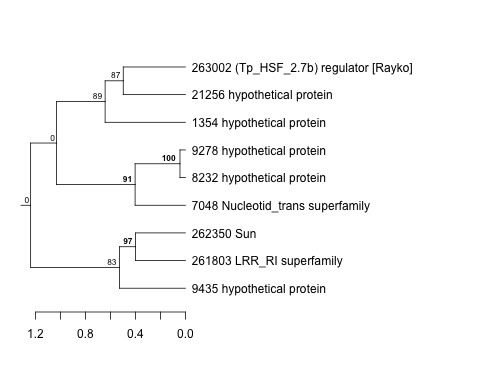 |
2 |
4.6 |
4.9 |
lowtemp_TMEVA | 0.966000 | -0.0202 |
| Thaps_hclust_0157 |
|
|
2 |
4.6 |
4.9 |
diel_exponential_vs_stationary | 0.965000 | 0.017 |
| Title | Cluster Plot | Dendrogram | e-value | e-value | e-value | Condition | Condition FDR | Condition Difference |
|---|---|---|---|---|---|---|---|---|
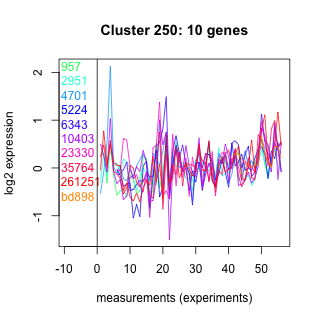
| Thaps_hclust_0250 |
 |
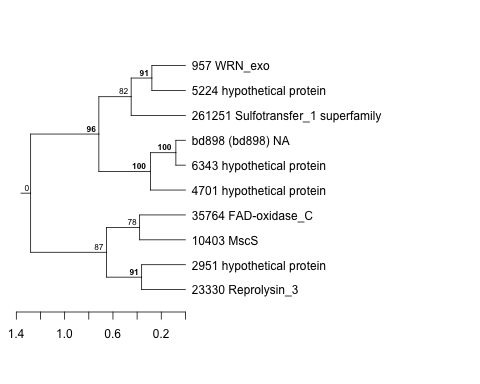 |
0.38 |
88 |
290 |
lowtemp_TMEVA | 0.966000 | -0.0186 |
| Thaps_hclust_0250 |
|
|
0.38 |
88 |
290 |
highpH_TMEVA | 0.964000 | 0.0202 |
| Title | Cluster Plot | Dendrogram | e-value | e-value | e-value | Condition | Condition FDR | Condition Difference |
|---|---|---|---|---|---|---|---|---|
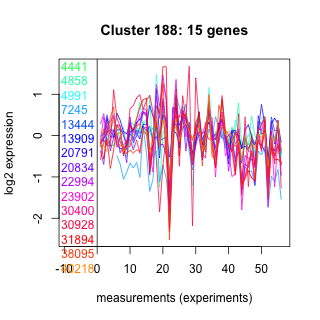
| Thaps_hclust_0188 |
 |
 |
0.0058 |
0.31 |
0.34 |
diel_light_vs_dark | 0.966000 | 0.0177 |
| Title | Cluster Plot | Dendrogram | e-value | e-value | e-value | Condition | Condition FDR | Condition Difference |
|---|---|---|---|---|---|---|---|---|
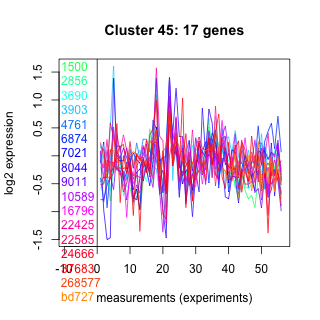
| Thaps_hclust_0045 |
 |
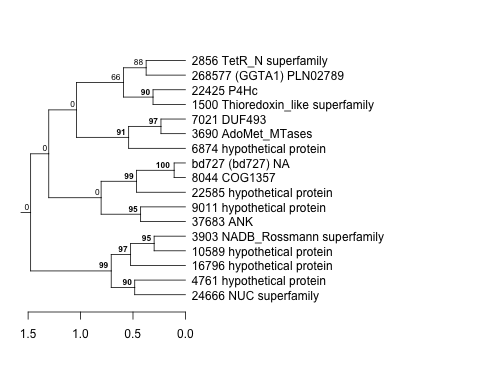 |
0.0000000028 |
0.0075 |
5.4 |
highlight_arrays | 0.965000 | -0.00988 |
| Title | Cluster Plot | Dendrogram | e-value | e-value | e-value | Condition | Condition FDR | Condition Difference |
|---|---|---|---|---|---|---|---|---|
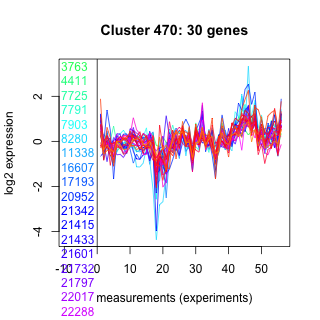
| Thaps_hclust_0470 |
 |
 |
0.0000048 |
0.00021 |
0.086 |
diel_exponential_vs_stationary | 0.965000 | 0.00956 |
| Thaps_hclust_0470 |
|
|
0.0000048 |
0.00021 |
0.086 |
lowN_TMEVA | 0.959000 | 0.0235 |
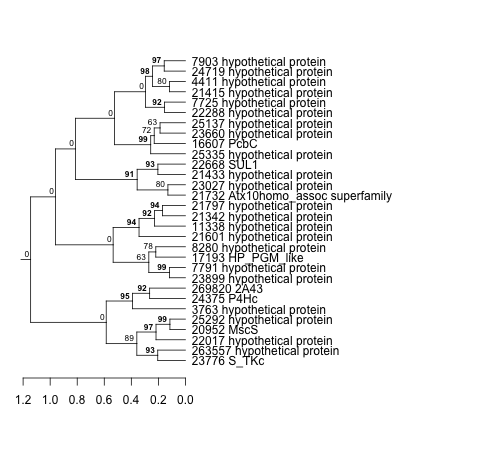
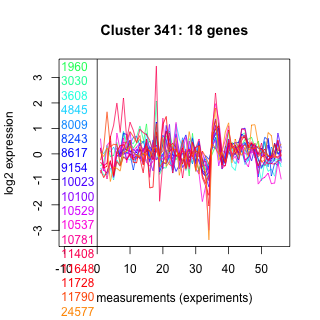
| Title | Cluster Plot | Dendrogram | e-value | e-value | e-value | Condition | Condition FDR | Condition Difference |
|---|---|---|---|---|---|---|---|---|
| Thaps_hclust_0341 |
 |
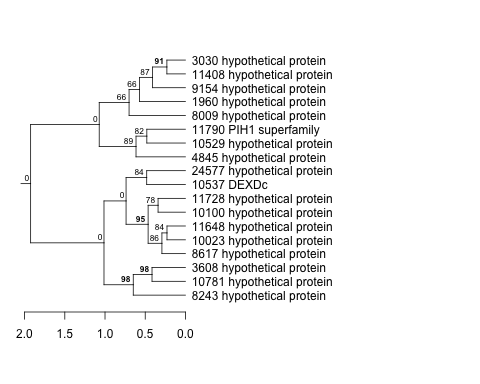 |
74 |
110 |
130 |
exponential_vs_stationary_24light | 0.965000 | 0.0186 |
| Thaps_hclust_0341 |
|
|
74 |
110 |
130 |
diel_light_vs_dark | 0.959000 | 0.0215 |
| Thaps_hclust_0341 |
|
|
74 |
110 |
130 |
exponential_vs_stationary_24highlight | 0.954000 | -0.0106 |
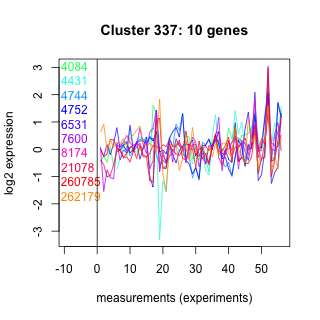
| Title | Cluster Plot | Dendrogram | e-value | e-value | e-value | Condition | Condition FDR | Condition Difference |
|---|---|---|---|---|---|---|---|---|
| Thaps_hclust_0337 |
 |
 |
3.5 |
3 |
280 |
highpH_TMEVA | 0.965000 | -0.0173 |
| Title | Cluster Plot | Dendrogram | e-value | e-value | e-value | Condition | Condition FDR | Condition Difference |
|---|---|---|---|---|---|---|---|---|
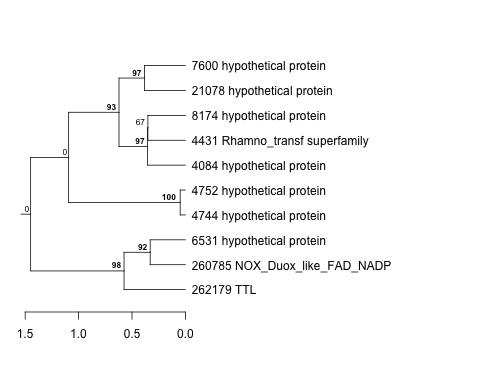
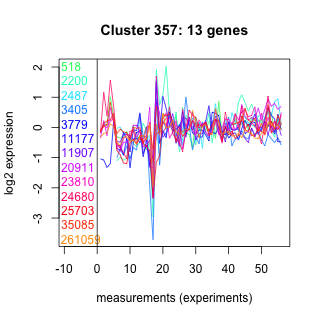
| Thaps_hclust_0357 |
 |
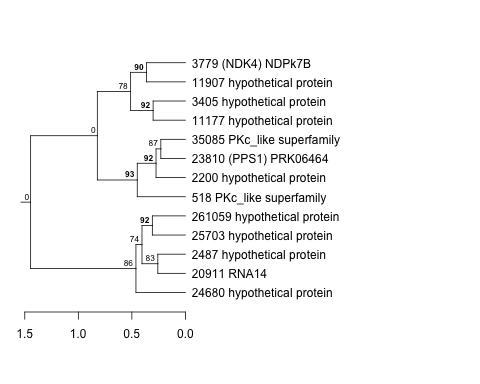 |
0.077 |
0.1 |
0.81 |
exponential_vs_stationary_24light | 0.965000 | -0.0202 |
| Thaps_hclust_0357 |
|
|
0.077 |
0.1 |
0.81 |
co2_elevated_expo_arrays | 0.959000 | 0.0315 |
| Title | Cluster Plot | Dendrogram | e-value | e-value | e-value | Condition | Condition FDR | Condition Difference |
|---|---|---|---|---|---|---|---|---|
| Thaps_hclust_0338 |
 |
 |
0.0000012 |
0.0000014 |
0.000012 |
diel_exponential_vs_stationary | 0.965000 | 0.00953 |
| Title | Cluster Plot | Dendrogram | e-value | e-value | e-value | Condition | Condition FDR | Condition Difference |
|---|---|---|---|---|---|---|---|---|
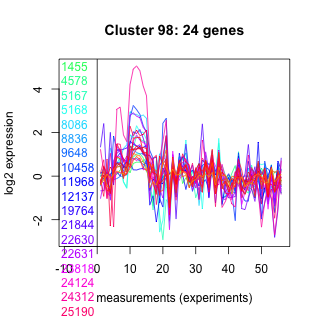
| Thaps_hclust_0098 |
 |
 |
0.0000000015 |
0.17 |
19 |
lowSi_TMEVA | 0.965000 | -0.154 |
| Thaps_hclust_0098 |
|
|
0.0000000015 |
0.17 |
19 |
lowFe_KTKB_Day3 | 0.954000 | 0.0159 |
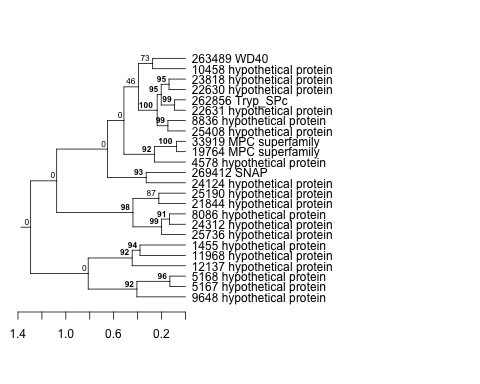
| Title | Cluster Plot | Dendrogram | e-value | e-value | e-value | Condition | Condition FDR | Condition Difference |
|---|---|---|---|---|---|---|---|---|
| Thaps_hclust_0490 |
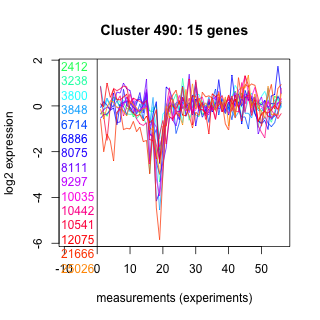 |
 |
0.6 |
9.5 |
74 |
highpH_TMEVA | 0.965000 | -0.0142 |
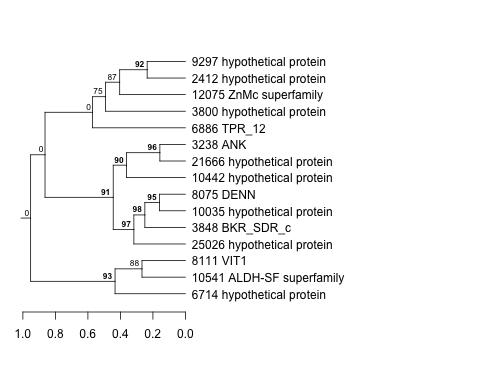
| Title | Cluster Plot | Dendrogram | e-value | e-value | e-value | Condition | Condition FDR | Condition Difference |
|---|---|---|---|---|---|---|---|---|
| Thaps_hclust_0118 |
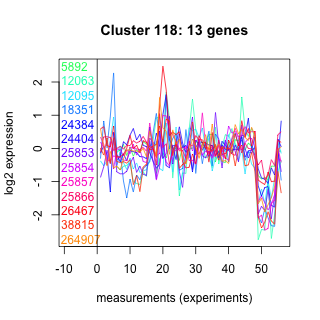 |
 |
0.0037 |
1.2 |
1.4 |
diel_exponential_vs_stationary | 0.965000 | -0.0154 |
| Title | Cluster Plot | Dendrogram | e-value | e-value | e-value | Condition | Condition FDR | Condition Difference |
|---|---|---|---|---|---|---|---|---|
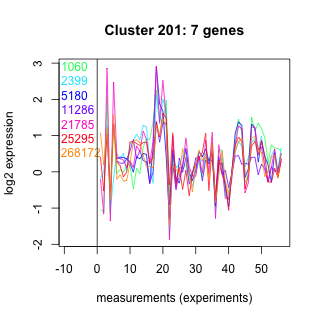
| Thaps_hclust_0201 |
 |
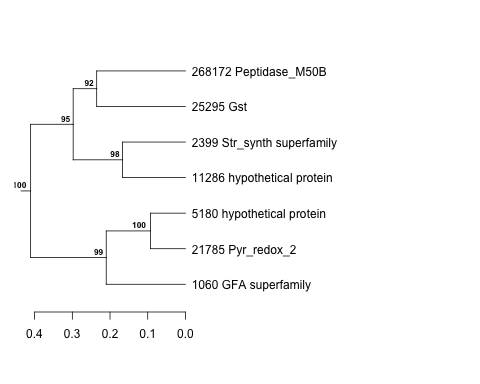 |
0.11 |
7.6 |
12 |
highpH_TMEVA | 0.965000 | 0.019 |
| Title | Cluster Plot | Dendrogram | e-value | e-value | e-value | Condition | Condition FDR | Condition Difference |
|---|---|---|---|---|---|---|---|---|
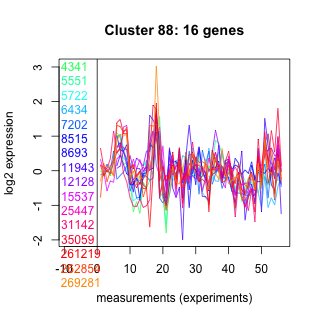
| Thaps_hclust_0088 |
 |
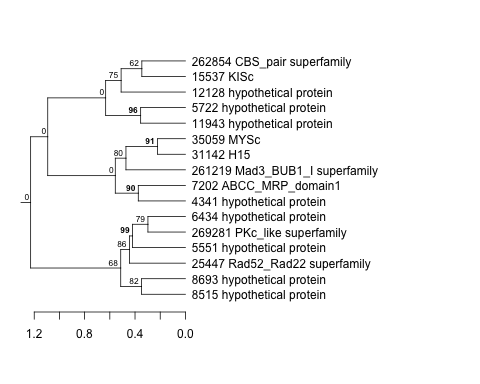 |
0.036 |
27 |
18 |
highpH_TMEVA | 0.964000 | 0.0162 |
| Title | Cluster Plot | Dendrogram | e-value | e-value | e-value | Condition | Condition FDR | Condition Difference |
|---|---|---|---|---|---|---|---|---|
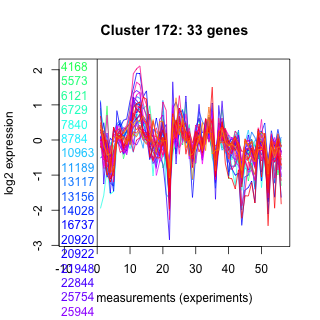
| Thaps_hclust_0172 |
 |
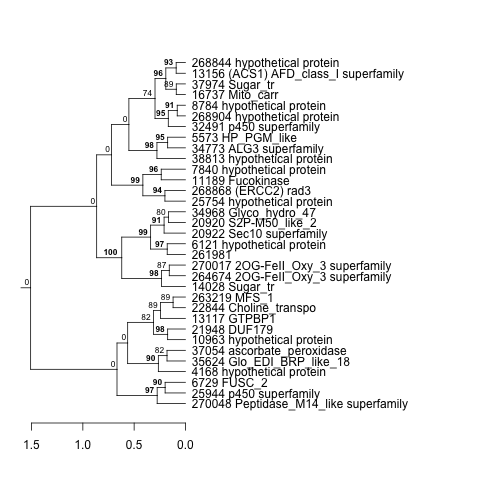 |
0.000001 |
0.000011 |
0.014 |
co2_elevated_expo_arrays | 0.964000 | -0.0294 |
| Title | Cluster Plot | Dendrogram | e-value | e-value | e-value | Condition | Condition FDR | Condition Difference |
|---|---|---|---|---|---|---|---|---|
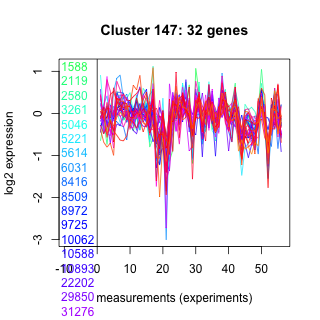
| Thaps_hclust_0147 |
 |
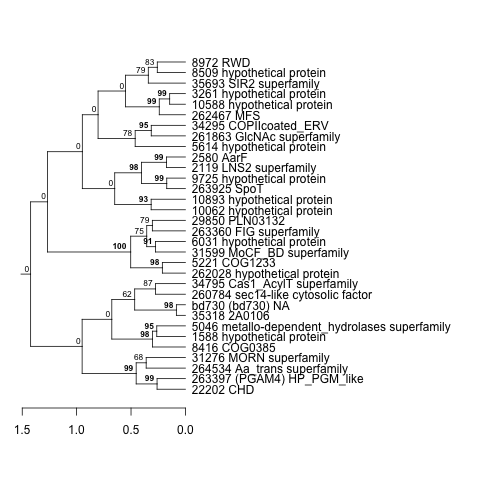 |
0.0000023 |
0.000053 |
1.9 |
highpH_TMEVA | 0.964000 | 0.0118 |
| Title | Cluster Plot | Dendrogram | e-value | e-value | e-value | Condition | Condition FDR | Condition Difference |
|---|---|---|---|---|---|---|---|---|
| Thaps_hclust_0361 |
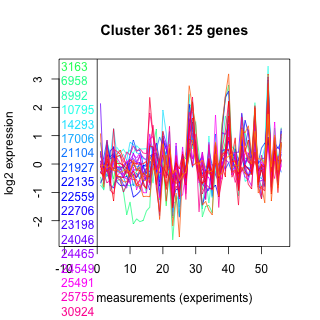 |
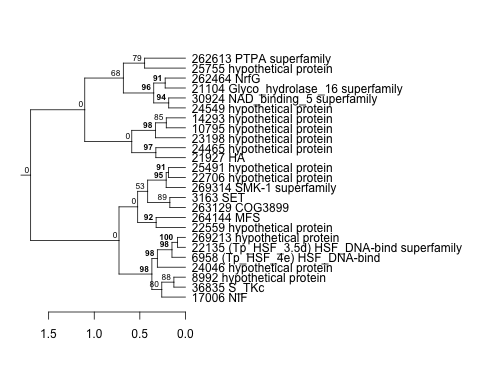 |
0.00000000081 |
0.14 |
2.1 |
lowtemp_TMEVA | 0.964000 | -0.0146 |
| Title | Cluster Plot | Dendrogram | e-value | e-value | e-value | Condition | Condition FDR | Condition Difference |
|---|---|---|---|---|---|---|---|---|
| Thaps_hclust_0301 |
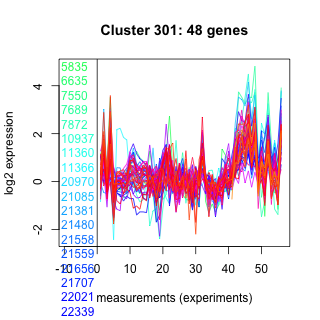 |
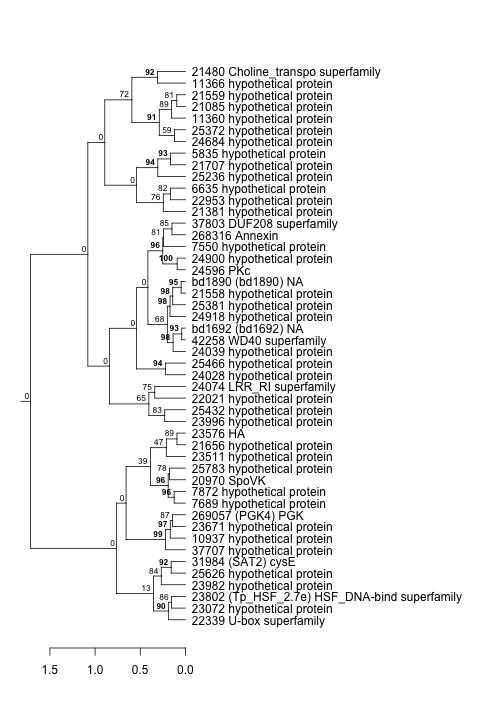 |
0.000000022 |
0.82 |
2.1 |
lowFe_KTKB_Day5 | 0.964000 | 0.00713 |
| Title | Cluster Plot | Dendrogram | e-value | e-value | e-value | Condition | Condition FDR | Condition Difference |
|---|---|---|---|---|---|---|---|---|
| Thaps_hclust_0207 |
 |
 |
0.0000000025 |
0.0000000037 |
0.1 |
lowFe_KTKB_Day5 | 0.964000 | 0.0107 |
| Title | Cluster Plot | Dendrogram | e-value | e-value | e-value | Condition | Condition FDR | Condition Difference |
|---|---|---|---|---|---|---|---|---|
| Thaps_hclust_0230 |
 |
|
|
1.1e-30 |
0.0000000000029 |
lowFe_KTKB_Day5 | 0.964000 | 0.00449 |
| Title | Cluster Plot | Dendrogram | e-value | e-value | e-value | Condition | Condition FDR | Condition Difference |
|---|---|---|---|---|---|---|---|---|
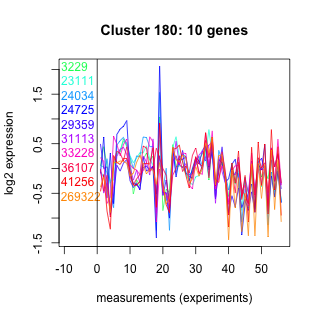
| Thaps_hclust_0180 |
 |
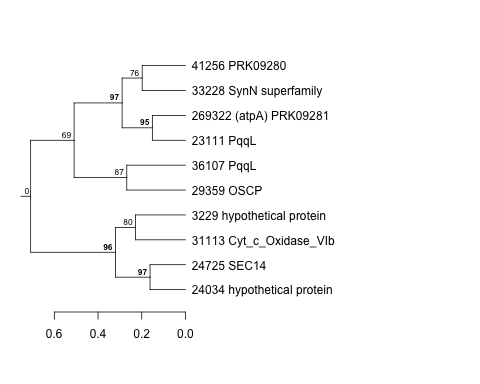 |
1.5 |
1.7 |
12 |
highpH_TMEVA | 0.964000 | -0.0192 |
| Title | Cluster Plot | Dendrogram | e-value | e-value | e-value | Condition | Condition FDR | Condition Difference |
|---|---|---|---|---|---|---|---|---|
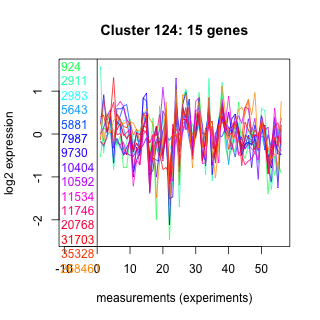
| Thaps_hclust_0124 |
 |
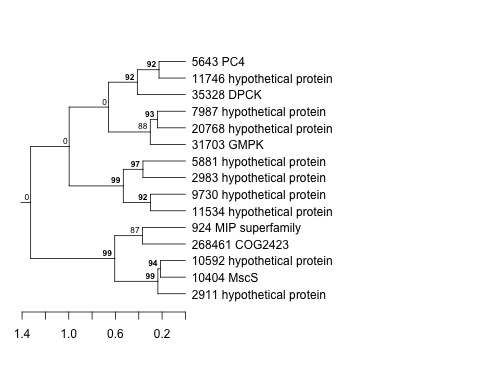 |
1 |
0.23 |
42 |
lowtemp_TMEVA | 0.964000 | -0.0169 |
| Title | Cluster Plot | Dendrogram | e-value | e-value | e-value | Condition | Condition FDR | Condition Difference |
|---|---|---|---|---|---|---|---|---|
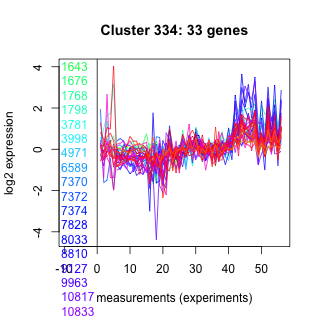
| Thaps_hclust_0334 |
 |
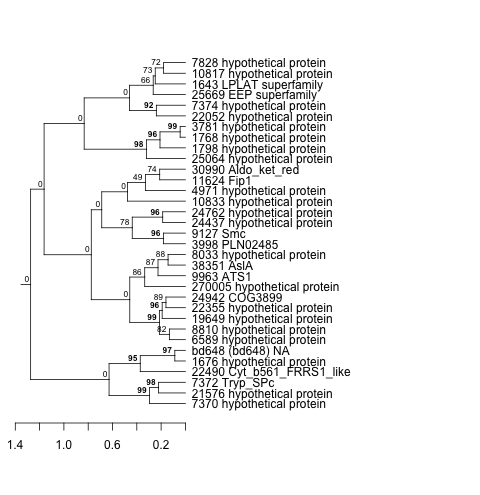 |
0.51 |
0.00047 |
0.25 |
lowtemp_TMEVA | 0.964000 | 0.012 |
| Title | Cluster Plot | Dendrogram | e-value | e-value | e-value | Condition | Condition FDR | Condition Difference |
|---|---|---|---|---|---|---|---|---|
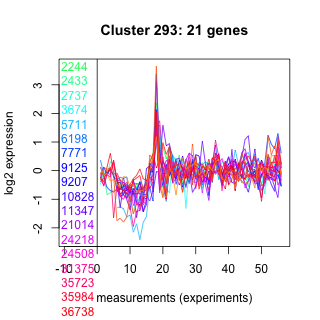
| Thaps_hclust_0293 |
 |
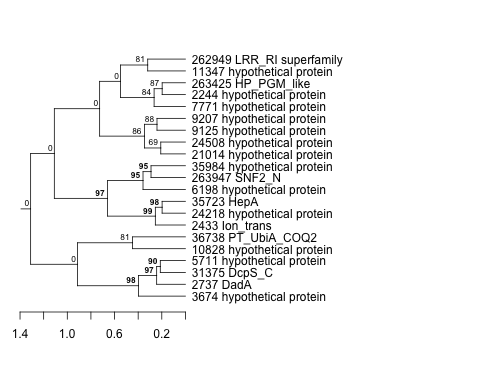 |
0.16 |
120 |
360 |
lowFe_KTKB_Day5 | 0.964000 | 0.0113 |
| Thaps_hclust_0293 |
|
|
0.16 |
120 |
360 |
diel_light_vs_dark | 0.955000 | -0.022 |
| Title | Cluster Plot | Dendrogram | e-value | e-value | e-value | Condition | Condition FDR | Condition Difference |
|---|---|---|---|---|---|---|---|---|
| Thaps_hclust_0422 |
 |
 |
1.9 |
15 |
0.0027 |
highpH_TMEVA | 0.964000 | 0.015 |
| Title | Cluster Plot | Dendrogram | e-value | e-value | e-value | Condition | Condition FDR | Condition Difference |
|---|---|---|---|---|---|---|---|---|
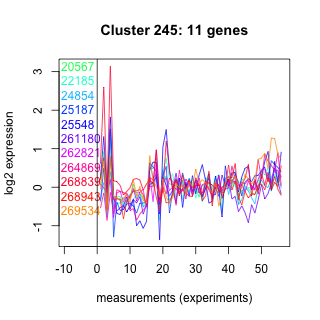
| Thaps_hclust_0245 |
 |
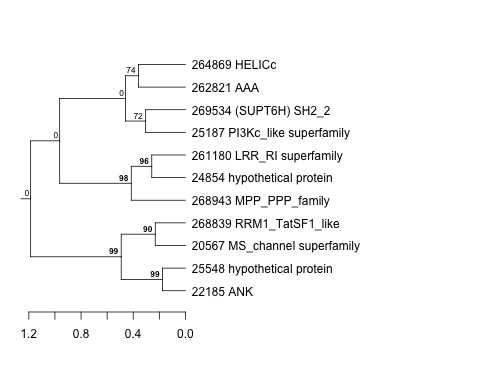 |
0.52 |
100 |
150 |
highpH_TMEVA | 0.964000 | 0.0179 |
| Thaps_hclust_0245 |
|
|
0.52 |
100 |
150 |
diel_light_vs_dark | 0.959000 | -0.0239 |
| Title | Cluster Plot | Dendrogram | e-value | e-value | e-value | Condition | Condition FDR | Condition Difference |
|---|---|---|---|---|---|---|---|---|
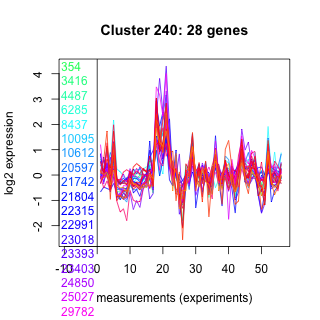
| Thaps_hclust_0240 |
 |
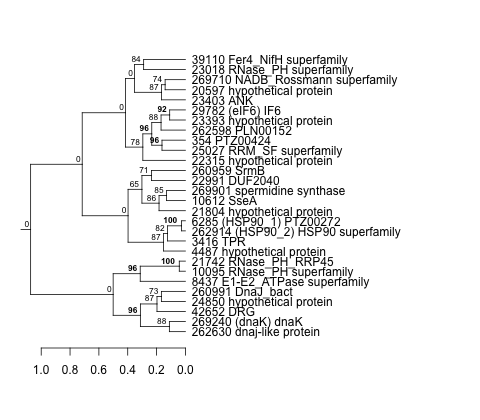 |
0.000000064 |
0.000021 |
0.00078 |
lowFe_KTKB_Day5 | 0.964000 | -0.0107 |
| Title | Cluster Plot | Dendrogram | e-value | e-value | e-value | Condition | Condition FDR | Condition Difference |
|---|---|---|---|---|---|---|---|---|
| Thaps_hclust_0114 |
 |
 |
0.086 |
4.8 |
3.2 |
highpH_TMEVA | 0.964000 | -0.0143 |
| Title | Cluster Plot | Dendrogram | e-value | e-value | e-value | Condition | Condition FDR | Condition Difference |
|---|---|---|---|---|---|---|---|---|
| Thaps_hclust_0179 |
 |
 |
0.0000039 |
0.056 |
2.8 |
diel_exponential_vs_stationary | 0.964000 | 0.0127 |
| Title | Cluster Plot | Dendrogram | e-value | e-value | e-value | Condition | Condition FDR | Condition Difference |
|---|---|---|---|---|---|---|---|---|
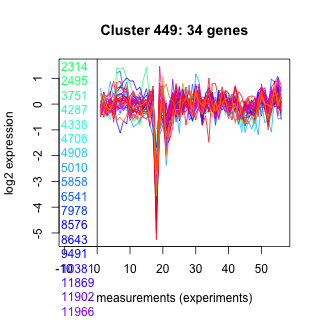
| Thaps_hclust_0449 |
 |
 |
0.0000000011 |
0.012 |
3.5 |
lowFe_KTKB_Day5 | 0.964000 | -0.00946 |
| Title | Cluster Plot | Dendrogram | e-value | e-value | e-value | Condition | Condition FDR | Condition Difference |
|---|---|---|---|---|---|---|---|---|
| Thaps_hclust_0133 |
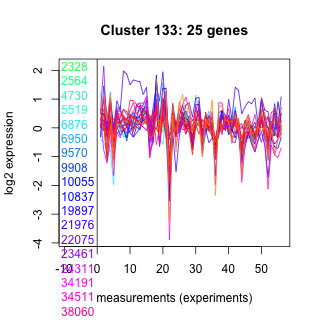 |
 |
0.95 |
2.2 |
2.4 |
lowFe_KTKB_Day5 | 0.964000 | -0.011 |
| Title | Cluster Plot | Dendrogram | e-value | e-value | e-value | Condition | Condition FDR | Condition Difference |
|---|---|---|---|---|---|---|---|---|
| Thaps_hclust_0473 |
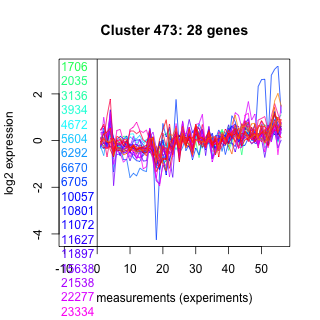 |
 |
0.00036 |
0.0036 |
0.68 |
lowN_TMEVA | 0.963000 | -0.0177 |
| Title | Cluster Plot | Dendrogram | e-value | e-value | e-value | Condition | Condition FDR | Condition Difference |
|---|---|---|---|---|---|---|---|---|
| Thaps_hclust_0149 |
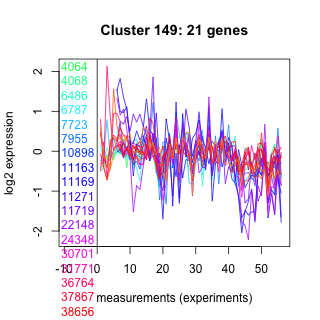 |
 |
0.00000027 |
0.46 |
3 |
lowN_TMEVA | 0.963000 | -0.0171 |
| Title | Cluster Plot | Dendrogram | e-value | e-value | e-value | Condition | Condition FDR | Condition Difference |
|---|---|---|---|---|---|---|---|---|
| Thaps_hclust_0453 |
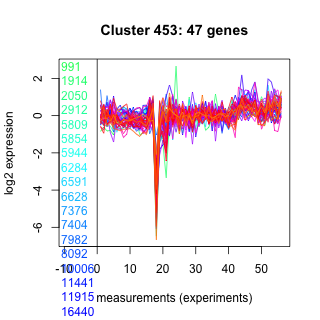 |
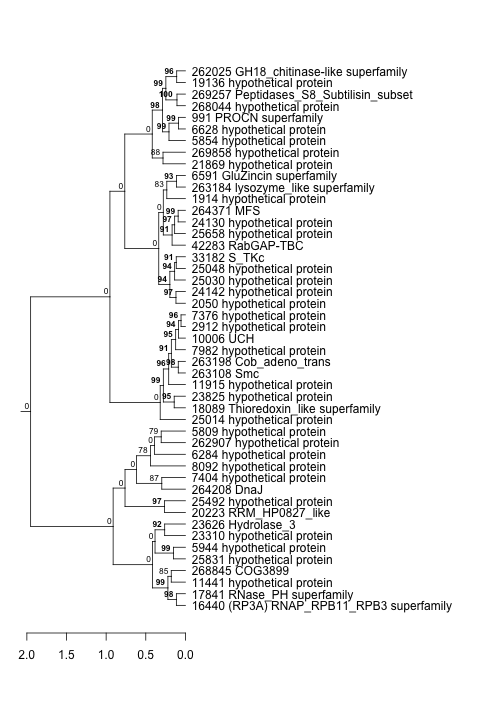 |
0.000000000093 |
0.000000041 |
0.00016 |
lowN_TMEVA | 0.963000 | -0.0182 |
| Title | Cluster Plot | Dendrogram | e-value | e-value | e-value | Condition | Condition FDR | Condition Difference |
|---|---|---|---|---|---|---|---|---|
| Thaps_hclust_0471 |
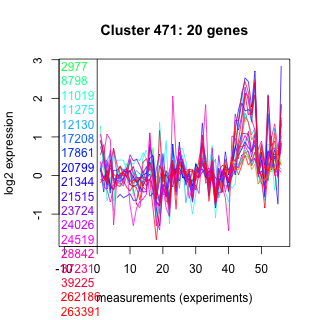 |
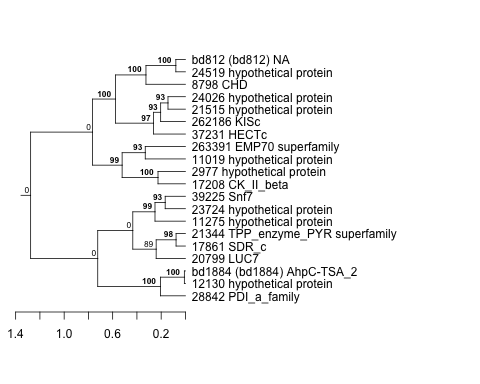 |
0.0086 |
0.14 |
2.6 |
lowN_TMEVA | 0.963000 | -0.0191 |
| Title | Cluster Plot | Dendrogram | e-value | e-value | e-value | Condition | Condition FDR | Condition Difference |
|---|---|---|---|---|---|---|---|---|
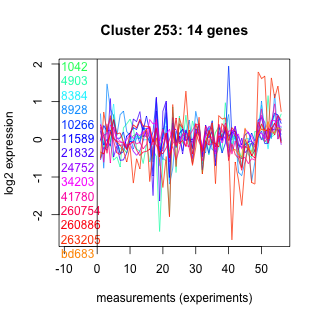
| Thaps_hclust_0253 |
 |
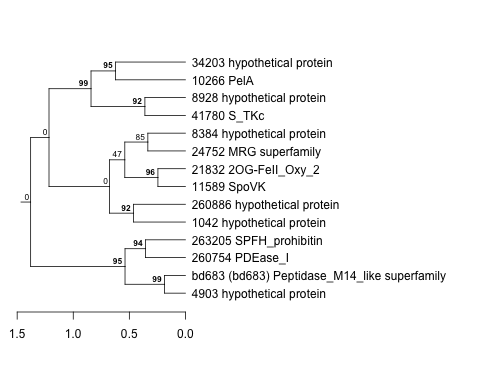 |
1.5 |
61 |
370 |
exponential_vs_stationary_24light | 0.963000 | -0.022 |
| Title | Cluster Plot | Dendrogram | e-value | e-value | e-value | Condition | Condition FDR | Condition Difference |
|---|---|---|---|---|---|---|---|---|
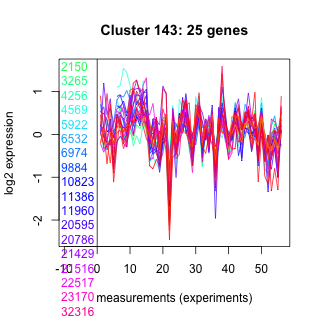
| Thaps_hclust_0143 |
 |
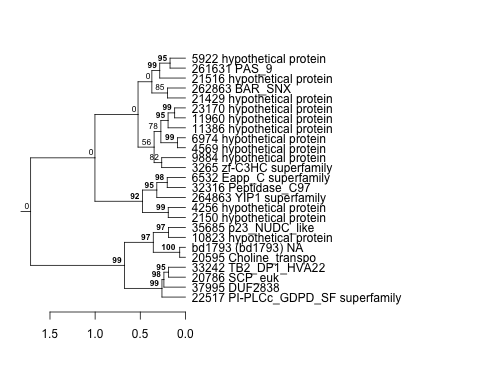 |
0.018 |
0.041 |
0.67 |
lowN_TMEVA | 0.963000 | 0.0183 |
| Title | Cluster Plot | Dendrogram | e-value | e-value | e-value | Condition | Condition FDR | Condition Difference |
|---|---|---|---|---|---|---|---|---|
| Thaps_hclust_0479 |
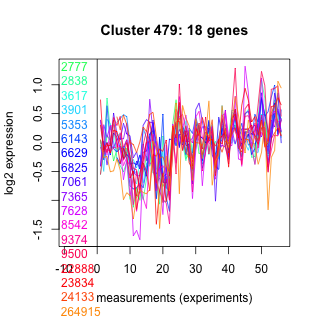 |
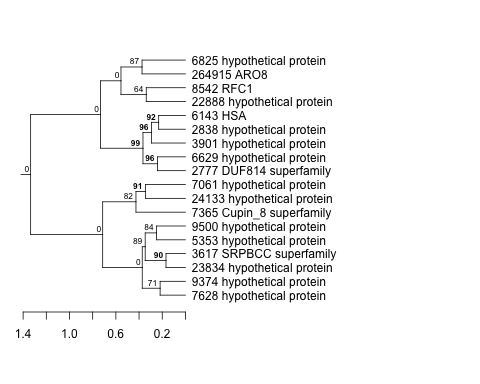 |
0.11 |
0.2 |
1.5 |
exponential_vs_stationary_24light | 0.963000 | -0.0208 |
| Title | Cluster Plot | Dendrogram | e-value | e-value | e-value | Condition | Condition FDR | Condition Difference |
|---|---|---|---|---|---|---|---|---|
| Thaps_hclust_0249 |
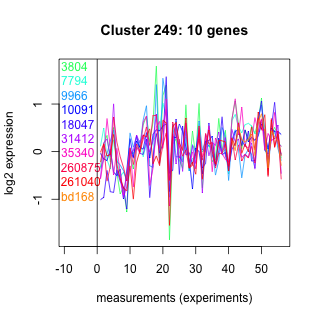 |
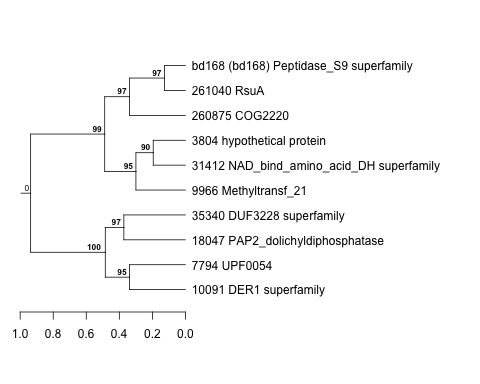 |
14 |
39 |
180 |
lowN_TMEVA | 0.963000 | -0.0225 |
| Thaps_hclust_0249 |
|
|
14 |
39 |
180 |
lowFe_TMEVA | 0.960000 | -0.0288 |
| Title | Cluster Plot | Dendrogram | e-value | e-value | e-value | Condition | Condition FDR | Condition Difference |
|---|---|---|---|---|---|---|---|---|
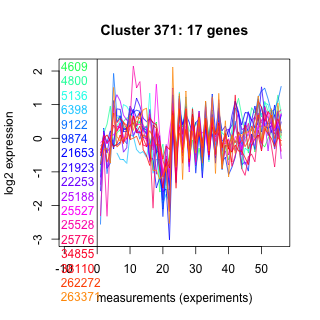
| Thaps_hclust_0371 |
 |
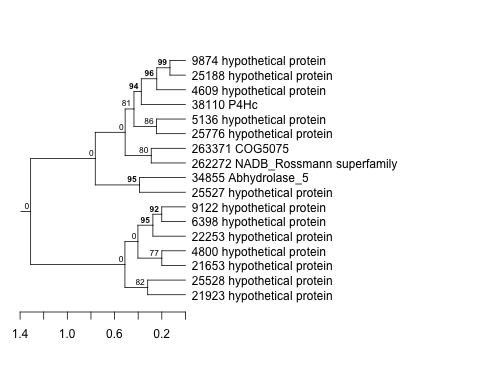 |
0.0051 |
0.11 |
1.1 |
lowFe_KTKB_Day3 | 0.962000 | 0.0176 |
| Title | Cluster Plot | Dendrogram | e-value | e-value | e-value | Condition | Condition FDR | Condition Difference |
|---|---|---|---|---|---|---|---|---|
| Thaps_hclust_0079 |
 |
 |
0.00048 |
0.000048 |
0.27 |
diel_exponential_vs_stationary | 0.962000 | 0.0133 |
| Title | Cluster Plot | Dendrogram | e-value | e-value | e-value | Condition | Condition FDR | Condition Difference |
|---|---|---|---|---|---|---|---|---|
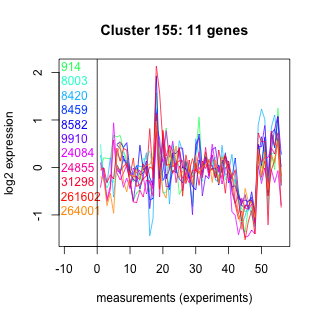
| Thaps_hclust_0155 |
 |
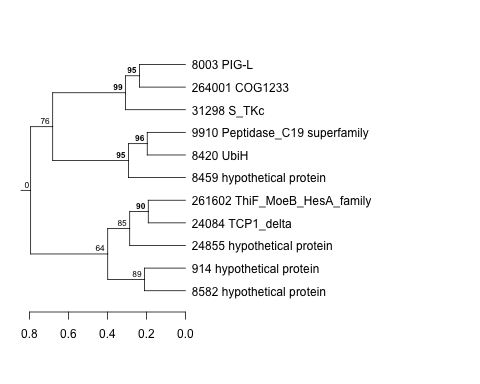 |
0.32 |
5.4 |
2 |
highpH_TMEVA | 0.962000 | 0.0211 |
| Title | Cluster Plot | Dendrogram | e-value | e-value | e-value | Condition | Condition FDR | Condition Difference |
|---|---|---|---|---|---|---|---|---|
| Thaps_hclust_0085 |
 |
 |
0.000012 |
0.0024 |
0.37 |
co2_elevated_stat_arrays | 0.962000 | 0.0105 |
| Title | Cluster Plot | Dendrogram | e-value | e-value | e-value | Condition | Condition FDR | Condition Difference |
|---|---|---|---|---|---|---|---|---|
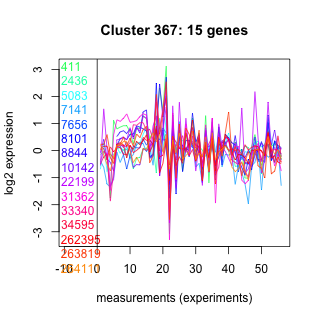
| Thaps_hclust_0367 |
 |
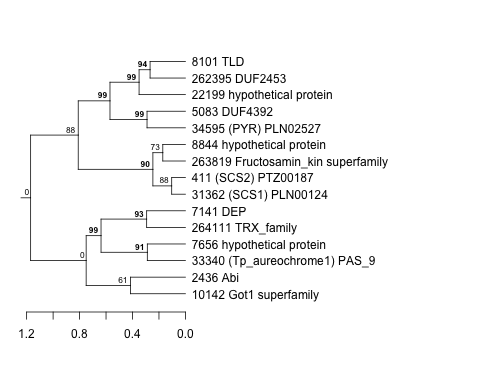 |
0.027 |
0.079 |
0.86 |
exponential_vs_stationary_24light | 0.961000 | -0.0259 |
| Title | Cluster Plot | Dendrogram | e-value | e-value | e-value | Condition | Condition FDR | Condition Difference |
|---|---|---|---|---|---|---|---|---|
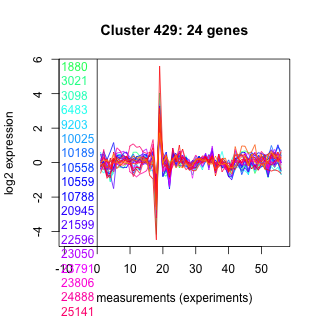
| Thaps_hclust_0429 |
 |
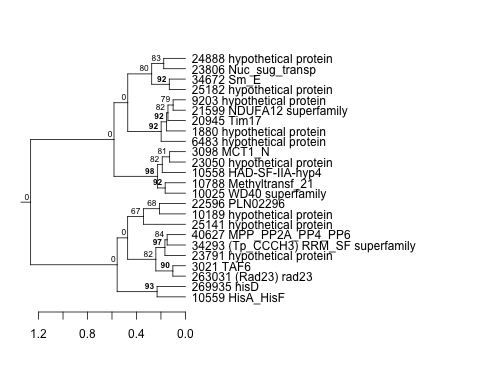 |
0.0000000033 |
0.00000039 |
0.000054 |
exponential_vs_stationary_24highlight | 0.961000 | -0.00769 |
| Title | Cluster Plot | Dendrogram | e-value | e-value | e-value | Condition | Condition FDR | Condition Difference |
|---|---|---|---|---|---|---|---|---|
| Thaps_hclust_0159 |
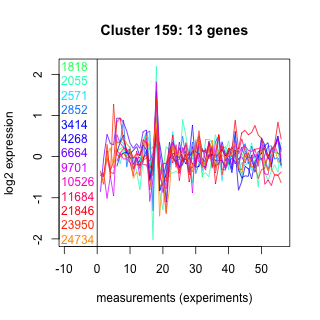 |
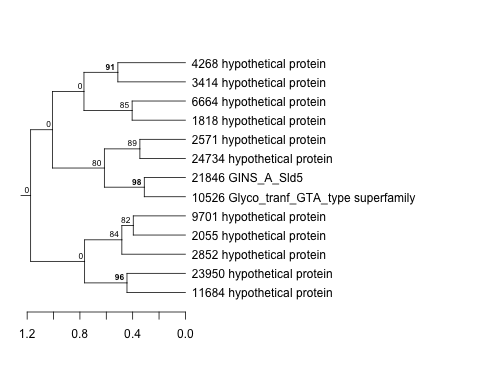 |
0.087 |
1.3 |
3 |
highlight_arrays | 0.961000 | 0.0124 |
| Title | Cluster Plot | Dendrogram | e-value | e-value | e-value | Condition | Condition FDR | Condition Difference |
|---|---|---|---|---|---|---|---|---|
| Thaps_hclust_0388 |
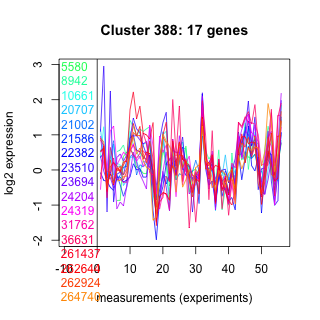 |
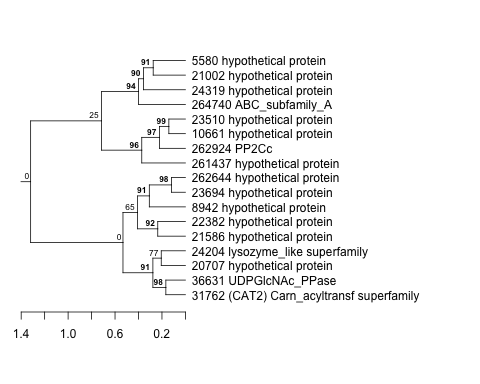 |
0.0000000024 |
23 |
380 |
exponential_vs_stationary_24light | 0.961000 | -0.0225 |
| Title | Cluster Plot | Dendrogram | e-value | e-value | e-value | Condition | Condition FDR | Condition Difference |
|---|---|---|---|---|---|---|---|---|
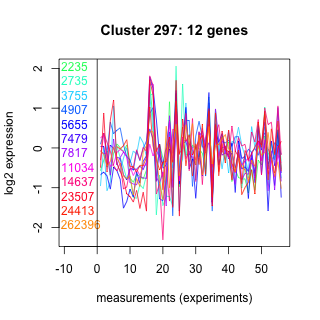
| Thaps_hclust_0297 |
 |
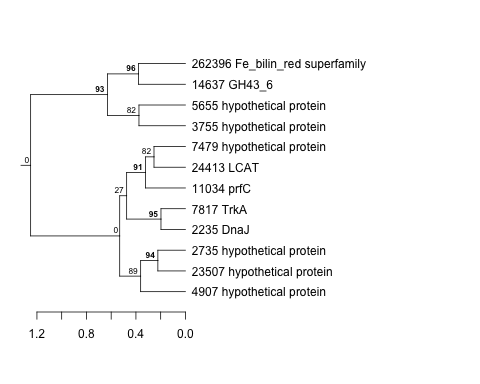 |
0.018 |
2.5 |
24 |
diel_exponential_vs_stationary | 0.960000 | 0.0179 |
| Title | Cluster Plot | Dendrogram | e-value | e-value | e-value | Condition | Condition FDR | Condition Difference |
|---|---|---|---|---|---|---|---|---|
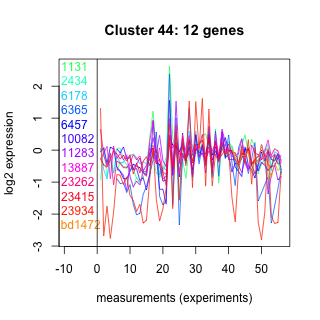
| Thaps_hclust_0044 |
 |
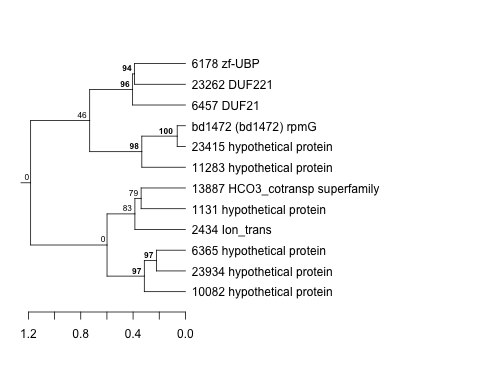 |
0.27 |
2.6 |
4.2 |
exponential_vs_stationary_24highlight | 0.960000 | -0.0113 |
| Title | Cluster Plot | Dendrogram | e-value | e-value | e-value | Condition | Condition FDR | Condition Difference |
|---|---|---|---|---|---|---|---|---|
| Thaps_hclust_0472 |
 |
 |
0.00000011 |
0.000015 |
0.00015 |
exponential_vs_stationary_24highlight | 0.960000 | -0.00847 |
| Title | Cluster Plot | Dendrogram | e-value | e-value | e-value | Condition | Condition FDR | Condition Difference |
|---|---|---|---|---|---|---|---|---|
| Thaps_hclust_0233 |
 |
 |
0.01 |
0.026 |
25 |
diel_light_vs_dark | 0.959000 | 0.0177 |
| Title | Cluster Plot | Dendrogram | e-value | e-value | e-value | Condition | Condition FDR | Condition Difference |
|---|---|---|---|---|---|---|---|---|
| Thaps_hclust_0480 |
 |
 |
0.18 |
1.3 |
44 |
diel_light_vs_dark | 0.959000 | 0.0207 |
| Title | Cluster Plot | Dendrogram | e-value | e-value | e-value | Condition | Condition FDR | Condition Difference |
|---|---|---|---|---|---|---|---|---|
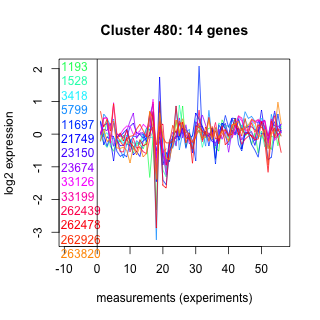
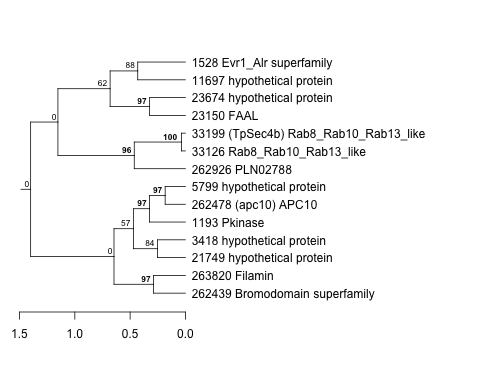
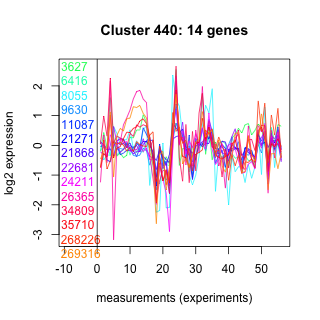
| Thaps_hclust_0440 |
 |
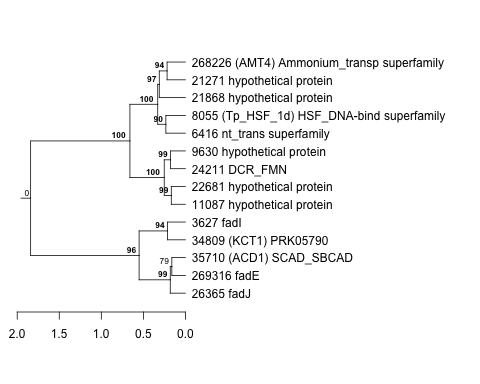 |
0.68 |
4.6 |
250 |
diel_light_vs_dark | 0.959000 | 0.0196 |
| Title | Cluster Plot | Dendrogram | e-value | e-value | e-value | Condition | Condition FDR | Condition Difference |
|---|---|---|---|---|---|---|---|---|
| Thaps_hclust_0454 |
 |
 |
0.0000012 |
0.00054 |
0.21 |
diel_light_vs_dark | 0.959000 | 0.0181 |
| Title | Cluster Plot | Dendrogram | e-value | e-value | e-value | Condition | Condition FDR | Condition Difference |
|---|---|---|---|---|---|---|---|---|
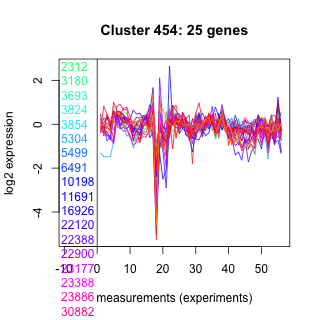
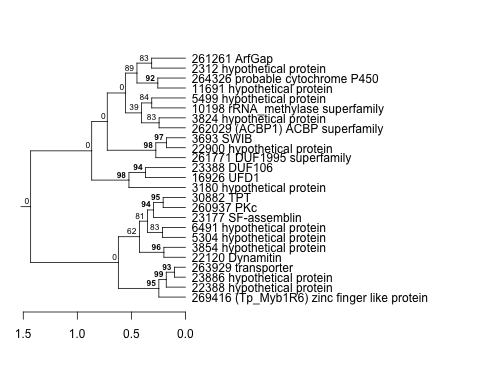
| Thaps_hclust_0466 |
 |
 |
0.0000055 |
0.000014 |
0.0017 |
lowN_TMEVA | 0.959000 | 0.0213 |
| Title | Cluster Plot | Dendrogram | e-value | e-value | e-value | Condition | Condition FDR | Condition Difference |
|---|---|---|---|---|---|---|---|---|
| Thaps_hclust_0483 |
 |
 |
0.7 |
5 |
0.096 |
lowN_TMEVA | 0.959000 | -0.0213 |
| Title | Cluster Plot | Dendrogram | e-value | e-value | e-value | Condition | Condition FDR | Condition Difference |
|---|---|---|---|---|---|---|---|---|
| Thaps_hclust_0128 |
 |
 |
0.0000000058 |
0.00033 |
21 |
lowN_TMEVA | 0.959000 | -0.0215 |
| Title | Cluster Plot | Dendrogram | e-value | e-value | e-value | Condition | Condition FDR | Condition Difference |
|---|---|---|---|---|---|---|---|---|
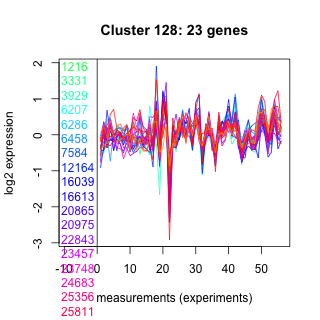
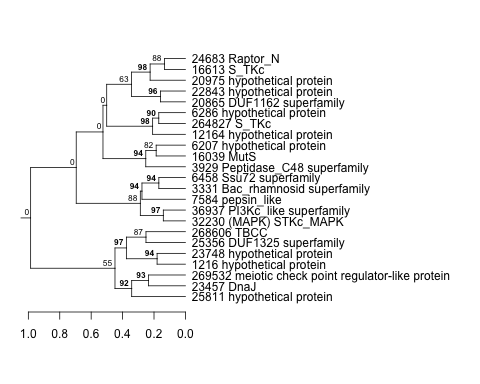
| Thaps_hclust_0162 |
 |
 |
0.032 |
3.2 |
58 |
diel_light_vs_dark | 0.959000 | 0.0192 |
| Title | Cluster Plot | Dendrogram | e-value | e-value | e-value | Condition | Condition FDR | Condition Difference |
|---|---|---|---|---|---|---|---|---|
| Thaps_hclust_0053 |
 |
 |
0.000012 |
0.000065 |
0.009 |
diel_light_vs_dark | 0.959000 | -0.0277 |
| Title | Cluster Plot | Dendrogram | e-value | e-value | e-value | Condition | Condition FDR | Condition Difference |
|---|---|---|---|---|---|---|---|---|
| Thaps_hclust_0194 |
 |
 |
0.27 |
0.6 |
1.5 |
co2_elevated_expo_arrays | 0.959000 | -0.0302 |
| Thaps_hclust_0194 |
|
|
0.27 |
0.6 |
1.5 |
lowFe_KTKB_Day3 | 0.954000 | -0.0187 |
| Title | Cluster Plot | Dendrogram | e-value | e-value | e-value | Condition | Condition FDR | Condition Difference |
|---|---|---|---|---|---|---|---|---|
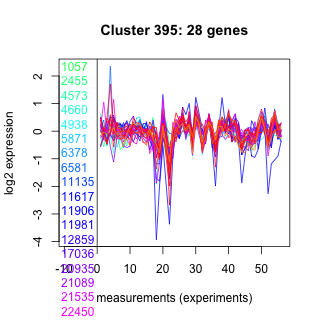
| Thaps_hclust_0395 |
 |
 |
0.0015 |
0.0018 |
0.48 |
diel_light_vs_dark | 0.959000 | -0.0151 |
| Title | Cluster Plot | Dendrogram | e-value | e-value | e-value | Condition | Condition FDR | Condition Difference |
|---|---|---|---|---|---|---|---|---|
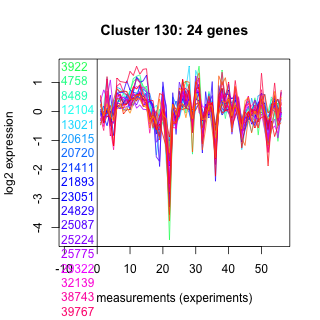
| Thaps_hclust_0130 |
 |
 |
0.64 |
15 |
13 |
highpH_TMEVA | 0.958000 | -0.0161 |
| Title | Cluster Plot | Dendrogram | e-value | e-value | e-value | Condition | Condition FDR | Condition Difference |
|---|---|---|---|---|---|---|---|---|
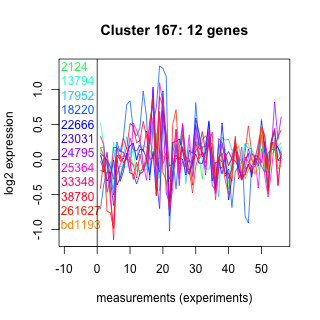
| Thaps_hclust_0167 |
 |
 |
1 |
15 |
160 |
diel_exponential_vs_stationary | 0.958000 | -0.0184 |
| Title | Cluster Plot | Dendrogram | e-value | e-value | e-value | Condition | Condition FDR | Condition Difference |
|---|---|---|---|---|---|---|---|---|
| Thaps_hclust_0100 |
 |
 |
0.00000073 |
0.000076 |
2.6 |
lowFe_KTKB_Day5 | 0.957000 | 0.0151 |
| Title | Cluster Plot | Dendrogram | e-value | e-value | e-value | Condition | Condition FDR | Condition Difference |
|---|---|---|---|---|---|---|---|---|
| Thaps_hclust_0445 |
 |
 |
0.000046 |
6.9 |
33 |
exponential_vs_stationary_24highlight | 0.957000 | -0.0101 |
| Title | Cluster Plot | Dendrogram | e-value | e-value | e-value | Condition | Condition FDR | Condition Difference |
|---|---|---|---|---|---|---|---|---|
| Thaps_hclust_0298 |
 |
 |
0.035 |
0.58 |
41 |
diel_light_vs_dark | 0.957000 | -0.0291 |
| Title | Cluster Plot | Dendrogram | e-value | e-value | e-value | Condition | Condition FDR | Condition Difference |
|---|---|---|---|---|---|---|---|---|
| Thaps_hclust_0145 |
 |
 |
0.015 |
1.6 |
11 |
exponential_vs_stationary_24light | 0.957000 | -0.0334 |
| Title | Cluster Plot | Dendrogram | e-value | e-value | e-value | Condition | Condition FDR | Condition Difference |
|---|---|---|---|---|---|---|---|---|
| Thaps_hclust_0138 |
 |
 |
0.00000000000028 |
0.0000000011 |
0.0000065 |
lowFe_KTKB_Day5 | 0.957000 | -0.00822 |
| Title | Cluster Plot | Dendrogram | e-value | e-value | e-value | Condition | Condition FDR | Condition Difference |
|---|---|---|---|---|---|---|---|---|
| Thaps_hclust_0270 |
 |
 |
0.0000000000069 |
0.000026 |
0.0036 |
diel_light_vs_dark | 0.957000 | 0.0161 |
| Title | Cluster Plot | Dendrogram | e-value | e-value | e-value | Condition | Condition FDR | Condition Difference |
|---|---|---|---|---|---|---|---|---|
| Thaps_hclust_0475 |
 |
 |
0.011 |
0.95 |
0.77 |
lowSi_TMEVA | 0.956000 | 0.154 |
| Title | Cluster Plot | Dendrogram | e-value | e-value | e-value | Condition | Condition FDR | Condition Difference |
|---|---|---|---|---|---|---|---|---|
| Thaps_hclust_0239 |
 |
 |
0.000019 |
0.001 |
0.06 |
diel_exponential_vs_stationary | 0.956000 | -0.0155 |
| Title | Cluster Plot | Dendrogram | e-value | e-value | e-value | Condition | Condition FDR | Condition Difference |
|---|---|---|---|---|---|---|---|---|
| Thaps_hclust_0266 |
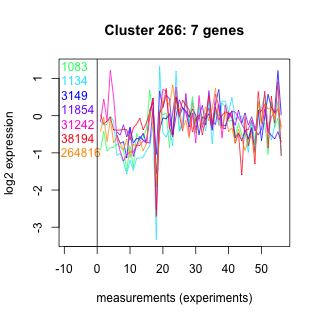 |
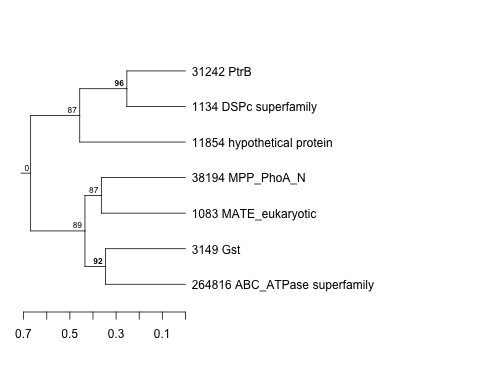 |
0.44 |
17 |
30 |
diel_exponential_vs_stationary | 0.956000 | 0.0233 |
| Title | Cluster Plot | Dendrogram | e-value | e-value | e-value | Condition | Condition FDR | Condition Difference |
|---|---|---|---|---|---|---|---|---|
| Thaps_hclust_0213 |
 |
 |
0.0000045 |
0.075 |
0.54 |
lowFe_KTKB_Day5 | 0.956000 | -0.0108 |
| Title | Cluster Plot | Dendrogram | e-value | e-value | e-value | Condition | Condition FDR | Condition Difference |
|---|---|---|---|---|---|---|---|---|
| Thaps_hclust_0363 |
 |
 |
0.56 |
1.4 |
2.1 |
co2_elevated_expo_arrays | 0.955000 | -0.0343 |
| Title | Cluster Plot | Dendrogram | e-value | e-value | e-value | Condition | Condition FDR | Condition Difference |
|---|---|---|---|---|---|---|---|---|
| Thaps_hclust_0170 |
 |
 |
0.028 |
1.8 |
150 |
exponential_vs_stationary_24light | 0.955000 | 0.0252 |
| Title | Cluster Plot | Dendrogram | e-value | e-value | e-value | Condition | Condition FDR | Condition Difference |
|---|---|---|---|---|---|---|---|---|
| Thaps_hclust_0076 |
 |
 |
0.0047 |
0.13 |
1.2 |
lowFe_KTKB_Day5 | 0.955000 | 0.0141 |
| Title | Cluster Plot | Dendrogram | e-value | e-value | e-value | Condition | Condition FDR | Condition Difference |
|---|---|---|---|---|---|---|---|---|
| Thaps_hclust_0242 |
 |
 |
3e-20 |
0.0000000000034 |
0.0085 |
lowFe_TMEVA | 0.954000 | -0.0253 |
| Title | Cluster Plot | Dendrogram | e-value | e-value | e-value | Condition | Condition FDR | Condition Difference |
|---|---|---|---|---|---|---|---|---|
| Thaps_hclust_0251 |
 |
 |
0.027 |
0.025 |
9.3 |
lowFe_KTKB_Day3 | 0.954000 | 0.0181 |
| Title | Cluster Plot | Dendrogram | e-value | e-value | e-value | Condition | Condition FDR | Condition Difference |
|---|---|---|---|---|---|---|---|---|
| Thaps_hclust_0478 |
 |
 |
0.1 |
0.0096 |
3.5 |
lowFe_KTKB_Day3 | 0.954000 | -0.0209 |
| Title | Cluster Plot | Dendrogram | e-value | e-value | e-value | Condition | Condition FDR | Condition Difference |
|---|---|---|---|---|---|---|---|---|
| Thaps_hclust_0225 |
 |
 |
0.00000024 |
0.000003 |
0.0048 |
lowFe_KTKB_Day3 | 0.954000 | -0.0188 |
| Title | Cluster Plot | Dendrogram | e-value | e-value | e-value | Condition | Condition FDR | Condition Difference |
|---|---|---|---|---|---|---|---|---|
| Thaps_hclust_0197 |
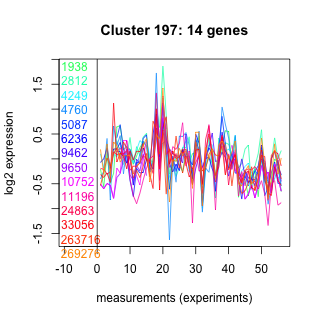 |
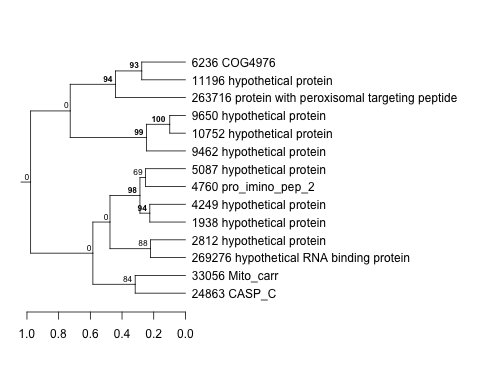 |
0.12 |
0.3 |
0.65 |
lowN_TMEVA | 0.954000 | -0.0253 |
| Title | Cluster Plot | Dendrogram | e-value | e-value | e-value | Condition | Condition FDR | Condition Difference |
|---|---|---|---|---|---|---|---|---|
| Thaps_hclust_0495 |
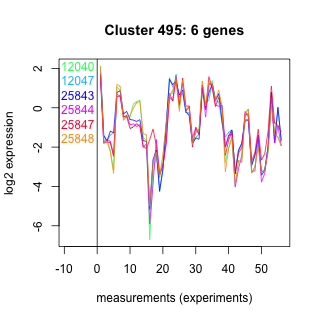 |
 |
0.0000000031 |
0.00000049 |
0.0000038 |
co2_elevated_stat_arrays | 0.954000 | 0.02 |
| Title | Cluster Plot | Dendrogram | e-value | e-value | e-value | Condition | Condition FDR | Condition Difference |
|---|---|---|---|---|---|---|---|---|
| Thaps_hclust_0402 |
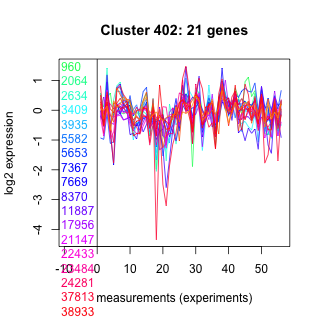 |
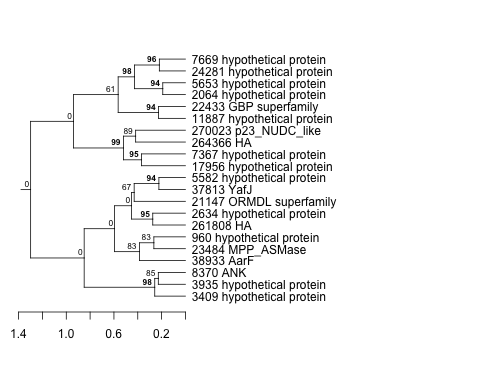 |
0.0022 |
5.7 |
0.07 |
diel_light_vs_dark | 0.954000 | -0.0227 |
| Title | Cluster Plot | Dendrogram | e-value | e-value | e-value | Condition | Condition FDR | Condition Difference |
|---|---|---|---|---|---|---|---|---|
| Thaps_hclust_0187 |
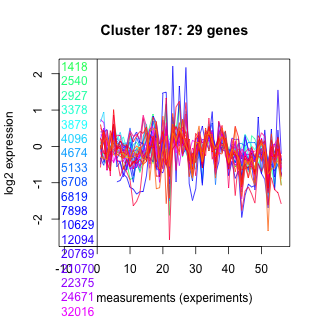 |
 |
0.000000024 |
0.034 |
0.66 |
lowSi_TMEVA | 0.954000 | -0.16 |
| Title | Cluster Plot | Dendrogram | e-value | e-value | e-value | Condition | Condition FDR | Condition Difference |
|---|---|---|---|---|---|---|---|---|
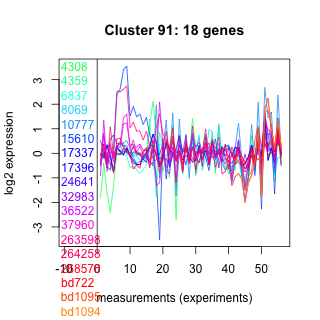
| Thaps_hclust_0091 |
 |
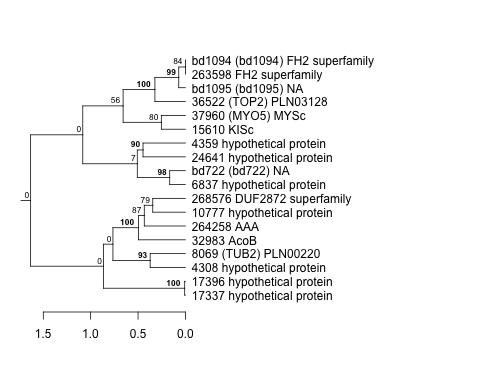 |
0.00000061 |
0.00022 |
0.44 |
BaP | 0.954000 | -0.0171 |
| Title | Cluster Plot | Dendrogram | e-value | e-value | e-value | Condition | Condition FDR | Condition Difference |
|---|---|---|---|---|---|---|---|---|
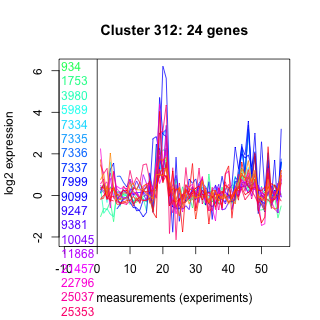
| Thaps_hclust_0312 |
 |
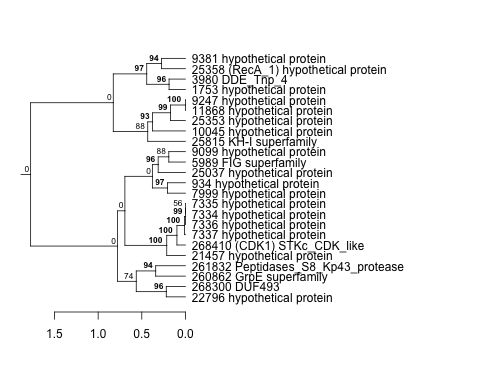 |
1.6e-19 |
9.9e-16 |
0.000000000033 |
lowFe_KTKB_Day5 | 0.954000 | -0.014 |
| Title | Cluster Plot | Dendrogram | e-value | e-value | e-value | Condition | Condition FDR | Condition Difference |
|---|---|---|---|---|---|---|---|---|
| Thaps_hclust_0142 |
 |
 |
0.000000000000013 |
0.0000000004 |
0.001 |
lowSi_TMEVA | 0.954000 | -0.167 |