Hierarchical Clusters
Displaying 1501 - 1600 of 7500
| Title | Cluster Plot | Dendrogram | e-value | e-value | e-value | Condition | Condition FDR | Condition Difference |
|---|---|---|---|---|---|---|---|---|
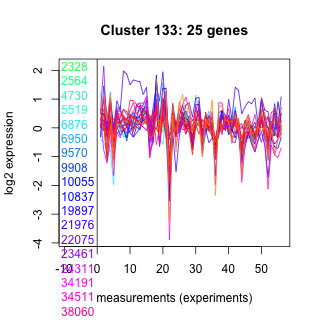
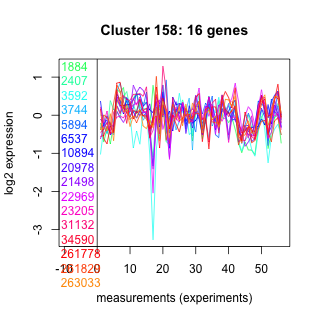
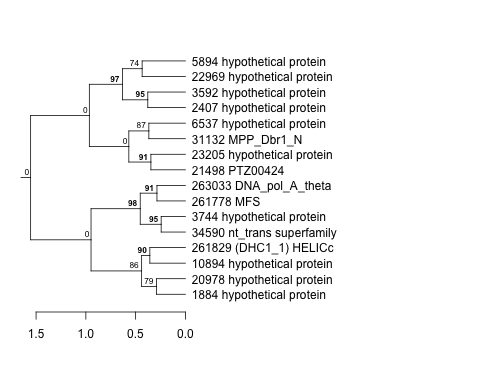
| Thaps_hclust_0133 |
 |
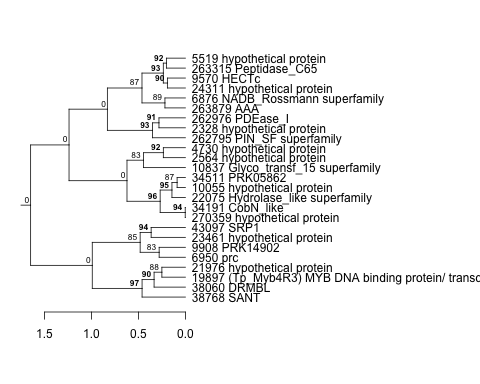 |
0.95 |
2.2 |
2.4 |
lowN_TMEVA | 0.310000 | -0.324 |
| Title | Cluster Plot | Dendrogram | e-value | e-value | e-value | Condition | Condition FDR | Condition Difference |
|---|---|---|---|---|---|---|---|---|
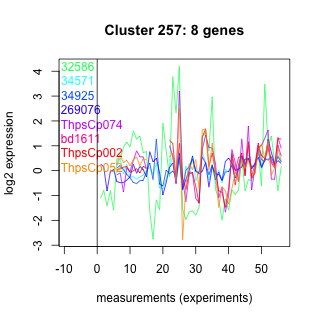
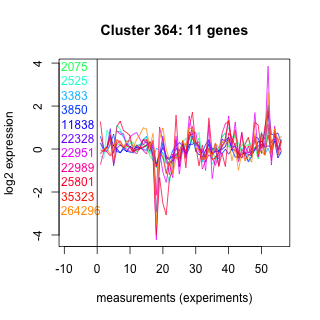
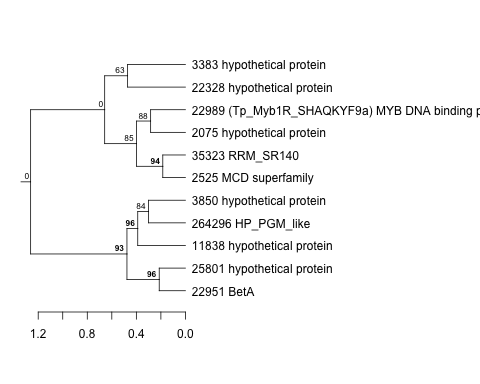
| Thaps_hclust_0257 |
 |
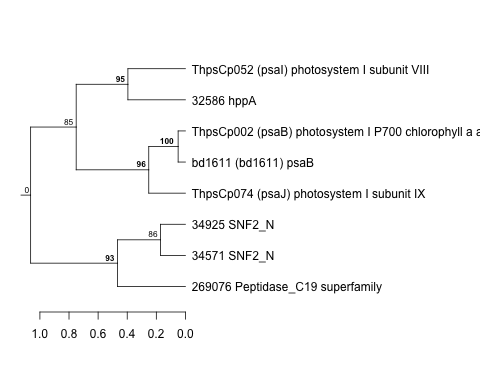 |
Not available | Not available | Not available | lowFe_TMEVA | 0.395000 | -0.324 |
| Title | Cluster Plot | Dendrogram | e-value | e-value | e-value | Condition | Condition FDR | Condition Difference |
|---|---|---|---|---|---|---|---|---|
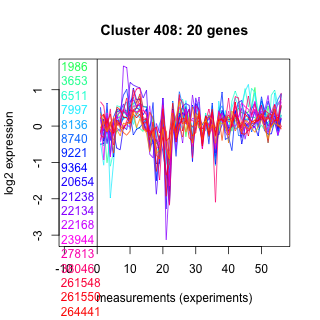
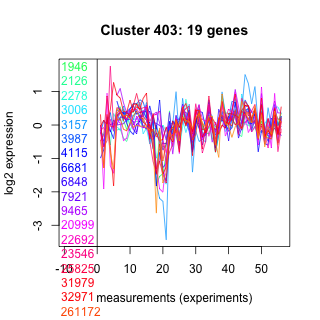
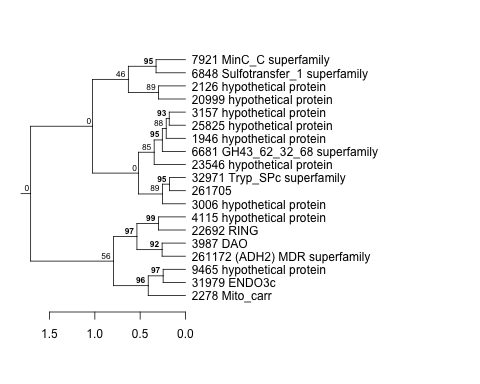
| Thaps_hclust_0408 |
 |
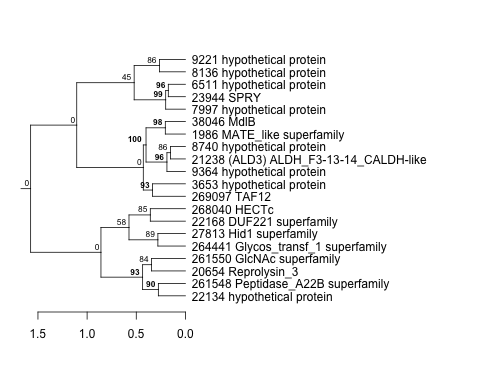 |
0.3 |
4.9 |
5.3 |
lowSi_TMEVA | 0.631000 | -0.324 |
| Title | Cluster Plot | Dendrogram | e-value | e-value | e-value | Condition | Condition FDR | Condition Difference |
|---|---|---|---|---|---|---|---|---|
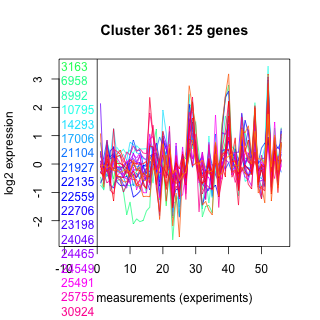
| Thaps_hclust_0361 |
 |
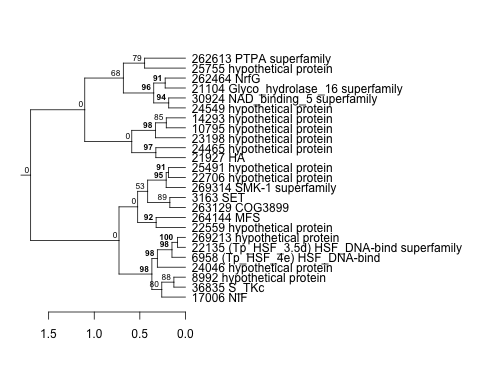 |
0.00000000081 |
0.14 |
2.1 |
lowFe_TMEVA | 0.191000 | -0.324 |
| Title | Cluster Plot | Dendrogram | e-value | e-value | e-value | Condition | Condition FDR | Condition Difference |
|---|---|---|---|---|---|---|---|---|
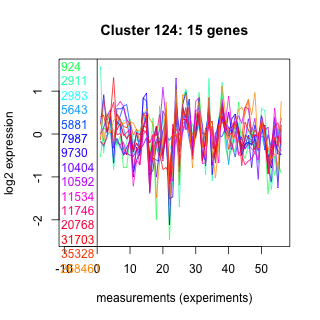
| Thaps_hclust_0124 |
 |
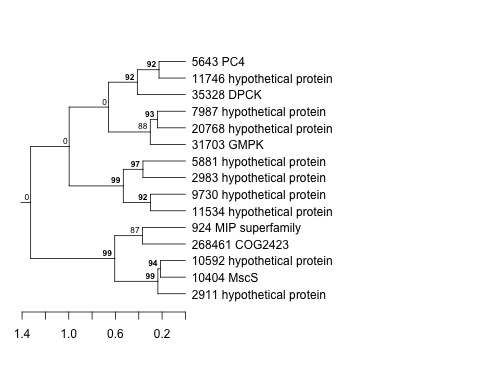 |
1 |
0.23 |
42 |
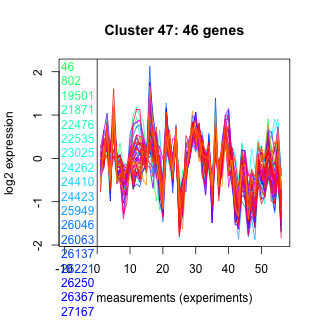
co2_elevated_stat_arrays | 0.189000 | -0.324 |
| Title | Cluster Plot | Dendrogram | e-value | e-value | e-value | Condition | Condition FDR | Condition Difference |
|---|---|---|---|---|---|---|---|---|
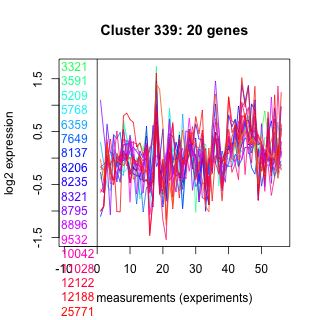
| Thaps_hclust_0339 |
 |
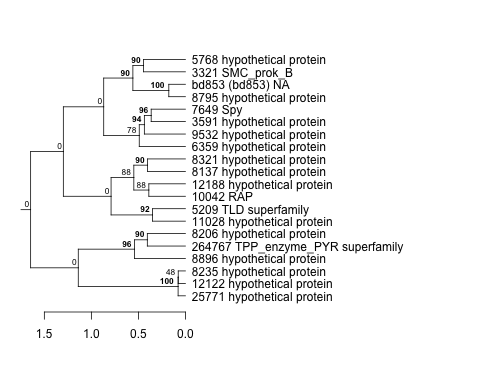 |
0.000016 |
0.00038 |
0.0017 |
highpH_TMEVA | 0.043600 | -0.324 |
| Title | Cluster Plot | Dendrogram | e-value | e-value | e-value | Condition | Condition FDR | Condition Difference |
|---|---|---|---|---|---|---|---|---|
| Thaps_hclust_0260 |
 |
 |
1.6e-36 |
9.1e-22 |
8.6e-22 |
lowFe_KTKB_Day3 | 0.315000 | -0.323 |
| Title | Cluster Plot | Dendrogram | e-value | e-value | e-value | Condition | Condition FDR | Condition Difference |
|---|---|---|---|---|---|---|---|---|
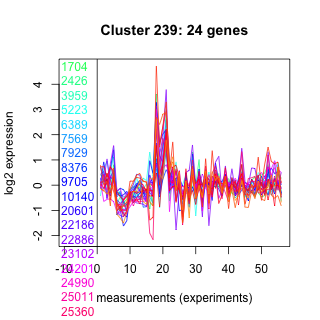
| Thaps_hclust_0239 |
 |
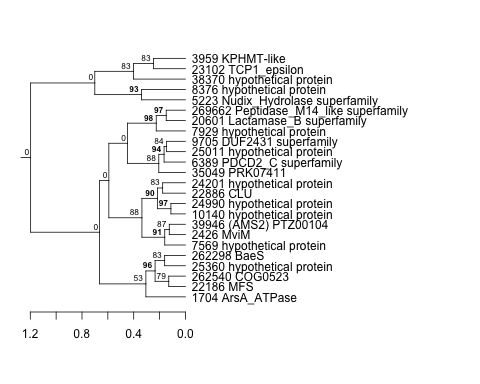 |
0.000019 |
0.001 |
0.06 |
lowFe_KTKB_Day5 | 0.072400 | -0.323 |
| Title | Cluster Plot | Dendrogram | e-value | e-value | e-value | Condition | Condition FDR | Condition Difference |
|---|---|---|---|---|---|---|---|---|
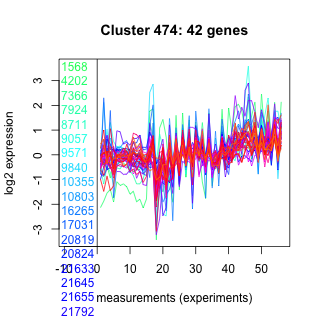
| Thaps_hclust_0474 |
 |
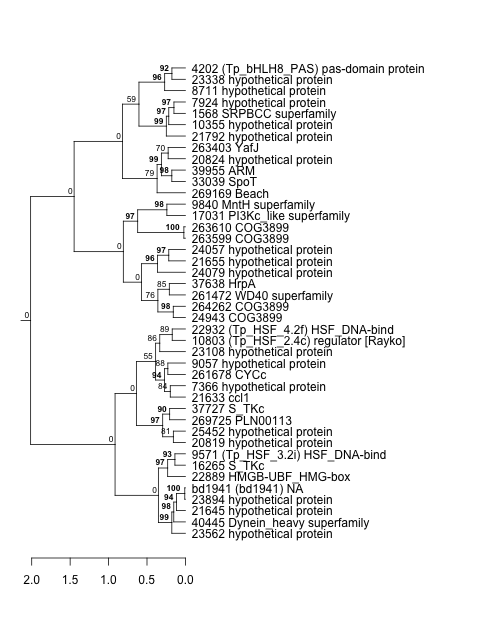 |
0.0078 |
0.000018 |
0.003 |
highpH_TMEVA | 0.000725 | -0.323 |
| Title | Cluster Plot | Dendrogram | e-value | e-value | e-value | Condition | Condition FDR | Condition Difference |
|---|---|---|---|---|---|---|---|---|
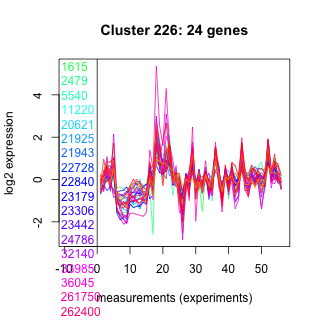
| Thaps_hclust_0226 |
 |
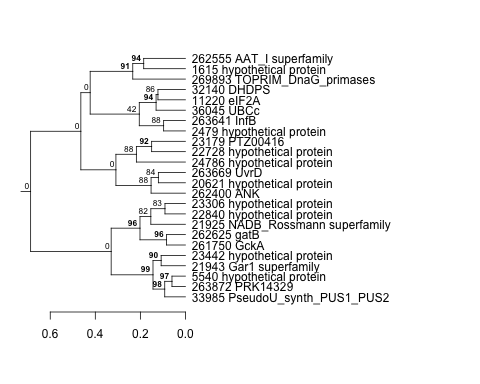 |
0.000000041 |
0.95 |
4.6 |
highpH_TMEVA | 0.027300 | -0.323 |
| Title | Cluster Plot | Dendrogram | e-value | e-value | e-value | Condition | Condition FDR | Condition Difference |
|---|---|---|---|---|---|---|---|---|
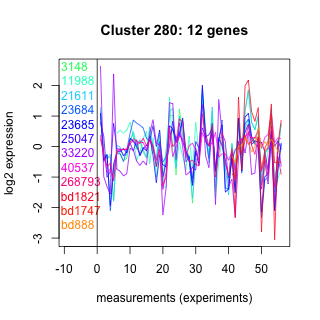
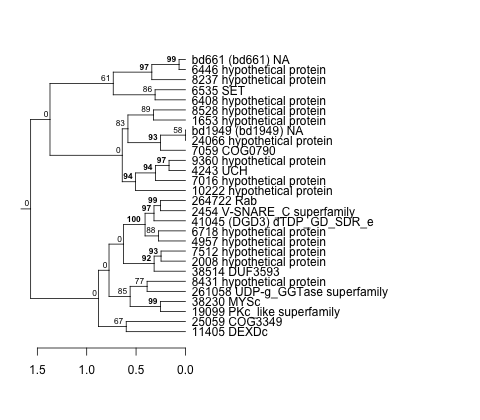
| Thaps_hclust_0280 |
 |
 |
0.75 |
0.64 |
81 |
lowFe_TMEVA | 0.349000 | -0.322 |
| Title | Cluster Plot | Dendrogram | e-value | e-value | e-value | Condition | Condition FDR | Condition Difference |
|---|---|---|---|---|---|---|---|---|
| Thaps_hclust_0154 |
 |
 |
0.00015 |
0.0049 |
0.29 |
lowtemp_TMEVA | 0.203000 | -0.322 |
| Title | Cluster Plot | Dendrogram | e-value | e-value | e-value | Condition | Condition FDR | Condition Difference |
|---|---|---|---|---|---|---|---|---|
| Thaps_hclust_0156 |
 |
 |
0.00054 |
0.00071 |
0.0013 |
lowN_TMEVA | 0.281000 | -0.322 |
| Title | Cluster Plot | Dendrogram | e-value | e-value | e-value | Condition | Condition FDR | Condition Difference |
|---|---|---|---|---|---|---|---|---|
| Thaps_hclust_0176 |
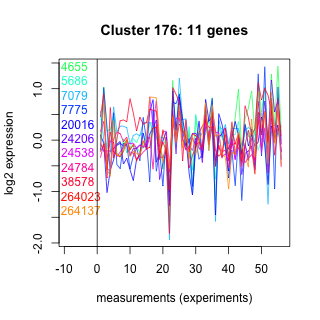 |
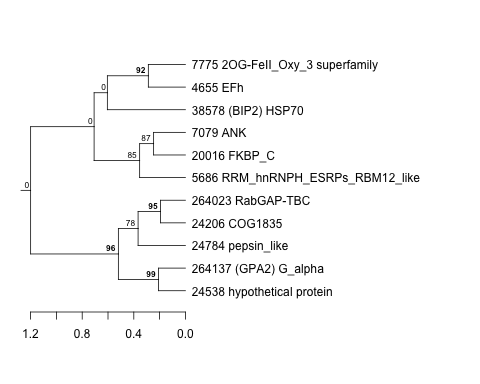 |
29 |
59 |
110 |
highlight_arrays | 0.129000 | -0.322 |
| Thaps_hclust_0176 |
|
|
29 |
59 |
110 |
co2_elevated_stat_arrays | 0.280000 | -0.305 |
| Title | Cluster Plot | Dendrogram | e-value | e-value | e-value | Condition | Condition FDR | Condition Difference |
|---|---|---|---|---|---|---|---|---|
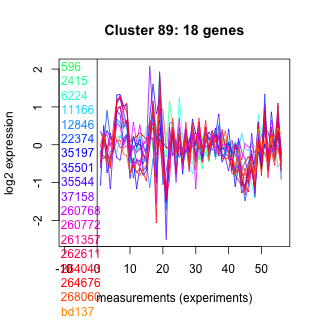
| Thaps_hclust_0089 |
 |
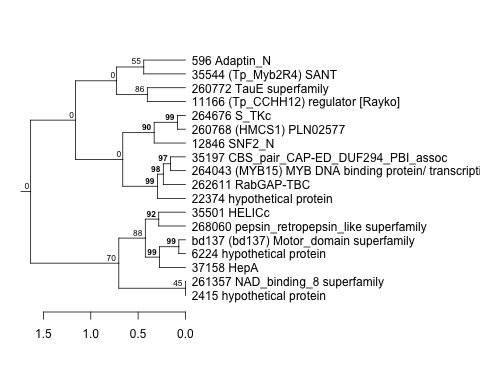 |
0.000036 |
0.00054 |
0.075 |
highpH_TMEVA | 0.053300 | -0.321 |
| Title | Cluster Plot | Dendrogram | e-value | e-value | e-value | Condition | Condition FDR | Condition Difference |
|---|---|---|---|---|---|---|---|---|
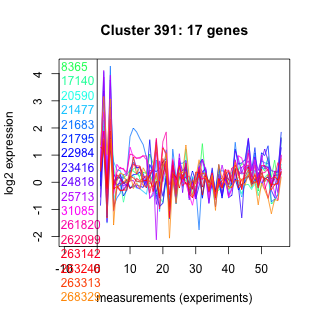
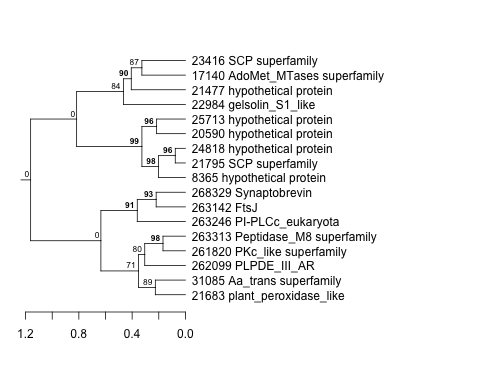
| Thaps_hclust_0391 |
 |
 |
1.9 |
34 |
32 |
exponential_vs_stationary_24highlight | 0.005770 | -0.321 |
| Thaps_hclust_0391 |
|
|
1.9 |
34 |
32 |
lowtemp_TMEVA | 0.263000 | -0.314 |
| Title | Cluster Plot | Dendrogram | e-value | e-value | e-value | Condition | Condition FDR | Condition Difference |
|---|---|---|---|---|---|---|---|---|
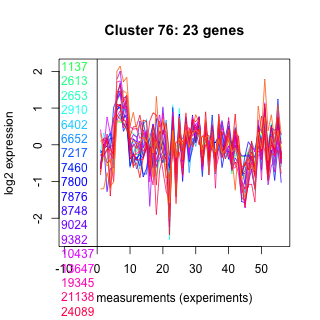
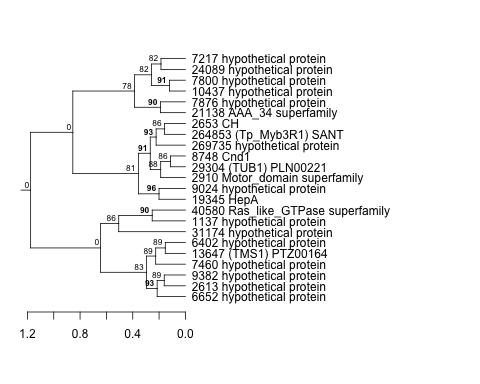
| Thaps_hclust_0076 |
 |
 |
0.0047 |
0.13 |
1.2 |
lowSi_TMEVA | 0.620000 | -0.321 |
| Thaps_hclust_0076 |
|
|
0.0047 |
0.13 |
1.2 |
lowFe_KTKB_Day3 | 0.150000 | -0.315 |
| Title | Cluster Plot | Dendrogram | e-value | e-value | e-value | Condition | Condition FDR | Condition Difference |
|---|---|---|---|---|---|---|---|---|
| Thaps_hclust_0158 |
 |
 |
0.007 |
0.55 |
1.2 |
lowFe_TMEVA | 0.300000 | -0.321 |
| Title | Cluster Plot | Dendrogram | e-value | e-value | e-value | Condition | Condition FDR | Condition Difference |
|---|---|---|---|---|---|---|---|---|
| Thaps_hclust_0364 |
 |
 |
4.5 |
28 |
590 |
highlight_arrays | 0.129000 | -0.321 |
| Title | Cluster Plot | Dendrogram | e-value | e-value | e-value | Condition | Condition FDR | Condition Difference |
|---|---|---|---|---|---|---|---|---|
| Thaps_hclust_0243 |
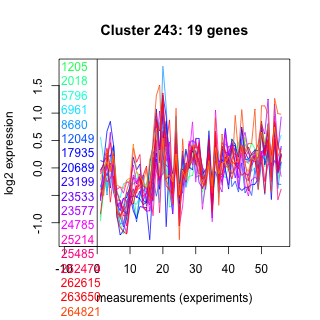 |
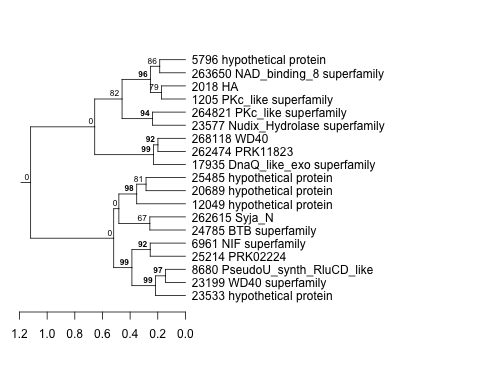 |
0.00018 |
0.14 |
0.0019 |
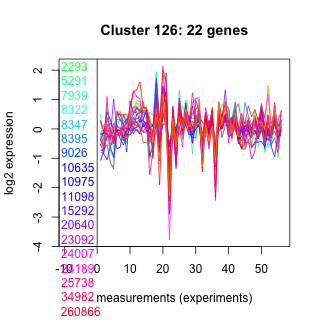
diel_light_vs_dark | 0.130000 | -0.321 |
| Title | Cluster Plot | Dendrogram | e-value | e-value | e-value | Condition | Condition FDR | Condition Difference |
|---|---|---|---|---|---|---|---|---|
| Thaps_hclust_0431 |
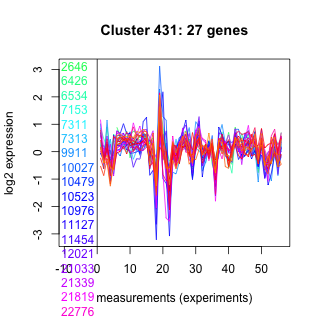 |
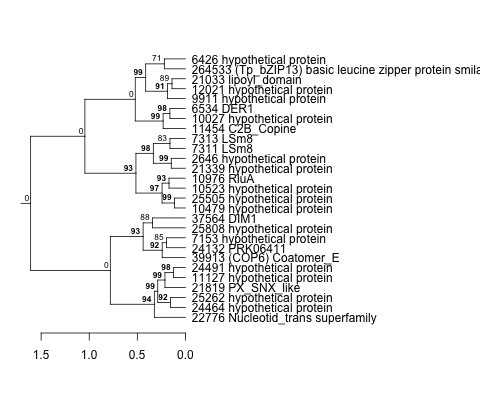 |
0.003 |
0.00095 |
0.0043 |
co2_elevated_stat_arrays | 0.101000 | -0.321 |
| Title | Cluster Plot | Dendrogram | e-value | e-value | e-value | Condition | Condition FDR | Condition Difference |
|---|---|---|---|---|---|---|---|---|
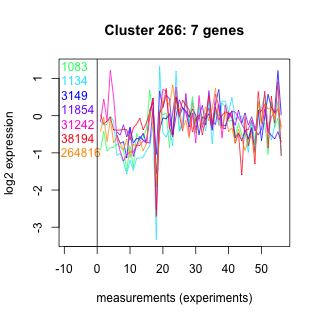
| Thaps_hclust_0266 |
 |
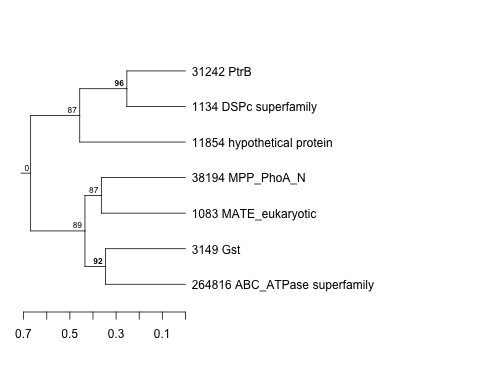 |
0.44 |
17 |
30 |
lowtemp_TMEVA | 0.430000 | -0.32 |
| Title | Cluster Plot | Dendrogram | e-value | e-value | e-value | Condition | Condition FDR | Condition Difference |
|---|---|---|---|---|---|---|---|---|
| Thaps_hclust_0173 |
 |
 |
0.013 |
0.83 |
0.45 |
lowFe_KTKB_Day3 | 0.142000 | -0.32 |
| Title | Cluster Plot | Dendrogram | e-value | e-value | e-value | Condition | Condition FDR | Condition Difference |
|---|---|---|---|---|---|---|---|---|
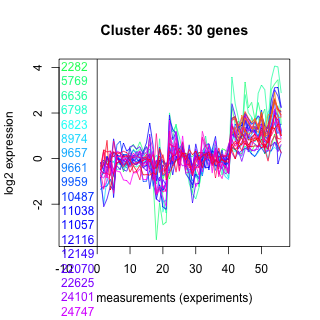
| Thaps_hclust_0465 |
 |
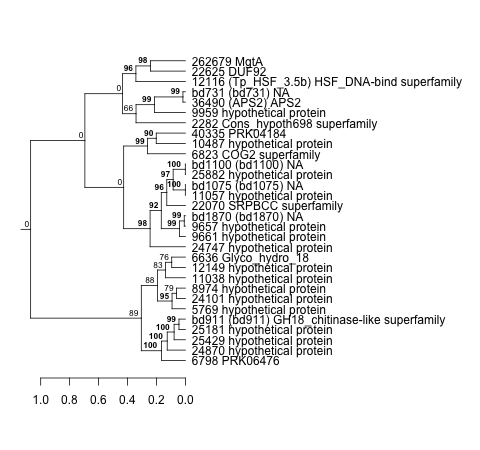 |
0.011 |
0.053 |
0.75 |
co2_elevated_stat_arrays | 0.092900 | -0.32 |
| Title | Cluster Plot | Dendrogram | e-value | e-value | e-value | Condition | Condition FDR | Condition Difference |
|---|---|---|---|---|---|---|---|---|
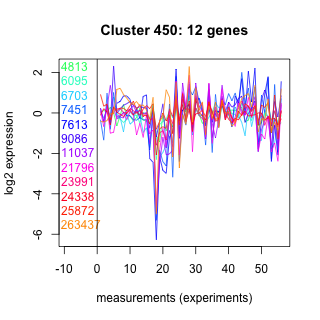
| Thaps_hclust_0450 |
 |
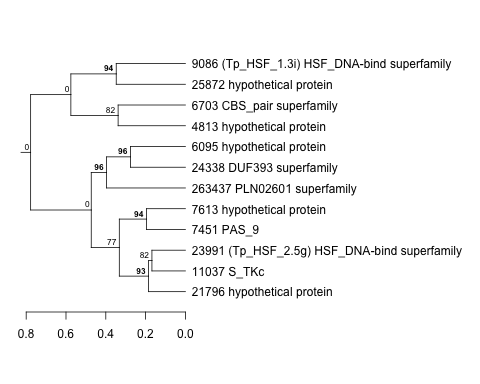 |
0.00076 |
0.024 |
0.16 |
lowFe_TMEVA | 0.349000 | -0.32 |
| Title | Cluster Plot | Dendrogram | e-value | e-value | e-value | Condition | Condition FDR | Condition Difference |
|---|---|---|---|---|---|---|---|---|
| Thaps_hclust_0290 |
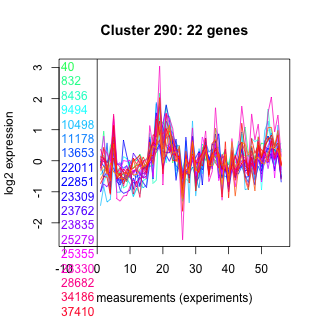 |
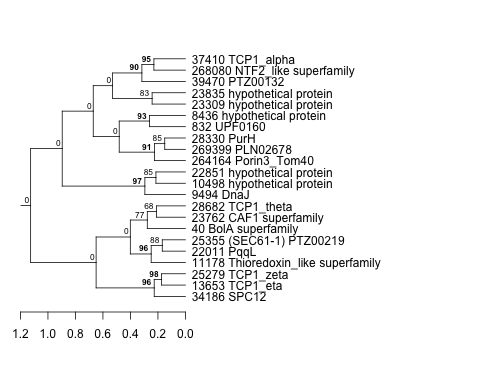 |
3e-16 |
0.014 |
0.072 |
highlight_arrays | 0.030500 | -0.32 |
| Title | Cluster Plot | Dendrogram | e-value | e-value | e-value | Condition | Condition FDR | Condition Difference |
|---|---|---|---|---|---|---|---|---|
| Thaps_hclust_0033 |
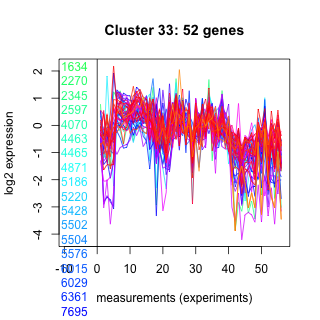 |
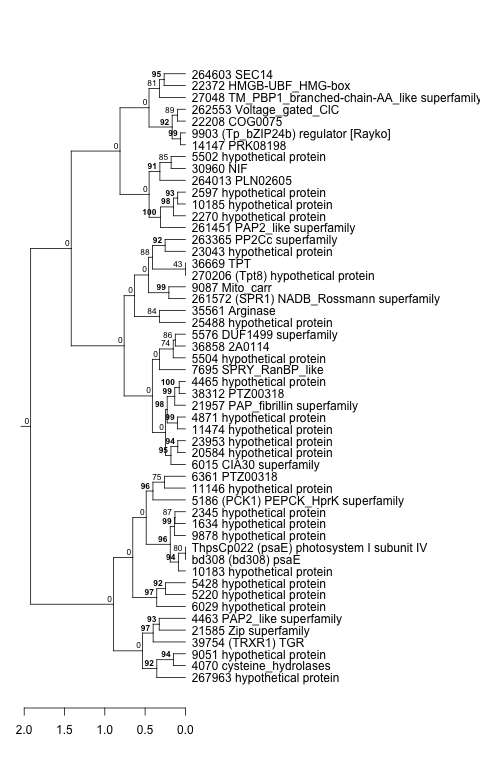 |
0.000000000000011 |
0.0012 |
0.0073 |
diel_light_vs_dark | 0.005160 | -0.32 |
| Thaps_hclust_0033 |
|
|
0.000000000000011 |
0.0012 |
0.0073 |
co2_elevated_stat_arrays | 0.043500 | -0.307 |
| Thaps_hclust_0033 |
|
|
0.000000000000011 |
0.0012 |
0.0073 |
highlight_arrays | 0.000847 | -0.306 |
| Title | Cluster Plot | Dendrogram | e-value | e-value | e-value | Condition | Condition FDR | Condition Difference |
|---|---|---|---|---|---|---|---|---|
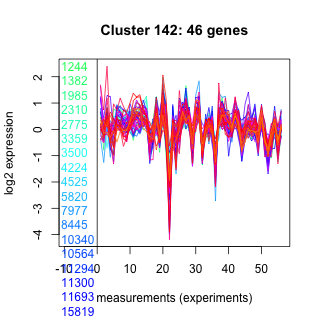
| Thaps_hclust_0142 |
 |
 |
0.000000000000013 |
0.0000000004 |
0.001 |
exponential_vs_stationary_24light | 0.159000 | -0.32 |
| Title | Cluster Plot | Dendrogram | e-value | e-value | e-value | Condition | Condition FDR | Condition Difference |
|---|---|---|---|---|---|---|---|---|
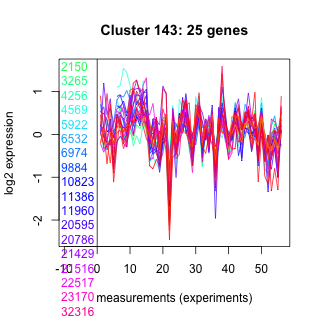
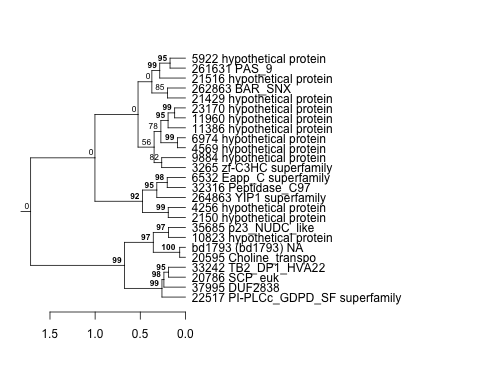
| Thaps_hclust_0143 |
 |
 |
0.018 |
0.041 |
0.67 |
diel_exponential_vs_stationary | 0.031700 | -0.32 |
| Thaps_hclust_0143 |
|
|
0.018 |
0.041 |
0.67 |
co2_elevated_stat_arrays | 0.146000 | -0.307 |
| Title | Cluster Plot | Dendrogram | e-value | e-value | e-value | Condition | Condition FDR | Condition Difference |
|---|---|---|---|---|---|---|---|---|
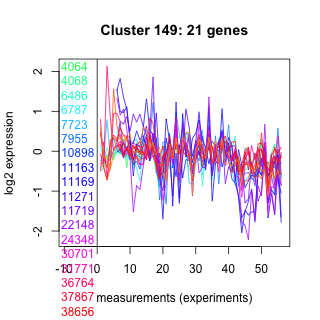
| Thaps_hclust_0149 |
 |
 |
0.00000027 |
0.46 |
3 |
BaP | 0.112000 | -0.32 |
| Title | Cluster Plot | Dendrogram | e-value | e-value | e-value | Condition | Condition FDR | Condition Difference |
|---|---|---|---|---|---|---|---|---|
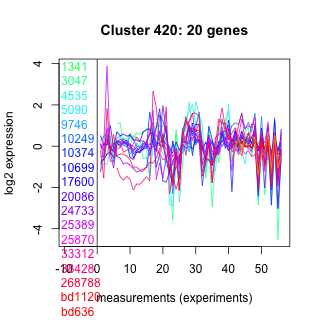
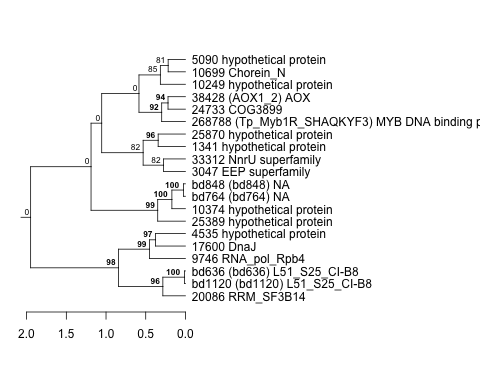
| Thaps_hclust_0420 |
 |
 |
0.000009 |
0.00077 |
0.53 |
exponential_vs_stationary_24highlight | 0.000926 | -0.32 |
| Title | Cluster Plot | Dendrogram | e-value | e-value | e-value | Condition | Condition FDR | Condition Difference |
|---|---|---|---|---|---|---|---|---|
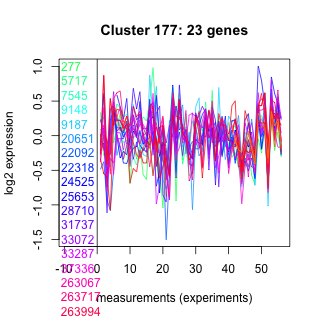
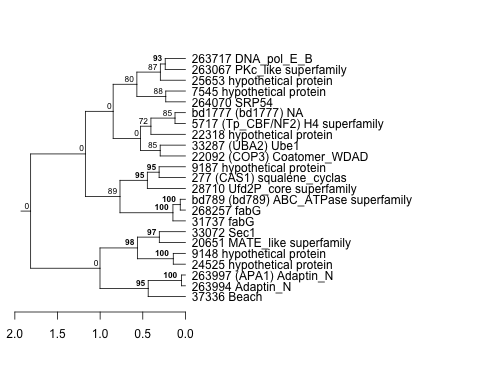
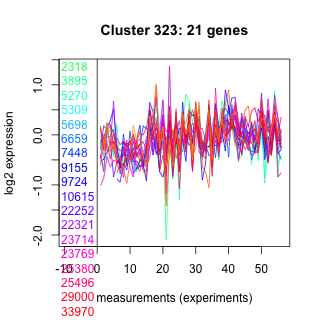
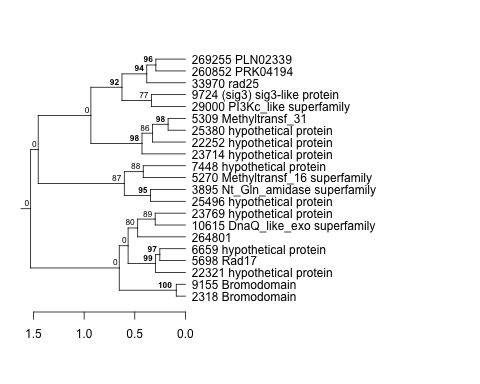
| Thaps_hclust_0177 |
 |
 |
0.0000000012 |
0.0000078 |
0.00084 |
highlight_arrays | 0.026900 | -0.32 |
| Title | Cluster Plot | Dendrogram | e-value | e-value | e-value | Condition | Condition FDR | Condition Difference |
|---|---|---|---|---|---|---|---|---|
| Thaps_hclust_0451 |
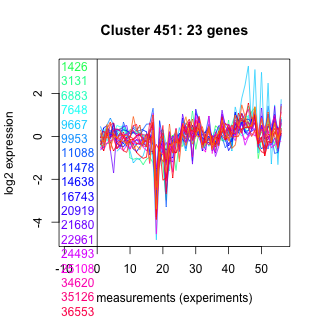 |
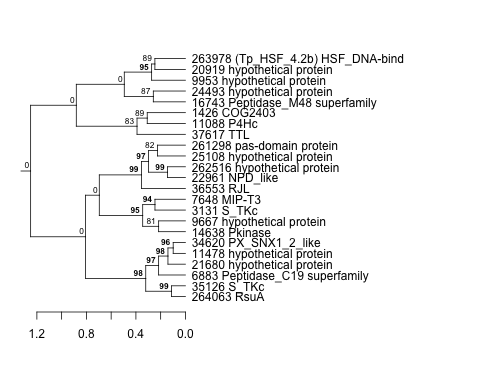 |
10 |
0.0026 |
160 |
exponential_vs_stationary_24highlight | 0.000926 | -0.32 |
| Title | Cluster Plot | Dendrogram | e-value | e-value | e-value | Condition | Condition FDR | Condition Difference |
|---|---|---|---|---|---|---|---|---|
| Thaps_hclust_0486 |
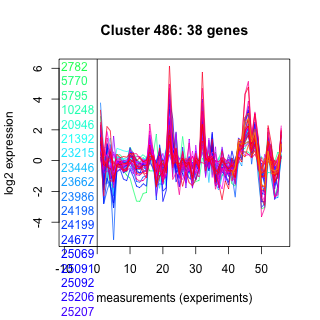 |
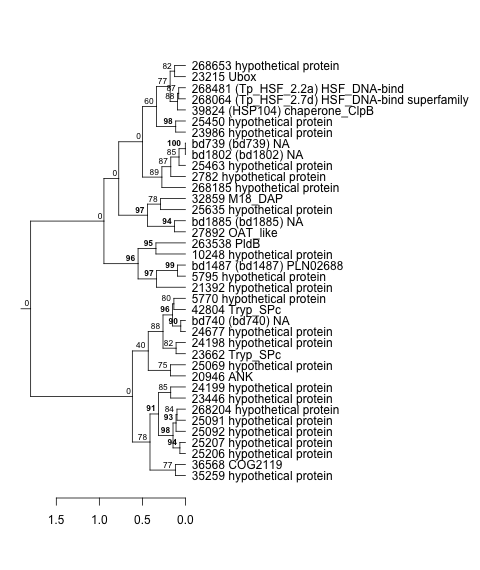 |
0.000000043 |
0.044 |
0.047 |
exponential_vs_stationary_24highlight | 0.000526 | -0.32 |
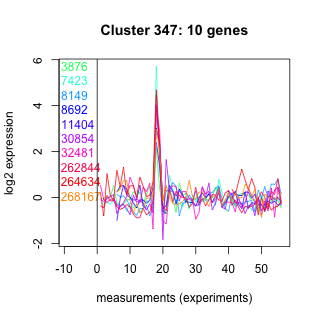
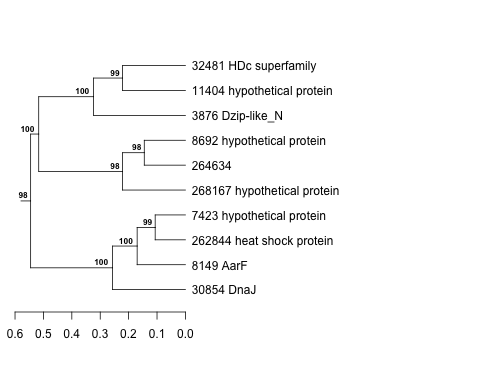
| Title | Cluster Plot | Dendrogram | e-value | e-value | e-value | Condition | Condition FDR | Condition Difference |
|---|---|---|---|---|---|---|---|---|
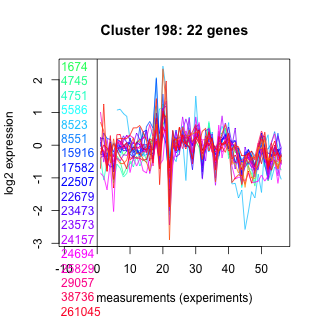
| Thaps_hclust_0198 |
 |
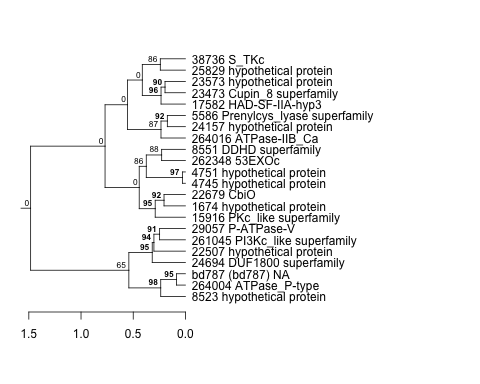 |
0.00091 |
0.017 |
0.0046 |
diel_exponential_vs_stationary | 0.047900 | -0.32 |
| Title | Cluster Plot | Dendrogram | e-value | e-value | e-value | Condition | Condition FDR | Condition Difference |
|---|---|---|---|---|---|---|---|---|
| Thaps_hclust_0032 |
 |
 |
1.3e-16 |
0.00000035 |
0.00012 |
lowFe_TMEVA | 0.181000 | -0.32 |
| Title | Cluster Plot | Dendrogram | e-value | e-value | e-value | Condition | Condition FDR | Condition Difference |
|---|---|---|---|---|---|---|---|---|
| Thaps_hclust_0107 |
 |
 |
0.00000004 |
0.000000023 |
0.0054 |
lowFe_KTKB_Day3 | 0.073600 | -0.32 |
| Title | Cluster Plot | Dendrogram | e-value | e-value | e-value | Condition | Condition FDR | Condition Difference |
|---|---|---|---|---|---|---|---|---|
| Thaps_hclust_0136 |
 |
 |
0.0034 |
0.034 |
340 |
BaP | 0.074400 | -0.319 |
| Title | Cluster Plot | Dendrogram | e-value | e-value | e-value | Condition | Condition FDR | Condition Difference |
|---|---|---|---|---|---|---|---|---|
| Thaps_hclust_0027 |
 |
 |
0.0000000084 |
0.0086 |
0.069 |
highpH_TMEVA | 0.023100 | -0.319 |
| Title | Cluster Plot | Dendrogram | e-value | e-value | e-value | Condition | Condition FDR | Condition Difference |
|---|---|---|---|---|---|---|---|---|
| Thaps_hclust_0384 |
 |
 |
0.0000000074 |
0.000000031 |
0.12 |
highlight_arrays | 0.005170 | -0.319 |
| Title | Cluster Plot | Dendrogram | e-value | e-value | e-value | Condition | Condition FDR | Condition Difference |
|---|---|---|---|---|---|---|---|---|
| Thaps_hclust_0096 |
 |
 |
0.0000028 |
0.9 |
0.38 |
BaP | 0.061500 | -0.319 |
| Title | Cluster Plot | Dendrogram | e-value | e-value | e-value | Condition | Condition FDR | Condition Difference |
|---|---|---|---|---|---|---|---|---|
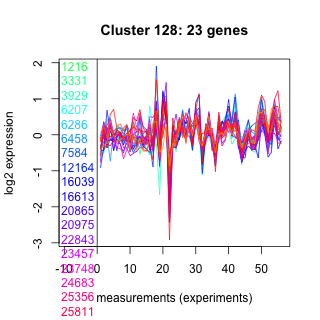
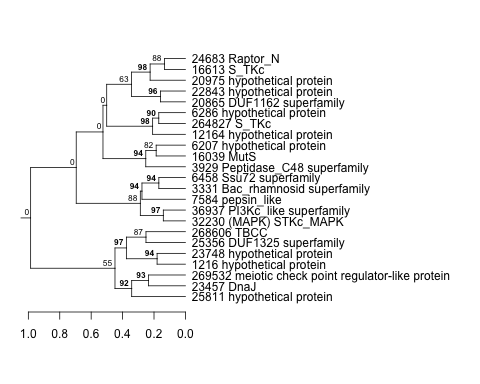
| Thaps_hclust_0128 |
 |
 |
0.0000000058 |
0.00033 |
21 |
highpH_TMEVA | 0.030300 | -0.319 |
| Title | Cluster Plot | Dendrogram | e-value | e-value | e-value | Condition | Condition FDR | Condition Difference |
|---|---|---|---|---|---|---|---|---|
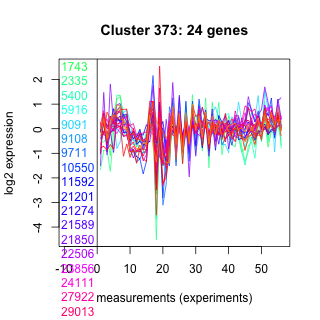
| Thaps_hclust_0373 |
 |
 |
0.00017 |
0.001 |
0.066 |
highlight_arrays | 0.026700 | -0.319 |
| Title | Cluster Plot | Dendrogram | e-value | e-value | e-value | Condition | Condition FDR | Condition Difference |
|---|---|---|---|---|---|---|---|---|
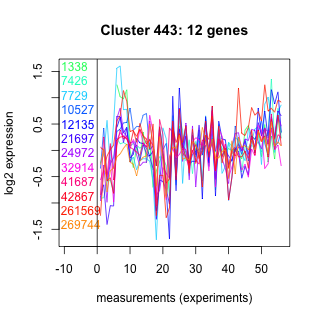
| Thaps_hclust_0443 |
 |
 |
0.96 |
9.8 |
42 |
highlight_arrays | 0.108000 | -0.319 |
| Title | Cluster Plot | Dendrogram | e-value | e-value | e-value | Condition | Condition FDR | Condition Difference |
|---|---|---|---|---|---|---|---|---|
| Thaps_hclust_0051 |
 |
 |
0.012 |
0.033 |
0.41 |
highlight_arrays | 0.108000 | -0.318 |
| Title | Cluster Plot | Dendrogram | e-value | e-value | e-value | Condition | Condition FDR | Condition Difference |
|---|---|---|---|---|---|---|---|---|
| Thaps_hclust_0499 |
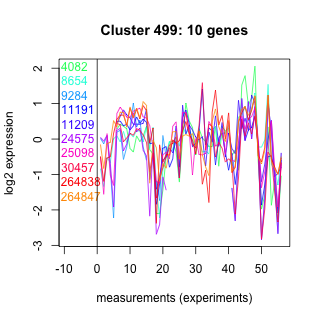 |
 |
0.13 |
5.4 |
18 |
highpH_TMEVA | 0.145000 | -0.318 |
| Title | Cluster Plot | Dendrogram | e-value | e-value | e-value | Condition | Condition FDR | Condition Difference |
|---|---|---|---|---|---|---|---|---|
| Thaps_hclust_0152 |
 |
 |
0.00015 |
0.00023 |
0.031 |
exponential_vs_stationary_24highlight | 0.040300 | -0.318 |
| Title | Cluster Plot | Dendrogram | e-value | e-value | e-value | Condition | Condition FDR | Condition Difference |
|---|---|---|---|---|---|---|---|---|
| Thaps_hclust_0269 |
 |
 |
0.0025 |
0.032 |
0.077 |
diel_light_vs_dark | 0.097300 | -0.318 |
| Title | Cluster Plot | Dendrogram | e-value | e-value | e-value | Condition | Condition FDR | Condition Difference |
|---|---|---|---|---|---|---|---|---|
| Thaps_hclust_0160 |
 |
 |
0.35 |
66 |
160 |
lowFe_KTKB_Day3 | 0.315000 | -0.317 |
| Title | Cluster Plot | Dendrogram | e-value | e-value | e-value | Condition | Condition FDR | Condition Difference |
|---|---|---|---|---|---|---|---|---|
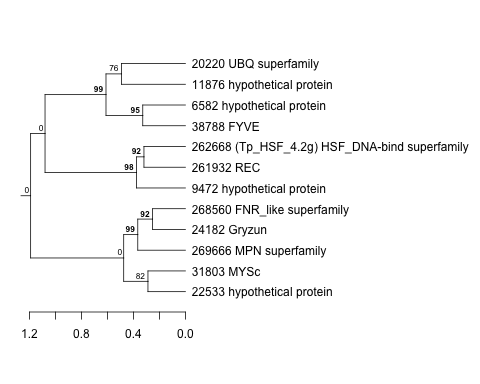
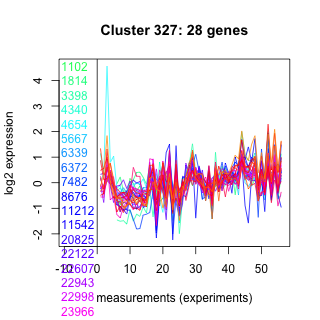
| Thaps_hclust_0327 |
 |
 |
0.0000000037 |
0.013 |
3.8 |
diel_light_vs_dark | 0.054800 | -0.316 |
| Title | Cluster Plot | Dendrogram | e-value | e-value | e-value | Condition | Condition FDR | Condition Difference |
|---|---|---|---|---|---|---|---|---|
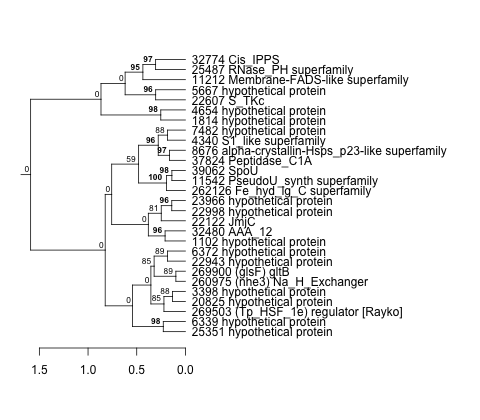
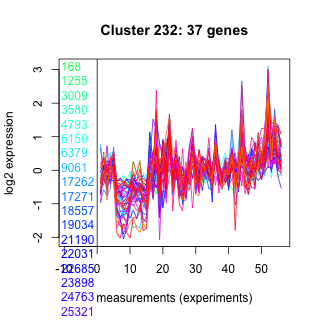
| Thaps_hclust_0232 |
 |
 |
9.2e-16 |
0.000000000000019 |
0.35 |
highpH_TMEVA | 0.005910 | -0.315 |
| Title | Cluster Plot | Dendrogram | e-value | e-value | e-value | Condition | Condition FDR | Condition Difference |
|---|---|---|---|---|---|---|---|---|
| Thaps_hclust_0485 |
 |
 |
0.0012 |
0.0078 |
0.16 |
co2_elevated_expo_arrays | 0.001390 | -0.314 |
| Title | Cluster Plot | Dendrogram | e-value | e-value | e-value | Condition | Condition FDR | Condition Difference |
|---|---|---|---|---|---|---|---|---|
| Thaps_hclust_0178 |
 |
 |
0.0000000019 |
0.00000047 |
0.000019 |
lowN_TMEVA | 0.384000 | -0.314 |
| Title | Cluster Plot | Dendrogram | e-value | e-value | e-value | Condition | Condition FDR | Condition Difference |
|---|---|---|---|---|---|---|---|---|
| Thaps_hclust_0362 |
 |
 |
0.00003 |
0.0033 |
0.66 |
exponential_vs_stationary_24highlight | 0.001300 | -0.314 |
| Title | Cluster Plot | Dendrogram | e-value | e-value | e-value | Condition | Condition FDR | Condition Difference |
|---|---|---|---|---|---|---|---|---|
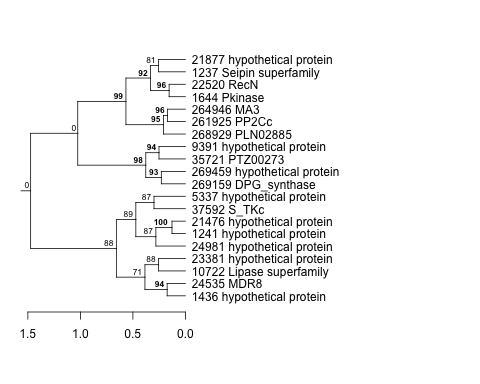
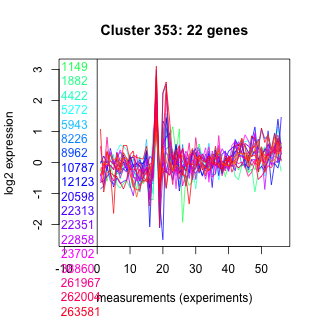
| Thaps_hclust_0353 |
 |
 |
0.076 |
1.5 |
0.87 |
lowtemp_TMEVA | 0.186000 | -0.313 |
| Thaps_hclust_0353 |
|
|
0.076 |
1.5 |
0.87 |
lowFe_TMEVA | 0.245000 | -0.313 |
| Title | Cluster Plot | Dendrogram | e-value | e-value | e-value | Condition | Condition FDR | Condition Difference |
|---|---|---|---|---|---|---|---|---|
| Thaps_hclust_0106 |
 |
 |
0.48 |
3.7 |
8.9 |
lowFe_KTKB_Day5 | 0.134000 | -0.313 |
| Title | Cluster Plot | Dendrogram | e-value | e-value | e-value | Condition | Condition FDR | Condition Difference |
|---|---|---|---|---|---|---|---|---|
| Thaps_hclust_0068 |
 |
 |
0.34 |
36 |
100 |
lowFe_TMEVA | 0.318000 | -0.313 |
| Title | Cluster Plot | Dendrogram | e-value | e-value | e-value | Condition | Condition FDR | Condition Difference |
|---|---|---|---|---|---|---|---|---|
| Thaps_hclust_0472 |
 |
 |
0.00000011 |
0.000015 |
0.00015 |
highpH_TMEVA | 0.049400 | -0.313 |
| Title | Cluster Plot | Dendrogram | e-value | e-value | e-value | Condition | Condition FDR | Condition Difference |
|---|---|---|---|---|---|---|---|---|
| Thaps_hclust_0357 |
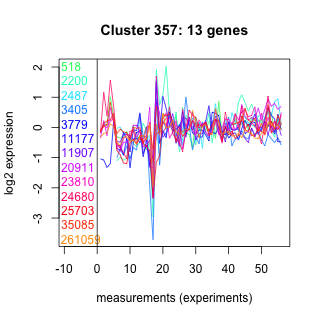 |
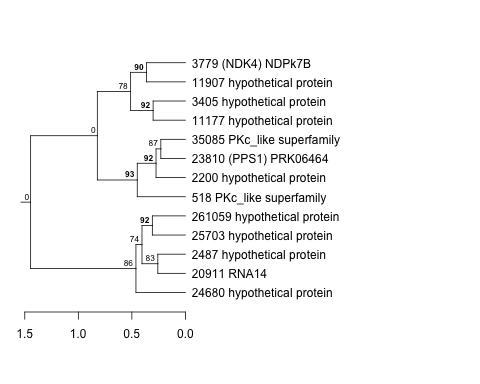 |
0.077 |
0.1 |
0.81 |
highpH_TMEVA | 0.107000 | -0.313 |
| Title | Cluster Plot | Dendrogram | e-value | e-value | e-value | Condition | Condition FDR | Condition Difference |
|---|---|---|---|---|---|---|---|---|
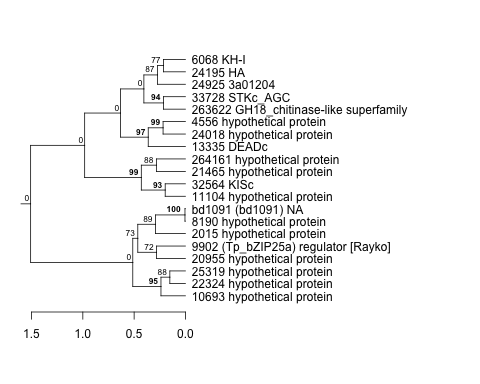
| Thaps_hclust_0114 |
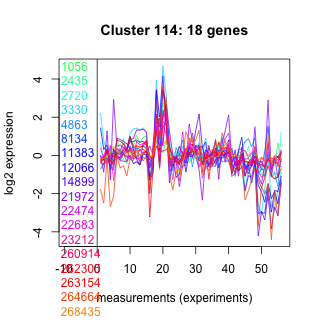 |
 |
0.086 |
4.8 |
3.2 |
exponential_vs_stationary_24highlight | 0.005770 | -0.312 |
| Thaps_hclust_0114 |
|
|
0.086 |
4.8 |
3.2 |
lowSi_TMEVA | 0.679000 | -0.307 |
| Title | Cluster Plot | Dendrogram | e-value | e-value | e-value | Condition | Condition FDR | Condition Difference |
|---|---|---|---|---|---|---|---|---|
| Thaps_hclust_0323 |
 |
 |
0.0011 |
0.014 |
36 |
exponential_vs_stationary_24light | 0.336000 | -0.311 |
| Title | Cluster Plot | Dendrogram | e-value | e-value | e-value | Condition | Condition FDR | Condition Difference |
|---|---|---|---|---|---|---|---|---|
| Thaps_hclust_0436 |
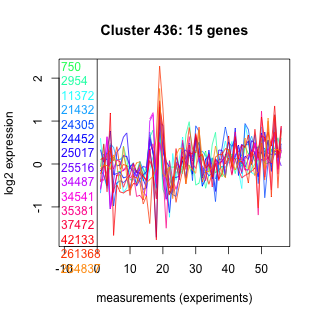 |
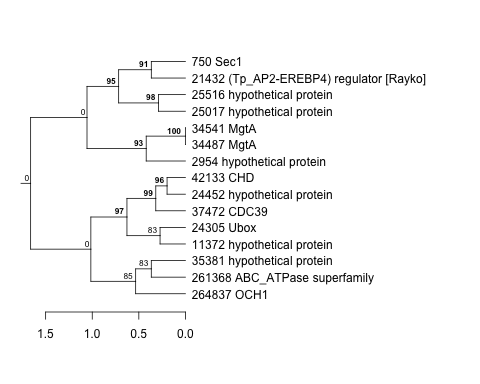 |
0.067 |
0.93 |
0.55 |
diel_exponential_vs_stationary | 0.124000 | -0.311 |
| Title | Cluster Plot | Dendrogram | e-value | e-value | e-value | Condition | Condition FDR | Condition Difference |
|---|---|---|---|---|---|---|---|---|
| Thaps_hclust_0467 |
 |
 |
0.000000000002 |
0.0000014 |
0.035 |
diel_light_vs_dark | 0.035800 | -0.311 |
| Title | Cluster Plot | Dendrogram | e-value | e-value | e-value | Condition | Condition FDR | Condition Difference |
|---|---|---|---|---|---|---|---|---|
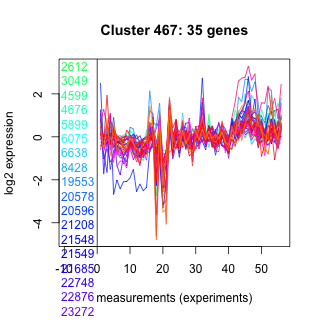
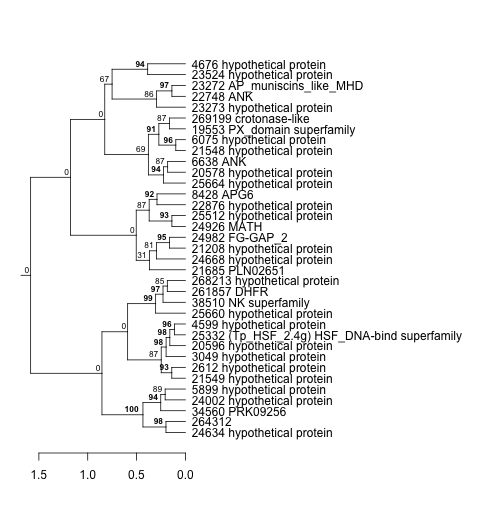
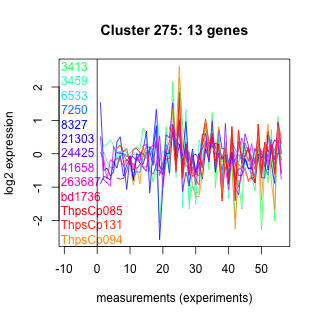
| Thaps_hclust_0275 |
 |
 |
Not available | Not available | Not available | lowFe_TMEVA | 0.331000 | -0.311 |
| Title | Cluster Plot | Dendrogram | e-value | e-value | e-value | Condition | Condition FDR | Condition Difference |
|---|---|---|---|---|---|---|---|---|
| Thaps_hclust_0328 |
 |
 |
0.00013 |
0.00001 |
0.46 |
exponential_vs_stationary_24highlight | 0.000926 | -0.31 |
| Title | Cluster Plot | Dendrogram | e-value | e-value | e-value | Condition | Condition FDR | Condition Difference |
|---|---|---|---|---|---|---|---|---|
| Thaps_hclust_0405 |
 |
 |
0.00000000036 |
0.0000000063 |
0.005 |
lowSi_TMEVA | 0.595000 | -0.31 |
| Title | Cluster Plot | Dendrogram | e-value | e-value | e-value | Condition | Condition FDR | Condition Difference |
|---|---|---|---|---|---|---|---|---|
| Thaps_hclust_0268 |
 |
 |
0.17 |
14 |
60 |
diel_exponential_vs_stationary | 0.096100 | -0.309 |
| Title | Cluster Plot | Dendrogram | e-value | e-value | e-value | Condition | Condition FDR | Condition Difference |
|---|---|---|---|---|---|---|---|---|
| Thaps_hclust_0103 |
 |
 |
3.4 |
4.8 |
21 |
co2_elevated_stat_arrays | 0.229000 | -0.309 |
| Thaps_hclust_0103 |
|
|
3.4 |
4.8 |
21 |
BaP | 0.239000 | -0.308 |
| Title | Cluster Plot | Dendrogram | e-value | e-value | e-value | Condition | Condition FDR | Condition Difference |
|---|---|---|---|---|---|---|---|---|
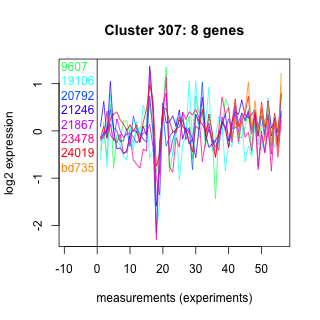
| Thaps_hclust_0307 |
 |
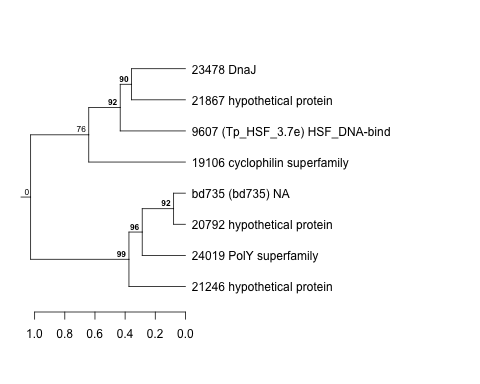 |
46 |
50 |
580 |
BaP | 0.383000 | -0.309 |
| Title | Cluster Plot | Dendrogram | e-value | e-value | e-value | Condition | Condition FDR | Condition Difference |
|---|---|---|---|---|---|---|---|---|
| Thaps_hclust_0052 |
 |
 |
1.4e-22 |
3.3e-19 |
0.0000000000037 |
highlight_arrays | 0.002540 | -0.308 |
| Title | Cluster Plot | Dendrogram | e-value | e-value | e-value | Condition | Condition FDR | Condition Difference |
|---|---|---|---|---|---|---|---|---|
| Thaps_hclust_0241 |
 |
 |
0.0000000022 |
0.0000017 |
0.68 |
diel_light_vs_dark | 0.048900 | -0.308 |
| Title | Cluster Plot | Dendrogram | e-value | e-value | e-value | Condition | Condition FDR | Condition Difference |
|---|---|---|---|---|---|---|---|---|
| Thaps_hclust_0374 |
 |
 |
1.4 |
19 |
50 |
BaP | 0.239000 | -0.308 |
| Title | Cluster Plot | Dendrogram | e-value | e-value | e-value | Condition | Condition FDR | Condition Difference |
|---|---|---|---|---|---|---|---|---|
| Thaps_hclust_0026 |
 |
 |
0.0021 |
0.16 |
0.32 |
lowtemp_TMEVA | 0.363000 | -0.308 |
| Title | Cluster Plot | Dendrogram | e-value | e-value | e-value | Condition | Condition FDR | Condition Difference |
|---|---|---|---|---|---|---|---|---|
| Thaps_hclust_0012 |
 |
 |
0.000000000019 |
0.0000000000016 |
0.0000013 |
diel_exponential_vs_stationary | 0.040200 | -0.308 |
| Title | Cluster Plot | Dendrogram | e-value | e-value | e-value | Condition | Condition FDR | Condition Difference |
|---|---|---|---|---|---|---|---|---|
| Thaps_hclust_0403 |
 |
 |
0.83 |
0.015 |
0.016 |
lowtemp_TMEVA | 0.250000 | -0.308 |
| Title | Cluster Plot | Dendrogram | e-value | e-value | e-value | Condition | Condition FDR | Condition Difference |
|---|---|---|---|---|---|---|---|---|
| Thaps_hclust_0245 |
 |
 |
0.52 |
100 |
150 |
highlight_arrays | 0.144000 | -0.308 |
| Title | Cluster Plot | Dendrogram | e-value | e-value | e-value | Condition | Condition FDR | Condition Difference |
|---|---|---|---|---|---|---|---|---|
| Thaps_hclust_0478 |
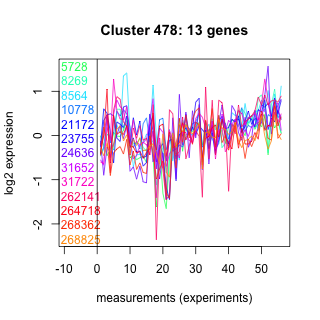 |
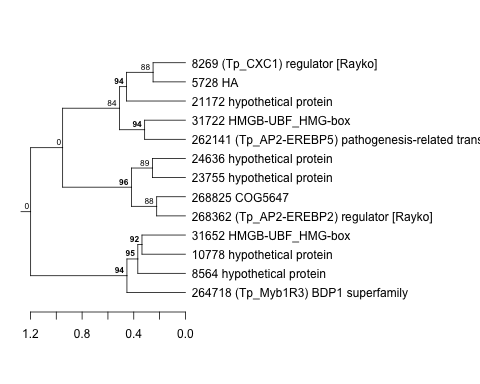 |
0.1 |
0.0096 |
3.5 |
lowSi_TMEVA | 0.707000 | -0.308 |
| Title | Cluster Plot | Dendrogram | e-value | e-value | e-value | Condition | Condition FDR | Condition Difference |
|---|---|---|---|---|---|---|---|---|
| Thaps_hclust_0047 |
 |
 |
3.4e-21 |
3.4e-17 |
5.5e-19 |
lowSi_TMEVA | 0.590000 | -0.307 |
| Title | Cluster Plot | Dendrogram | e-value | e-value | e-value | Condition | Condition FDR | Condition Difference |
|---|---|---|---|---|---|---|---|---|
| Thaps_hclust_0126 |
 |
 |
0.025 |
1.3 |
0.6 |
lowFe_KTKB_Day5 | 0.106000 | -0.307 |
| Title | Cluster Plot | Dendrogram | e-value | e-value | e-value | Condition | Condition FDR | Condition Difference |
|---|---|---|---|---|---|---|---|---|
| Thaps_hclust_0303 |
 |
 |
0.00096 |
0.0021 |
0.0014 |
highpH_TMEVA | 0.019600 | -0.306 |
| Title | Cluster Plot | Dendrogram | e-value | e-value | e-value | Condition | Condition FDR | Condition Difference |
|---|---|---|---|---|---|---|---|---|
| Thaps_hclust_0333 |
 |
 |
0.00062 |
4 |
17 |
exponential_vs_stationary_24highlight | 0.000926 | -0.306 |
| Title | Cluster Plot | Dendrogram | e-value | e-value | e-value | Condition | Condition FDR | Condition Difference |
|---|---|---|---|---|---|---|---|---|
| Thaps_hclust_0289 |
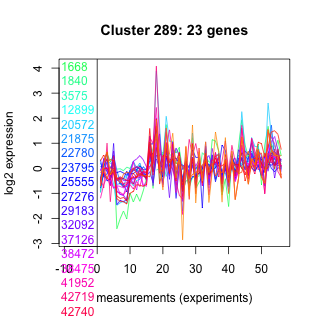 |
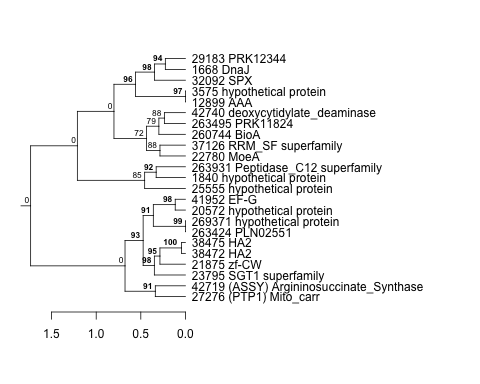 |
0.0000000000026 |
0.00000000000025 |
0.0000045 |
lowSi_TMEVA | 0.649000 | -0.306 |
| Title | Cluster Plot | Dendrogram | e-value | e-value | e-value | Condition | Condition FDR | Condition Difference |
|---|---|---|---|---|---|---|---|---|
| Thaps_hclust_0454 |
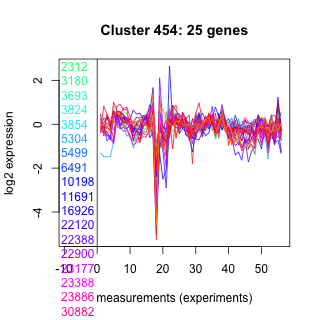 |
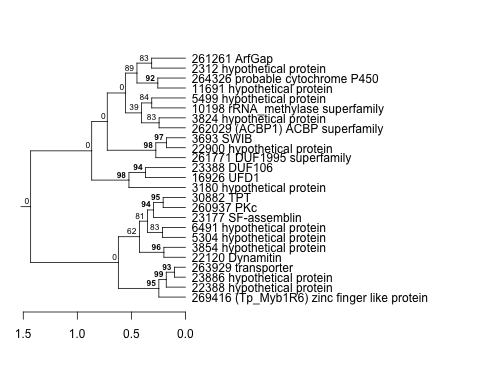 |
0.0000012 |
0.00054 |
0.21 |
lowSi_TMEVA | 0.643000 | -0.306 |
| Title | Cluster Plot | Dendrogram | e-value | e-value | e-value | Condition | Condition FDR | Condition Difference |
|---|---|---|---|---|---|---|---|---|
| Thaps_hclust_0250 |
 |
 |
0.38 |
88 |
290 |
highlight_arrays | 0.157000 | -0.306 |
| Title | Cluster Plot | Dendrogram | e-value | e-value | e-value | Condition | Condition FDR | Condition Difference |
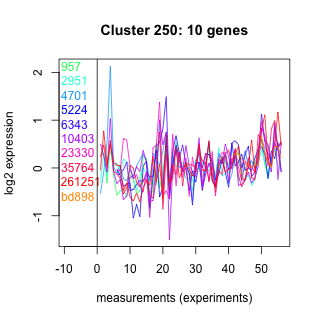
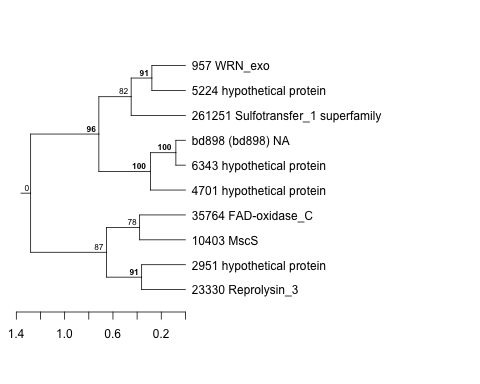
|---|---|---|---|---|---|---|---|---|
| Thaps_hclust_0311 |
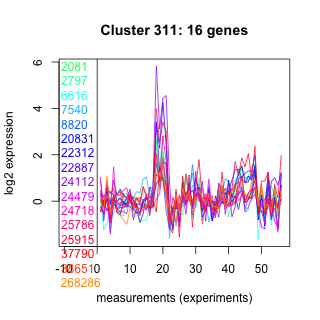 |
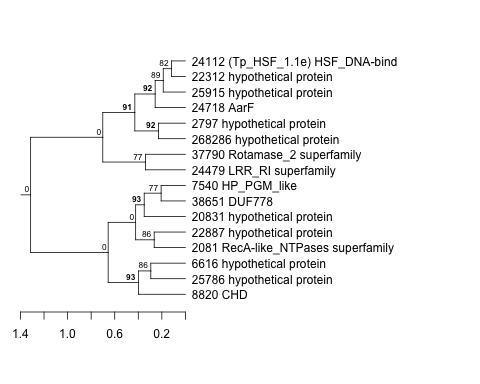 |
4.1 |
0.64 |
12 |
lowFe_TMEVA | 0.316000 | -0.306 |
| Title | Cluster Plot | Dendrogram | e-value | e-value | e-value | Condition | Condition FDR | Condition Difference |
|---|---|---|---|---|---|---|---|---|
| Thaps_hclust_0230 |
 |
|
|
1.1e-30 |
0.0000000000029 |
diel_light_vs_dark | 0.000485 | -0.306 |
| Title | Cluster Plot | Dendrogram | e-value | e-value | e-value | Condition | Condition FDR | Condition Difference |
|---|---|---|---|---|---|---|---|---|
| Thaps_hclust_0122 |
 |
 |
0.0000037 |
0.061 |
0.0018 |
lowFe_TMEVA | 0.212000 | -0.305 |
| Title | Cluster Plot | Dendrogram | e-value | e-value | e-value | Condition | Condition FDR | Condition Difference |
|---|---|---|---|---|---|---|---|---|
| Thaps_hclust_0310 |
 |
 |
4.9 |
19 |
86 |
lowFe_KTKB_Day3 | 0.412000 | -0.305 |
| Title | Cluster Plot | Dendrogram | e-value | e-value | e-value | Condition | Condition FDR | Condition Difference |
|---|---|---|---|---|---|---|---|---|
| Thaps_hclust_0347 |
 |
 |
1.2 |
0.85 |
91 |
lowFe_TMEVA | 0.402000 | -0.305 |
| Title | Cluster Plot | Dendrogram | e-value | e-value | e-value | Condition | Condition FDR | Condition Difference |
|---|---|---|---|---|---|---|---|---|
| Thaps_hclust_0423 |
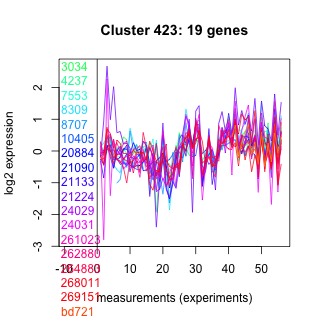 |
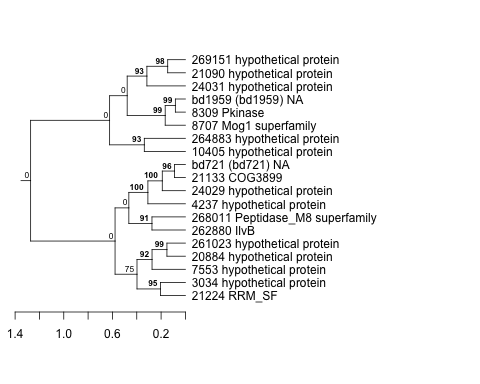 |
0.00046 |
0.13 |
9.2 |
lowFe_TMEVA | 0.285000 | -0.305 |
| Title | Cluster Plot | Dendrogram | e-value | e-value | e-value | Condition | Condition FDR | Condition Difference |
|---|---|---|---|---|---|---|---|---|
| Thaps_hclust_0104 |
 |
 |
23 |
24 |
220 |
lowN_TMEVA | 0.480000 | -0.305 |