Hierarchical Clusters
Displaying 1501 - 1600 of 7500
| Title | Cluster Plot | Dendrogram | e-value | e-value | e-value | Condition | Condition FDR | Condition Difference |
|---|---|---|---|---|---|---|---|---|
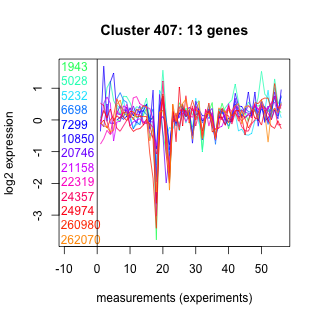
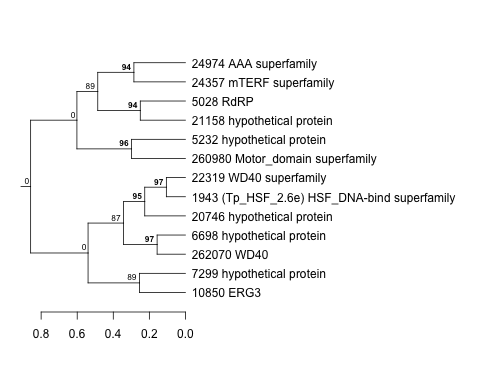
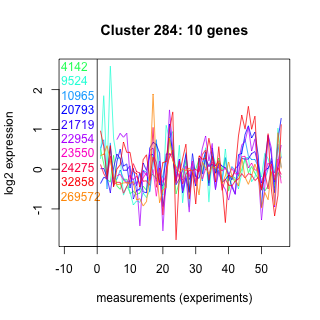
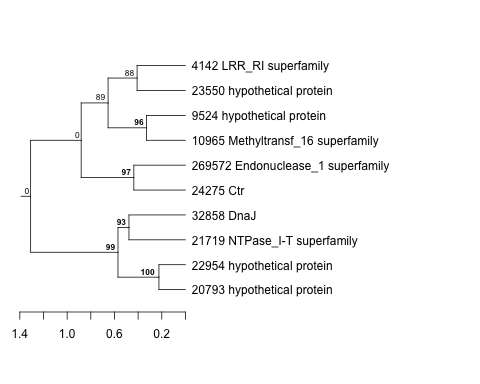
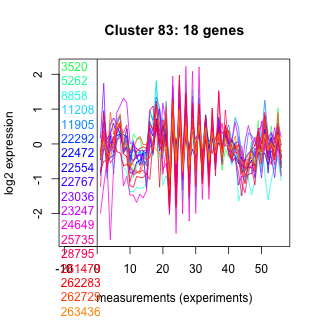
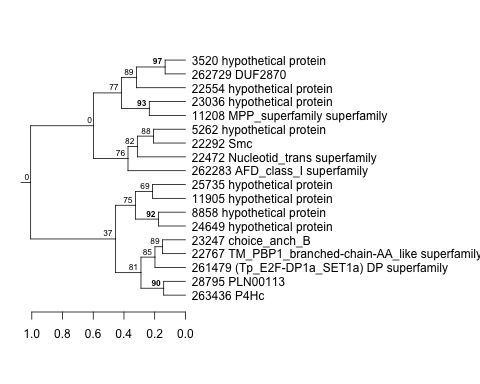
| Thaps_hclust_0407 |
 |
 |
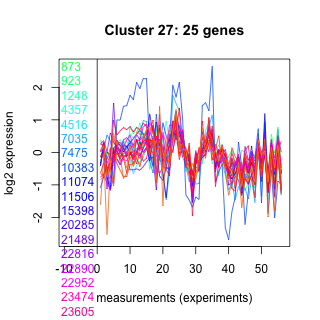
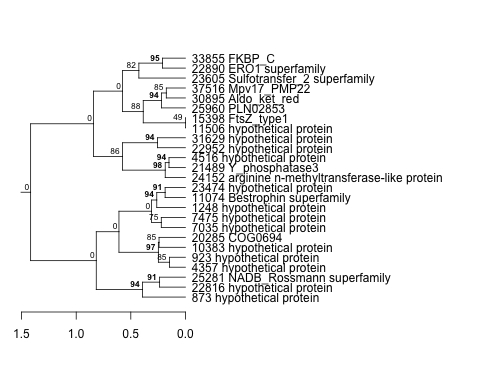
25 |
77 |
290 |
lowFe_TMEVA | 0.432000 | 0.249 |
| Thaps_hclust_0407 |
|
|
25 |
77 |
290 |
diel_light_vs_dark | 0.385000 | 0.239 |
| Title | Cluster Plot | Dendrogram | e-value | e-value | e-value | Condition | Condition FDR | Condition Difference |
|---|---|---|---|---|---|---|---|---|
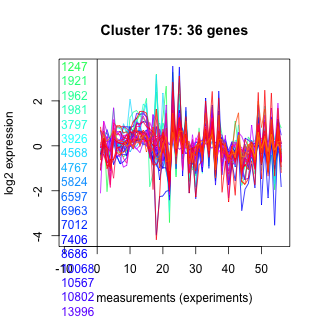
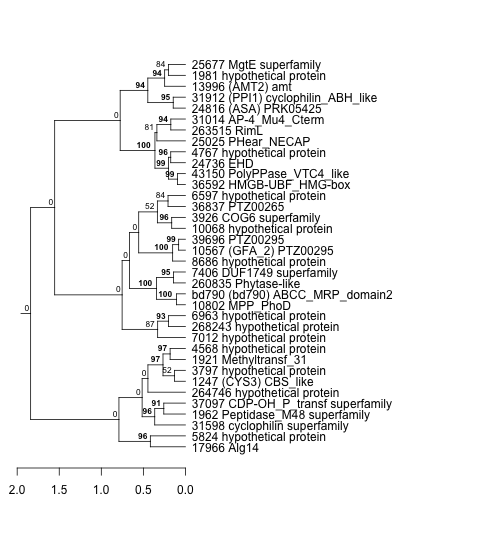
| Thaps_hclust_0175 |
 |
 |
0.00000000000027 |
0.0000042 |
0.58 |
lowFe_TMEVA | 0.285000 | 0.249 |
| Title | Cluster Plot | Dendrogram | e-value | e-value | e-value | Condition | Condition FDR | Condition Difference |
|---|---|---|---|---|---|---|---|---|
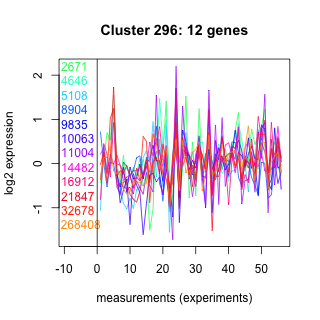
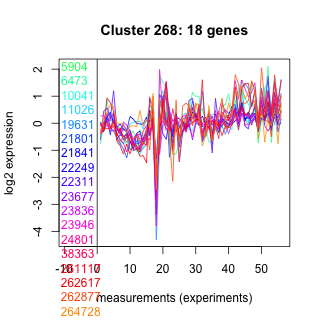
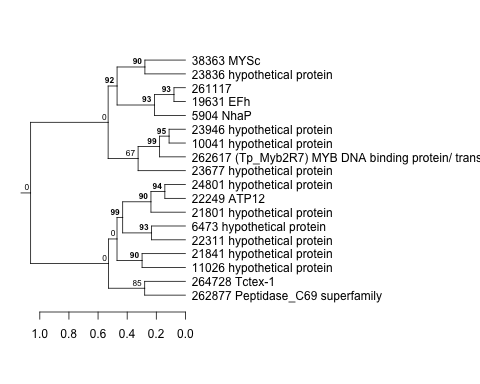
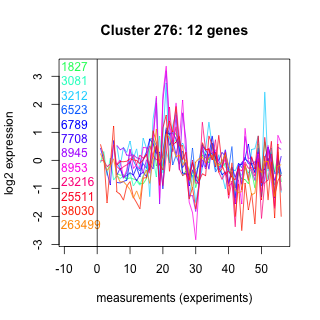
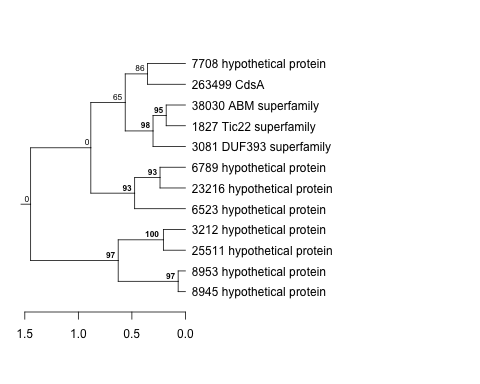
| Thaps_hclust_0296 |
 |
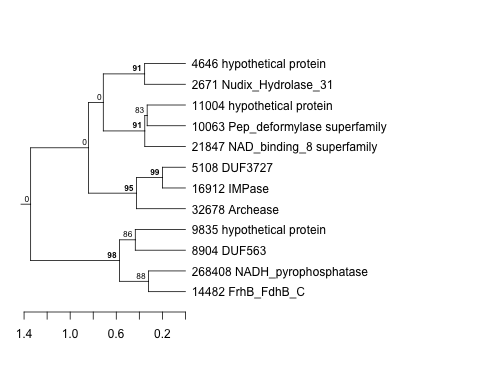 |
0.17 |
1.8 |
0.83 |
lowFe_TMEVA | 0.457000 | 0.248 |
| Thaps_hclust_0296 |
|
|
0.17 |
1.8 |
0.83 |
exponential_vs_stationary_24highlight | 0.077000 | 0.247 |
| Thaps_hclust_0296 |
|
|
0.17 |
1.8 |
0.83 |
lowSi_TMEVA | 0.838000 | 0.235 |
| Title | Cluster Plot | Dendrogram | e-value | e-value | e-value | Condition | Condition FDR | Condition Difference |
|---|---|---|---|---|---|---|---|---|
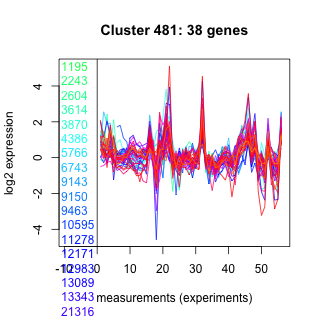
| Thaps_hclust_0481 |
 |
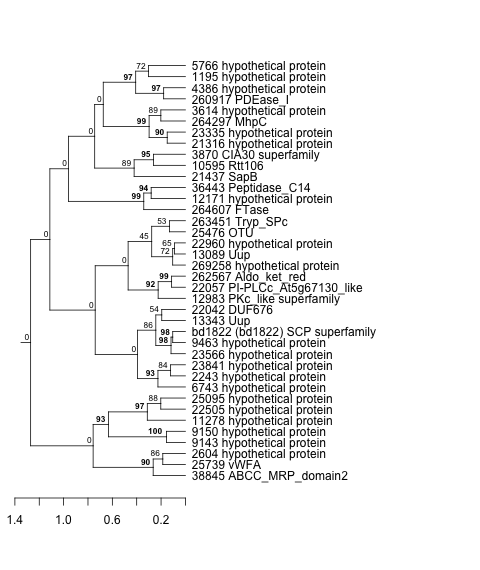 |
0.000000069 |
0.00000053 |
0.000012 |
lowFe_KTKB_Day5 | 0.090100 | 0.248 |
| Title | Cluster Plot | Dendrogram | e-value | e-value | e-value | Condition | Condition FDR | Condition Difference |
|---|---|---|---|---|---|---|---|---|
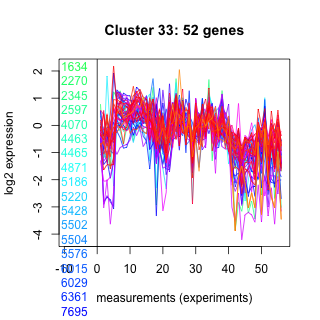
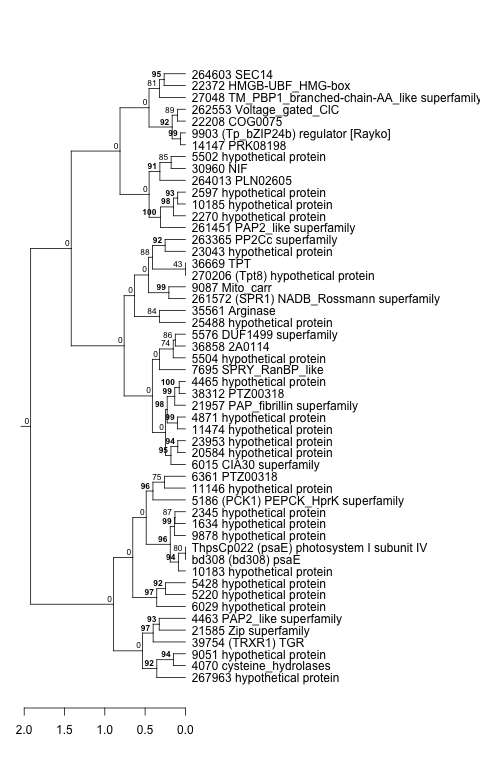
| Thaps_hclust_0052 |
 |
 |
1.4e-22 |
3.3e-19 |
0.0000000000037 |
exponential_vs_stationary_24highlight | 0.000526 | 0.247 |
| Title | Cluster Plot | Dendrogram | e-value | e-value | e-value | Condition | Condition FDR | Condition Difference |
|---|---|---|---|---|---|---|---|---|
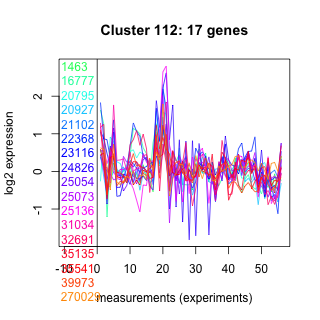
| Thaps_hclust_0116 |
 |
 |
0.74 |
8.1 |
4.9 |
co2_elevated_stat_arrays | 0.320000 | 0.247 |
| Title | Cluster Plot | Dendrogram | e-value | e-value | e-value | Condition | Condition FDR | Condition Difference |
|---|---|---|---|---|---|---|---|---|
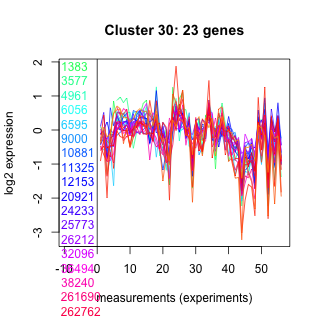
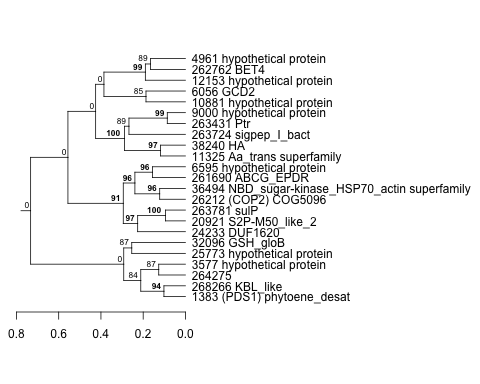
| Thaps_hclust_0329 |
 |
 |
0.0000000004 |
0.00000034 |
0.000023 |
lowN_TMEVA | 0.416000 | 0.246 |
| Title | Cluster Plot | Dendrogram | e-value | e-value | e-value | Condition | Condition FDR | Condition Difference |
|---|---|---|---|---|---|---|---|---|
| Thaps_hclust_0308 |
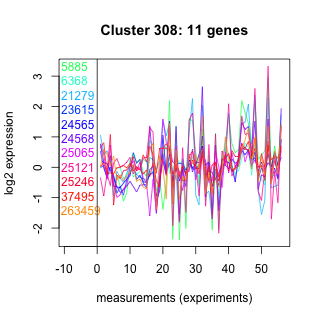 |
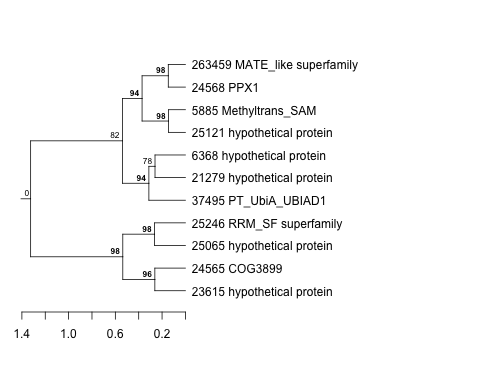 |
0.37 |
17 |
1.6 |
lowFe_KTKB_Day3 | 0.458000 | 0.246 |
| Title | Cluster Plot | Dendrogram | e-value | e-value | e-value | Condition | Condition FDR | Condition Difference |
|---|---|---|---|---|---|---|---|---|
| Thaps_hclust_0384 |
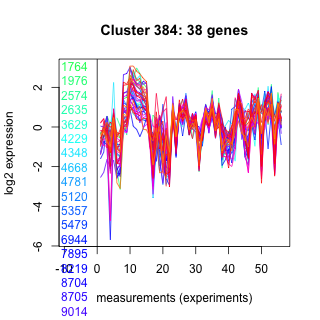 |
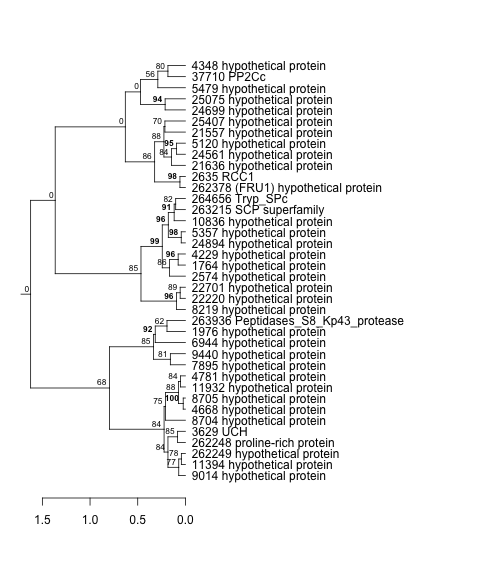 |
0.0000000074 |
0.000000031 |
0.12 |
lowtemp_TMEVA | 0.186000 | 0.246 |
| Title | Cluster Plot | Dendrogram | e-value | e-value | e-value | Condition | Condition FDR | Condition Difference |
|---|---|---|---|---|---|---|---|---|
| Thaps_hclust_0288 |
 |
 |
0.032 |
0.0067 |
0.047 |
co2_elevated_stat_arrays | 0.332000 | 0.246 |
| Title | Cluster Plot | Dendrogram | e-value | e-value | e-value | Condition | Condition FDR | Condition Difference |
|---|---|---|---|---|---|---|---|---|
| Thaps_hclust_0194 |
 |
 |
0.27 |
0.6 |
1.5 |
diel_light_vs_dark | 0.280000 | 0.245 |
| Thaps_hclust_0194 |
|
|
0.27 |
0.6 |
1.5 |
lowSi_TMEVA | 0.814000 | 0.245 |
| Title | Cluster Plot | Dendrogram | e-value | e-value | e-value | Condition | Condition FDR | Condition Difference |
|---|---|---|---|---|---|---|---|---|
| Thaps_hclust_0022 |
 |
|
1.9e-31 |
2.4e-22 |
6.4e-20 |
lowFe_KTKB_Day3 | 0.049500 | 0.245 |
| Title | Cluster Plot | Dendrogram | e-value | e-value | e-value | Condition | Condition FDR | Condition Difference |
|---|---|---|---|---|---|---|---|---|
| Thaps_hclust_0102 |
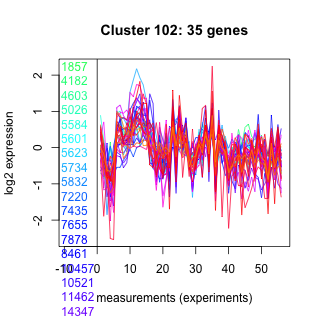 |
 |
3.2e-16 |
0.00000000002 |
0.0000006 |
exponential_vs_stationary_24highlight | 0.001300 | 0.245 |
| Title | Cluster Plot | Dendrogram | e-value | e-value | e-value | Condition | Condition FDR | Condition Difference |
|---|---|---|---|---|---|---|---|---|
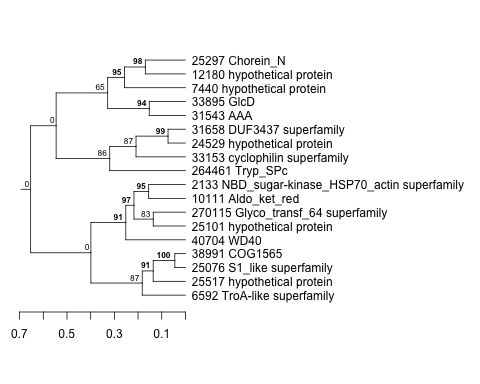
| Thaps_hclust_0371 |
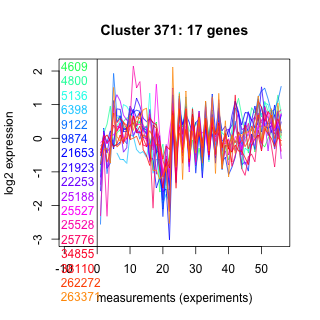 |
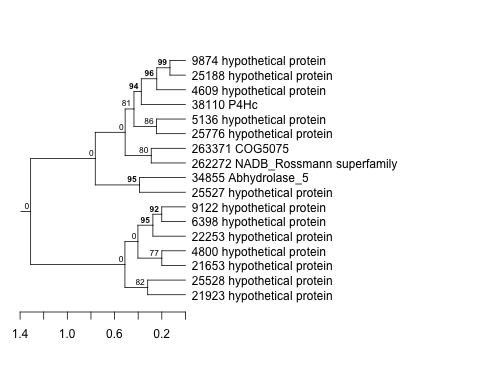 |
0.0051 |
0.11 |
1.1 |
exponential_vs_stationary_24light | 0.515000 | 0.245 |
| Title | Cluster Plot | Dendrogram | e-value | e-value | e-value | Condition | Condition FDR | Condition Difference |
|---|---|---|---|---|---|---|---|---|
| Thaps_hclust_0469 |
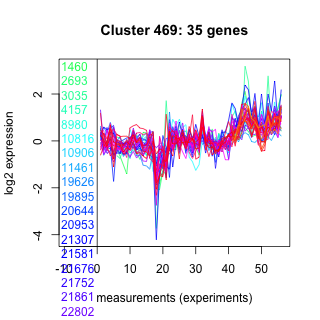 |
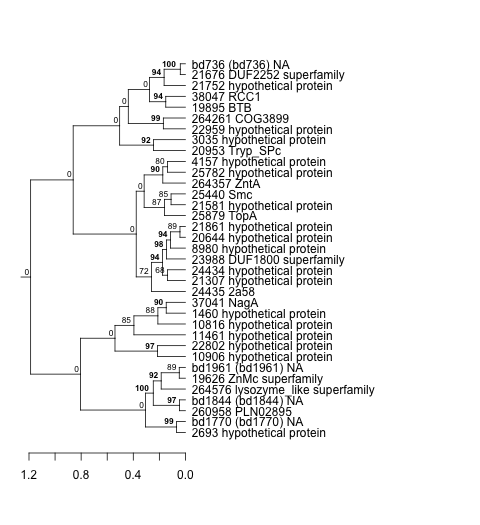 |
0.000013 |
0.00011 |
0.00029 |
co2_elevated_stat_arrays | 0.199000 | 0.245 |
| Title | Cluster Plot | Dendrogram | e-value | e-value | e-value | Condition | Condition FDR | Condition Difference |
|---|---|---|---|---|---|---|---|---|
| Thaps_hclust_0351 |
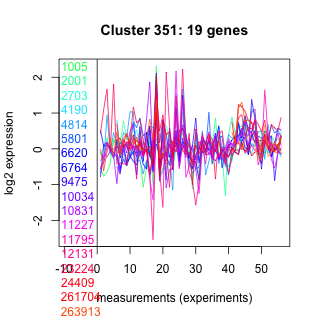 |
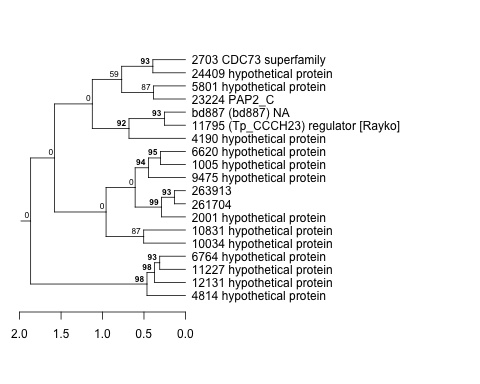 |
0.033 |
0.06 |
50 |
lowN_TMEVA | 0.501000 | 0.245 |
| Thaps_hclust_0351 |
|
|
0.033 |
0.06 |
50 |
BaP | 0.302000 | 0.237 |
| Title | Cluster Plot | Dendrogram | e-value | e-value | e-value | Condition | Condition FDR | Condition Difference |
|---|---|---|---|---|---|---|---|---|
| Thaps_hclust_0182 |
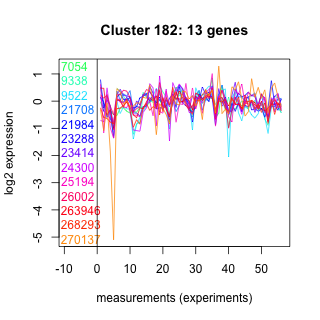 |
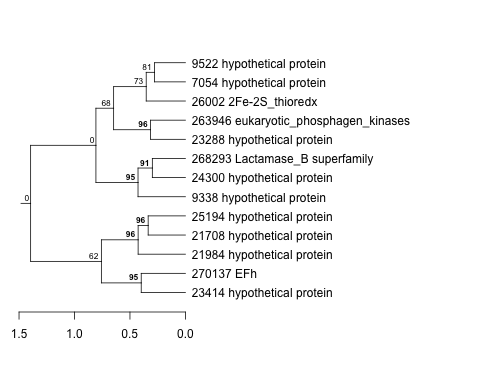 |
0.13 |
130 |
0.14 |
diel_light_vs_dark | 0.368000 | 0.245 |
| Title | Cluster Plot | Dendrogram | e-value | e-value | e-value | Condition | Condition FDR | Condition Difference |
|---|---|---|---|---|---|---|---|---|
| Thaps_hclust_0006 |
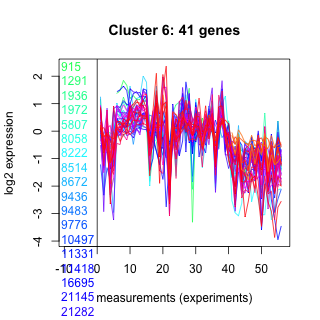 |
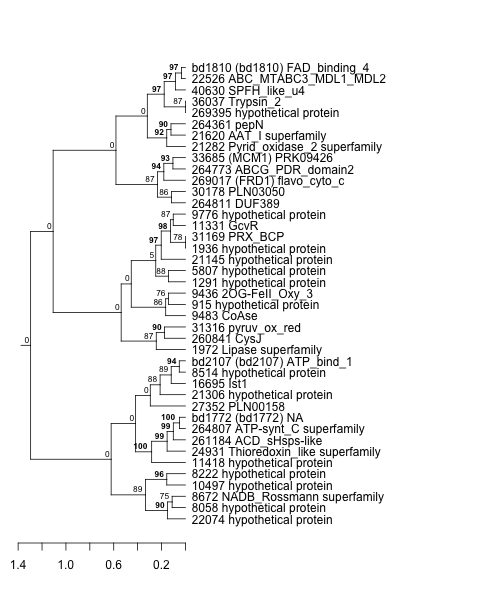 |
0.0000000000025 |
0.000000092 |
0.000086 |
highpH_TMEVA | 0.027300 | 0.245 |
| Title | Cluster Plot | Dendrogram | e-value | e-value | e-value | Condition | Condition FDR | Condition Difference |
|---|---|---|---|---|---|---|---|---|
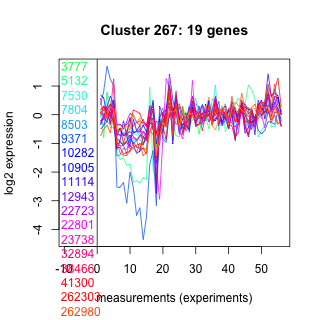
| Thaps_hclust_0267 |
 |
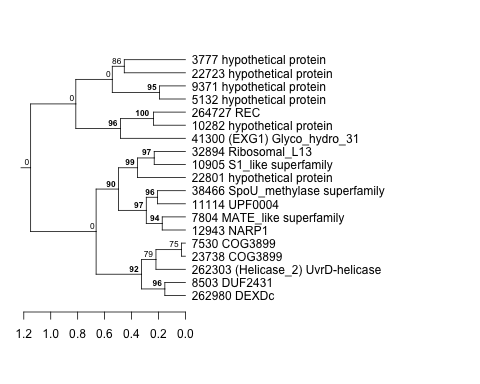 |
0.00000003 |
0.39 |
0.58 |
lowtemp_TMEVA | 0.361000 | 0.244 |
| Title | Cluster Plot | Dendrogram | e-value | e-value | e-value | Condition | Condition FDR | Condition Difference |
|---|---|---|---|---|---|---|---|---|
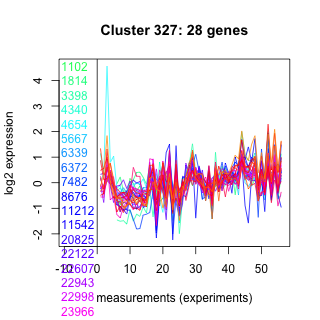
| Thaps_hclust_0327 |
 |
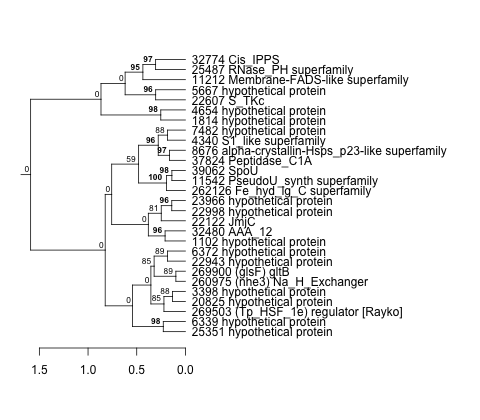 |
0.0000000037 |
0.013 |
3.8 |
highlight_arrays | 0.066100 | 0.244 |
| Thaps_hclust_0327 |
|
|
0.0000000037 |
0.013 |
3.8 |
lowSi_TMEVA | 0.824000 | 0.231 |
| Title | Cluster Plot | Dendrogram | e-value | e-value | e-value | Condition | Condition FDR | Condition Difference |
|---|---|---|---|---|---|---|---|---|
| Thaps_hclust_0067 |
 |
 |
0.0036 |
0.86 |
0.11 |
lowtemp_TMEVA | 0.399000 | 0.244 |
| Title | Cluster Plot | Dendrogram | e-value | e-value | e-value | Condition | Condition FDR | Condition Difference |
|---|---|---|---|---|---|---|---|---|
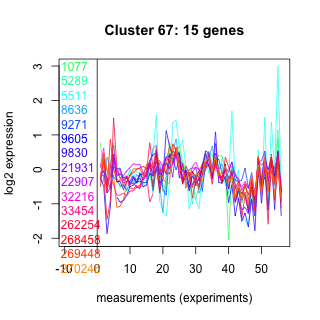
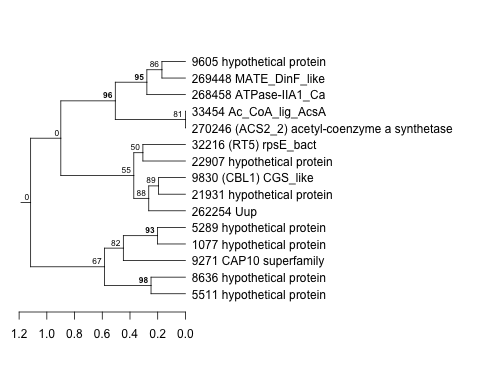
| Thaps_hclust_0222 |
 |
 |
0.0000000000016 |
0.000000011 |
0.0008 |
lowFe_KTKB_Day3 | 0.200000 | 0.244 |
| Title | Cluster Plot | Dendrogram | e-value | e-value | e-value | Condition | Condition FDR | Condition Difference |
|---|---|---|---|---|---|---|---|---|
| Thaps_hclust_0021 |
 |
 |
0.00000000002 |
0.0000088 |
0.0012 |
co2_elevated_expo_arrays | 0.012300 | 0.244 |
| Thaps_hclust_0021 |
|
|
0.00000000002 |
0.0000088 |
0.0012 |
lowFe_KTKB_Day5 | 0.101000 | 0.239 |
| Title | Cluster Plot | Dendrogram | e-value | e-value | e-value | Condition | Condition FDR | Condition Difference |
|---|---|---|---|---|---|---|---|---|
| Thaps_hclust_0115 |
 |
 |
0.00037 |
0.044 |
0.46 |
lowN_TMEVA | 0.479000 | 0.243 |
| Title | Cluster Plot | Dendrogram | e-value | e-value | e-value | Condition | Condition FDR | Condition Difference |
|---|---|---|---|---|---|---|---|---|
| Thaps_hclust_0485 |
 |
 |
0.0012 |
0.0078 |
0.16 |
lowFe_TMEVA | 0.232000 | 0.243 |
| Title | Cluster Plot | Dendrogram | e-value | e-value | e-value | Condition | Condition FDR | Condition Difference |
|---|---|---|---|---|---|---|---|---|
| Thaps_hclust_0207 |
 |
 |
0.0000000025 |
0.0000000037 |
0.1 |
diel_exponential_vs_stationary | 0.092100 | 0.243 |
| Title | Cluster Plot | Dendrogram | e-value | e-value | e-value | Condition | Condition FDR | Condition Difference |
|---|---|---|---|---|---|---|---|---|
| Thaps_hclust_0184 |
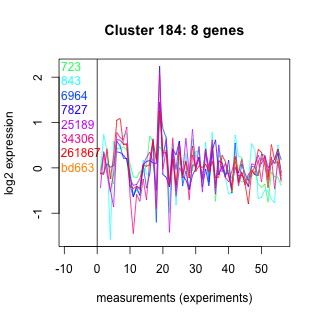 |
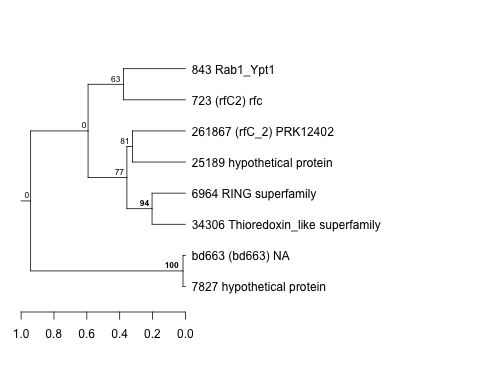 |
80 |
320 |
240 |
lowFe_TMEVA | 0.526000 | 0.243 |
| Title | Cluster Plot | Dendrogram | e-value | e-value | e-value | Condition | Condition FDR | Condition Difference |
|---|---|---|---|---|---|---|---|---|
| Thaps_hclust_0431 |
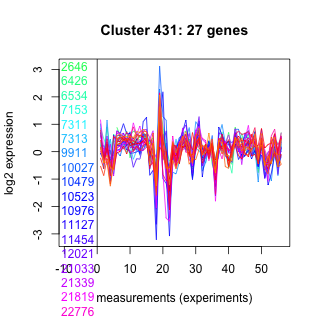 |
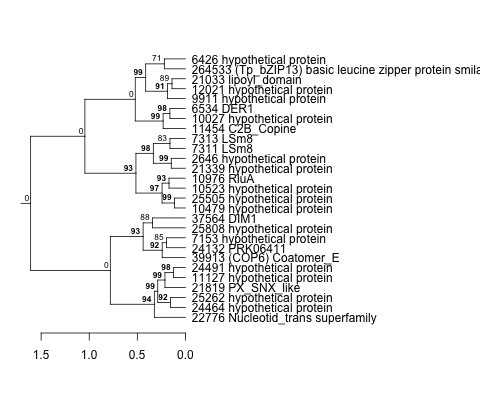 |
0.003 |
0.00095 |
0.0043 |
diel_light_vs_dark | 0.171000 | 0.243 |
| Title | Cluster Plot | Dendrogram | e-value | e-value | e-value | Condition | Condition FDR | Condition Difference |
|---|---|---|---|---|---|---|---|---|
| Thaps_hclust_0167 |
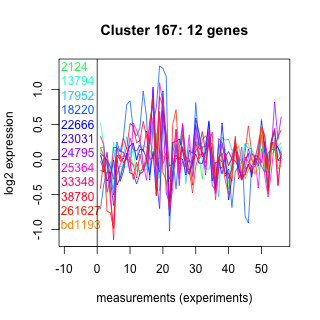 |
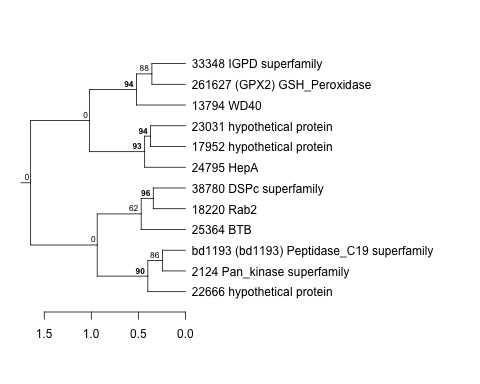 |
1 |
15 |
160 |
BaP | 0.398000 | 0.243 |
| Title | Cluster Plot | Dendrogram | e-value | e-value | e-value | Condition | Condition FDR | Condition Difference |
|---|---|---|---|---|---|---|---|---|
| Thaps_hclust_0030 |
 |
 |
0.000056 |
0.048 |
0.088 |
diel_exponential_vs_stationary | 0.141000 | 0.242 |
| Title | Cluster Plot | Dendrogram | e-value | e-value | e-value | Condition | Condition FDR | Condition Difference |
|---|---|---|---|---|---|---|---|---|
| Thaps_hclust_0162 |
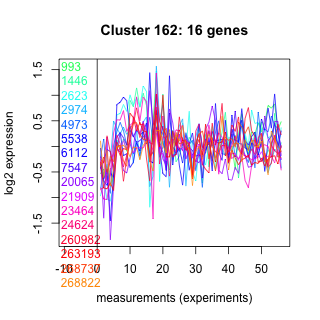 |
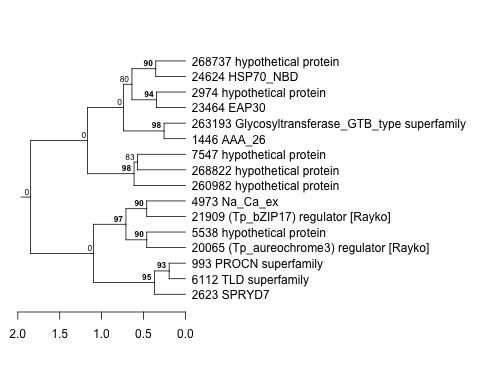 |
0.032 |
3.2 |
58 |
BaP | 0.338000 | 0.242 |
| Title | Cluster Plot | Dendrogram | e-value | e-value | e-value | Condition | Condition FDR | Condition Difference |
|---|---|---|---|---|---|---|---|---|
| Thaps_hclust_0225 |
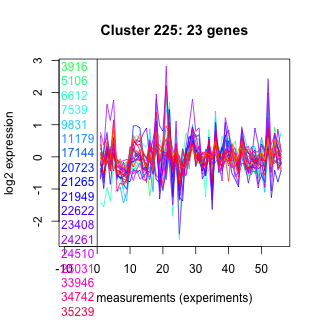 |
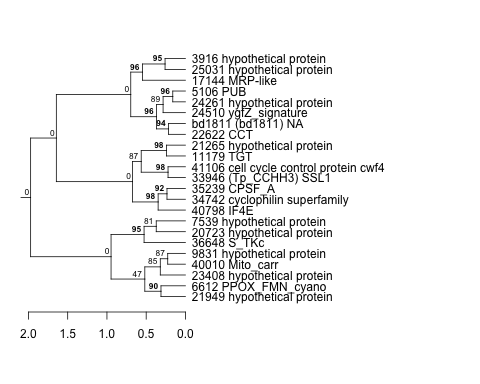 |
0.00000024 |
0.000003 |
0.0048 |
lowN_TMEVA | 0.485000 | 0.242 |
| Title | Cluster Plot | Dendrogram | e-value | e-value | e-value | Condition | Condition FDR | Condition Difference |
|---|---|---|---|---|---|---|---|---|
| Thaps_hclust_0177 |
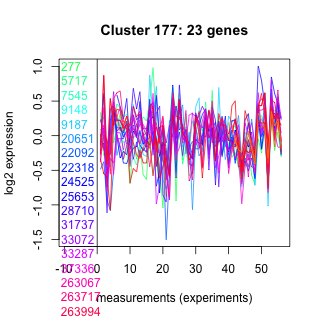 |
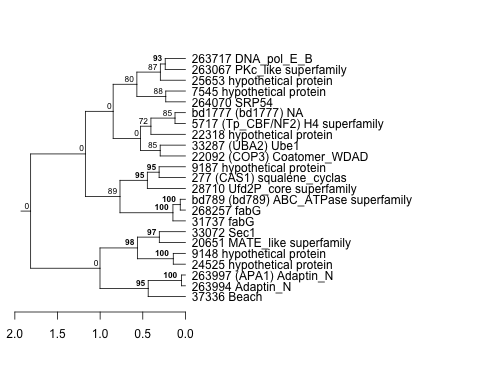 |
0.0000000012 |
0.0000078 |
0.00084 |
diel_light_vs_dark | 0.226000 | 0.242 |
| Title | Cluster Plot | Dendrogram | e-value | e-value | e-value | Condition | Condition FDR | Condition Difference |
|---|---|---|---|---|---|---|---|---|
| Thaps_hclust_0482 |
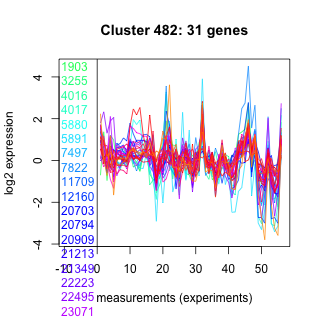 |
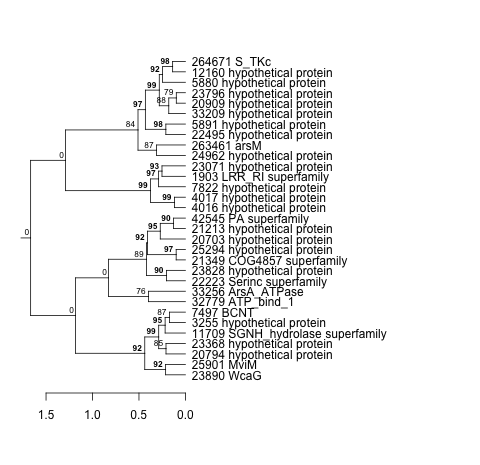 |
0.29 |
0.69 |
2.1 |
diel_exponential_vs_stationary | 0.083100 | 0.242 |
| Title | Cluster Plot | Dendrogram | e-value | e-value | e-value | Condition | Condition FDR | Condition Difference |
|---|---|---|---|---|---|---|---|---|
| Thaps_hclust_0284 |
 |
 |
0.0011 |
0.067 |
0.038 |
diel_exponential_vs_stationary | 0.352000 | 0.242 |
| Thaps_hclust_0284 |
|
|
0.0011 |
0.067 |
0.038 |
exponential_vs_stationary_24light | 0.621000 | 0.231 |
| Title | Cluster Plot | Dendrogram | e-value | e-value | e-value | Condition | Condition FDR | Condition Difference |
|---|---|---|---|---|---|---|---|---|
| Thaps_hclust_0056 |
 |
 |
0.0000000078 |
0.077 |
1 |
lowN_TMEVA | 0.505000 | 0.242 |
| Title | Cluster Plot | Dendrogram | e-value | e-value | e-value | Condition | Condition FDR | Condition Difference |
|---|---|---|---|---|---|---|---|---|
| Thaps_hclust_0396 |
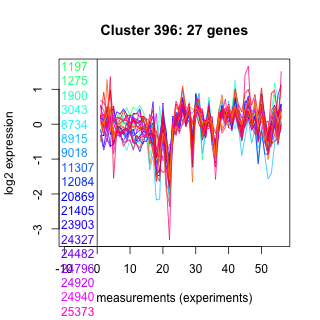 |
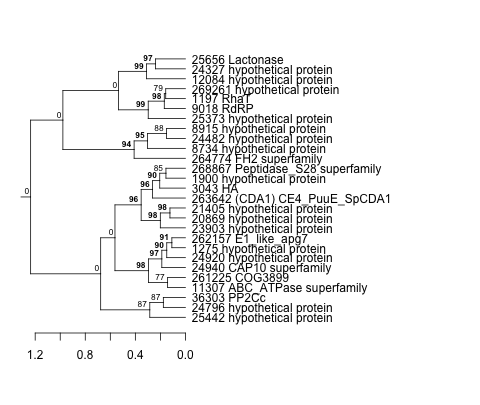 |
0.082 |
10 |
29 |
lowSi_TMEVA | 0.806000 | 0.241 |
| Thaps_hclust_0396 |
|
|
0.082 |
10 |
29 |
highlight_arrays | 0.095200 | 0.232 |
| Title | Cluster Plot | Dendrogram | e-value | e-value | e-value | Condition | Condition FDR | Condition Difference |
|---|---|---|---|---|---|---|---|---|
| Thaps_hclust_0129 |
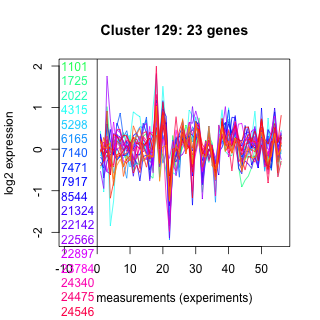 |
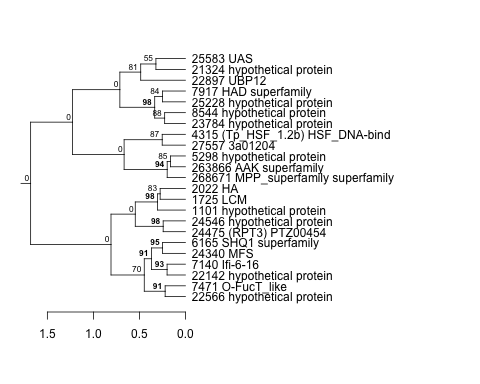 |
0.015 |
0.29 |
1 |
lowN_TMEVA | 0.486000 | 0.241 |
| Title | Cluster Plot | Dendrogram | e-value | e-value | e-value | Condition | Condition FDR | Condition Difference |
|---|---|---|---|---|---|---|---|---|
| Thaps_hclust_0154 |
 |
 |
0.00015 |
0.0049 |
0.29 |
exponential_vs_stationary_24highlight | 0.013600 | 0.241 |
| Title | Cluster Plot | Dendrogram | e-value | e-value | e-value | Condition | Condition FDR | Condition Difference |
|---|---|---|---|---|---|---|---|---|
| Thaps_hclust_0132 |
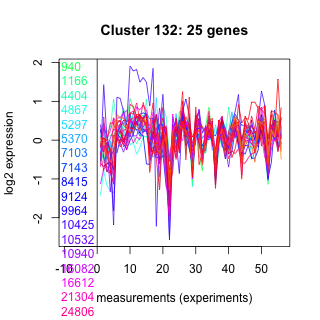 |
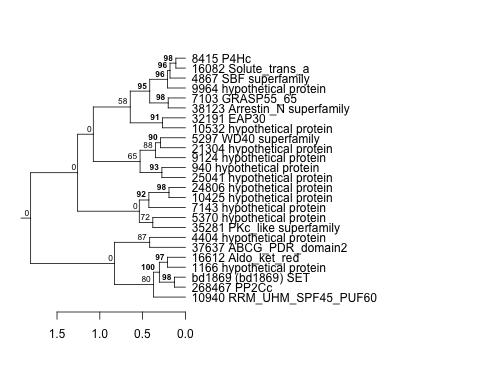 |
0.00017 |
0.000096 |
26 |
lowFe_KTKB_Day5 | 0.178000 | 0.241 |
| Title | Cluster Plot | Dendrogram | e-value | e-value | e-value | Condition | Condition FDR | Condition Difference |
|---|---|---|---|---|---|---|---|---|
| Thaps_hclust_0109 |
 |
 |
17 |
32 |
5.5 |
diel_light_vs_dark | 0.404000 | 0.241 |
| Title | Cluster Plot | Dendrogram | e-value | e-value | e-value | Condition | Condition FDR | Condition Difference |
|---|---|---|---|---|---|---|---|---|
| Thaps_hclust_0388 |
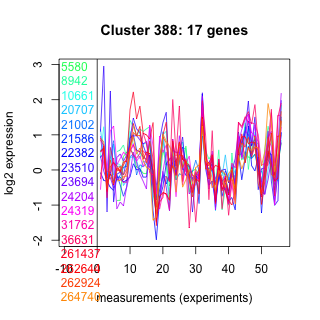 |
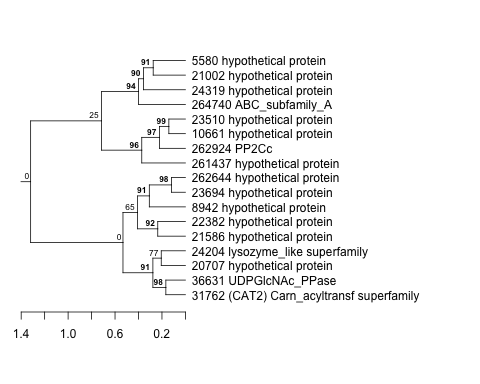 |
0.0000000024 |
23 |
380 |
highlight_arrays | 0.157000 | 0.241 |
| Title | Cluster Plot | Dendrogram | e-value | e-value | e-value | Condition | Condition FDR | Condition Difference |
|---|---|---|---|---|---|---|---|---|
| Thaps_hclust_0278 |
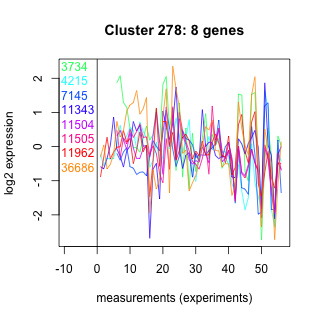 |
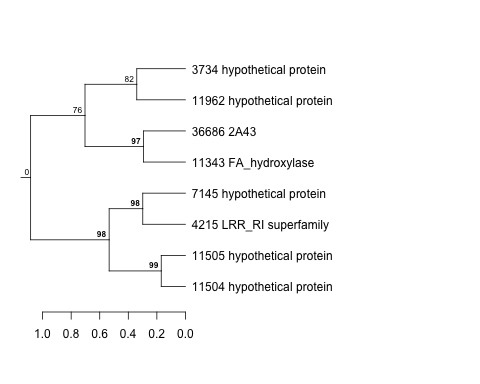 |
0.093 |
0.57 |
39 |
diel_light_vs_dark | 0.520000 | 0.24 |
| Title | Cluster Plot | Dendrogram | e-value | e-value | e-value | Condition | Condition FDR | Condition Difference |
|---|---|---|---|---|---|---|---|---|
| Thaps_hclust_0121 |
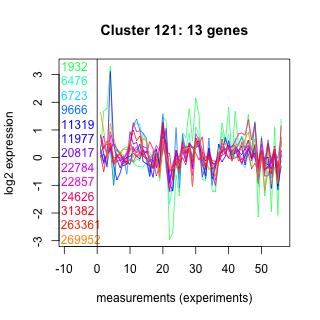 |
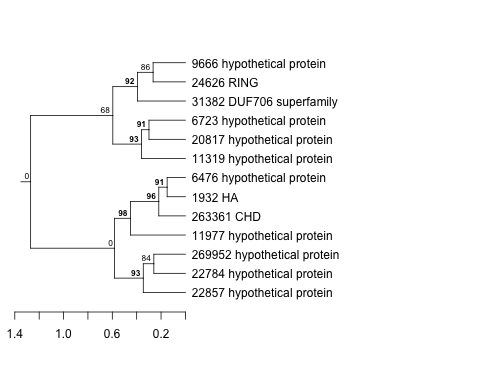 |
0.00021 |
0.77 |
30 |
BaP | 0.388000 | 0.24 |
| Title | Cluster Plot | Dendrogram | e-value | e-value | e-value | Condition | Condition FDR | Condition Difference |
|---|---|---|---|---|---|---|---|---|
| Thaps_hclust_0044 |
 |
 |
0.27 |
2.6 |
4.2 |
highlight_arrays | 0.238000 | 0.24 |
| Title | Cluster Plot | Dendrogram | e-value | e-value | e-value | Condition | Condition FDR | Condition Difference |
|---|---|---|---|---|---|---|---|---|
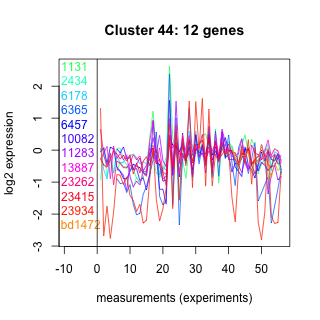
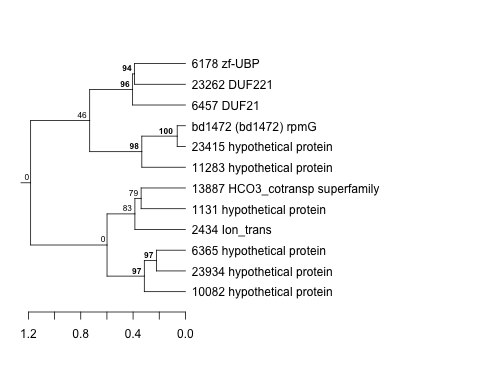
| Thaps_hclust_0391 |
 |
 |
1.9 |
34 |
32 |
lowFe_KTKB_Day3 | 0.375000 | 0.24 |
| Title | Cluster Plot | Dendrogram | e-value | e-value | e-value | Condition | Condition FDR | Condition Difference |
|---|---|---|---|---|---|---|---|---|
| Thaps_hclust_0015 |
 |
|
2.5e-25 |
7.4e-21 |
0.0000000011 |
co2_elevated_stat_arrays | 0.125000 | 0.239 |
| Title | Cluster Plot | Dendrogram | e-value | e-value | e-value | Condition | Condition FDR | Condition Difference |
|---|---|---|---|---|---|---|---|---|
| Thaps_hclust_0095 |
 |
 |
5.3e-28 |
1.7e-25 |
1.6e-17 |
lowFe_KTKB_Day3 | 0.157000 | 0.238 |
| Title | Cluster Plot | Dendrogram | e-value | e-value | e-value | Condition | Condition FDR | Condition Difference |
|---|---|---|---|---|---|---|---|---|
| Thaps_hclust_0049 |
 |
 |
0.00054 |
0.0063 |
0.03 |
lowFe_KTKB_Day5 | 0.141000 | 0.238 |
| Title | Cluster Plot | Dendrogram | e-value | e-value | e-value | Condition | Condition FDR | Condition Difference |
|---|---|---|---|---|---|---|---|---|
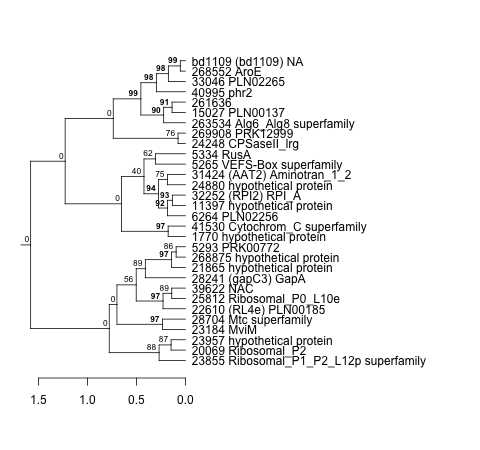
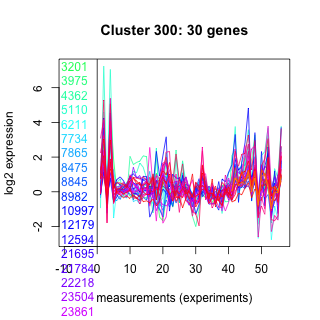
| Thaps_hclust_0300 |
 |
 |
0.05 |
11 |
3.8 |
diel_exponential_vs_stationary | 0.096400 | 0.238 |
| Title | Cluster Plot | Dendrogram | e-value | e-value | e-value | Condition | Condition FDR | Condition Difference |
|---|---|---|---|---|---|---|---|---|
| Thaps_hclust_0060 |
 |
 |
0.00000047 |
0.00077 |
0.0075 |
lowFe_KTKB_Day3 | 0.213000 | 0.238 |
| Title | Cluster Plot | Dendrogram | e-value | e-value | e-value | Condition | Condition FDR | Condition Difference |
|---|---|---|---|---|---|---|---|---|
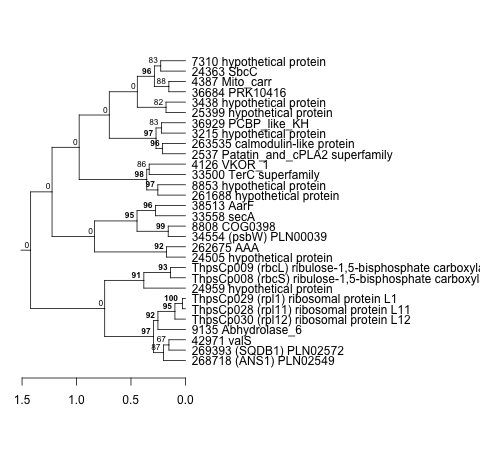
| Thaps_hclust_0394 |
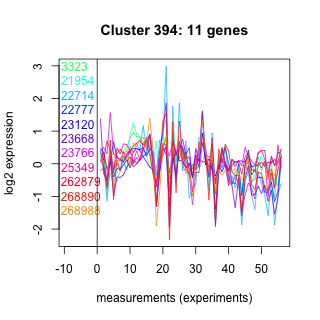 |
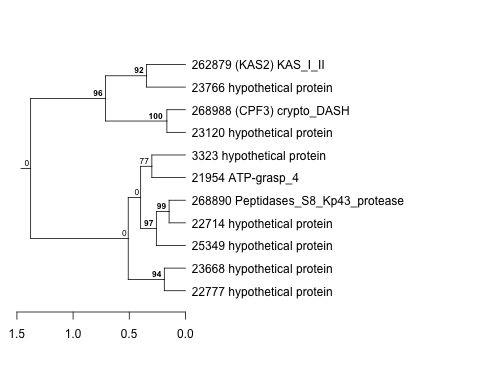 |
0.044 |
0.46 |
610 |
BaP | 0.437000 | 0.237 |
| Title | Cluster Plot | Dendrogram | e-value | e-value | e-value | Condition | Condition FDR | Condition Difference |
|---|---|---|---|---|---|---|---|---|
| Thaps_hclust_0111 |
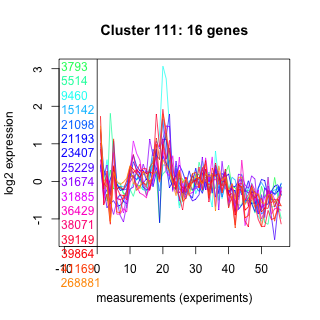 |
 |
0.00032 |
0.0074 |
0.8 |
co2_elevated_stat_arrays | 0.345000 | 0.237 |
| Title | Cluster Plot | Dendrogram | e-value | e-value | e-value | Condition | Condition FDR | Condition Difference |
|---|---|---|---|---|---|---|---|---|
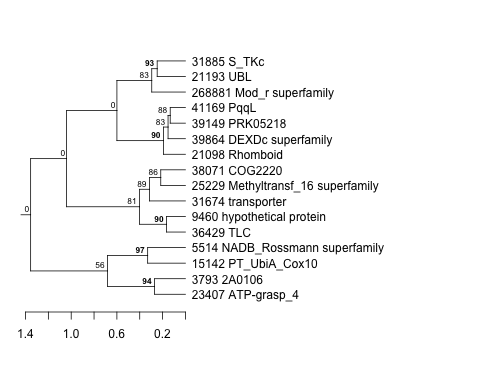
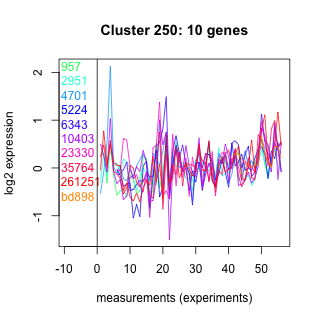
| Thaps_hclust_0250 |
 |
 |
0.38 |
88 |
290 |
BaP | 0.467000 | 0.236 |
| Title | Cluster Plot | Dendrogram | e-value | e-value | e-value | Condition | Condition FDR | Condition Difference |
|---|---|---|---|---|---|---|---|---|
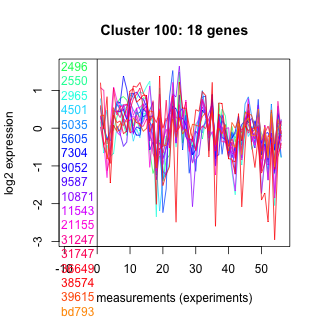
| Thaps_hclust_0100 |
 |
 |
0.00000073 |
0.000076 |
2.6 |
highlight_arrays | 0.160000 | 0.236 |
| Title | Cluster Plot | Dendrogram | e-value | e-value | e-value | Condition | Condition FDR | Condition Difference |
|---|---|---|---|---|---|---|---|---|
| Thaps_hclust_0180 |
 |
 |
1.5 |
1.7 |
12 |
lowFe_KTKB_Day5 | 0.420000 | 0.236 |
| Title | Cluster Plot | Dendrogram | e-value | e-value | e-value | Condition | Condition FDR | Condition Difference |
|---|---|---|---|---|---|---|---|---|
| Thaps_hclust_0328 |
 |
 |
0.00013 |
0.00001 |
0.46 |
lowFe_KTKB_Day3 | 0.302000 | 0.236 |
| Title | Cluster Plot | Dendrogram | e-value | e-value | e-value | Condition | Condition FDR | Condition Difference |
|---|---|---|---|---|---|---|---|---|
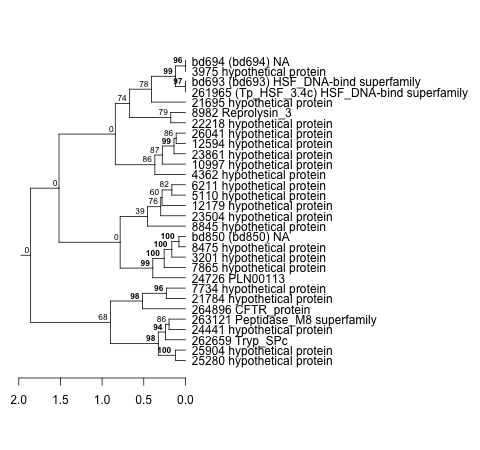
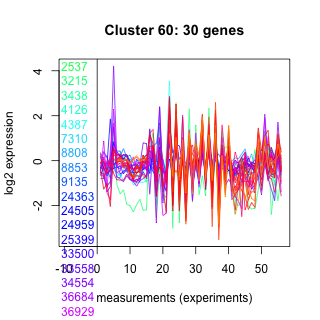
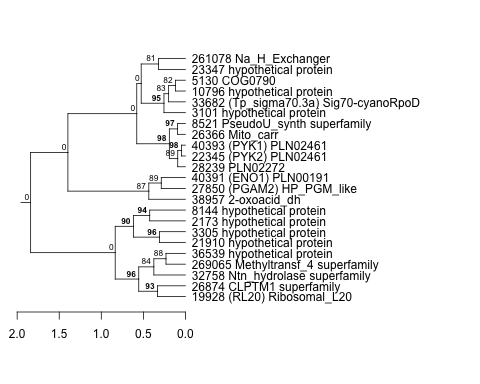
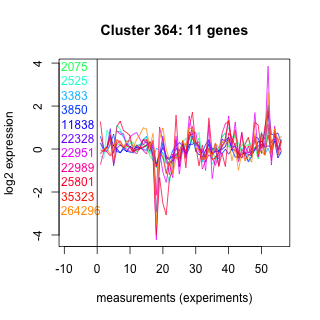
| Thaps_hclust_0364 |
 |
 |
4.5 |
28 |
590 |
co2_elevated_stat_arrays | 0.406000 | 0.236 |
| Title | Cluster Plot | Dendrogram | e-value | e-value | e-value | Condition | Condition FDR | Condition Difference |
|---|---|---|---|---|---|---|---|---|
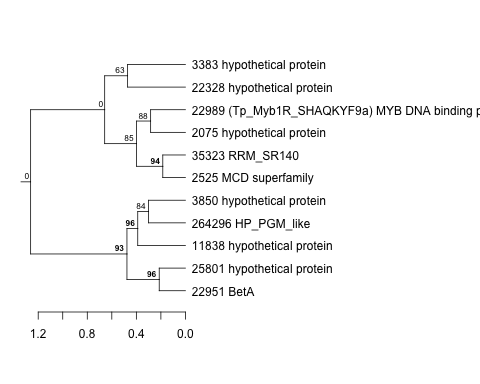
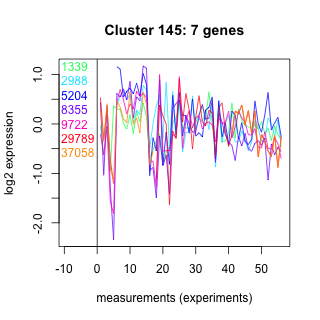
| Thaps_hclust_0145 |
 |
 |
0.015 |
1.6 |
11 |
highlight_arrays | 0.381000 | 0.236 |
| Title | Cluster Plot | Dendrogram | e-value | e-value | e-value | Condition | Condition FDR | Condition Difference |
|---|---|---|---|---|---|---|---|---|
| Thaps_hclust_0344 |
 |
 |
7.9 |
94 |
120 |
co2_elevated_expo_arrays | 0.107000 | 0.236 |
| Title | Cluster Plot | Dendrogram | e-value | e-value | e-value | Condition | Condition FDR | Condition Difference |
|---|---|---|---|---|---|---|---|---|
| Thaps_hclust_0367 |
 |
 |
0.027 |
0.079 |
0.86 |
lowFe_KTKB_Day5 | 0.328000 | 0.235 |
| Title | Cluster Plot | Dendrogram | e-value | e-value | e-value | Condition | Condition FDR | Condition Difference |
|---|---|---|---|---|---|---|---|---|
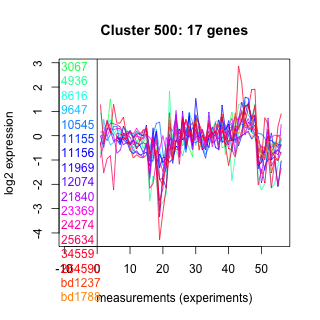
| Thaps_hclust_0500 |
 |
 |
0.91 |
14 |
30 |
lowSi_TMEVA | 0.832000 | 0.235 |
| Title | Cluster Plot | Dendrogram | e-value | e-value | e-value | Condition | Condition FDR | Condition Difference |
|---|---|---|---|---|---|---|---|---|
| Thaps_hclust_0112 |
 |
 |
0.00000035 |
0.017 |
0.34 |
diel_light_vs_dark | 0.320000 | 0.235 |
| Title | Cluster Plot | Dendrogram | e-value | e-value | e-value | Condition | Condition FDR | Condition Difference |
|---|---|---|---|---|---|---|---|---|
| Thaps_hclust_0382 |
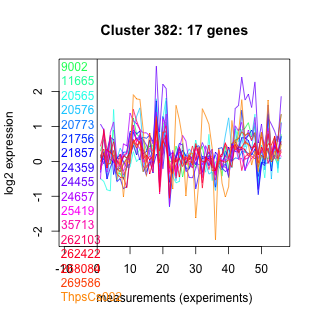 |
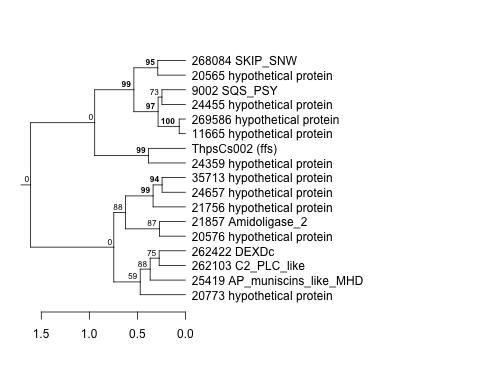 |
0.0000042 |
0.012 |
0.055 |
co2_elevated_stat_arrays | 0.345000 | 0.235 |
| Title | Cluster Plot | Dendrogram | e-value | e-value | e-value | Condition | Condition FDR | Condition Difference |
|---|---|---|---|---|---|---|---|---|
| Thaps_hclust_0277 |
 |
 |
0.00036 |
6.6 |
7.6 |
highpH_TMEVA | 0.227000 | 0.235 |
| Title | Cluster Plot | Dendrogram | e-value | e-value | e-value | Condition | Condition FDR | Condition Difference |
|---|---|---|---|---|---|---|---|---|
| Thaps_hclust_0131 |
 |
 |
260 |
48 |
370 |
exponential_vs_stationary_24light | 0.615000 | 0.234 |
| Title | Cluster Plot | Dendrogram | e-value | e-value | e-value | Condition | Condition FDR | Condition Difference |
|---|---|---|---|---|---|---|---|---|
| Thaps_hclust_0285 |
 |
 |
0.00019 |
0.057 |
5.9 |
lowFe_TMEVA | 0.548000 | 0.234 |
| Title | Cluster Plot | Dendrogram | e-value | e-value | e-value | Condition | Condition FDR | Condition Difference |
|---|---|---|---|---|---|---|---|---|
| Thaps_hclust_0027 |
 |
 |
0.0000000084 |
0.0086 |
0.069 |
lowFe_KTKB_Day5 | 0.188000 | 0.234 |
| Title | Cluster Plot | Dendrogram | e-value | e-value | e-value | Condition | Condition FDR | Condition Difference |
|---|---|---|---|---|---|---|---|---|
| Thaps_hclust_0332 |
 |
 |
0.000000055 |
0.0000013 |
0.0037 |
lowN_TMEVA | 0.469000 | 0.234 |
| Title | Cluster Plot | Dendrogram | e-value | e-value | e-value | Condition | Condition FDR | Condition Difference |
|---|---|---|---|---|---|---|---|---|
| Thaps_hclust_0089 |
 |
 |
0.000036 |
0.00054 |
0.075 |
exponential_vs_stationary_24highlight | 0.034900 | 0.233 |
| Title | Cluster Plot | Dendrogram | e-value | e-value | e-value | Condition | Condition FDR | Condition Difference |
|---|---|---|---|---|---|---|---|---|
| Thaps_hclust_0368 |
 |
 |
0.0078 |
2.5 |
3.1 |
BaP | 0.449000 | 0.233 |
| Title | Cluster Plot | Dendrogram | e-value | e-value | e-value | Condition | Condition FDR | Condition Difference |
|---|---|---|---|---|---|---|---|---|
| Thaps_hclust_0083 |
 |
 |
0.0039 |
6.3 |
14 |
lowFe_KTKB_Day3 | 0.375000 | 0.233 |
| Thaps_hclust_0083 |
|
|
0.0039 |
6.3 |
14 |
co2_elevated_expo_arrays | 0.139000 | 0.23 |
| Title | Cluster Plot | Dendrogram | e-value | e-value | e-value | Condition | Condition FDR | Condition Difference |
|---|---|---|---|---|---|---|---|---|
| Thaps_hclust_0488 |
 |
 |
0.15 |
0.012 |
0.2 |
lowFe_KTKB_Day5 | 0.190000 | 0.233 |
| Title | Cluster Plot | Dendrogram | e-value | e-value | e-value | Condition | Condition FDR | Condition Difference |
|---|---|---|---|---|---|---|---|---|
| Thaps_hclust_0019 |
 |
 |
0.0000001 |
0.00000017 |
0.000037 |
co2_elevated_stat_arrays | 0.302000 | 0.233 |
| Title | Cluster Plot | Dendrogram | e-value | e-value | e-value | Condition | Condition FDR | Condition Difference |
|---|---|---|---|---|---|---|---|---|
| Thaps_hclust_0039 |
 |
 |
2.2e-16 |
0.000000000000049 |
0.00083 |
lowFe_KTKB_Day5 | 0.074700 | 0.233 |
| Thaps_hclust_0039 |
|
|
2.2e-16 |
0.000000000000049 |
0.00083 |
co2_elevated_expo_arrays | 0.006820 | 0.231 |
| Title | Cluster Plot | Dendrogram | e-value | e-value | e-value | Condition | Condition FDR | Condition Difference |
|---|---|---|---|---|---|---|---|---|
| Thaps_hclust_0183 |
 |
 |
0.000026 |
0.000017 |
0.00004 |
highpH_TMEVA | 0.392000 | 0.232 |
| Title | Cluster Plot | Dendrogram | e-value | e-value | e-value | Condition | Condition FDR | Condition Difference |
|---|---|---|---|---|---|---|---|---|
| Thaps_hclust_0062 |
 |
 |
0.000000026 |
0.000000021 |
0.000000000021 |
diel_exponential_vs_stationary | 0.493000 | 0.232 |
| Title | Cluster Plot | Dendrogram | e-value | e-value | e-value | Condition | Condition FDR | Condition Difference |
|---|---|---|---|---|---|---|---|---|
| Thaps_hclust_0411 |
 |
 |
0.00079 |
0.0092 |
0.029 |
highlight_arrays | 0.050500 | 0.232 |
| Title | Cluster Plot | Dendrogram | e-value | e-value | e-value | Condition | Condition FDR | Condition Difference |
|---|---|---|---|---|---|---|---|---|
| Thaps_hclust_0268 |
 |
 |
0.17 |
14 |
60 |
lowFe_KTKB_Day5 | 0.283000 | 0.232 |
| Title | Cluster Plot | Dendrogram | e-value | e-value | e-value | Condition | Condition FDR | Condition Difference |
|---|---|---|---|---|---|---|---|---|
| Thaps_hclust_0113 |
 |
 |
0.00000000011 |
0.000014 |
0.00007 |
diel_light_vs_dark | 0.102000 | 0.231 |
| Title | Cluster Plot | Dendrogram | e-value | e-value | e-value | Condition | Condition FDR | Condition Difference |
|---|---|---|---|---|---|---|---|---|
| Thaps_hclust_0036 |
 |
 |
0.0000003 |
0.00016 |
110 |
co2_elevated_expo_arrays | 0.037300 | 0.231 |
| Title | Cluster Plot | Dendrogram | e-value | e-value | e-value | Condition | Condition FDR | Condition Difference |
|---|---|---|---|---|---|---|---|---|
| Thaps_hclust_0439 |
 |
 |
0.00085 |
0.014 |
0.032 |
highpH_TMEVA | 0.145000 | 0.231 |
| Title | Cluster Plot | Dendrogram | e-value | e-value | e-value | Condition | Condition FDR | Condition Difference |
|---|---|---|---|---|---|---|---|---|
| Thaps_hclust_0186 |
 |
 |
0.0000000043 |
0.006 |
0.0000084 |
diel_light_vs_dark | 0.255000 | 0.231 |
| Title | Cluster Plot | Dendrogram | e-value | e-value | e-value | Condition | Condition FDR | Condition Difference |
|---|---|---|---|---|---|---|---|---|
| Thaps_hclust_0429 |
 |
 |
0.0000000033 |
0.00000039 |
0.000054 |
diel_light_vs_dark | 0.235000 | 0.231 |
| Title | Cluster Plot | Dendrogram | e-value | e-value | e-value | Condition | Condition FDR | Condition Difference |
|---|---|---|---|---|---|---|---|---|
| Thaps_hclust_0276 |
 |
 |
0.063 |
39 |
53 |
highpH_TMEVA | 0.253000 | 0.231 |
| Title | Cluster Plot | Dendrogram | e-value | e-value | e-value | Condition | Condition FDR | Condition Difference |
|---|---|---|---|---|---|---|---|---|
| Thaps_hclust_0033 |
 |
 |
0.000000000000011 |
0.0012 |
0.0073 |
lowFe_KTKB_Day5 | 0.057900 | 0.23 |
| Title | Cluster Plot | Dendrogram | e-value | e-value | e-value | Condition | Condition FDR | Condition Difference |
|---|---|---|---|---|---|---|---|---|
| Thaps_hclust_0240 |
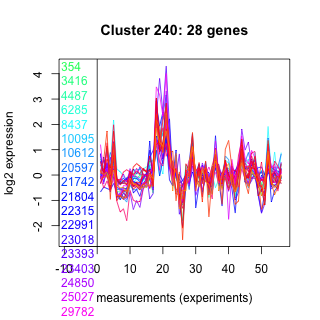 |
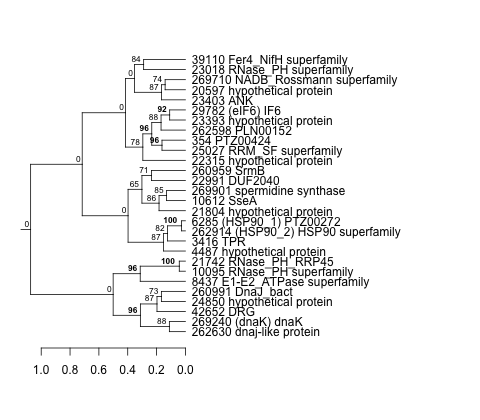 |
0.000000064 |
0.000021 |
0.00078 |
highlight_arrays | 0.088200 | 0.23 |
| Title | Cluster Plot | Dendrogram | e-value | e-value | e-value | Condition | Condition FDR | Condition Difference |
|---|---|---|---|---|---|---|---|---|
| Thaps_hclust_0310 |
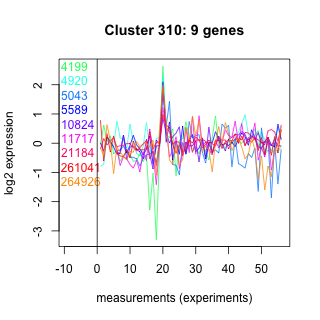 |
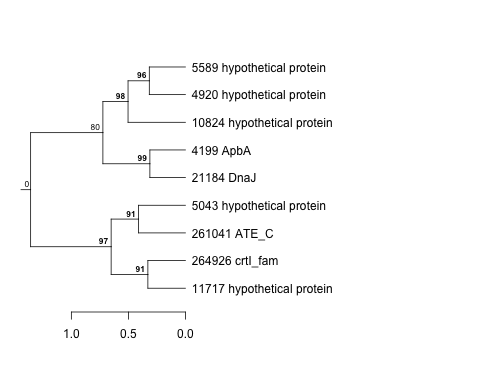 |
4.9 |
19 |
86 |
lowN_TMEVA | 0.615000 | 0.229 |
| Title | Cluster Plot | Dendrogram | e-value | e-value | e-value | Condition | Condition FDR | Condition Difference |
|---|---|---|---|---|---|---|---|---|
| Thaps_hclust_0061 |
 |
 |
0.000000062 |
0.00063 |
0.032 |
lowFe_TMEVA | 0.467000 | 0.229 |