Hierarchical Clusters
Displaying 301 - 400 of 7500
| Title | Cluster Plot | Dendrogram | e-value | e-value | e-value | Condition | Condition FDR | Condition Difference |
|---|---|---|---|---|---|---|---|---|
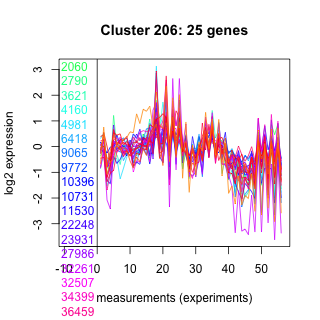
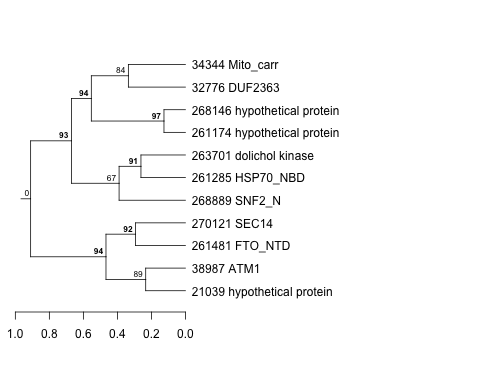
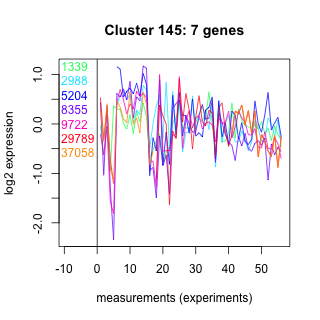
| Thaps_hclust_0206 |
 |
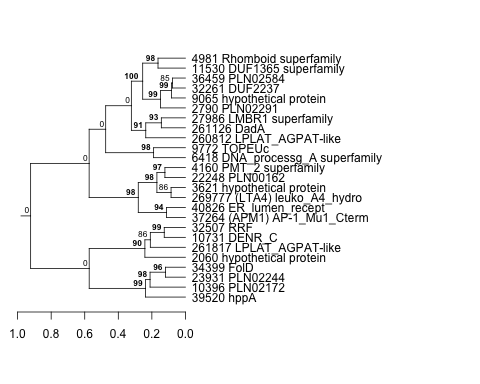 |
0.00000000000075 |
0.0000028 |
3.5 |
lowN_TMEVA | 0.001190 | -0.92 |
| Title | Cluster Plot | Dendrogram | e-value | e-value | e-value | Condition | Condition FDR | Condition Difference |
|---|---|---|---|---|---|---|---|---|
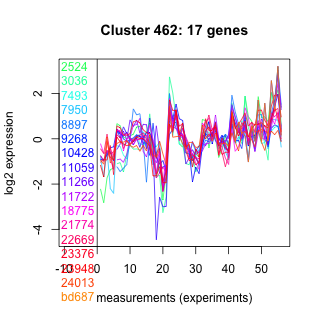
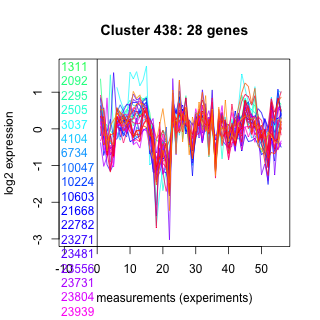
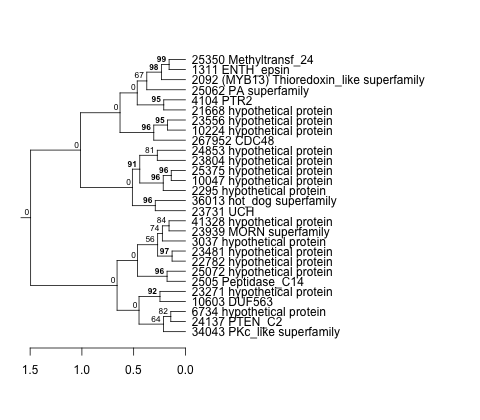
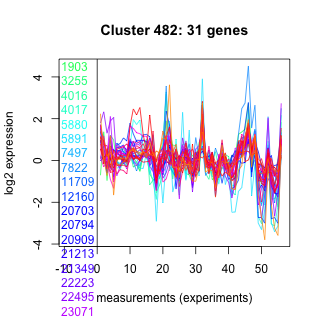
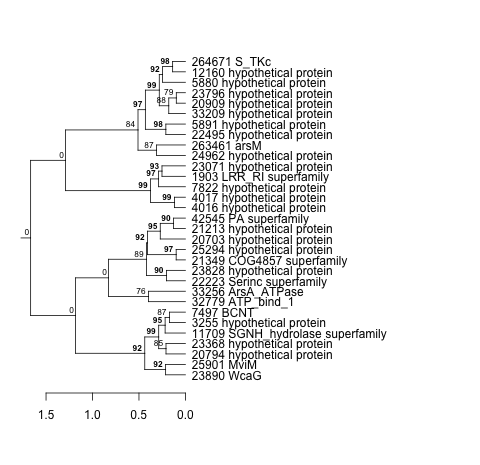
| Thaps_hclust_0462 |
 |
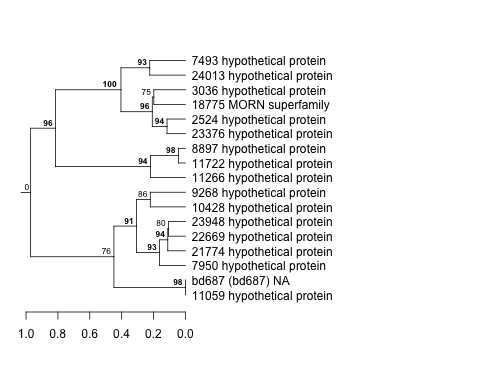 |
0.0000000094 |
0.0000011 |
0.000046 |
highpH_TMEVA | 0.000725 | -0.919 |
| Thaps_hclust_0462 |
|
|
0.0000000094 |
0.0000011 |
0.000046 |
lowSi_TMEVA | 0.035800 | -0.871 |
| Title | Cluster Plot | Dendrogram | e-value | e-value | e-value | Condition | Condition FDR | Condition Difference |
|---|---|---|---|---|---|---|---|---|
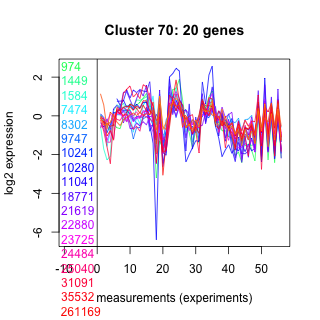
| Thaps_hclust_0070 |
 |
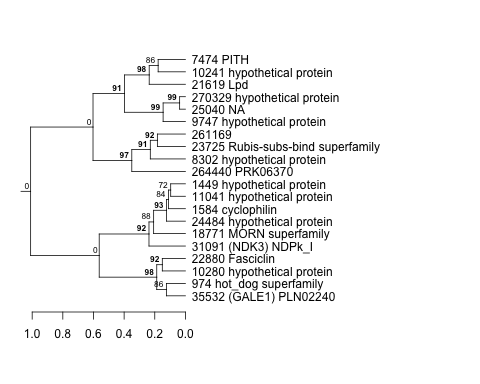 |
0.00015 |
0.0025 |
0.041 |
lowN_TMEVA | 0.003130 | -0.919 |
| Thaps_hclust_0070 |
|
|
0.00015 |
0.0025 |
0.041 |
lowSi_TMEVA | 0.036700 | -0.797 |
| Title | Cluster Plot | Dendrogram | e-value | e-value | e-value | Condition | Condition FDR | Condition Difference |
|---|---|---|---|---|---|---|---|---|
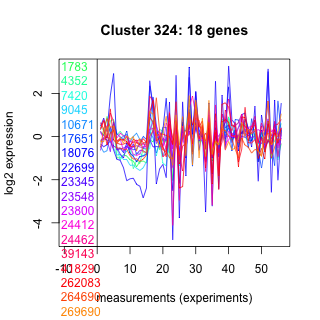
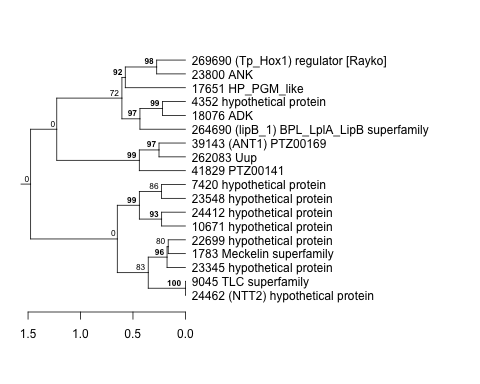
| Thaps_hclust_0330 |
 |
 |
0.0000058 |
0.00000085 |
0.000041 |
BaP | 0.000370 | -0.919 |
| Thaps_hclust_0330 |
|
|
0.0000058 |
0.00000085 |
0.000041 |
exponential_vs_stationary_24highlight | 0.000526 | -0.827 |
| Title | Cluster Plot | Dendrogram | e-value | e-value | e-value | Condition | Condition FDR | Condition Difference |
|---|---|---|---|---|---|---|---|---|
| Thaps_hclust_0063 |
 |
 |
9.8e-19 |
5.7e-17 |
8.2e-17 |
highlight_arrays | 0.000442 | -0.919 |
| Title | Cluster Plot | Dendrogram | e-value | e-value | e-value | Condition | Condition FDR | Condition Difference |
|---|---|---|---|---|---|---|---|---|
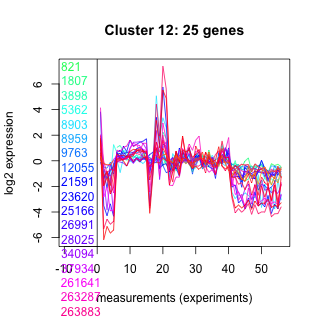
| Thaps_hclust_0012 |
 |
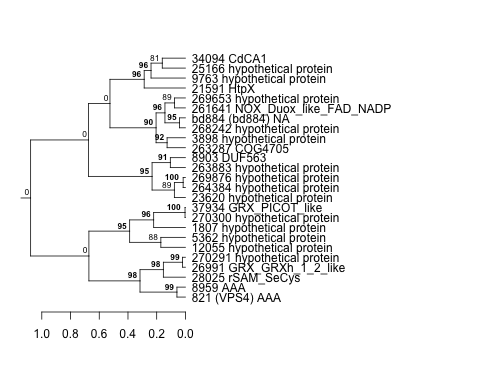 |
0.000000000019 |
0.0000000000016 |
0.0000013 |
lowFe_KTKB_Day3 | 0.000862 | -0.918 |
| Title | Cluster Plot | Dendrogram | e-value | e-value | e-value | Condition | Condition FDR | Condition Difference |
|---|---|---|---|---|---|---|---|---|
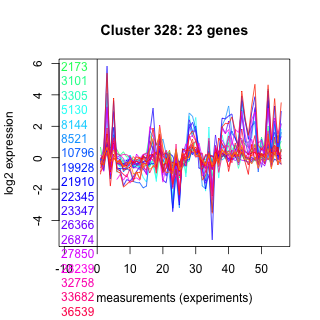
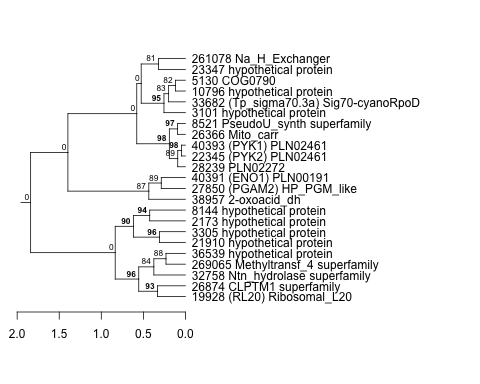
| Thaps_hclust_0328 |
 |
 |
0.00013 |
0.00001 |
0.46 |
exponential_vs_stationary_24light | 0.000581 | -0.918 |
| Title | Cluster Plot | Dendrogram | e-value | e-value | e-value | Condition | Condition FDR | Condition Difference |
|---|---|---|---|---|---|---|---|---|
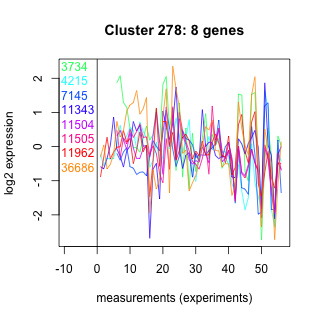
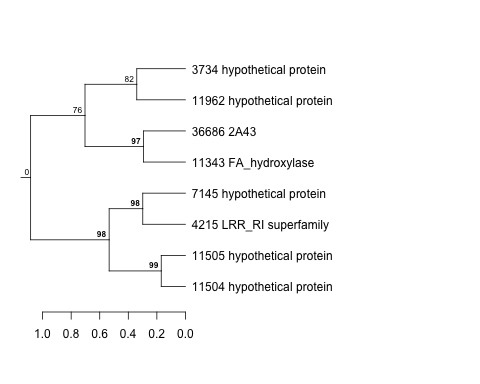
| Thaps_hclust_0278 |
 |
 |
0.093 |
0.57 |
39 |
lowFe_KTKB_Day3 | 0.013000 | -0.916 |
| Title | Cluster Plot | Dendrogram | e-value | e-value | e-value | Condition | Condition FDR | Condition Difference |
|---|---|---|---|---|---|---|---|---|
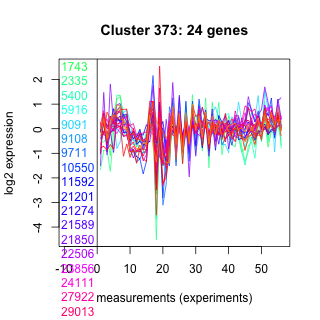
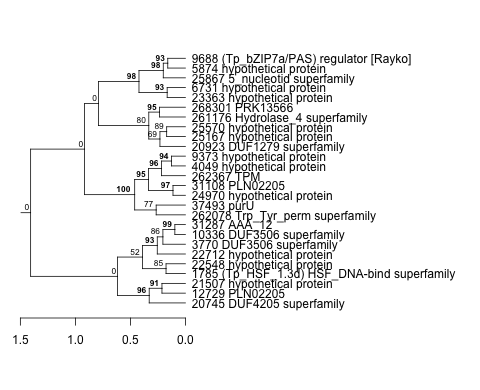
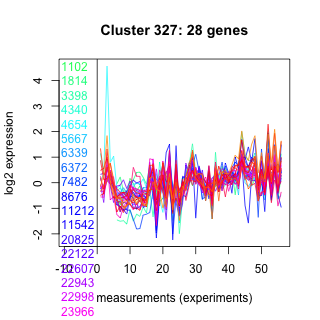
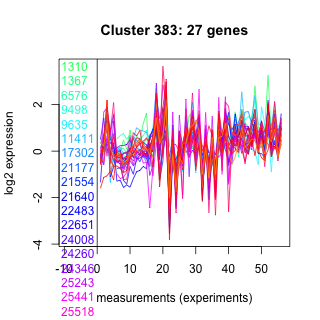
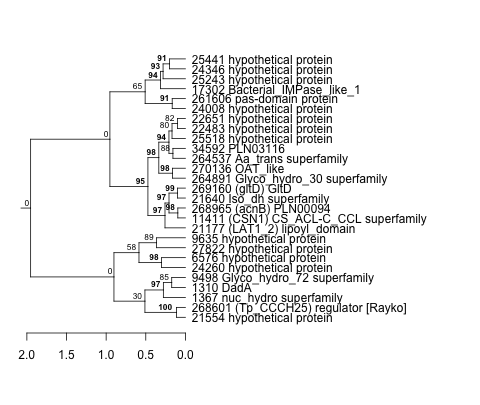
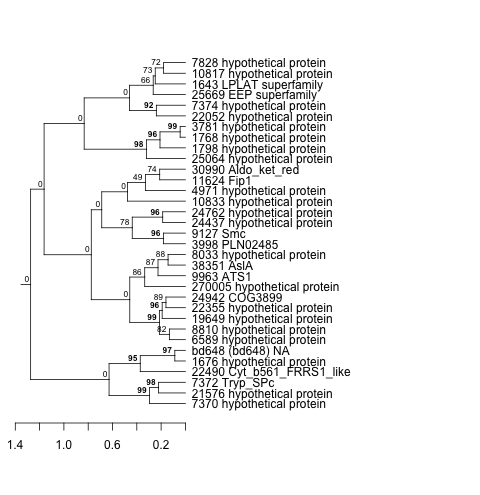
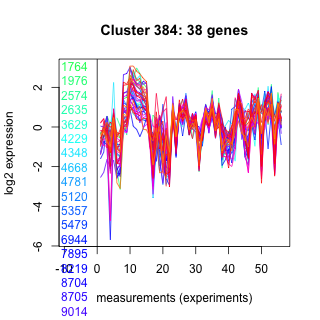
| Thaps_hclust_0373 |
 |
 |
0.00017 |
0.001 |
0.066 |
BaP | 0.000370 | -0.916 |
| Title | Cluster Plot | Dendrogram | e-value | e-value | e-value | Condition | Condition FDR | Condition Difference |
|---|---|---|---|---|---|---|---|---|
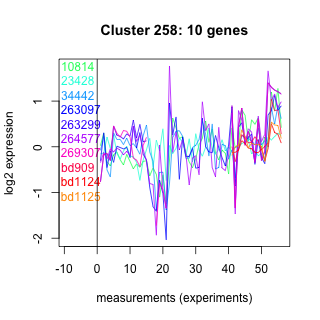
| Thaps_hclust_0258 |
 |
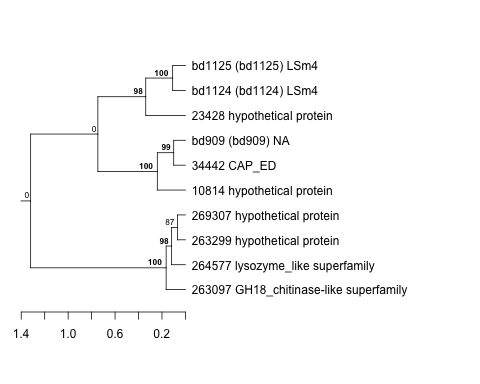 |
0.027 |
0.021 |
0.036 |
BaP | 0.002730 | -0.915 |
| Title | Cluster Plot | Dendrogram | e-value | e-value | e-value | Condition | Condition FDR | Condition Difference |
|---|---|---|---|---|---|---|---|---|
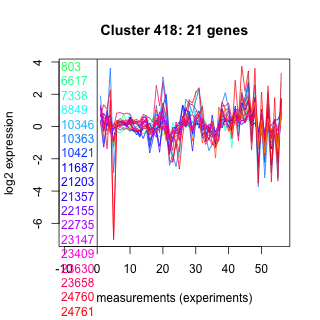
| Thaps_hclust_0418 |
 |
 |
0.00074 |
0.0098 |
0.29 |
diel_exponential_vs_stationary | 0.000602 | -0.913 |
| Thaps_hclust_0418 |
|
|
0.00074 |
0.0098 |
0.29 |
exponential_vs_stationary_24highlight | 0.000526 | -0.872 |
| Title | Cluster Plot | Dendrogram | e-value | e-value | e-value | Condition | Condition FDR | Condition Difference |
|---|---|---|---|---|---|---|---|---|
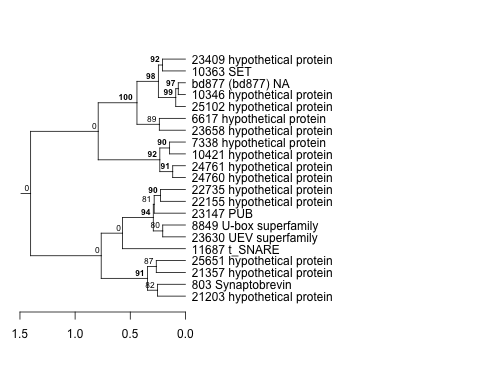
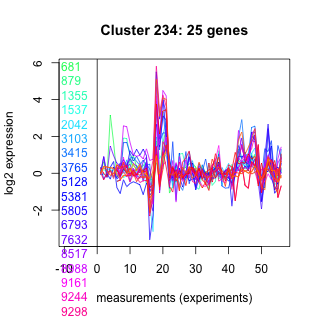
| Thaps_hclust_0234 |
 |
 |
0.036 |
0.063 |
0.24 |
lowFe_KTKB_Day5 | 0.001320 | -0.905 |
| Title | Cluster Plot | Dendrogram | e-value | e-value | e-value | Condition | Condition FDR | Condition Difference |
|---|---|---|---|---|---|---|---|---|
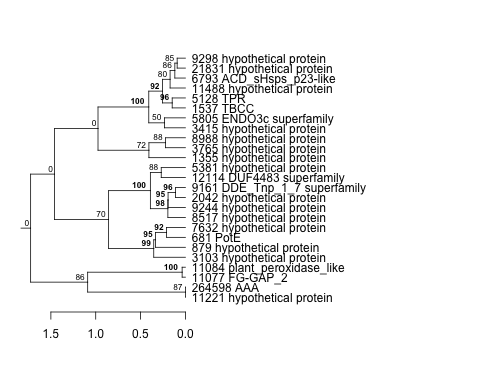
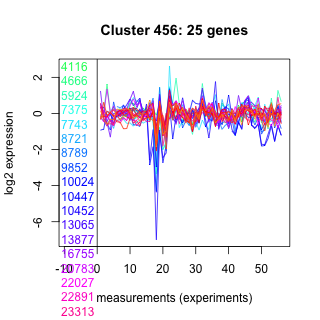
| Thaps_hclust_0456 |
 |
 |
0.0000000043 |
0.047 |
6.5 |
BaP | 0.000370 | -0.902 |
| Title | Cluster Plot | Dendrogram | e-value | e-value | e-value | Condition | Condition FDR | Condition Difference |
|---|---|---|---|---|---|---|---|---|
| Thaps_hclust_0483 |
 |
 |
0.7 |
5 |
0.096 |
BaP | 0.000370 | -0.902 |
| Title | Cluster Plot | Dendrogram | e-value | e-value | e-value | Condition | Condition FDR | Condition Difference |
|---|---|---|---|---|---|---|---|---|
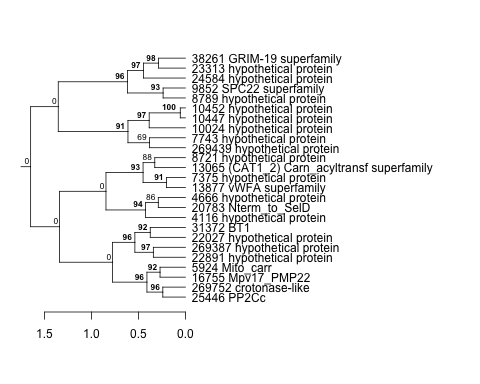
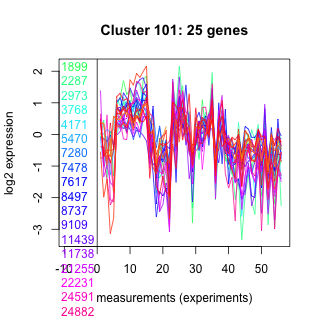
| Thaps_hclust_0101 |
 |
 |
0.000000016 |
0.0000038 |
0.014 |
lowSi_TMEVA | 0.002330 | -0.901 |
| Thaps_hclust_0101 |
|
|
0.000000016 |
0.0000038 |
0.014 |
BaP | 0.000370 | -0.875 |
| Title | Cluster Plot | Dendrogram | e-value | e-value | e-value | Condition | Condition FDR | Condition Difference |
|---|---|---|---|---|---|---|---|---|
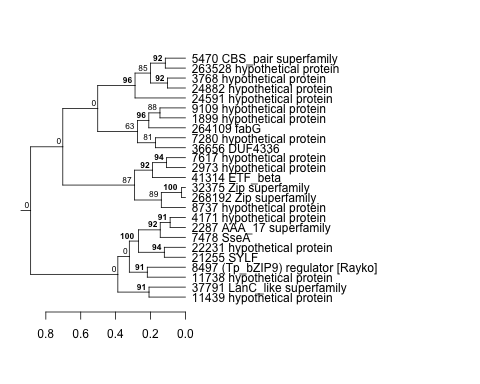
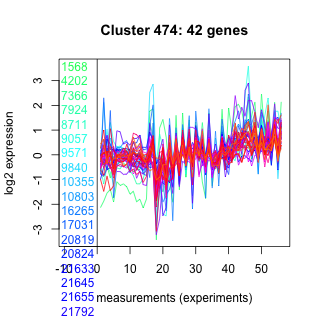
| Thaps_hclust_0474 |
 |
 |
0.0078 |
0.000018 |
0.003 |
BaP | 0.000370 | -0.9 |
| Title | Cluster Plot | Dendrogram | e-value | e-value | e-value | Condition | Condition FDR | Condition Difference |
|---|---|---|---|---|---|---|---|---|
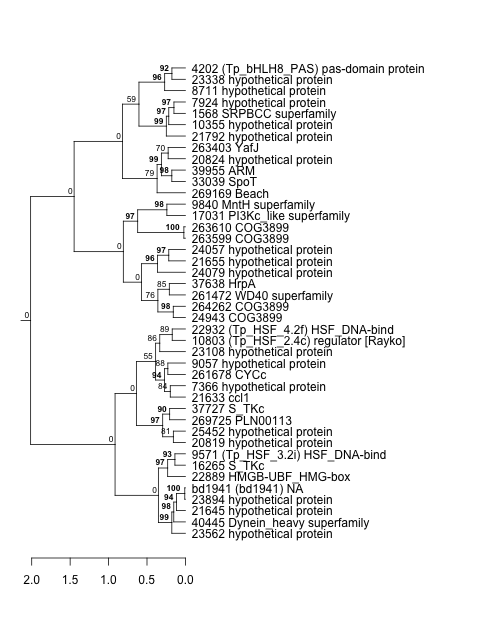
| Thaps_hclust_0355 |
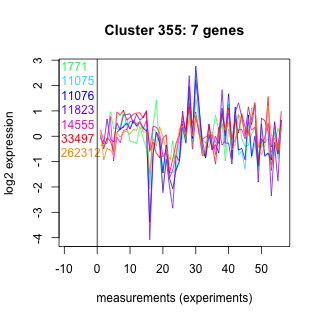 |
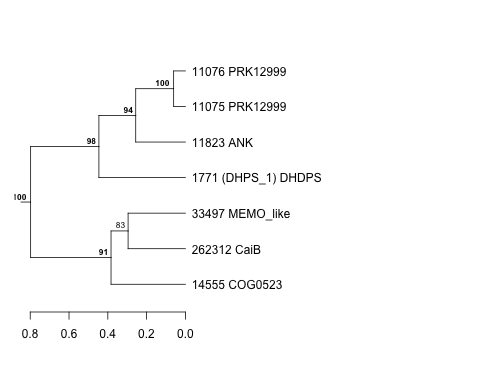 |
0.49 |
16 |
310 |
exponential_vs_stationary_24light | 0.075900 | -0.899 |
| Title | Cluster Plot | Dendrogram | e-value | e-value | e-value | Condition | Condition FDR | Condition Difference |
|---|---|---|---|---|---|---|---|---|
| Thaps_hclust_0472 |
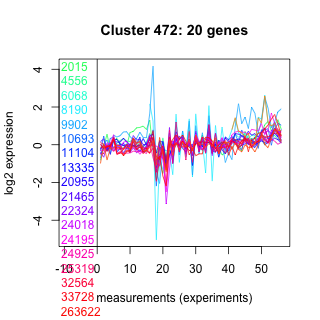 |
 |
0.00000011 |
0.000015 |
0.00015 |
BaP | 0.000370 | -0.898 |
| Title | Cluster Plot | Dendrogram | e-value | e-value | e-value | Condition | Condition FDR | Condition Difference |
|---|---|---|---|---|---|---|---|---|
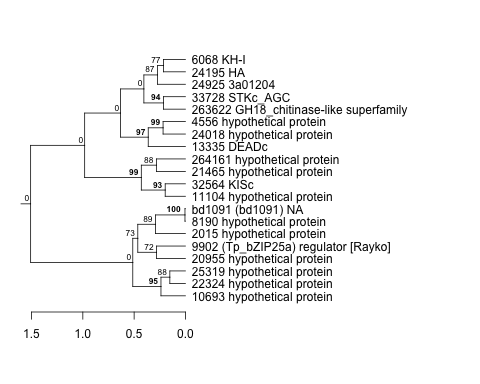
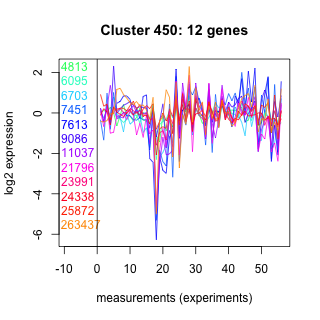
| Thaps_hclust_0450 |
 |
 |
0.00076 |
0.024 |
0.16 |
lowFe_KTKB_Day3 | 0.002990 | -0.898 |
| Title | Cluster Plot | Dendrogram | e-value | e-value | e-value | Condition | Condition FDR | Condition Difference |
|---|---|---|---|---|---|---|---|---|
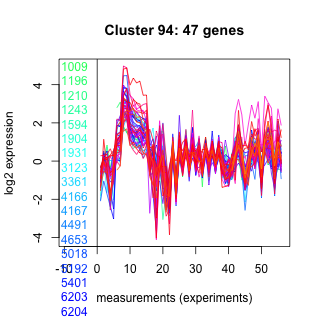
| Thaps_hclust_0092 |
 |
|
1.3e-37 |
4.2e-20 |
0.0000000000000013 |
highpH_TMEVA | 0.000725 | -0.895 |
| Title | Cluster Plot | Dendrogram | e-value | e-value | e-value | Condition | Condition FDR | Condition Difference |
|---|---|---|---|---|---|---|---|---|
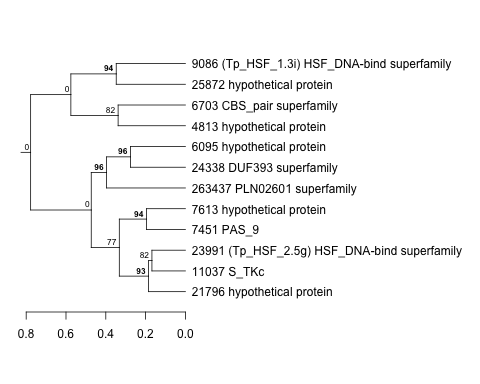
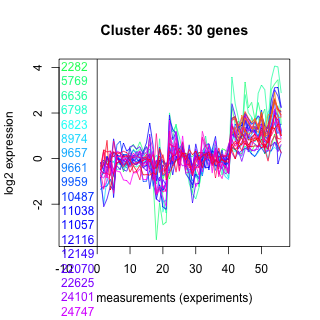
| Thaps_hclust_0465 |
 |
 |
0.011 |
0.053 |
0.75 |
BaP | 0.000370 | -0.892 |
| Title | Cluster Plot | Dendrogram | e-value | e-value | e-value | Condition | Condition FDR | Condition Difference |
|---|---|---|---|---|---|---|---|---|
| Thaps_hclust_0493 |
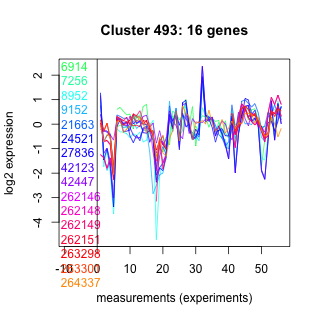 |
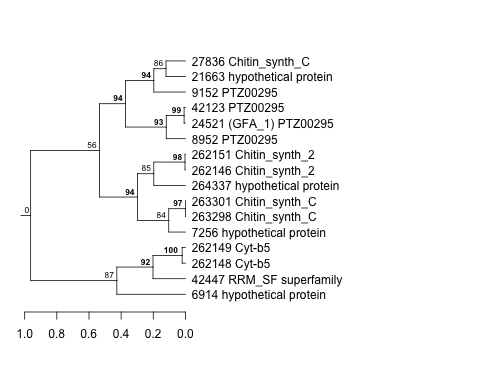 |
0.00000036 |
0.0000009 |
0.000056 |
lowFe_TMEVA | 0.001040 | -0.885 |
| Thaps_hclust_0493 |
|
|
0.00000036 |
0.0000009 |
0.000056 |
lowN_TMEVA | 0.019200 | -0.804 |
| Title | Cluster Plot | Dendrogram | e-value | e-value | e-value | Condition | Condition FDR | Condition Difference |
|---|---|---|---|---|---|---|---|---|
| Thaps_hclust_0094 |
 |
 |
0.0000000025 |
0.000014 |
0.0000045 |
highpH_TMEVA | 0.000725 | -0.883 |
| Title | Cluster Plot | Dendrogram | e-value | e-value | e-value | Condition | Condition FDR | Condition Difference |
|---|---|---|---|---|---|---|---|---|
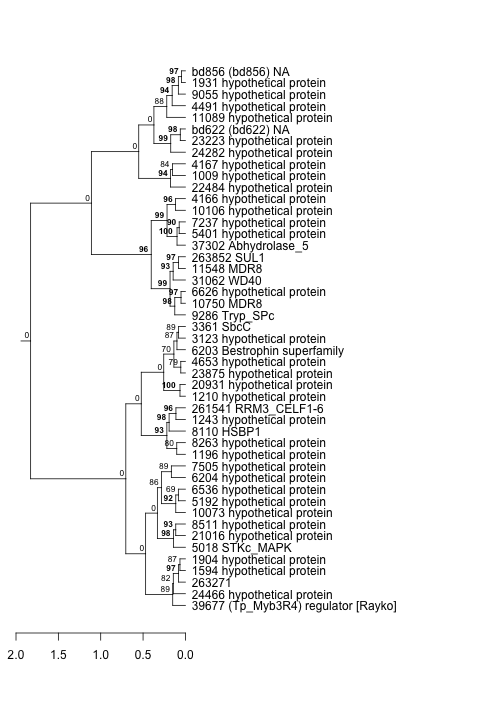
| Thaps_hclust_0441 |
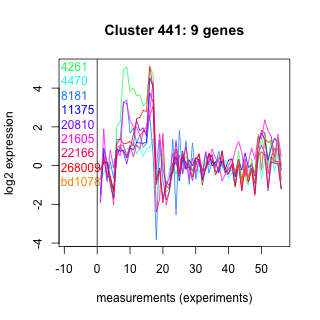 |
 |
0.00081 |
0.001 |
0.0015 |
highlight_arrays | 0.000442 | -0.88 |
| Title | Cluster Plot | Dendrogram | e-value | e-value | e-value | Condition | Condition FDR | Condition Difference |
|---|---|---|---|---|---|---|---|---|
| Thaps_hclust_0082 |
 |
|
8.89825e-43 |
2e-27 |
1.3e-16 |
highpH_TMEVA | 0.000725 | -0.879 |
| Thaps_hclust_0082 |
|
|
8.89825e-43 |
2e-27 |
1.3e-16 |
highlight_arrays | 0.000442 | -0.807 |
| Title | Cluster Plot | Dendrogram | e-value | e-value | e-value | Condition | Condition FDR | Condition Difference |
|---|---|---|---|---|---|---|---|---|
| Thaps_hclust_0114 |
 |
 |
0.086 |
4.8 |
3.2 |
lowFe_KTKB_Day3 | 0.000862 | -0.877 |
| Title | Cluster Plot | Dendrogram | e-value | e-value | e-value | Condition | Condition FDR | Condition Difference |
|---|---|---|---|---|---|---|---|---|
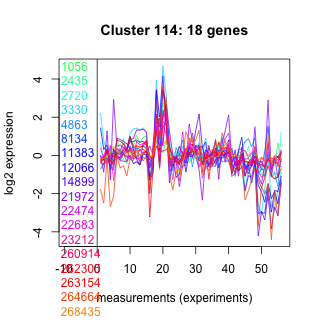
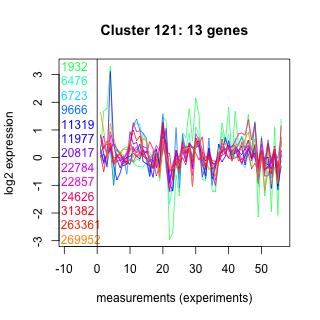
| Thaps_hclust_0121 |
 |
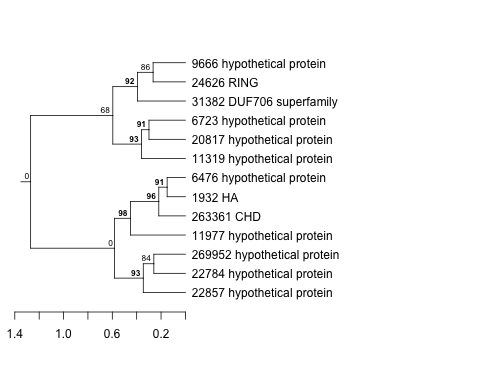 |
0.00021 |
0.77 |
30 |
exponential_vs_stationary_24light | 0.020600 | -0.877 |
| Title | Cluster Plot | Dendrogram | e-value | e-value | e-value | Condition | Condition FDR | Condition Difference |
|---|---|---|---|---|---|---|---|---|
| Thaps_hclust_0061 |
 |
 |
0.000000062 |
0.00063 |
0.032 |
diel_light_vs_dark | 0.000926 | -0.876 |
| Title | Cluster Plot | Dendrogram | e-value | e-value | e-value | Condition | Condition FDR | Condition Difference |
|---|---|---|---|---|---|---|---|---|
| Thaps_hclust_0040 |
 |
 |
1.8e-29 |
0.000000000042 |
0.00000000063 |
highlight_arrays | 0.000442 | -0.874 |
| Title | Cluster Plot | Dendrogram | e-value | e-value | e-value | Condition | Condition FDR | Condition Difference |
|---|---|---|---|---|---|---|---|---|
| Thaps_hclust_0213 |
 |
 |
0.0000045 |
0.075 |
0.54 |
lowSi_TMEVA | 0.002330 | -0.873 |
| Title | Cluster Plot | Dendrogram | e-value | e-value | e-value | Condition | Condition FDR | Condition Difference |
|---|---|---|---|---|---|---|---|---|
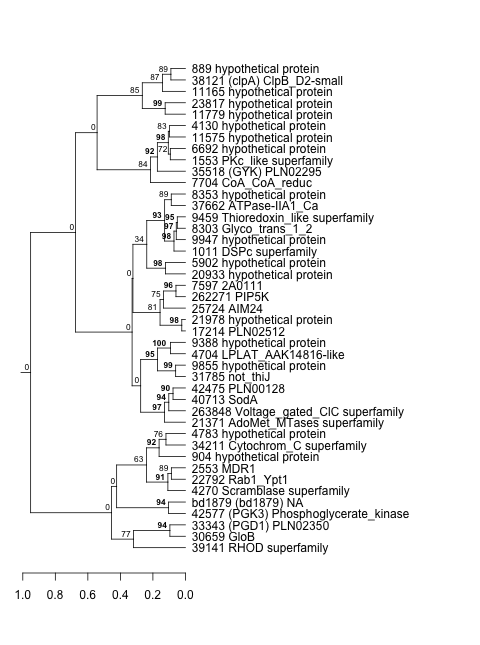
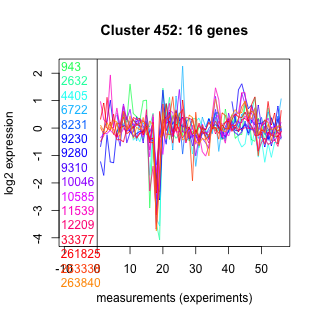
| Thaps_hclust_0452 |
 |
 |
84 |
200 |
220 |
BaP | 0.000370 | -0.871 |
| Thaps_hclust_0452 |
|
|
84 |
200 |
220 |
lowFe_KTKB_Day3 | 0.002380 | -0.795 |
| Title | Cluster Plot | Dendrogram | e-value | e-value | e-value | Condition | Condition FDR | Condition Difference |
|---|---|---|---|---|---|---|---|---|
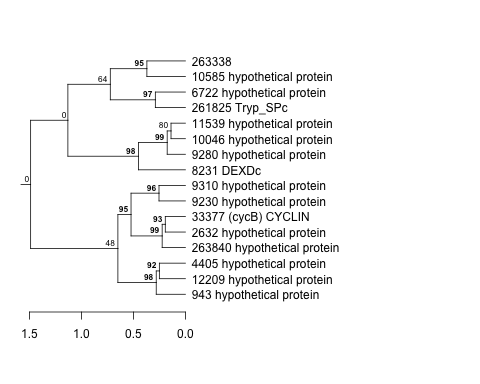
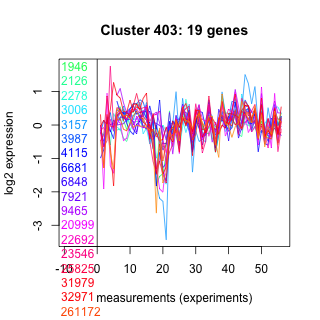
| Thaps_hclust_0403 |
 |
 |
0.83 |
0.015 |
0.016 |
BaP | 0.000370 | -0.87 |
| Title | Cluster Plot | Dendrogram | e-value | e-value | e-value | Condition | Condition FDR | Condition Difference |
|---|---|---|---|---|---|---|---|---|
| Thaps_hclust_0468 |
 |
 |
0.0023 |
0.08 |
2.3 |
lowFe_KTKB_Day3 | 0.000862 | -0.868 |
| Thaps_hclust_0468 |
|
|
0.0023 |
0.08 |
2.3 |
BaP | 0.000370 | -0.861 |
| Title | Cluster Plot | Dendrogram | e-value | e-value | e-value | Condition | Condition FDR | Condition Difference |
|---|---|---|---|---|---|---|---|---|
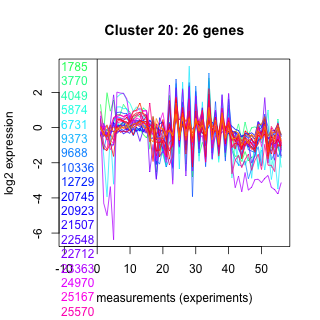
| Thaps_hclust_0020 |
 |
 |
0.004 |
0.15 |
3.3 |
BaP | 0.000370 | -0.867 |
| Title | Cluster Plot | Dendrogram | e-value | e-value | e-value | Condition | Condition FDR | Condition Difference |
|---|---|---|---|---|---|---|---|---|
| Thaps_hclust_0029 |
 |
|
9.1e-19 |
4.9e-16 |
0.00000000044 |
highlight_arrays | 0.000442 | -0.866 |
| Title | Cluster Plot | Dendrogram | e-value | e-value | e-value | Condition | Condition FDR | Condition Difference |
|---|---|---|---|---|---|---|---|---|
| Thaps_hclust_0327 |
 |
 |
0.0000000037 |
0.013 |
3.8 |
exponential_vs_stationary_24light | 0.000581 | -0.864 |
| Title | Cluster Plot | Dendrogram | e-value | e-value | e-value | Condition | Condition FDR | Condition Difference |
|---|---|---|---|---|---|---|---|---|
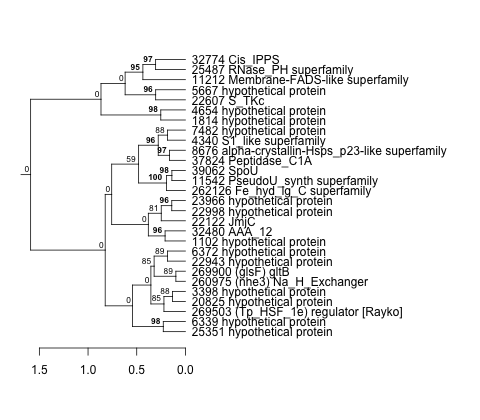
| Thaps_hclust_0261 |
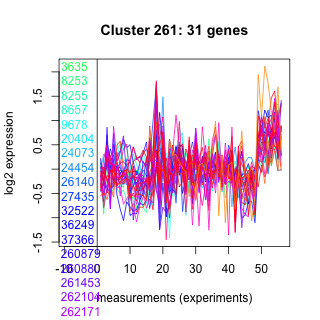 |
 |
0.00000000025 |
0.000000005 |
0.0000069 |
highlight_arrays | 0.000442 | -0.861 |
| Title | Cluster Plot | Dendrogram | e-value | e-value | e-value | Condition | Condition FDR | Condition Difference |
|---|---|---|---|---|---|---|---|---|
| Thaps_hclust_0079 |
 |
 |
0.00048 |
0.000048 |
0.27 |
BaP | 0.000370 | -0.86 |
| Title | Cluster Plot | Dendrogram | e-value | e-value | e-value | Condition | Condition FDR | Condition Difference |
|---|---|---|---|---|---|---|---|---|
| Thaps_hclust_0059 |
 |
 |
0.0000000000000026 |
0.000000000024 |
0.0000014 |
lowN_TMEVA | 0.001190 | -0.856 |
| Thaps_hclust_0059 |
|
|
0.0000000000000026 |
0.000000000024 |
0.0000014 |
highlight_arrays | 0.000442 | -0.831 |
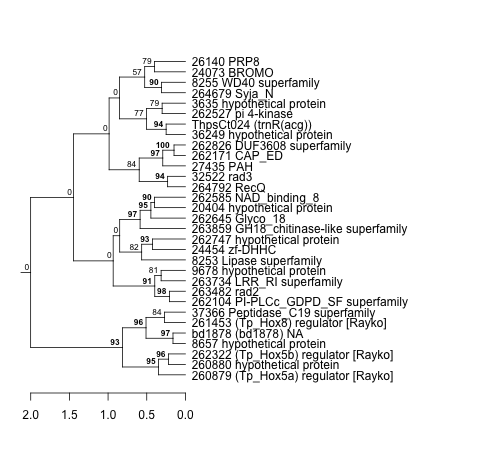
| Title | Cluster Plot | Dendrogram | e-value | e-value | e-value | Condition | Condition FDR | Condition Difference |
|---|---|---|---|---|---|---|---|---|
| Thaps_hclust_0499 |
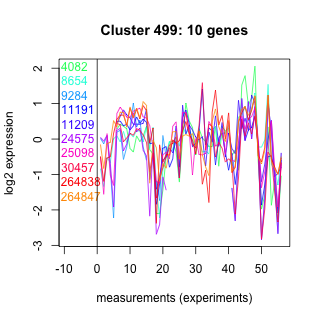 |
 |
0.13 |
5.4 |
18 |
lowFe_TMEVA | 0.019500 | -0.853 |
| Thaps_hclust_0499 |
|
|
0.13 |
5.4 |
18 |
lowtemp_TMEVA | 0.035900 | -0.791 |
| Title | Cluster Plot | Dendrogram | e-value | e-value | e-value | Condition | Condition FDR | Condition Difference |
|---|---|---|---|---|---|---|---|---|
| Thaps_hclust_0255 |
 |
 |
1.4e-28 |
0.0000000000000024 |
0.000000029 |
diel_light_vs_dark | 0.000485 | -0.853 |
| Title | Cluster Plot | Dendrogram | e-value | e-value | e-value | Condition | Condition FDR | Condition Difference |
|---|---|---|---|---|---|---|---|---|
| Thaps_hclust_0006 |
 |
 |
0.0000000000025 |
0.000000092 |
0.000086 |
lowFe_TMEVA | 0.001040 | -0.849 |
| Title | Cluster Plot | Dendrogram | e-value | e-value | e-value | Condition | Condition FDR | Condition Difference |
|---|---|---|---|---|---|---|---|---|
| Thaps_hclust_0367 |
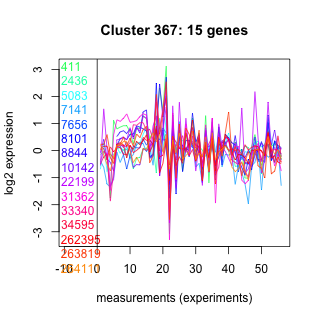 |
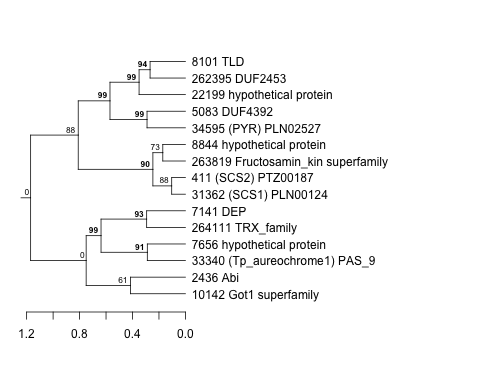 |
0.027 |
0.079 |
0.86 |
lowSi_TMEVA | 0.050600 | -0.847 |
| Title | Cluster Plot | Dendrogram | e-value | e-value | e-value | Condition | Condition FDR | Condition Difference |
|---|---|---|---|---|---|---|---|---|
| Thaps_hclust_0023 |
 |
 |
0.000000000039 |
0.0000072 |
0.002 |
highlight_arrays | 0.000442 | -0.846 |
| Title | Cluster Plot | Dendrogram | e-value | e-value | e-value | Condition | Condition FDR | Condition Difference |
|---|---|---|---|---|---|---|---|---|
| Thaps_hclust_0386 |
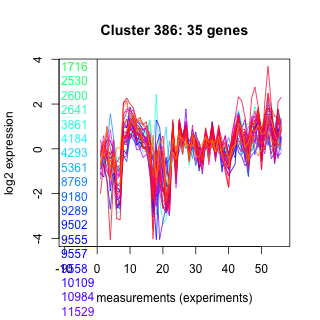 |
 |
0.00000064 |
0.00000005 |
0.00054 |
lowSi_TMEVA | 0.002330 | -0.844 |
| Title | Cluster Plot | Dendrogram | e-value | e-value | e-value | Condition | Condition FDR | Condition Difference |
|---|---|---|---|---|---|---|---|---|
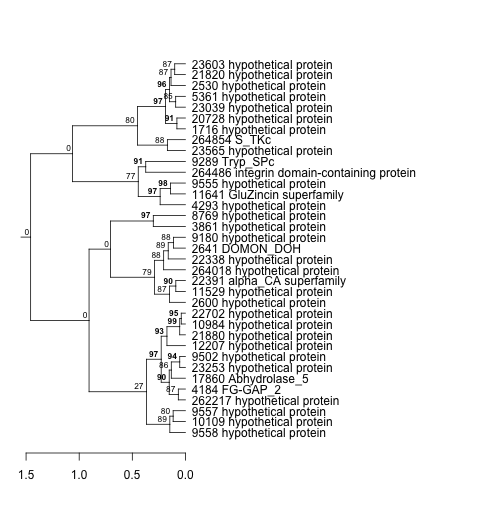
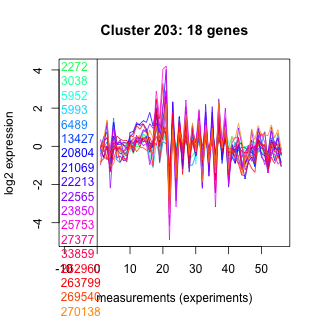
| Thaps_hclust_0203 |
 |
 |
0.00051 |
1.2 |
1.3 |
lowSi_TMEVA | 0.046800 | -0.839 |
| Title | Cluster Plot | Dendrogram | e-value | e-value | e-value | Condition | Condition FDR | Condition Difference |
|---|---|---|---|---|---|---|---|---|
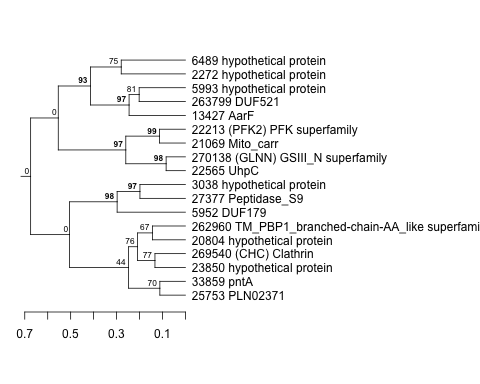
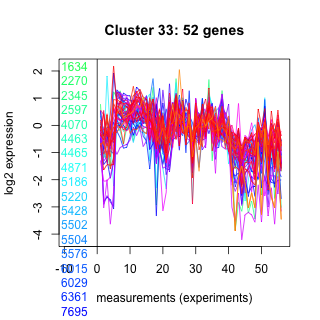
| Thaps_hclust_0033 |
 |
 |
0.000000000000011 |
0.0012 |
0.0073 |
lowSi_TMEVA | 0.001350 | -0.838 |
| Thaps_hclust_0033 |
|
|
0.000000000000011 |
0.0012 |
0.0073 |
lowFe_TMEVA | 0.001040 | -0.807 |
| Title | Cluster Plot | Dendrogram | e-value | e-value | e-value | Condition | Condition FDR | Condition Difference |
|---|---|---|---|---|---|---|---|---|
| Thaps_hclust_0004 |
 |
 |
0.000000074 |
0.0000031 |
0.0000044 |
lowFe_KTKB_Day5 | 0.001320 | -0.837 |
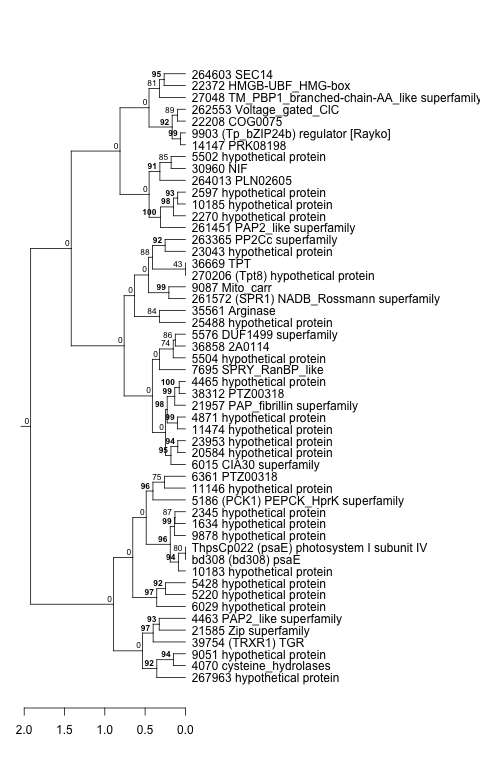
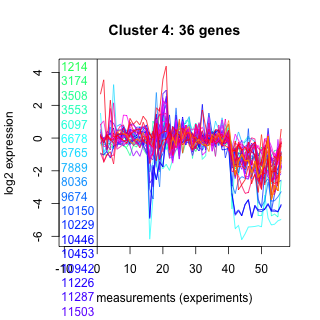
| Title | Cluster Plot | Dendrogram | e-value | e-value | e-value | Condition | Condition FDR | Condition Difference |
|---|---|---|---|---|---|---|---|---|
| Thaps_hclust_0164 |
 |
 |
13 |
58 |
65 |
lowtemp_TMEVA | 0.019900 | -0.833 |
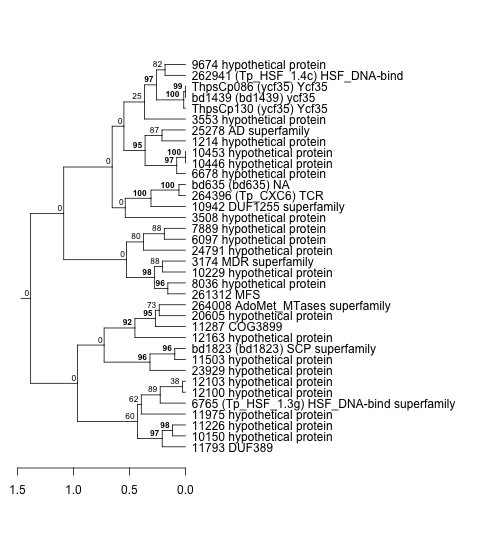
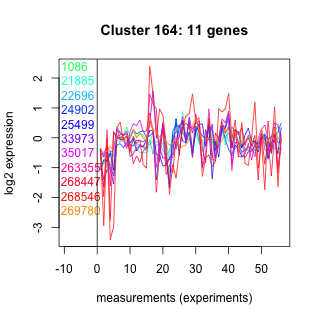
| Title | Cluster Plot | Dendrogram | e-value | e-value | e-value | Condition | Condition FDR | Condition Difference |
|---|---|---|---|---|---|---|---|---|
| Thaps_hclust_0075 |
 |
 |
0.069 |
53 |
33 |
highlight_arrays | 0.000442 | -0.829 |
| Title | Cluster Plot | Dendrogram | e-value | e-value | e-value | Condition | Condition FDR | Condition Difference |
|---|---|---|---|---|---|---|---|---|
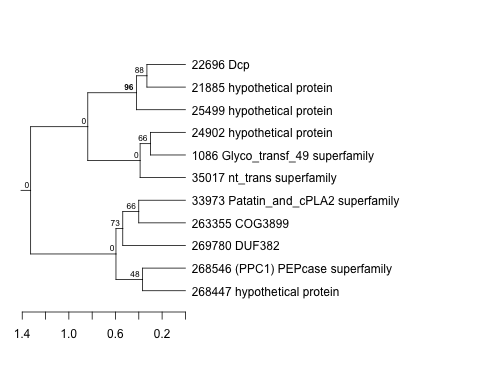
| Thaps_hclust_0157 |
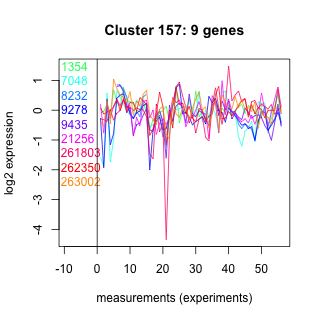 |
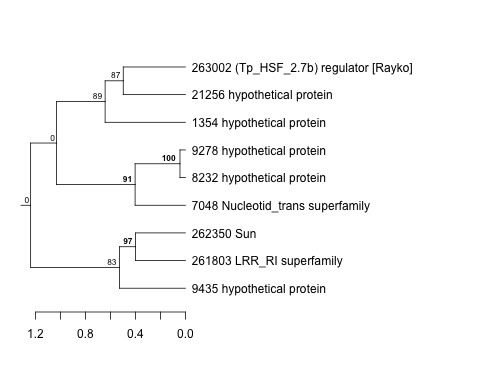 |
2 |
4.6 |
4.9 |
lowFe_KTKB_Day3 | 0.022400 | -0.826 |
| Thaps_hclust_0157 |
|
|
2 |
4.6 |
4.9 |
lowFe_TMEVA | 0.033600 | -0.801 |
| Title | Cluster Plot | Dendrogram | e-value | e-value | e-value | Condition | Condition FDR | Condition Difference |
|---|---|---|---|---|---|---|---|---|
| Thaps_hclust_0102 |
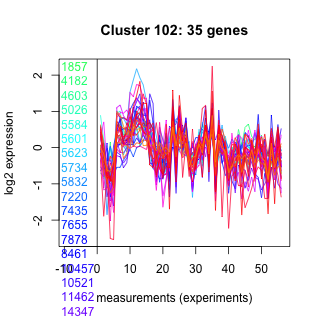 |
 |
3.2e-16 |
0.00000000002 |
0.0000006 |
lowSi_TMEVA | 0.002330 | -0.823 |
| Title | Cluster Plot | Dendrogram | e-value | e-value | e-value | Condition | Condition FDR | Condition Difference |
|---|---|---|---|---|---|---|---|---|
| Thaps_hclust_0028 |
 |
|
1.6e-27 |
6.8e-18 |
0.0000000000000078 |
lowSi_TMEVA | 0.001350 | -0.821 |
| Title | Cluster Plot | Dendrogram | e-value | e-value | e-value | Condition | Condition FDR | Condition Difference |
|---|---|---|---|---|---|---|---|---|
| Thaps_hclust_0069 |
 |
 |
1.2e-26 |
2.6e-24 |
2.4e-20 |
highpH_TMEVA | 0.000725 | -0.819 |
| Title | Cluster Plot | Dendrogram | e-value | e-value | e-value | Condition | Condition FDR | Condition Difference |
|---|---|---|---|---|---|---|---|---|
| Thaps_hclust_0141 |
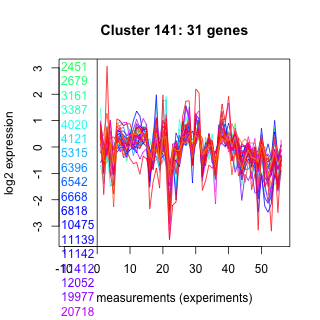 |
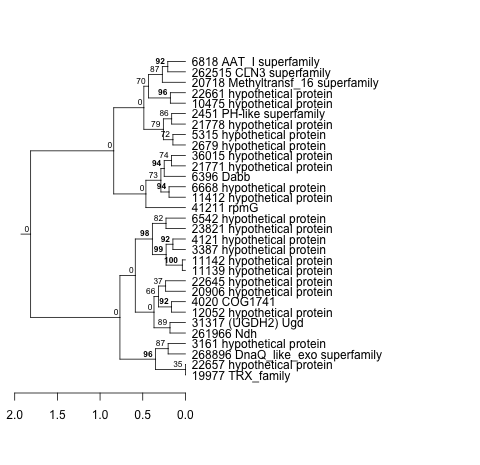 |
0.000021 |
0.0007 |
0.0051 |
diel_exponential_vs_stationary | 0.000602 | -0.818 |
| Thaps_hclust_0141 |
|
|
0.000021 |
0.0007 |
0.0051 |
lowtemp_TMEVA | 0.000735 | -0.791 |
| Title | Cluster Plot | Dendrogram | e-value | e-value | e-value | Condition | Condition FDR | Condition Difference |
|---|---|---|---|---|---|---|---|---|
| Thaps_hclust_0487 |
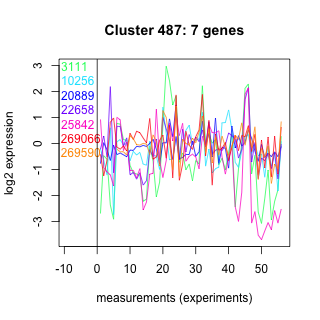 |
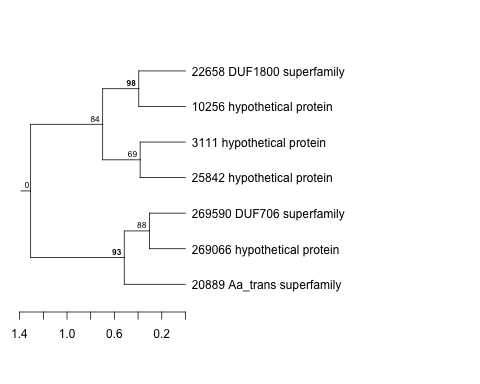 |
2.2 |
14 |
320 |
exponential_vs_stationary_24light | 0.101000 | -0.818 |
| Title | Cluster Plot | Dendrogram | e-value | e-value | e-value | Condition | Condition FDR | Condition Difference |
|---|---|---|---|---|---|---|---|---|
| Thaps_hclust_0216 |
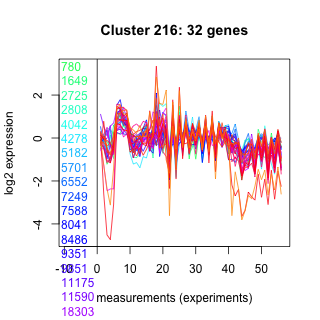 |
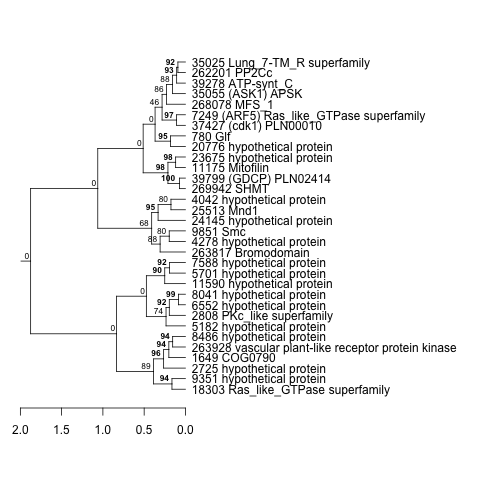 |
0.0000076 |
0.019 |
0.0036 |
lowSi_TMEVA | 0.006120 | -0.816 |
| Thaps_hclust_0216 |
|
|
0.0000076 |
0.019 |
0.0036 |
lowN_TMEVA | 0.001190 | -0.784 |
| Title | Cluster Plot | Dendrogram | e-value | e-value | e-value | Condition | Condition FDR | Condition Difference |
|---|---|---|---|---|---|---|---|---|
| Thaps_hclust_0152 |
 |
 |
0.00015 |
0.00023 |
0.031 |
BaP | 0.013800 | -0.816 |
| Thaps_hclust_0152 |
|
|
0.00015 |
0.00023 |
0.031 |
highlight_arrays | 0.000442 | -0.805 |
| Title | Cluster Plot | Dendrogram | e-value | e-value | e-value | Condition | Condition FDR | Condition Difference |
|---|---|---|---|---|---|---|---|---|
| Thaps_hclust_0313 |
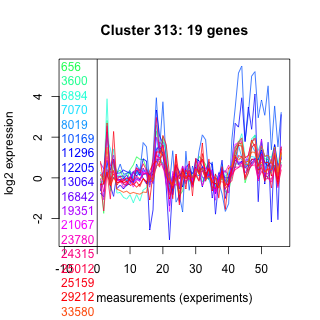 |
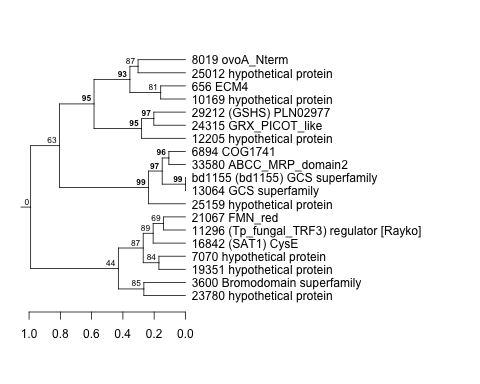 |
0.00000043 |
0.00014 |
0.00078 |
exponential_vs_stationary_24light | 0.006250 | -0.815 |
| Title | Cluster Plot | Dendrogram | e-value | e-value | e-value | Condition | Condition FDR | Condition Difference |
|---|---|---|---|---|---|---|---|---|
| Thaps_hclust_0003 |
 |
 |
0.24 |
16 |
240 |
lowFe_TMEVA | 0.001040 | -0.814 |
| Title | Cluster Plot | Dendrogram | e-value | e-value | e-value | Condition | Condition FDR | Condition Difference |
|---|---|---|---|---|---|---|---|---|
| Thaps_hclust_0093 |
 |
 |
0.0000082 |
0.022 |
0.0012 |
lowSi_TMEVA | 0.014200 | -0.812 |
| Title | Cluster Plot | Dendrogram | e-value | e-value | e-value | Condition | Condition FDR | Condition Difference |
|---|---|---|---|---|---|---|---|---|
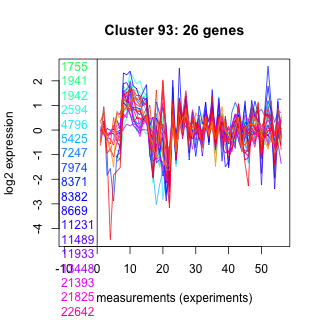
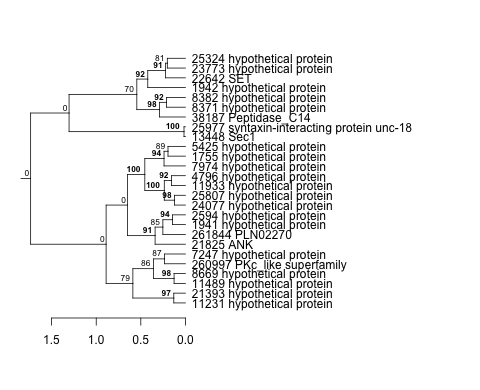
| Thaps_hclust_0361 |
 |
 |
0.00000000081 |
0.14 |
2.1 |
diel_exponential_vs_stationary | 0.000602 | -0.812 |
| Title | Cluster Plot | Dendrogram | e-value | e-value | e-value | Condition | Condition FDR | Condition Difference |
|---|---|---|---|---|---|---|---|---|
| Thaps_hclust_0438 |
 |
 |
0.0024 |
1.5 |
3.6 |
BaP | 0.000370 | -0.808 |
| Title | Cluster Plot | Dendrogram | e-value | e-value | e-value | Condition | Condition FDR | Condition Difference |
|---|---|---|---|---|---|---|---|---|
| Thaps_hclust_0032 |
 |
 |
1.3e-16 |
0.00000035 |
0.00012 |
lowSi_TMEVA | 0.004350 | -0.805 |
| Title | Cluster Plot | Dendrogram | e-value | e-value | e-value | Condition | Condition FDR | Condition Difference |
|---|---|---|---|---|---|---|---|---|
| Thaps_hclust_0308 |
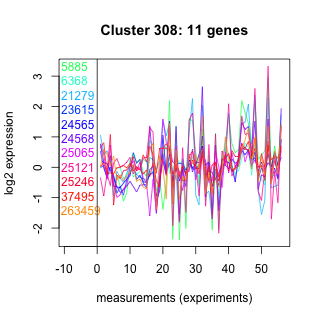 |
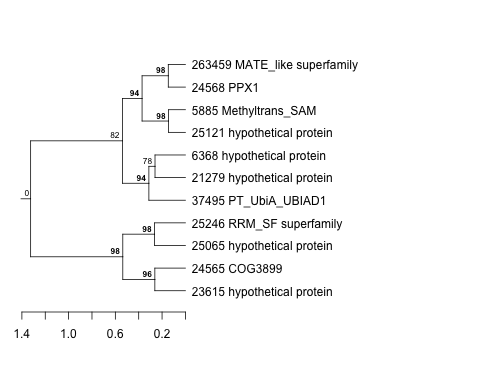 |
0.37 |
17 |
1.6 |
diel_light_vs_dark | 0.003750 | -0.804 |
| Title | Cluster Plot | Dendrogram | e-value | e-value | e-value | Condition | Condition FDR | Condition Difference |
|---|---|---|---|---|---|---|---|---|
| Thaps_hclust_0144 |
 |
 |
0.000000001 |
0.0000000019 |
0.00000019 |
diel_exponential_vs_stationary | 0.000602 | -0.804 |
| Title | Cluster Plot | Dendrogram | e-value | e-value | e-value | Condition | Condition FDR | Condition Difference |
|---|---|---|---|---|---|---|---|---|
| Thaps_hclust_0124 |
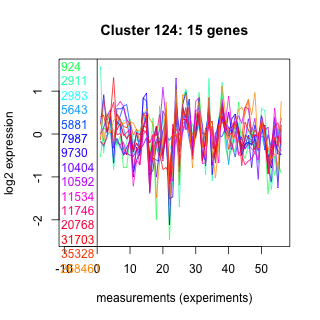 |
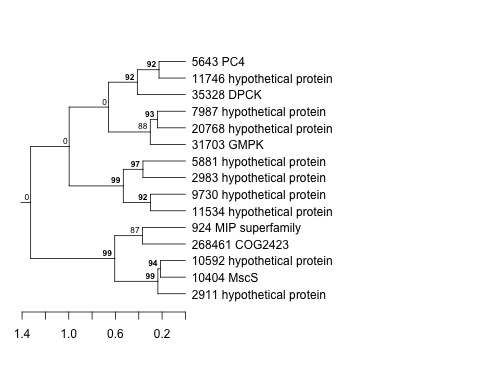 |
1 |
0.23 |
42 |
lowFe_KTKB_Day3 | 0.002990 | -0.803 |
| Title | Cluster Plot | Dendrogram | e-value | e-value | e-value | Condition | Condition FDR | Condition Difference |
|---|---|---|---|---|---|---|---|---|
| Thaps_hclust_0446 |
 |
 |
0.0000045 |
0.018 |
0.021 |
BaP | 0.000709 | -0.802 |
| Title | Cluster Plot | Dendrogram | e-value | e-value | e-value | Condition | Condition FDR | Condition Difference |
|---|---|---|---|---|---|---|---|---|
| Thaps_hclust_0324 |
 |
 |
0.0023 |
2.4 |
5.1 |
exponential_vs_stationary_24light | 0.012300 | -0.796 |
| Title | Cluster Plot | Dendrogram | e-value | e-value | e-value | Condition | Condition FDR | Condition Difference |
|---|---|---|---|---|---|---|---|---|
| Thaps_hclust_0383 |
 |
 |
0.00049 |
0.088 |
0.58 |
exponential_vs_stationary_24light | 0.003090 | -0.796 |
| Title | Cluster Plot | Dendrogram | e-value | e-value | e-value | Condition | Condition FDR | Condition Difference |
|---|---|---|---|---|---|---|---|---|
| Thaps_hclust_0482 |
 |
 |
0.29 |
0.69 |
2.1 |
exponential_vs_stationary_24light | 0.000581 | -0.793 |
| Title | Cluster Plot | Dendrogram | e-value | e-value | e-value | Condition | Condition FDR | Condition Difference |
|---|---|---|---|---|---|---|---|---|
| Thaps_hclust_0019 |
 |
 |
0.0000001 |
0.00000017 |
0.000037 |
lowN_TMEVA | 0.006600 | -0.793 |
| Title | Cluster Plot | Dendrogram | e-value | e-value | e-value | Condition | Condition FDR | Condition Difference |
|---|---|---|---|---|---|---|---|---|
| Thaps_hclust_0475 |
 |
 |
0.011 |
0.95 |
0.77 |
BaP | 0.000370 | -0.791 |
| Title | Cluster Plot | Dendrogram | e-value | e-value | e-value | Condition | Condition FDR | Condition Difference |
|---|---|---|---|---|---|---|---|---|
| Thaps_hclust_0026 |
 |
 |
0.0021 |
0.16 |
0.32 |
lowN_TMEVA | 0.057000 | -0.79 |
| Title | Cluster Plot | Dendrogram | e-value | e-value | e-value | Condition | Condition FDR | Condition Difference |
|---|---|---|---|---|---|---|---|---|
| Thaps_hclust_0235 |
 |
 |
0.47 |
5.6 |
74 |
diel_light_vs_dark | 0.004510 | -0.789 |
| Title | Cluster Plot | Dendrogram | e-value | e-value | e-value | Condition | Condition FDR | Condition Difference |
|---|---|---|---|---|---|---|---|---|
| Thaps_hclust_0145 |
 |
 |
0.015 |
1.6 |
11 |
lowFe_KTKB_Day3 | 0.057400 | -0.789 |
| Title | Cluster Plot | Dendrogram | e-value | e-value | e-value | Condition | Condition FDR | Condition Difference |
|---|---|---|---|---|---|---|---|---|
| Thaps_hclust_0256 |
 |
 |
0.0000000000016 |
0.0000000000033 |
0.0000000000017 |
highlight_arrays | 0.000442 | -0.787 |
| Title | Cluster Plot | Dendrogram | e-value | e-value | e-value | Condition | Condition FDR | Condition Difference |
|---|---|---|---|---|---|---|---|---|
| Thaps_hclust_0485 |
 |
 |
0.0012 |
0.0078 |
0.16 |
BaP | 0.000370 | -0.787 |
| Title | Cluster Plot | Dendrogram | e-value | e-value | e-value | Condition | Condition FDR | Condition Difference |
|---|---|---|---|---|---|---|---|---|
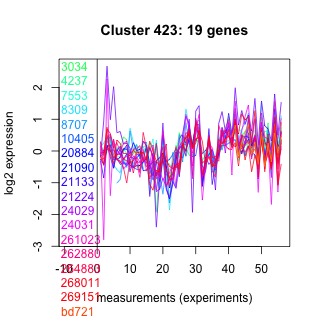
| Thaps_hclust_0423 |
 |
 |
0.00046 |
0.13 |
9.2 |
diel_exponential_vs_stationary | 0.000602 | -0.786 |
| Title | Cluster Plot | Dendrogram | e-value | e-value | e-value | Condition | Condition FDR | Condition Difference |
|---|---|---|---|---|---|---|---|---|
| Thaps_hclust_0024 |
 |
|
2.8e-19 |
1.2e-20 |
0.00000000000043 |
highlight_arrays | 0.000442 | -0.785 |
| Title | Cluster Plot | Dendrogram | e-value | e-value | e-value | Condition | Condition FDR | Condition Difference |
|---|---|---|---|---|---|---|---|---|
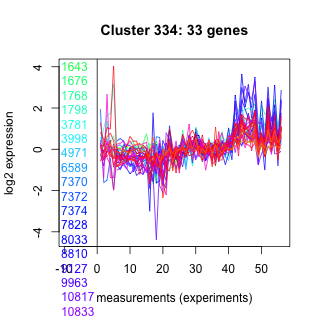
| Thaps_hclust_0334 |
 |
 |
0.51 |
0.00047 |
0.25 |
exponential_vs_stationary_24light | 0.001120 | -0.785 |
| Title | Cluster Plot | Dendrogram | e-value | e-value | e-value | Condition | Condition FDR | Condition Difference |
|---|---|---|---|---|---|---|---|---|
| Thaps_hclust_0384 |
 |
 |
0.0000000074 |
0.000000031 |
0.12 |
BaP | 0.000370 | -0.782 |
| Title | Cluster Plot | Dendrogram | e-value | e-value | e-value | Condition | Condition FDR | Condition Difference |
|---|---|---|---|---|---|---|---|---|
| Thaps_hclust_0364 |
 |
 |
4.5 |
28 |
590 |
BaP | 0.007340 | -0.782 |
| Title | Cluster Plot | Dendrogram | e-value | e-value | e-value | Condition | Condition FDR | Condition Difference |
|---|---|---|---|---|---|---|---|---|
| Thaps_hclust_0215 |
 |
 |
0.000036 |
0.0000076 |
0.000057 |
lowtemp_TMEVA | 0.000735 | -0.78 |