Hierarchical Clusters
Displaying 301 - 400 of 7500
| Title | Cluster Plot | Dendrogram | e-value | e-value | e-value | Condition | Condition FDR | Condition Difference |
|---|---|---|---|---|---|---|---|---|
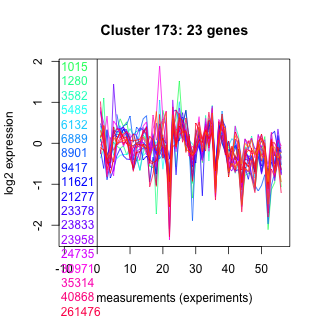
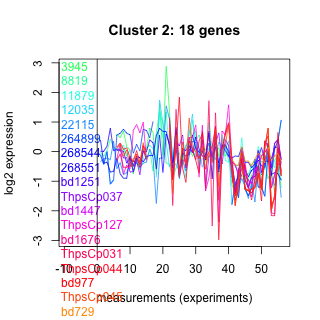
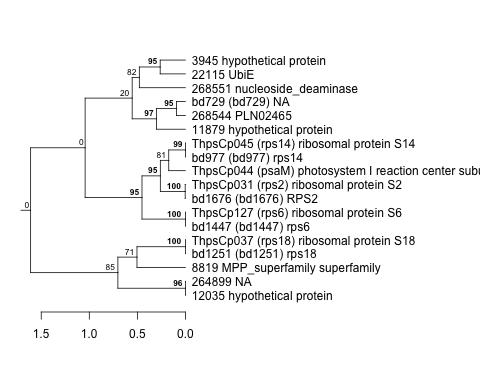
| Thaps_hclust_0173 |
 |
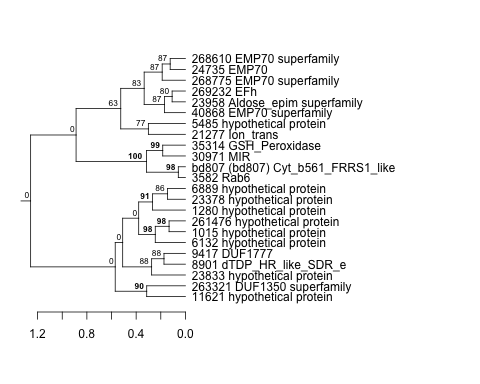 |
0.013 |
0.83 |
0.45 |
co2_elevated_expo_arrays | 0.985000 | -0.00885 |
| Title | Cluster Plot | Dendrogram | e-value | e-value | e-value | Condition | Condition FDR | Condition Difference |
|---|---|---|---|---|---|---|---|---|
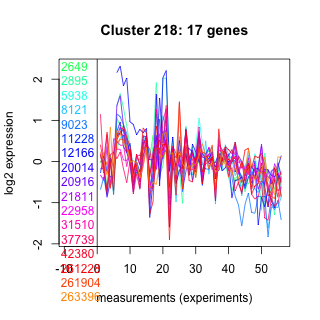
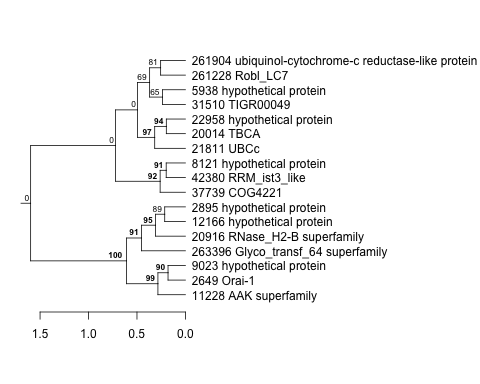
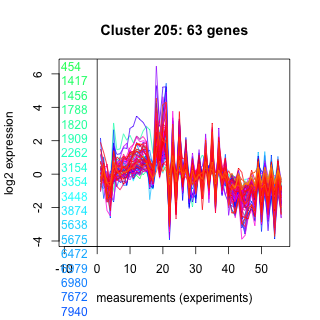
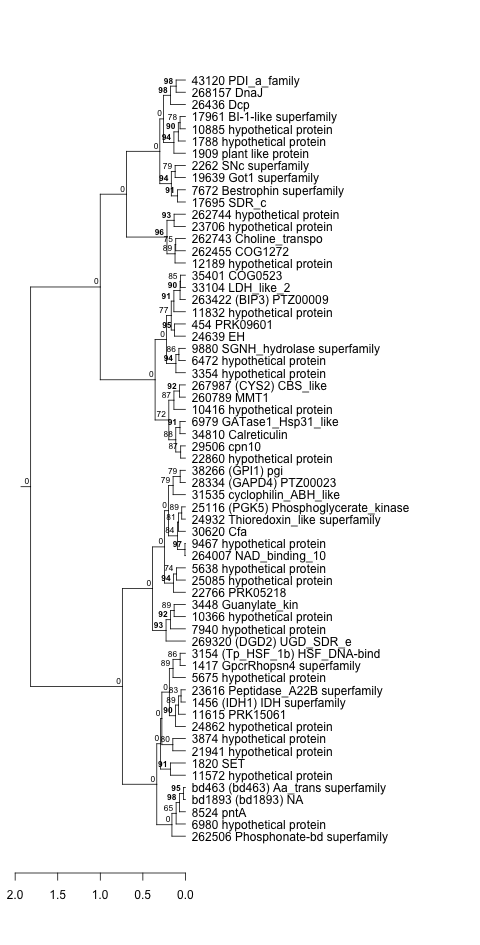
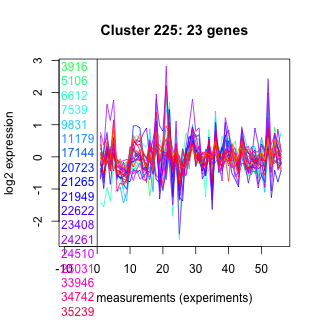
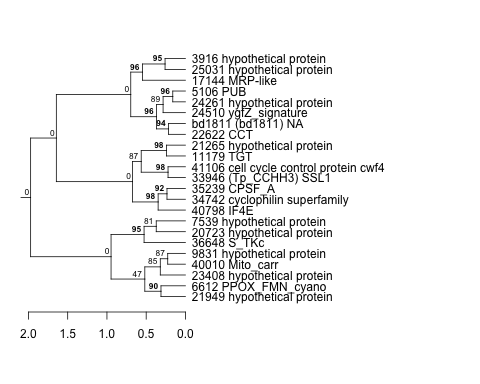
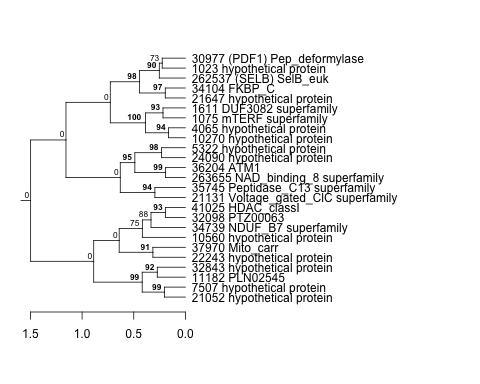
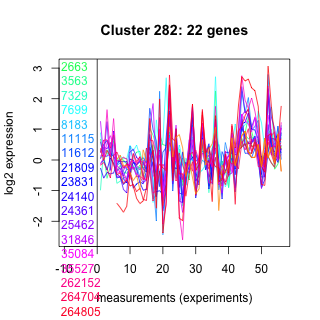
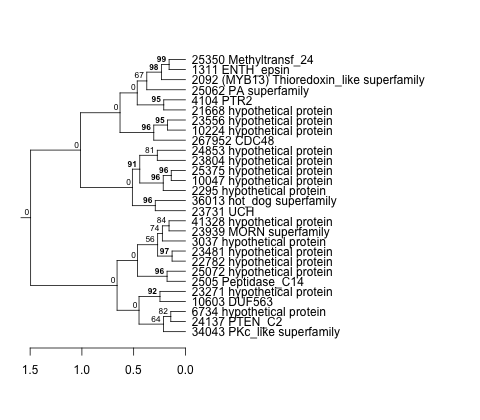
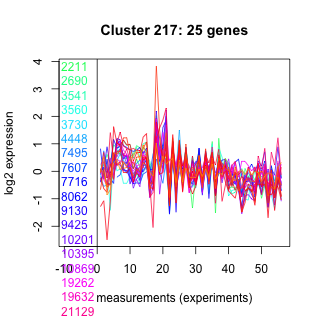
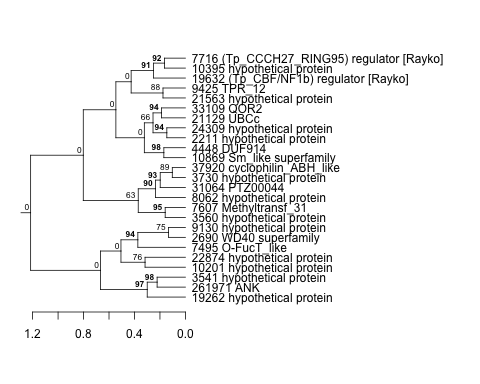
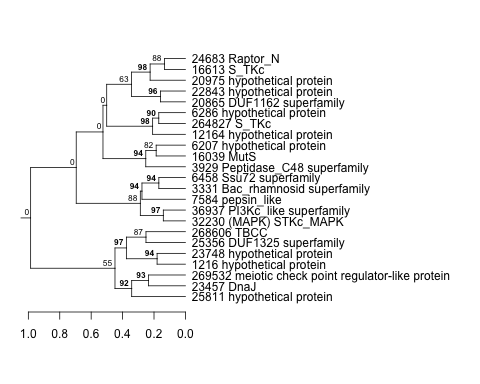
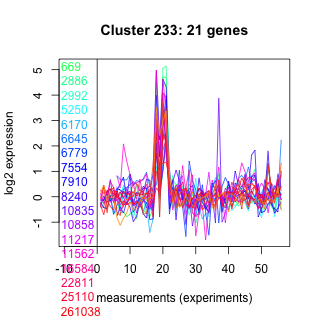
| Thaps_hclust_0208 |
 |
|
1.2e-20 |
0.0000000000000057 |
0.0000000099 |
co2_elevated_expo_arrays | 0.985000 | -0.014 |
| Title | Cluster Plot | Dendrogram | e-value | e-value | e-value | Condition | Condition FDR | Condition Difference |
|---|---|---|---|---|---|---|---|---|
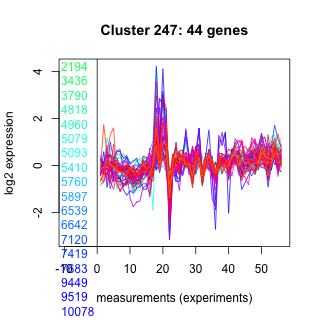
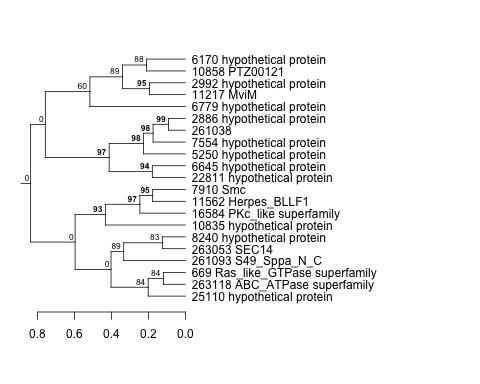
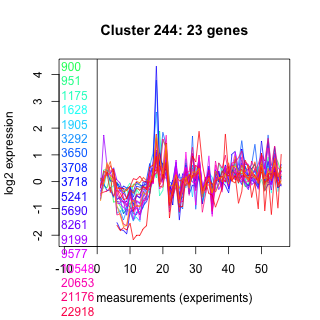
| Thaps_hclust_0247 |
 |
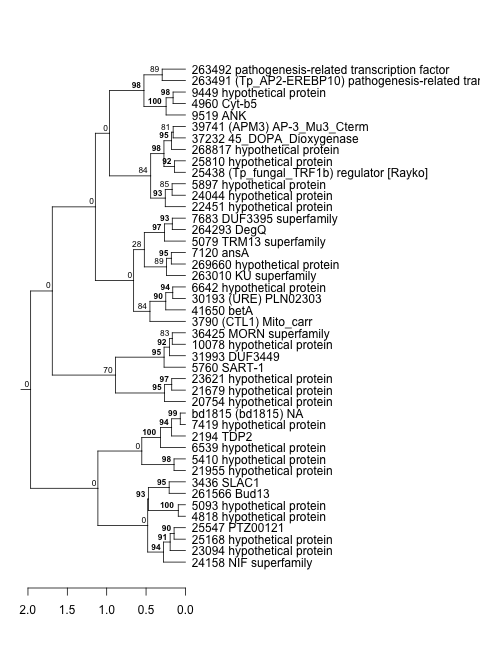 |
8.7e-16 |
0.00000000045 |
0.0000019 |
lowFe_KTKB_Day5 | 0.985000 | 0.0036 |
| Title | Cluster Plot | Dendrogram | e-value | e-value | e-value | Condition | Condition FDR | Condition Difference |
|---|---|---|---|---|---|---|---|---|
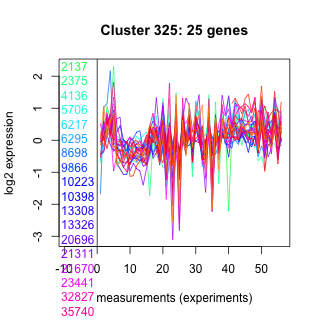
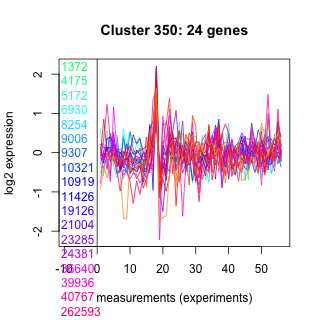
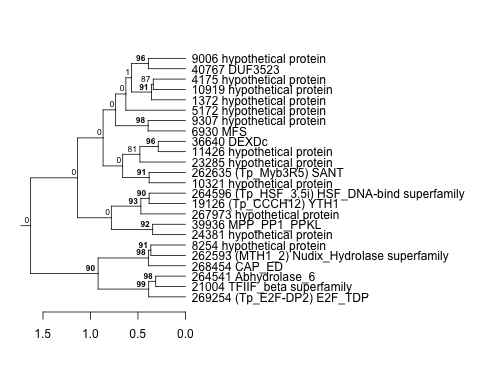
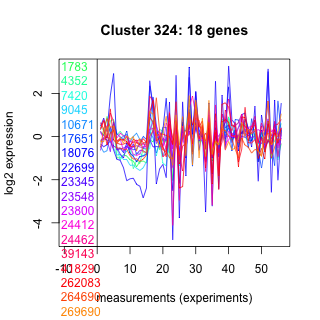
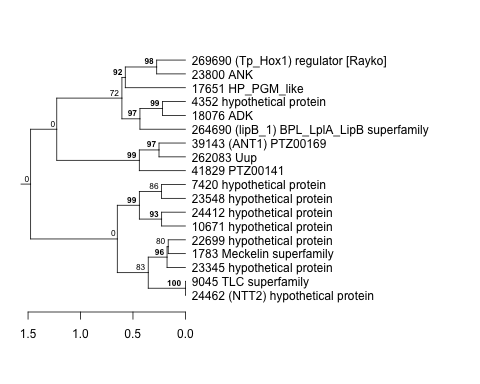
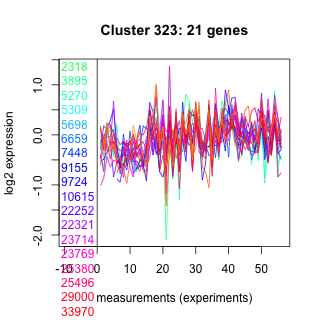
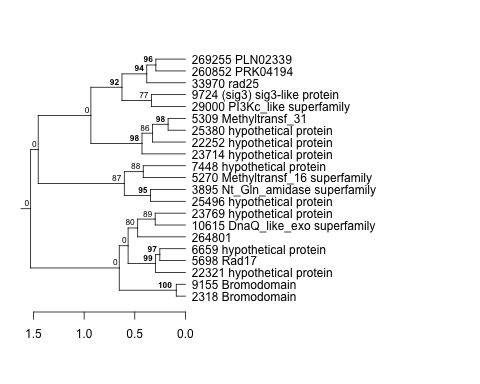
| Thaps_hclust_0325 |
 |
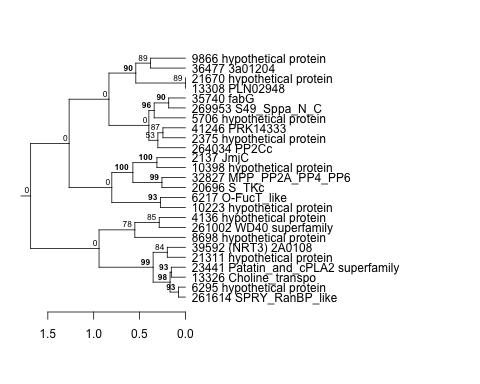 |
0.00000000000002 |
0.000000076 |
0.17 |
co2_elevated_expo_arrays | 0.985000 | 0.0138 |
| Title | Cluster Plot | Dendrogram | e-value | e-value | e-value | Condition | Condition FDR | Condition Difference |
|---|---|---|---|---|---|---|---|---|
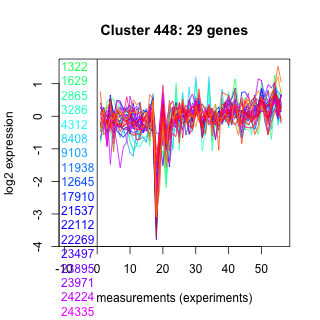
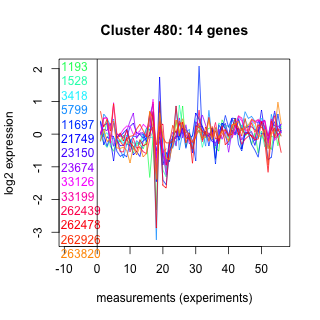
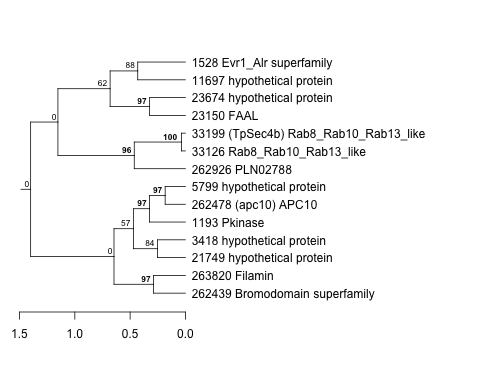
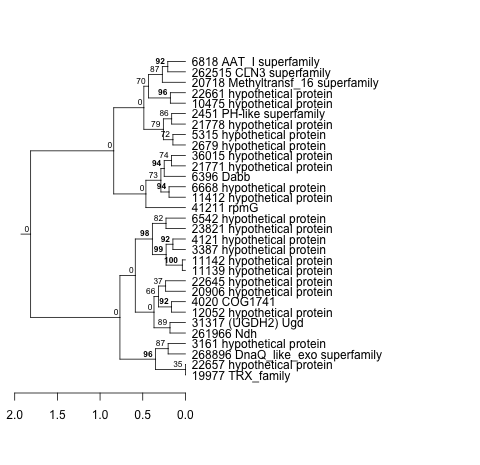
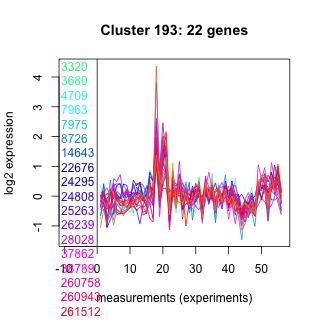
| Thaps_hclust_0448 |
 |
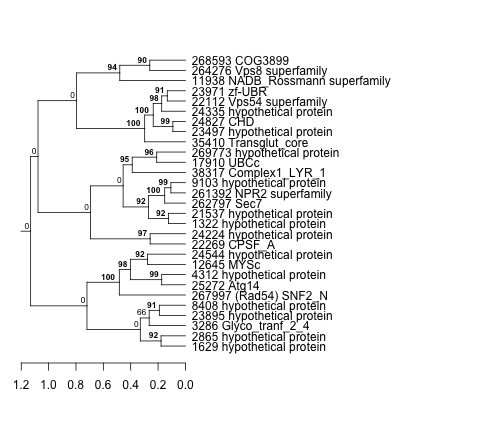 |
0.0000000026 |
0.00021 |
8.2 |
co2_elevated_expo_arrays | 0.985000 | -0.0106 |
| Title | Cluster Plot | Dendrogram | e-value | e-value | e-value | Condition | Condition FDR | Condition Difference |
|---|---|---|---|---|---|---|---|---|
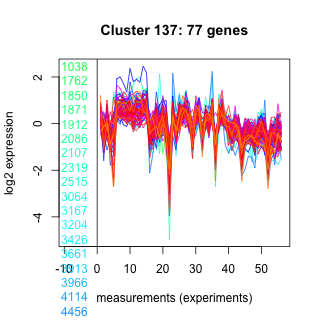
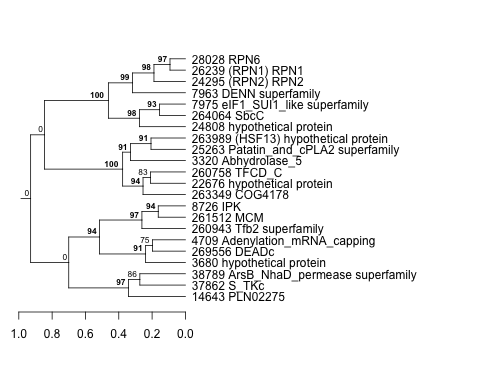
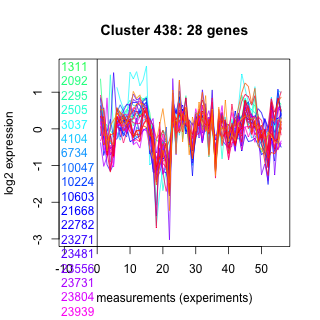
| Thaps_hclust_0137 |
 |
|
2.3e-18 |
0.00000000000062 |
0.000025 |
co2_elevated_expo_arrays | 0.985000 | 0.0109 |
| Title | Cluster Plot | Dendrogram | e-value | e-value | e-value | Condition | Condition FDR | Condition Difference |
|---|---|---|---|---|---|---|---|---|
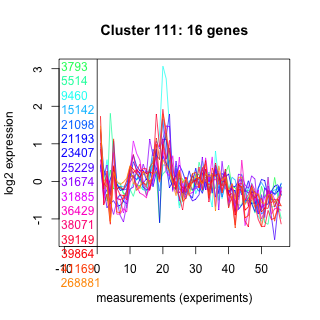
| Thaps_hclust_0111 |
 |
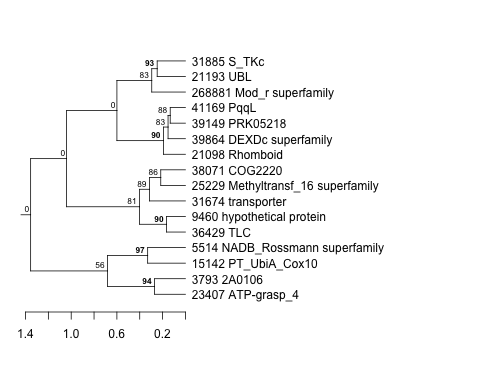 |
0.00032 |
0.0074 |
0.8 |
diel_light_vs_dark | 0.985000 | -0.00665 |
| Title | Cluster Plot | Dendrogram | e-value | e-value | e-value | Condition | Condition FDR | Condition Difference |
|---|---|---|---|---|---|---|---|---|
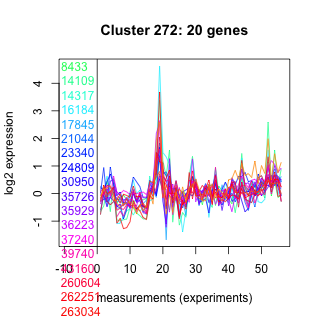
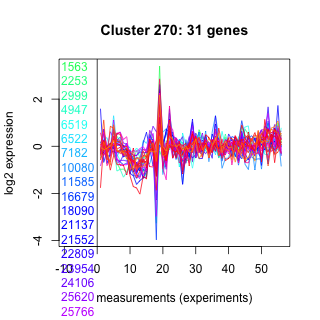
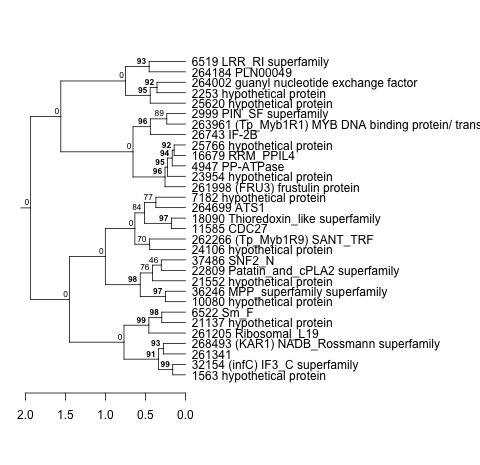
| Thaps_hclust_0272 |
 |
 |
0.0048 |
0.01 |
0.059 |
co2_elevated_expo_arrays | 0.985000 | 0.0108 |
| Title | Cluster Plot | Dendrogram | e-value | e-value | e-value | Condition | Condition FDR | Condition Difference |
|---|---|---|---|---|---|---|---|---|
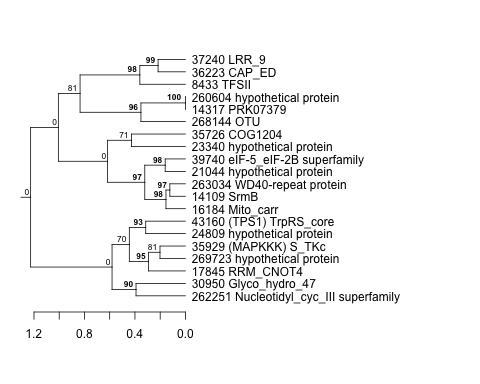
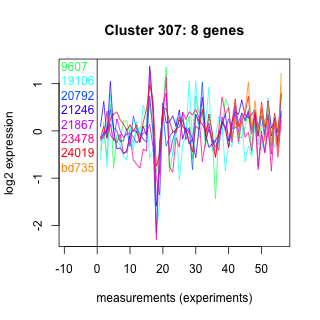
| Thaps_hclust_0307 |
 |
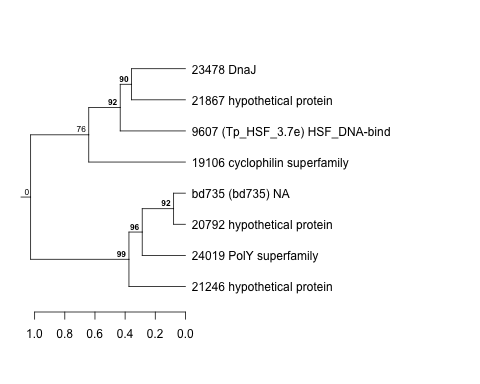 |
46 |
50 |
580 |
co2_elevated_expo_arrays | 0.985000 | -0.00834 |
| Title | Cluster Plot | Dendrogram | e-value | e-value | e-value | Condition | Condition FDR | Condition Difference |
|---|---|---|---|---|---|---|---|---|
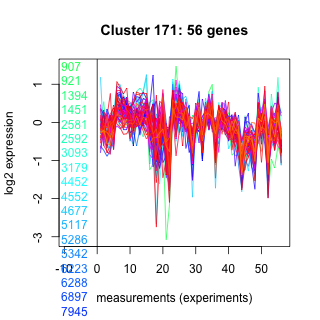
| Thaps_hclust_0171 |
 |
 |
0.0000000000052 |
0.000000000056 |
0.000000000083 |
co2_elevated_expo_arrays | 0.985000 | 0.00856 |
| Title | Cluster Plot | Dendrogram | e-value | e-value | e-value | Condition | Condition FDR | Condition Difference |
|---|---|---|---|---|---|---|---|---|
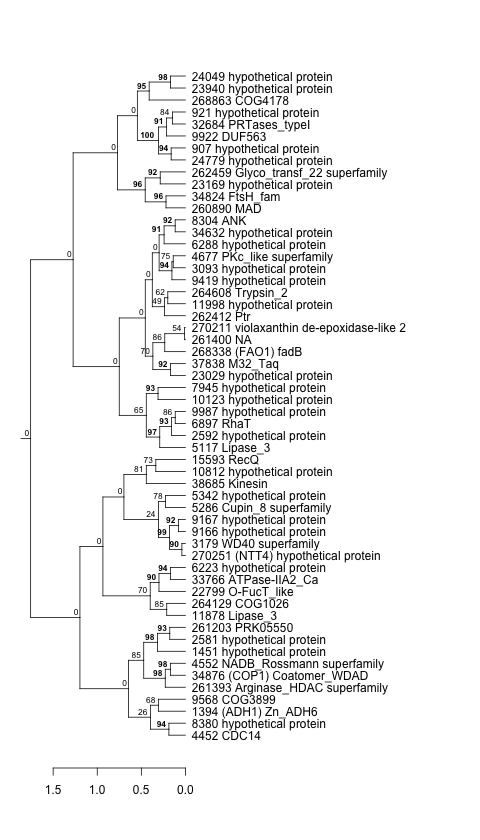
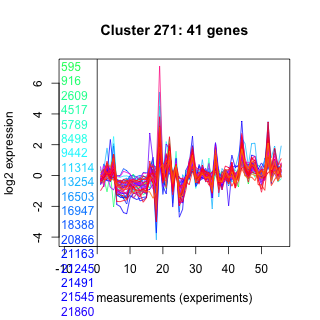
| Thaps_hclust_0271 |
 |
 |
Not available | Not available | Not available | co2_elevated_expo_arrays | 0.985000 | -0.00829 |
| Title | Cluster Plot | Dendrogram | e-value | e-value | e-value | Condition | Condition FDR | Condition Difference |
|---|---|---|---|---|---|---|---|---|
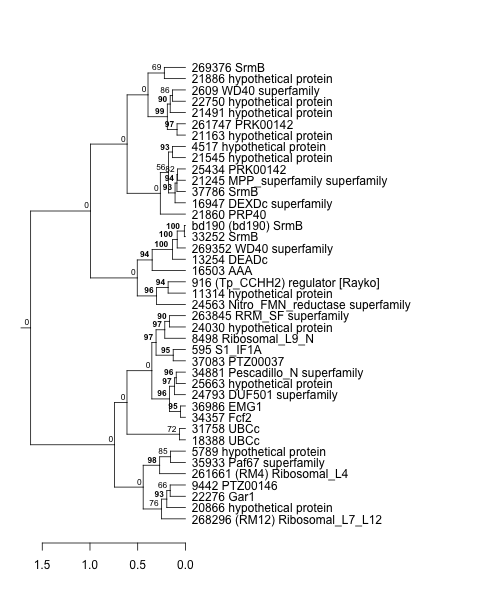
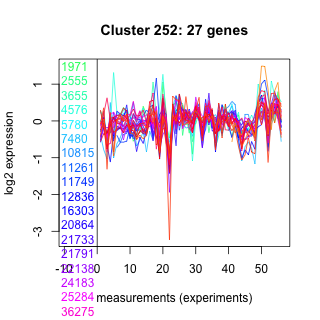
| Thaps_hclust_0252 |
 |
 |
0.000053 |
0.0057 |
2.1 |
co2_elevated_expo_arrays | 0.985000 | -0.0101 |
| Title | Cluster Plot | Dendrogram | e-value | e-value | e-value | Condition | Condition FDR | Condition Difference |
|---|---|---|---|---|---|---|---|---|
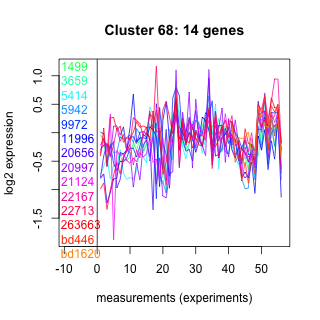
| Thaps_hclust_0068 |
 |
 |
0.34 |
36 |
100 |
co2_elevated_expo_arrays | 0.985000 | -0.00972 |
| Thaps_hclust_0068 |
|
|
0.34 |
36 |
100 |
lowFe_KTKB_Day3 | 0.978000 | -0.00927 |
| Title | Cluster Plot | Dendrogram | e-value | e-value | e-value | Condition | Condition FDR | Condition Difference |
|---|---|---|---|---|---|---|---|---|
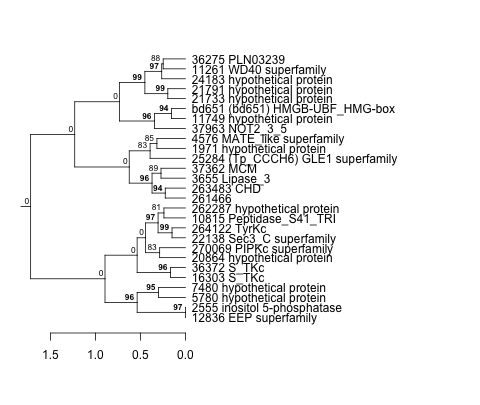
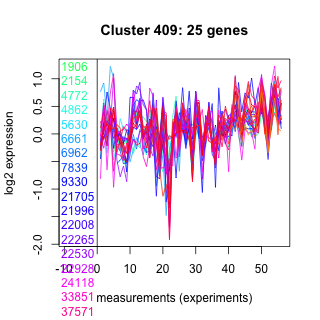
| Thaps_hclust_0409 |
 |
 |
0.0000000066 |
0.0028 |
0.21 |
co2_elevated_expo_arrays | 0.985000 | -0.00796 |
| Title | Cluster Plot | Dendrogram | e-value | e-value | e-value | Condition | Condition FDR | Condition Difference |
|---|---|---|---|---|---|---|---|---|
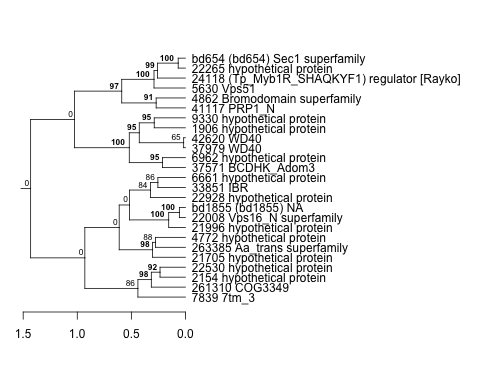
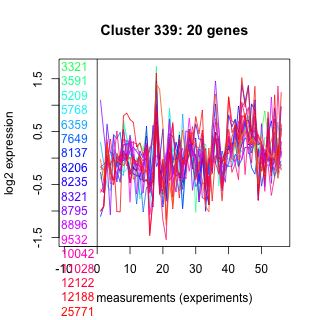
| Thaps_hclust_0339 |
 |
 |
0.000016 |
0.00038 |
0.0017 |
co2_elevated_expo_arrays | 0.985000 | -0.0171 |
| Title | Cluster Plot | Dendrogram | e-value | e-value | e-value | Condition | Condition FDR | Condition Difference |
|---|---|---|---|---|---|---|---|---|
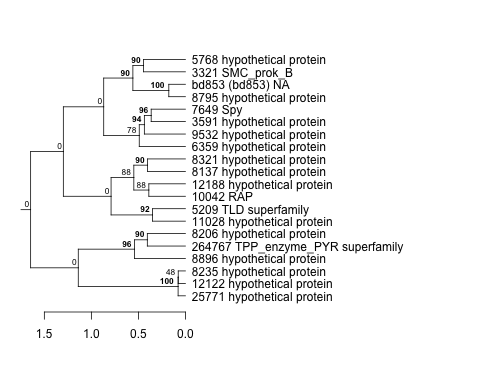
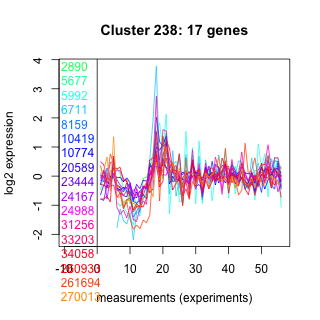
| Thaps_hclust_0238 |
 |
 |
0.0018 |
0.095 |
0.069 |
lowSi_TMEVA | 0.984000 | -0.106 |
| Title | Cluster Plot | Dendrogram | e-value | e-value | e-value | Condition | Condition FDR | Condition Difference |
|---|---|---|---|---|---|---|---|---|
| Thaps_hclust_0389 |
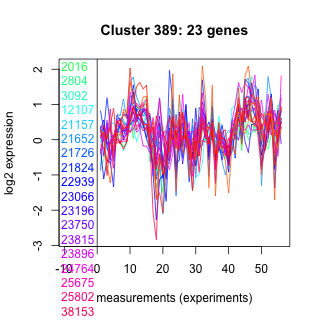 |
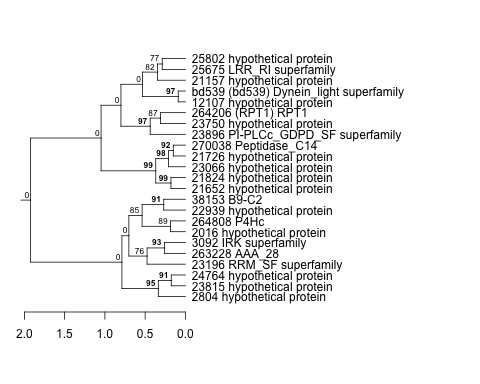 |
0.00000008 |
0.00077 |
340 |
highpH_TMEVA | 0.984000 | -0.00695 |
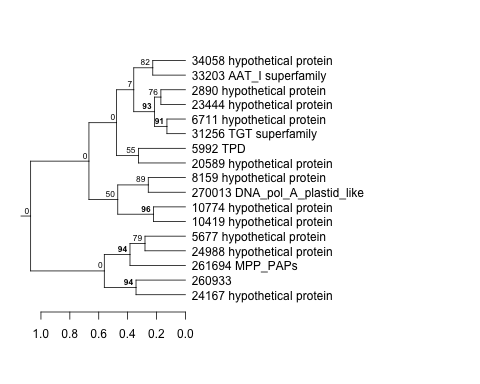
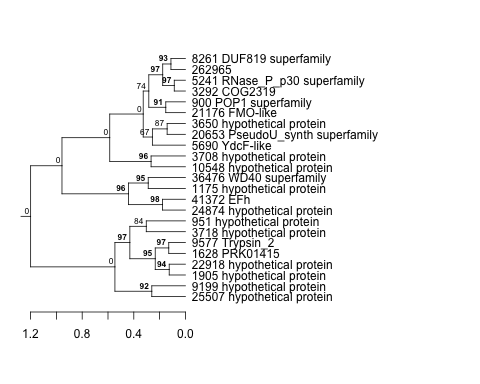
| Title | Cluster Plot | Dendrogram | e-value | e-value | e-value | Condition | Condition FDR | Condition Difference |
|---|---|---|---|---|---|---|---|---|
| Thaps_hclust_0148 |
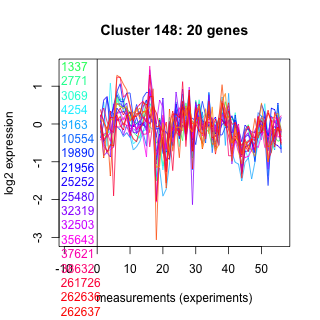 |
 |
4.7 |
39 |
51 |
highpH_TMEVA | 0.984000 | 0.00668 |
| Title | Cluster Plot | Dendrogram | e-value | e-value | e-value | Condition | Condition FDR | Condition Difference |
|---|---|---|---|---|---|---|---|---|
| Thaps_hclust_0132 |
 |
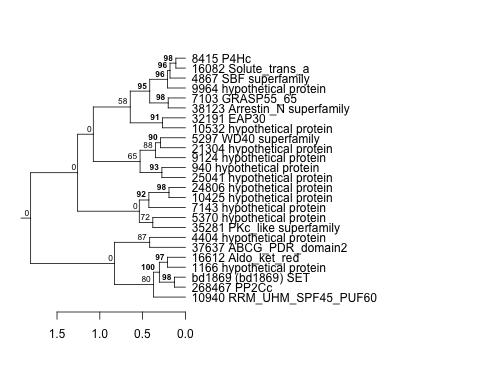 |
0.00017 |
0.000096 |
26 |
co2_elevated_expo_arrays | 0.984000 | -0.0173 |
| Title | Cluster Plot | Dendrogram | e-value | e-value | e-value | Condition | Condition FDR | Condition Difference |
|---|---|---|---|---|---|---|---|---|
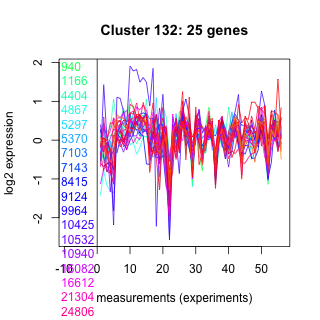
| Thaps_hclust_0299 |
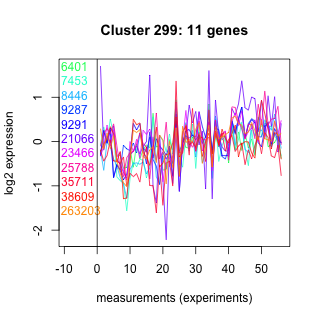 |
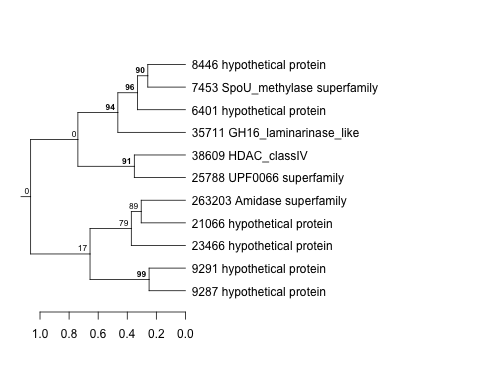 |
0.0056 |
1.7 |
6.7 |
exponential_vs_stationary_24light | 0.984000 | -0.0124 |
| Thaps_hclust_0299 |
|
|
0.0056 |
1.7 |
6.7 |
lowSi_TMEVA | 0.976000 | 0.12 |
| Title | Cluster Plot | Dendrogram | e-value | e-value | e-value | Condition | Condition FDR | Condition Difference |
|---|---|---|---|---|---|---|---|---|
| Thaps_hclust_0109 |
 |
 |
17 |
32 |
5.5 |
exponential_vs_stationary_24light | 0.984000 | -0.0077 |
| Title | Cluster Plot | Dendrogram | e-value | e-value | e-value | Condition | Condition FDR | Condition Difference |
|---|---|---|---|---|---|---|---|---|
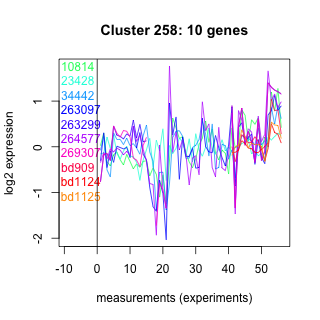
| Thaps_hclust_0258 |
 |
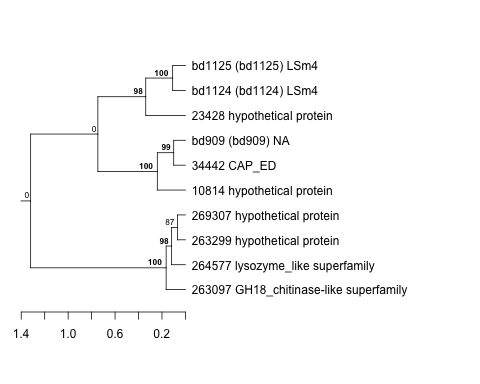 |
0.027 |
0.021 |
0.036 |
exponential_vs_stationary_24light | 0.984000 | 0.0102 |
| Title | Cluster Plot | Dendrogram | e-value | e-value | e-value | Condition | Condition FDR | Condition Difference |
|---|---|---|---|---|---|---|---|---|
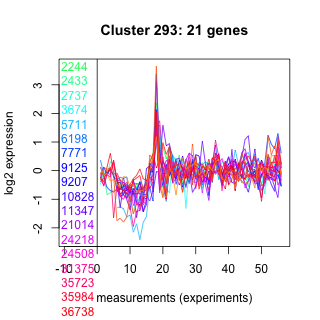
| Thaps_hclust_0293 |
 |
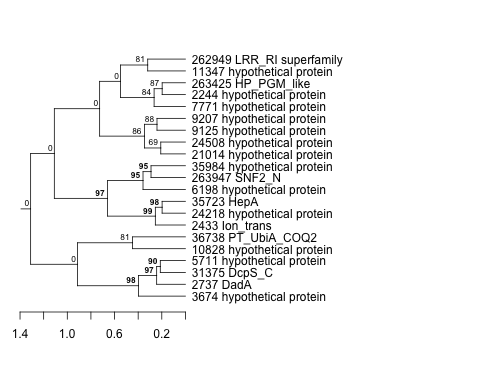 |
0.16 |
120 |
360 |
exponential_vs_stationary_24light | 0.984000 | 0.00638 |
| Title | Cluster Plot | Dendrogram | e-value | e-value | e-value | Condition | Condition FDR | Condition Difference |
|---|---|---|---|---|---|---|---|---|
| Thaps_hclust_0002 |
 |
 |
0.00000029 |
0.000000009 |
0.000055 |
exponential_vs_stationary_24light | 0.984000 | 0.00827 |
| Title | Cluster Plot | Dendrogram | e-value | e-value | e-value | Condition | Condition FDR | Condition Difference |
|---|---|---|---|---|---|---|---|---|
| Thaps_hclust_0195 |
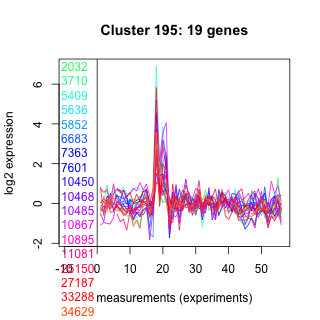 |
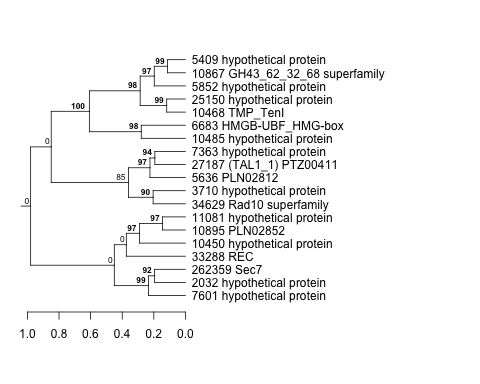 |
0.0031 |
0.024 |
0.00037 |
lowSi_TMEVA | 0.984000 | -0.106 |
| Title | Cluster Plot | Dendrogram | e-value | e-value | e-value | Condition | Condition FDR | Condition Difference |
|---|---|---|---|---|---|---|---|---|
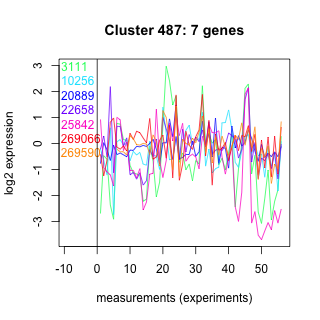
| Thaps_hclust_0487 |
 |
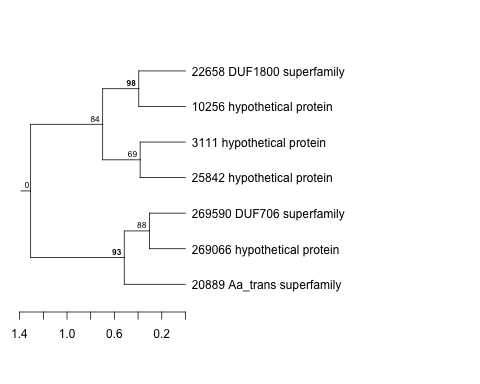 |
2.2 |
14 |
320 |
lowSi_TMEVA | 0.984000 | -0.101 |
| Title | Cluster Plot | Dendrogram | e-value | e-value | e-value | Condition | Condition FDR | Condition Difference |
|---|---|---|---|---|---|---|---|---|
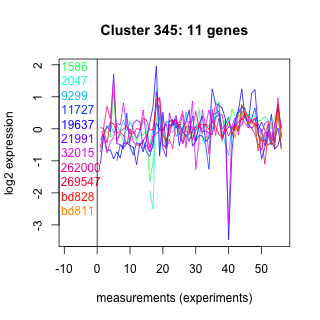
| Thaps_hclust_0345 |
 |
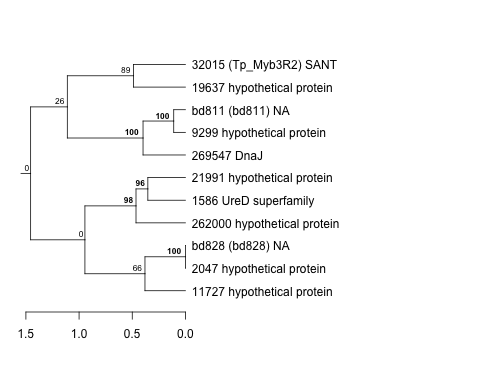 |
1.1 |
7 |
2.7 |
lowSi_TMEVA | 0.984000 | -0.101 |
| Title | Cluster Plot | Dendrogram | e-value | e-value | e-value | Condition | Condition FDR | Condition Difference |
|---|---|---|---|---|---|---|---|---|
| Thaps_hclust_0050 |
 |
 |
0.0000000011 |
0.0000042 |
0.00021 |
lowFe_TMEVA | 0.984000 | 0.014 |
| Thaps_hclust_0050 |
|
|
0.0000000011 |
0.0000042 |
0.00021 |
lowSi_TMEVA | 0.983000 | -0.11 |
| Title | Cluster Plot | Dendrogram | e-value | e-value | e-value | Condition | Condition FDR | Condition Difference |
|---|---|---|---|---|---|---|---|---|
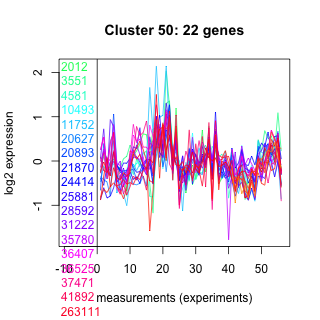
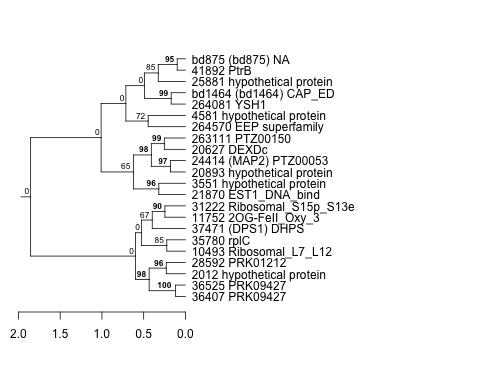
| Thaps_hclust_0479 |
 |
 |
0.11 |
0.2 |
1.5 |
highpH_TMEVA | 0.984000 | -0.00683 |
| Title | Cluster Plot | Dendrogram | e-value | e-value | e-value | Condition | Condition FDR | Condition Difference |
|---|---|---|---|---|---|---|---|---|
| Thaps_hclust_0428 |
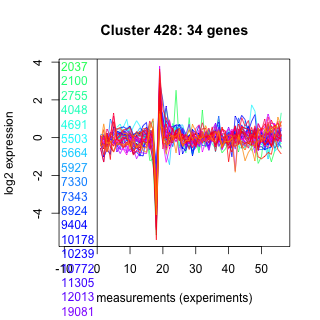 |
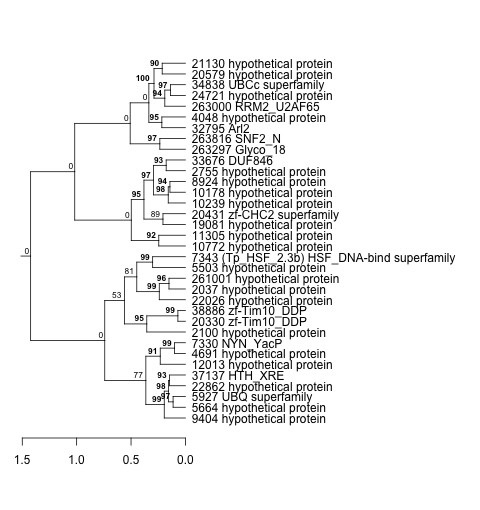 |
0.000000076 |
0.015 |
1.9 |
lowSi_TMEVA | 0.983000 | -0.124 |
| Title | Cluster Plot | Dendrogram | e-value | e-value | e-value | Condition | Condition FDR | Condition Difference |
|---|---|---|---|---|---|---|---|---|
| Thaps_hclust_0336 |
 |
 |
8.7e-23 |
0.00000000000015 |
0.0000000000000032 |
lowSi_TMEVA | 0.983000 | 0.102 |
| Title | Cluster Plot | Dendrogram | e-value | e-value | e-value | Condition | Condition FDR | Condition Difference |
|---|---|---|---|---|---|---|---|---|
| Thaps_hclust_0482 |
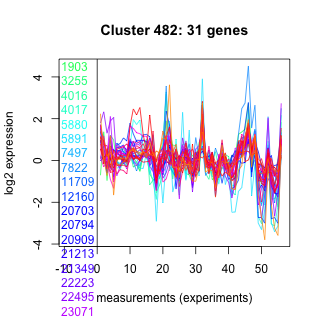 |
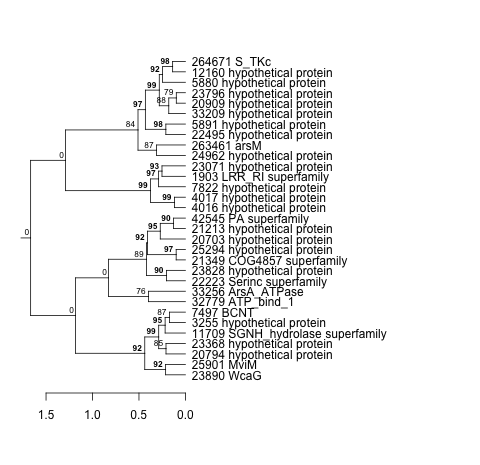 |
0.29 |
0.69 |
2.1 |
BaP | 0.983000 | -0.00611 |
| Title | Cluster Plot | Dendrogram | e-value | e-value | e-value | Condition | Condition FDR | Condition Difference |
|---|---|---|---|---|---|---|---|---|
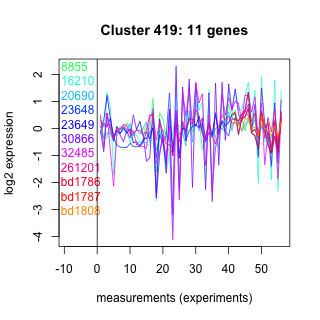
| Thaps_hclust_0419 |
 |
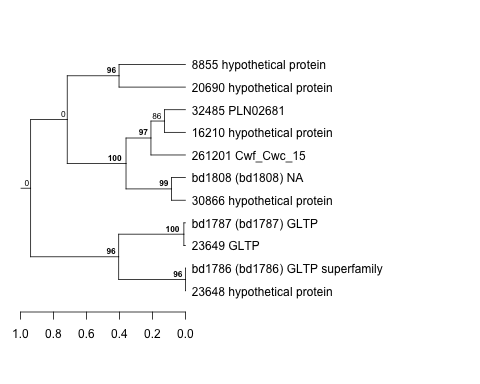 |
0.0014 |
0.00031 |
0.0014 |
lowSi_TMEVA | 0.983000 | 0.106 |
| Title | Cluster Plot | Dendrogram | e-value | e-value | e-value | Condition | Condition FDR | Condition Difference |
|---|---|---|---|---|---|---|---|---|
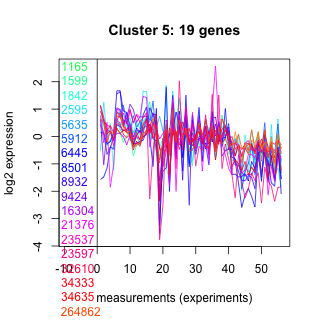
| Thaps_hclust_0005 |
 |
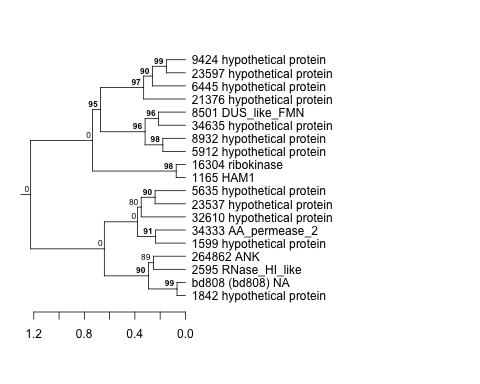 |
0.00013 |
0.0027 |
2 |
lowSi_TMEVA | 0.983000 | -0.112 |
| Thaps_hclust_0005 |
|
|
0.00013 |
0.0027 |
2 |
diel_exponential_vs_stationary | 0.976000 | -0.00769 |
| Title | Cluster Plot | Dendrogram | e-value | e-value | e-value | Condition | Condition FDR | Condition Difference |
|---|---|---|---|---|---|---|---|---|
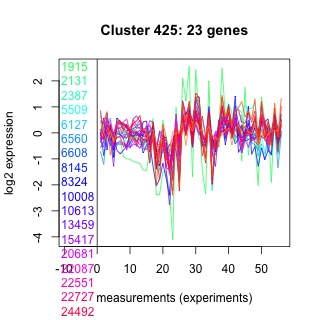
| Thaps_hclust_0425 |
 |
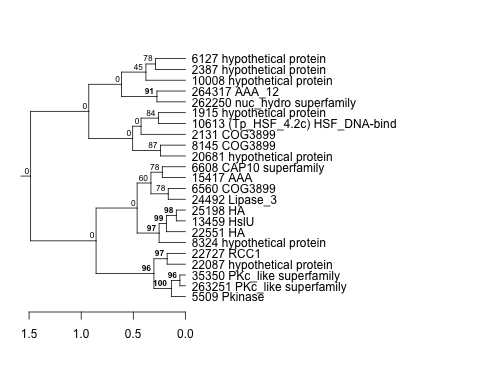 |
0.017 |
1.1 |
140 |
highpH_TMEVA | 0.982000 | -0.00791 |
| Title | Cluster Plot | Dendrogram | e-value | e-value | e-value | Condition | Condition FDR | Condition Difference |
|---|---|---|---|---|---|---|---|---|
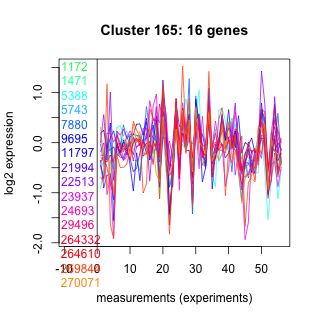
| Thaps_hclust_0165 |
 |
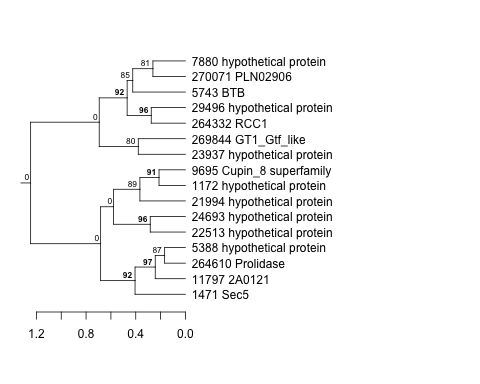 |
0.00011 |
2.3 |
3.9 |
exponential_vs_stationary_24light | 0.982000 | 0.0125 |
| Title | Cluster Plot | Dendrogram | e-value | e-value | e-value | Condition | Condition FDR | Condition Difference |
|---|---|---|---|---|---|---|---|---|
| Thaps_hclust_0186 |
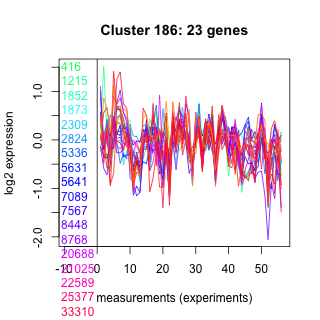 |
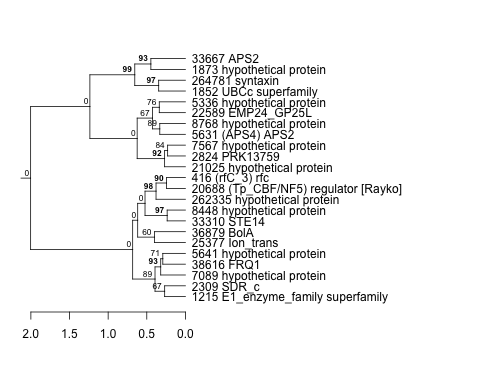 |
0.0000000043 |
0.006 |
0.0000084 |
highlight_arrays | 0.982000 | 0.00356 |
| Title | Cluster Plot | Dendrogram | e-value | e-value | e-value | Condition | Condition FDR | Condition Difference |
|---|---|---|---|---|---|---|---|---|
| Thaps_hclust_0477 |
 |
 |
0.02 |
0.011 |
0.071 |
diel_exponential_vs_stationary | 0.982000 | -0.00961 |
| Thaps_hclust_0477 |
|
|
0.02 |
0.011 |
0.071 |
lowSi_TMEVA | 0.976000 | -0.112 |
| Title | Cluster Plot | Dendrogram | e-value | e-value | e-value | Condition | Condition FDR | Condition Difference |
|---|---|---|---|---|---|---|---|---|
| Thaps_hclust_0039 |
 |
 |
2.2e-16 |
0.000000000000049 |
0.00083 |
highpH_TMEVA | 0.982000 | -0.00657 |
| Title | Cluster Plot | Dendrogram | e-value | e-value | e-value | Condition | Condition FDR | Condition Difference |
|---|---|---|---|---|---|---|---|---|
| Thaps_hclust_0346 |
 |
 |
0.00053 |
4.7 |
80 |
exponential_vs_stationary_24light | 0.982000 | 0.00874 |
| Title | Cluster Plot | Dendrogram | e-value | e-value | e-value | Condition | Condition FDR | Condition Difference |
|---|---|---|---|---|---|---|---|---|
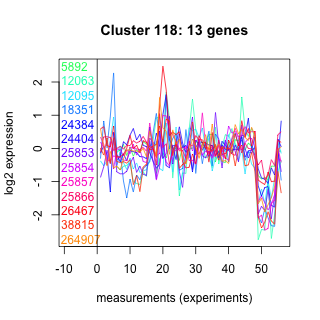
| Thaps_hclust_0118 |
 |
 |
0.0037 |
1.2 |
1.4 |
highpH_TMEVA | 0.982000 | -0.00941 |
| Title | Cluster Plot | Dendrogram | e-value | e-value | e-value | Condition | Condition FDR | Condition Difference |
|---|---|---|---|---|---|---|---|---|
| Thaps_hclust_0134 |
 |
 |
0.00013 |
0.55 |
0.0039 |
highpH_TMEVA | 0.982000 | 0.00797 |
| Title | Cluster Plot | Dendrogram | e-value | e-value | e-value | Condition | Condition FDR | Condition Difference |
|---|---|---|---|---|---|---|---|---|
| Thaps_hclust_0408 |
 |
 |
0.3 |
4.9 |
5.3 |
highpH_TMEVA | 0.982000 | 0.00851 |
| Title | Cluster Plot | Dendrogram | e-value | e-value | e-value | Condition | Condition FDR | Condition Difference |
|---|---|---|---|---|---|---|---|---|
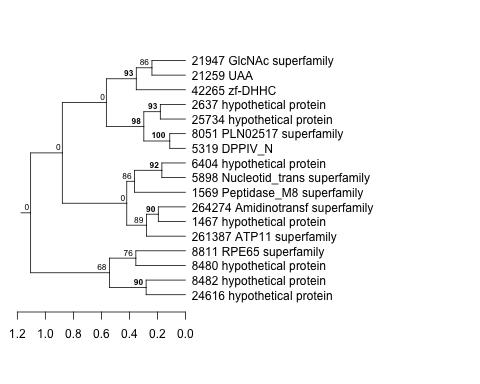
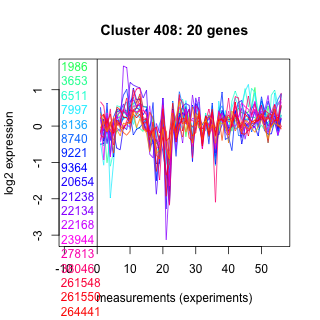
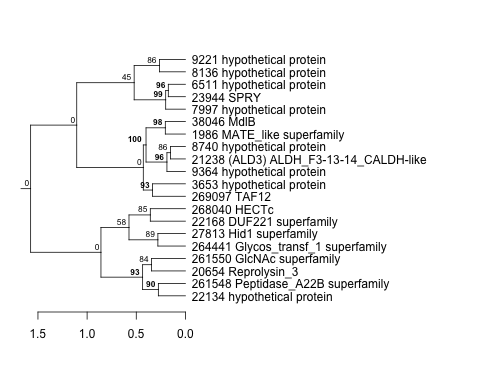
| Thaps_hclust_0265 |
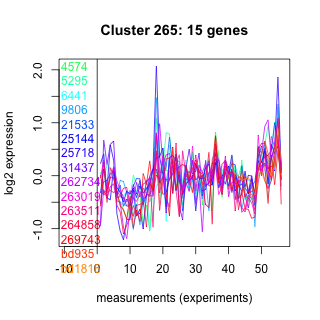 |
 |
0.02 |
0.000051 |
27 |
diel_exponential_vs_stationary | 0.981000 | 0.00675 |
| Title | Cluster Plot | Dendrogram | e-value | e-value | e-value | Condition | Condition FDR | Condition Difference |
|---|---|---|---|---|---|---|---|---|
| Thaps_hclust_0347 |
 |
 |
1.2 |
0.85 |
91 |
highpH_TMEVA | 0.981000 | 0.0127 |
| Title | Cluster Plot | Dendrogram | e-value | e-value | e-value | Condition | Condition FDR | Condition Difference |
|---|---|---|---|---|---|---|---|---|
| Thaps_hclust_0075 |
 |
 |
0.069 |
53 |
33 |
lowFe_TMEVA | 0.981000 | 0.0153 |
| Title | Cluster Plot | Dendrogram | e-value | e-value | e-value | Condition | Condition FDR | Condition Difference |
|---|---|---|---|---|---|---|---|---|
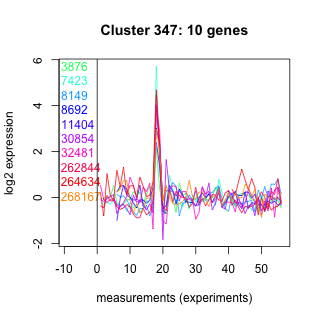
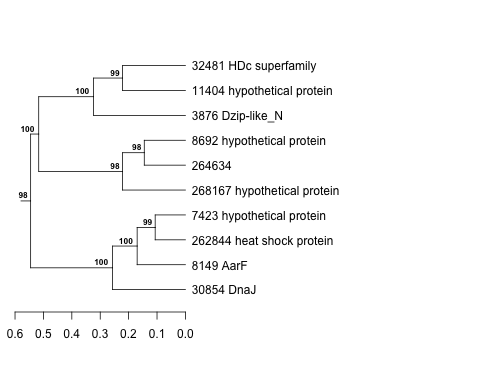
| Thaps_hclust_0379 |
 |
 |
0.00013 |
0.012 |
0.26 |
lowFe_TMEVA | 0.981000 | -0.0143 |
| Title | Cluster Plot | Dendrogram | e-value | e-value | e-value | Condition | Condition FDR | Condition Difference |
|---|---|---|---|---|---|---|---|---|
| Thaps_hclust_0480 |
 |
 |
0.18 |
1.3 |
44 |
co2_elevated_expo_arrays | 0.980000 | 0.0183 |
| Title | Cluster Plot | Dendrogram | e-value | e-value | e-value | Condition | Condition FDR | Condition Difference |
|---|---|---|---|---|---|---|---|---|
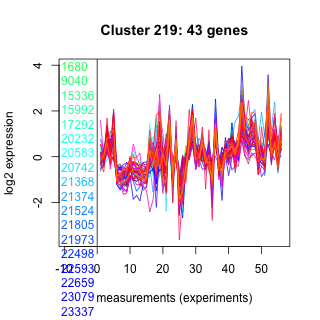
| Thaps_hclust_0219 |
 |
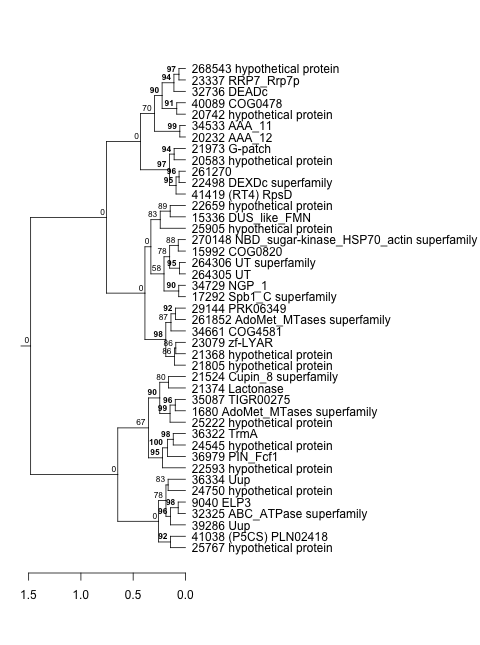 |
2.8e-16 |
0.0000000055 |
0.012 |
BaP | 0.979000 | 0.00613 |
| Title | Cluster Plot | Dendrogram | e-value | e-value | e-value | Condition | Condition FDR | Condition Difference |
|---|---|---|---|---|---|---|---|---|
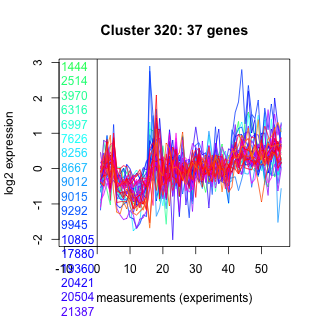
| Thaps_hclust_0320 |
 |
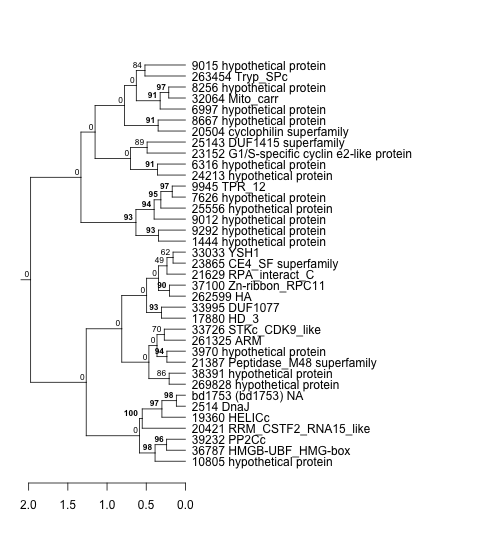 |
0.0000055 |
0.32 |
8.8 |
lowFe_TMEVA | 0.978000 | -0.0153 |
| Title | Cluster Plot | Dendrogram | e-value | e-value | e-value | Condition | Condition FDR | Condition Difference |
|---|---|---|---|---|---|---|---|---|
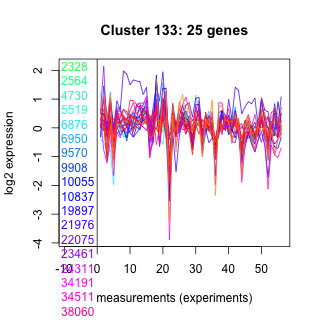
| Thaps_hclust_0133 |
 |
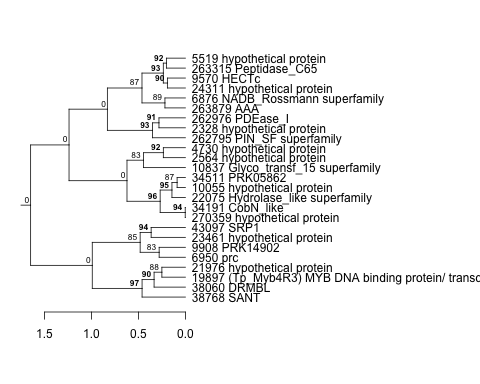 |
0.95 |
2.2 |
2.4 |
exponential_vs_stationary_24light | 0.978000 | -0.0119 |
| Title | Cluster Plot | Dendrogram | e-value | e-value | e-value | Condition | Condition FDR | Condition Difference |
|---|---|---|---|---|---|---|---|---|
| Thaps_hclust_0218 |
 |
 |
0.02 |
0.065 |
7.1 |
co2_elevated_expo_arrays | 0.978000 | -0.0191 |
| Thaps_hclust_0218 |
|
|
0.02 |
0.065 |
7.1 |
lowSi_TMEVA | 0.976000 | -0.131 |
| Title | Cluster Plot | Dendrogram | e-value | e-value | e-value | Condition | Condition FDR | Condition Difference |
|---|---|---|---|---|---|---|---|---|
| Thaps_hclust_0103 |
 |
 |
3.4 |
4.8 |
21 |
lowFe_KTKB_Day3 | 0.978000 | 0.00893 |
| Title | Cluster Plot | Dendrogram | e-value | e-value | e-value | Condition | Condition FDR | Condition Difference |
|---|---|---|---|---|---|---|---|---|
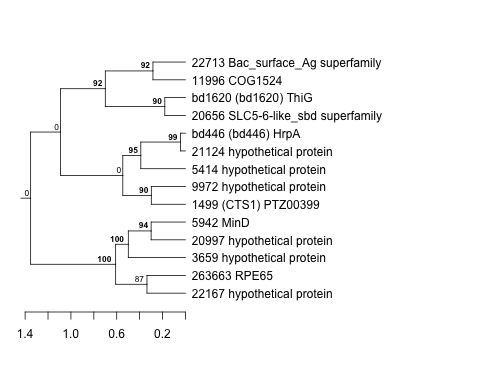
| Thaps_hclust_0446 |
 |
 |
0.0000045 |
0.018 |
0.021 |
diel_light_vs_dark | 0.978000 | 0.00877 |
| Title | Cluster Plot | Dendrogram | e-value | e-value | e-value | Condition | Condition FDR | Condition Difference |
|---|---|---|---|---|---|---|---|---|
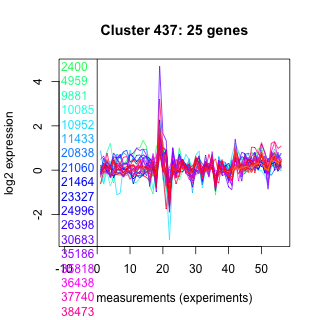
| Thaps_hclust_0437 |
 |
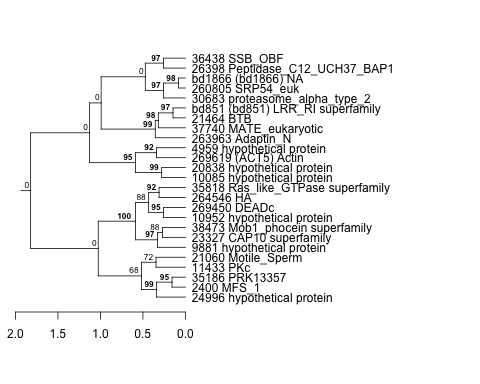 |
0.000000016 |
0.0023 |
3.3 |
exponential_vs_stationary_24light | 0.978000 | 0.0123 |
| Title | Cluster Plot | Dendrogram | e-value | e-value | e-value | Condition | Condition FDR | Condition Difference |
|---|---|---|---|---|---|---|---|---|
| Thaps_hclust_0205 |
 |
 |
2.3e-23 |
7.6e-16 |
0.00000015 |
lowFe_KTKB_Day5 | 0.978000 | 0.00427 |
| Title | Cluster Plot | Dendrogram | e-value | e-value | e-value | Condition | Condition FDR | Condition Difference |
|---|---|---|---|---|---|---|---|---|
| Thaps_hclust_0329 |
 |
 |
0.0000000004 |
0.00000034 |
0.000023 |
co2_elevated_expo_arrays | 0.978000 | -0.019 |
| Title | Cluster Plot | Dendrogram | e-value | e-value | e-value | Condition | Condition FDR | Condition Difference |
|---|---|---|---|---|---|---|---|---|
| Thaps_hclust_0120 |
 |
 |
0.00000098 |
0.000000076 |
0.001 |
co2_elevated_expo_arrays | 0.978000 | -0.0193 |
| Title | Cluster Plot | Dendrogram | e-value | e-value | e-value | Condition | Condition FDR | Condition Difference |
|---|---|---|---|---|---|---|---|---|
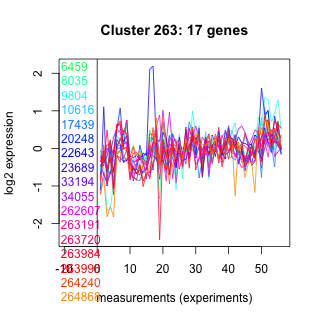
| Thaps_hclust_0263 |
 |
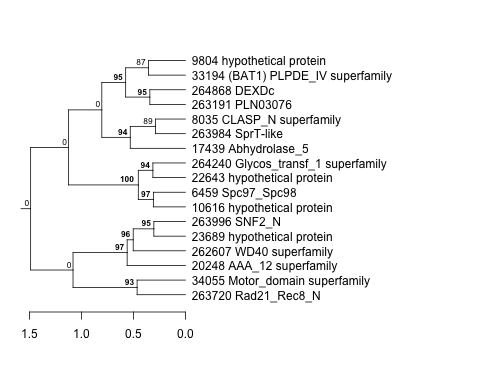 |
0.15 |
0.25 |
1.4 |
lowFe_KTKB_Day3 | 0.978000 | 0.00883 |
| Title | Cluster Plot | Dendrogram | e-value | e-value | e-value | Condition | Condition FDR | Condition Difference |
|---|---|---|---|---|---|---|---|---|
| Thaps_hclust_0375 |
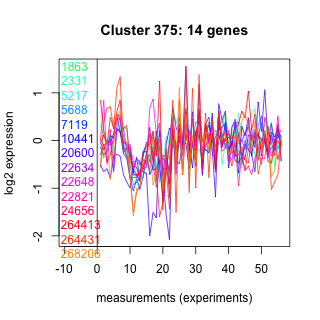 |
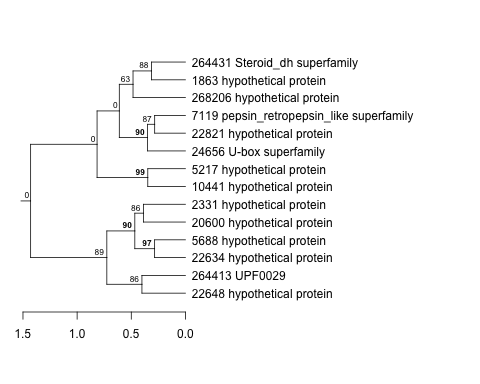 |
1.8 |
2.9 |
40 |
lowFe_TMEVA | 0.978000 | -0.0169 |
| Title | Cluster Plot | Dendrogram | e-value | e-value | e-value | Condition | Condition FDR | Condition Difference |
|---|---|---|---|---|---|---|---|---|
| Thaps_hclust_0242 |
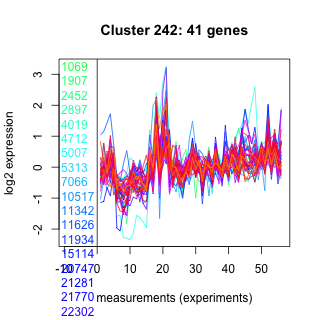 |
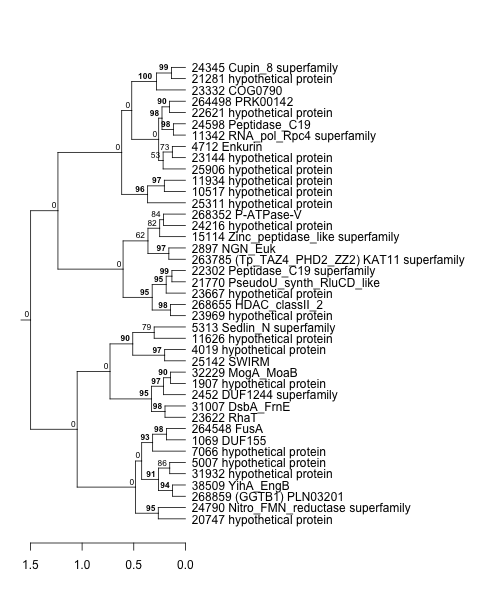 |
3e-20 |
0.0000000000034 |
0.0085 |
diel_light_vs_dark | 0.978000 | 0.00525 |
| Title | Cluster Plot | Dendrogram | e-value | e-value | e-value | Condition | Condition FDR | Condition Difference |
|---|---|---|---|---|---|---|---|---|
| Thaps_hclust_0350 |
 |
 |
0.00016 |
0.13 |
7.1 |
BaP | 0.977000 | 0.00889 |
| Thaps_hclust_0350 |
|
|
0.00016 |
0.13 |
7.1 |
diel_light_vs_dark | 0.977000 | 0.00788 |
| Title | Cluster Plot | Dendrogram | e-value | e-value | e-value | Condition | Condition FDR | Condition Difference |
|---|---|---|---|---|---|---|---|---|
| Thaps_hclust_0151 |
 |
 |
0.015 |
0.13 |
16 |
lowFe_TMEVA | 0.977000 | -0.0171 |
| Title | Cluster Plot | Dendrogram | e-value | e-value | e-value | Condition | Condition FDR | Condition Difference |
|---|---|---|---|---|---|---|---|---|
| Thaps_hclust_0010 |
 |
 |
0.0000000000019 |
0.000000000035 |
0.013 |
co2_elevated_expo_arrays | 0.977000 | -0.0201 |
| Title | Cluster Plot | Dendrogram | e-value | e-value | e-value | Condition | Condition FDR | Condition Difference |
|---|---|---|---|---|---|---|---|---|
| Thaps_hclust_0180 |
 |
 |
1.5 |
1.7 |
12 |
lowFe_TMEVA | 0.977000 | -0.0191 |
| Title | Cluster Plot | Dendrogram | e-value | e-value | e-value | Condition | Condition FDR | Condition Difference |
|---|---|---|---|---|---|---|---|---|
| Thaps_hclust_0398 |
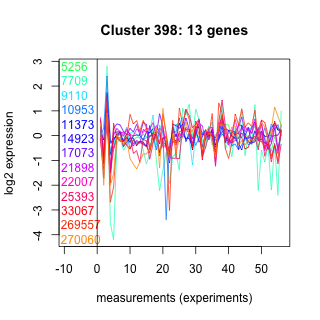 |
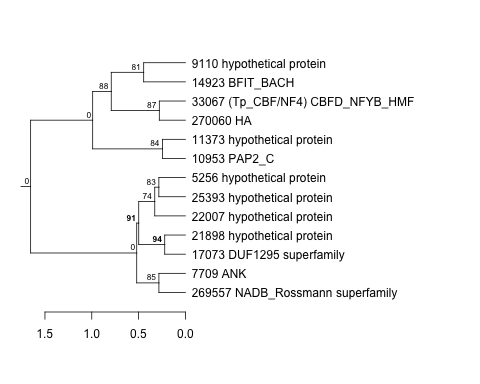 |
0.014 |
0.28 |
1.2 |
co2_elevated_stat_arrays | 0.977000 | 0.00842 |
| Title | Cluster Plot | Dendrogram | e-value | e-value | e-value | Condition | Condition FDR | Condition Difference |
|---|---|---|---|---|---|---|---|---|
| Thaps_hclust_0286 |
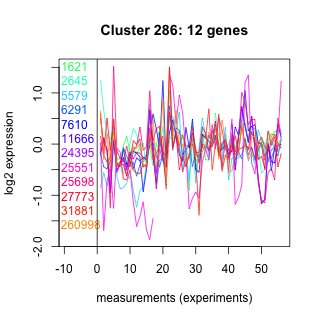 |
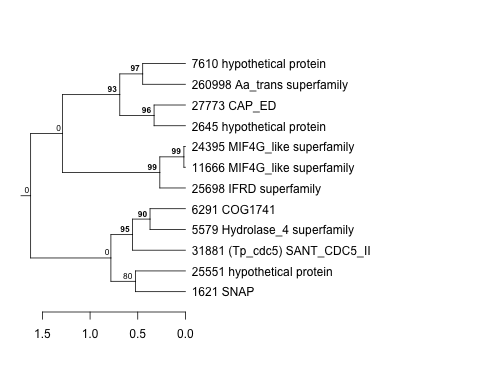 |
0.00008 |
0.0046 |
0.0058 |
diel_light_vs_dark | 0.977000 | -0.0102 |
| Title | Cluster Plot | Dendrogram | e-value | e-value | e-value | Condition | Condition FDR | Condition Difference |
|---|---|---|---|---|---|---|---|---|
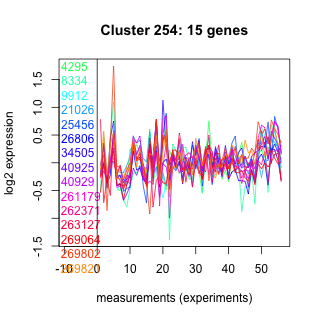
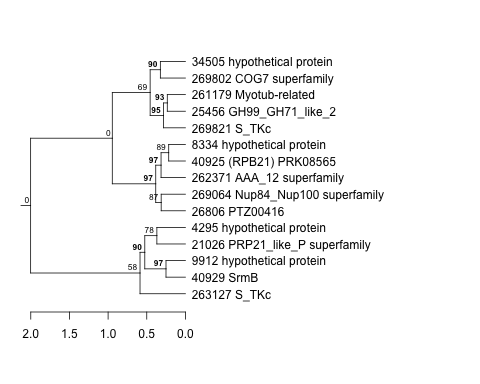
| Thaps_hclust_0324 |
 |
 |
0.0023 |
2.4 |
5.1 |
highpH_TMEVA | 0.977000 | 0.0109 |
| Title | Cluster Plot | Dendrogram | e-value | e-value | e-value | Condition | Condition FDR | Condition Difference |
|---|---|---|---|---|---|---|---|---|
| Thaps_hclust_0254 |
 |
 |
0.00045 |
0.0045 |
5.8 |
diel_exponential_vs_stationary | 0.976000 | -0.00879 |
| Title | Cluster Plot | Dendrogram | e-value | e-value | e-value | Condition | Condition FDR | Condition Difference |
|---|---|---|---|---|---|---|---|---|
| Thaps_hclust_0225 |
 |
 |
0.00000024 |
0.000003 |
0.0048 |
lowSi_TMEVA | 0.976000 | -0.137 |
| Title | Cluster Plot | Dendrogram | e-value | e-value | e-value | Condition | Condition FDR | Condition Difference |
|---|---|---|---|---|---|---|---|---|
| Thaps_hclust_0270 |
 |
 |
0.0000000000069 |
0.000026 |
0.0036 |
lowSi_TMEVA | 0.976000 | -0.139 |
| Title | Cluster Plot | Dendrogram | e-value | e-value | e-value | Condition | Condition FDR | Condition Difference |
|---|---|---|---|---|---|---|---|---|
| Thaps_hclust_0034 |
 |
 |
0.000015 |
0.000083 |
0.63 |
lowSi_TMEVA | 0.976000 | -0.139 |
| Title | Cluster Plot | Dendrogram | e-value | e-value | e-value | Condition | Condition FDR | Condition Difference |
|---|---|---|---|---|---|---|---|---|
| Thaps_hclust_0288 |
 |
 |
0.032 |
0.0067 |
0.047 |
lowSi_TMEVA | 0.976000 | -0.134 |
| Title | Cluster Plot | Dendrogram | e-value | e-value | e-value | Condition | Condition FDR | Condition Difference |
|---|---|---|---|---|---|---|---|---|
| Thaps_hclust_0412 |
 |
 |
0.39 |
17 |
2.9 |
lowSi_TMEVA | 0.976000 | -0.118 |
| Title | Cluster Plot | Dendrogram | e-value | e-value | e-value | Condition | Condition FDR | Condition Difference |
|---|---|---|---|---|---|---|---|---|
| Thaps_hclust_0323 |
 |
 |
0.0011 |
0.014 |
36 |
lowSi_TMEVA | 0.976000 | -0.134 |
| Title | Cluster Plot | Dendrogram | e-value | e-value | e-value | Condition | Condition FDR | Condition Difference |
|---|---|---|---|---|---|---|---|---|
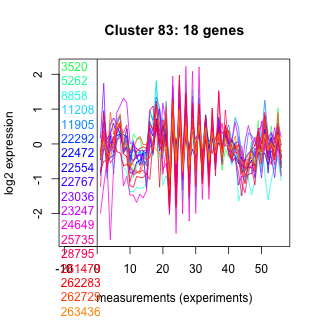
| Thaps_hclust_0083 |
 |
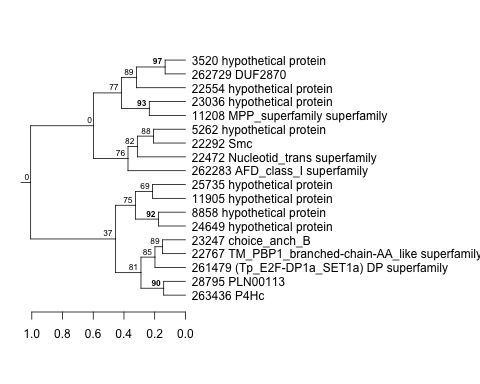 |
0.0039 |
6.3 |
14 |
lowSi_TMEVA | 0.976000 | -0.129 |
| Title | Cluster Plot | Dendrogram | e-value | e-value | e-value | Condition | Condition FDR | Condition Difference |
|---|---|---|---|---|---|---|---|---|
| Thaps_hclust_0338 |
 |
 |
0.0000012 |
0.0000014 |
0.000012 |
lowSi_TMEVA | 0.976000 | -0.131 |
| Title | Cluster Plot | Dendrogram | e-value | e-value | e-value | Condition | Condition FDR | Condition Difference |
|---|---|---|---|---|---|---|---|---|
| Thaps_hclust_0367 |
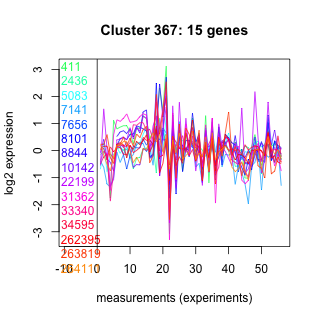 |
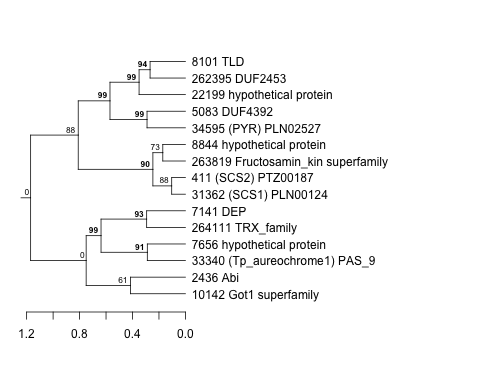 |
0.027 |
0.079 |
0.86 |
co2_elevated_expo_arrays | 0.976000 | 0.0201 |
| Title | Cluster Plot | Dendrogram | e-value | e-value | e-value | Condition | Condition FDR | Condition Difference |
|---|---|---|---|---|---|---|---|---|
| Thaps_hclust_0185 |
 |
 |
0.000039 |
1.8 |
5.8 |
lowSi_TMEVA | 0.976000 | -0.121 |
| Title | Cluster Plot | Dendrogram | e-value | e-value | e-value | Condition | Condition FDR | Condition Difference |
|---|---|---|---|---|---|---|---|---|
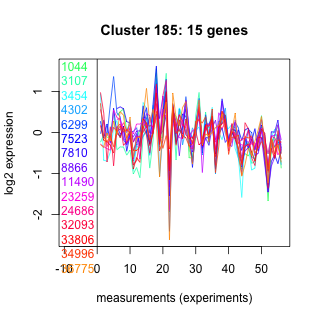
| Thaps_hclust_0371 |
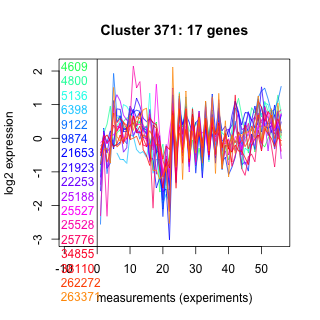 |
 |
0.0051 |
0.11 |
1.1 |
lowSi_TMEVA | 0.976000 | -0.128 |
| Title | Cluster Plot | Dendrogram | e-value | e-value | e-value | Condition | Condition FDR | Condition Difference |
|---|---|---|---|---|---|---|---|---|
| Thaps_hclust_0352 |
 |
 |
8.7 |
78 |
79 |
lowSi_TMEVA | 0.976000 | 0.132 |
| Title | Cluster Plot | Dendrogram | e-value | e-value | e-value | Condition | Condition FDR | Condition Difference |
|---|---|---|---|---|---|---|---|---|
| Thaps_hclust_0458 |
 |
 |
0.0000000041 |
0.000000022 |
0.0024 |
lowSi_TMEVA | 0.976000 | -0.126 |
| Title | Cluster Plot | Dendrogram | e-value | e-value | e-value | Condition | Condition FDR | Condition Difference |
|---|---|---|---|---|---|---|---|---|
| Thaps_hclust_0282 |
 |
 |
0.0005 |
0.0059 |
0.15 |
lowSi_TMEVA | 0.976000 | 0.116 |
| Title | Cluster Plot | Dendrogram | e-value | e-value | e-value | Condition | Condition FDR | Condition Difference |
|---|---|---|---|---|---|---|---|---|
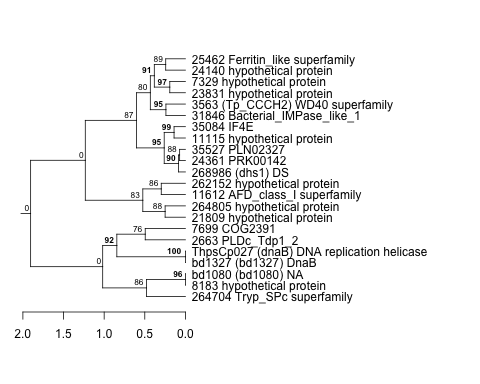
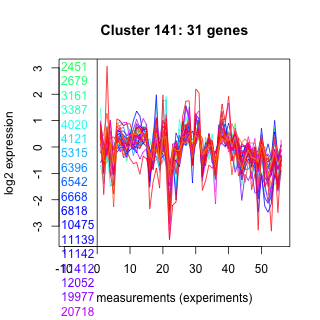
| Thaps_hclust_0141 |
 |
 |
0.000021 |
0.0007 |
0.0051 |
co2_elevated_expo_arrays | 0.976000 | -0.0209 |
| Title | Cluster Plot | Dendrogram | e-value | e-value | e-value | Condition | Condition FDR | Condition Difference |
|---|---|---|---|---|---|---|---|---|
| Thaps_hclust_0193 |
 |
 |
0.00027 |
0.013 |
6.2 |
co2_elevated_expo_arrays | 0.976000 | 0.02 |
| Title | Cluster Plot | Dendrogram | e-value | e-value | e-value | Condition | Condition FDR | Condition Difference |
|---|---|---|---|---|---|---|---|---|
| Thaps_hclust_0438 |
 |
 |
0.0024 |
1.5 |
3.6 |
diel_exponential_vs_stationary | 0.976000 | -0.00724 |
| Title | Cluster Plot | Dendrogram | e-value | e-value | e-value | Condition | Condition FDR | Condition Difference |
|---|---|---|---|---|---|---|---|---|
| Thaps_hclust_0217 |
 |
 |
0.00000028 |
0.95 |
9.7 |
lowSi_TMEVA | 0.976000 | -0.14 |
| Title | Cluster Plot | Dendrogram | e-value | e-value | e-value | Condition | Condition FDR | Condition Difference |
|---|---|---|---|---|---|---|---|---|
| Thaps_hclust_0128 |
 |
 |
0.0000000058 |
0.00033 |
21 |
lowSi_TMEVA | 0.976000 | 0.122 |
| Title | Cluster Plot | Dendrogram | e-value | e-value | e-value | Condition | Condition FDR | Condition Difference |
|---|---|---|---|---|---|---|---|---|
| Thaps_hclust_0233 |
 |
 |
0.01 |
0.026 |
25 |
lowSi_TMEVA | 0.976000 | 0.12 |
| Title | Cluster Plot | Dendrogram | e-value | e-value | e-value | Condition | Condition FDR | Condition Difference |
|---|---|---|---|---|---|---|---|---|
| Thaps_hclust_0244 |
 |
 |
0.000000057 |
0.0001 |
4.1 |
lowSi_TMEVA | 0.976000 | 0.142 |
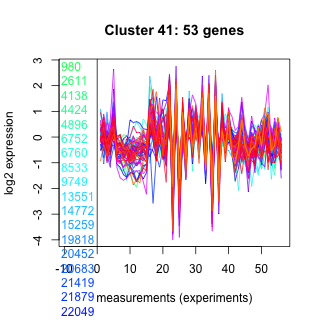
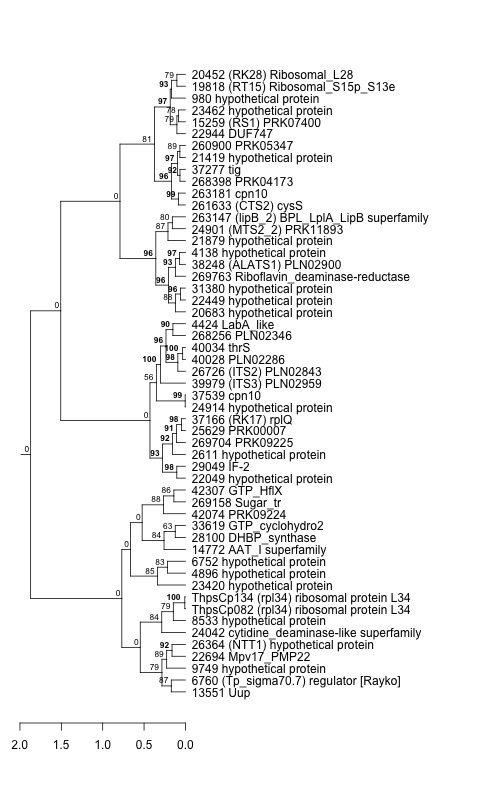
| Title | Cluster Plot | Dendrogram | e-value | e-value | e-value | Condition | Condition FDR | Condition Difference |
|---|---|---|---|---|---|---|---|---|
| Thaps_hclust_0041 |
 |
 |
4.4e-38 |
0.000000011 |
0.0000042 |
diel_exponential_vs_stationary | 0.976000 | 0.00591 |
| Title | Cluster Plot | Dendrogram | e-value | e-value | e-value | Condition | Condition FDR | Condition Difference |
|---|---|---|---|---|---|---|---|---|
| Thaps_hclust_0077 |
 |
 |
0.00014 |
0.91 |
2.2 |
lowSi_TMEVA | 0.976000 | -0.132 |
| Title | Cluster Plot | Dendrogram | e-value | e-value | e-value | Condition | Condition FDR | Condition Difference |
|---|---|---|---|---|---|---|---|---|
| Thaps_hclust_0423 |
 |
 |
0.00046 |
0.13 |
9.2 |
diel_light_vs_dark | 0.976000 | -0.00931 |