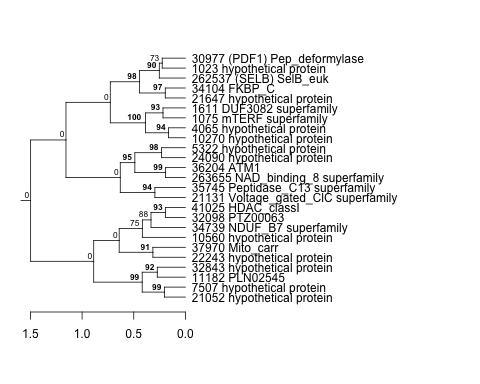
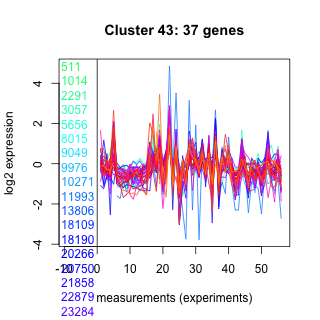
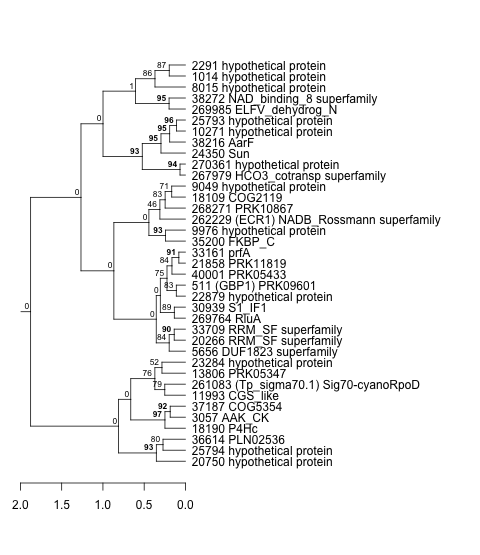
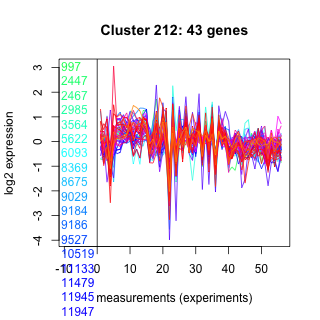
Hierarchical Clusters
Displaying 601 - 700 of 7500
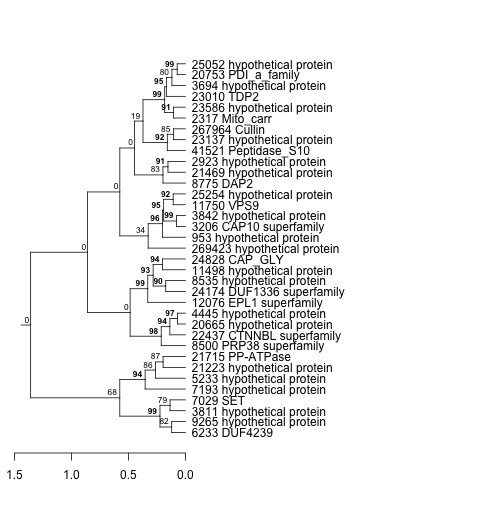
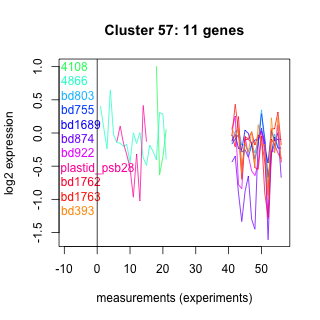
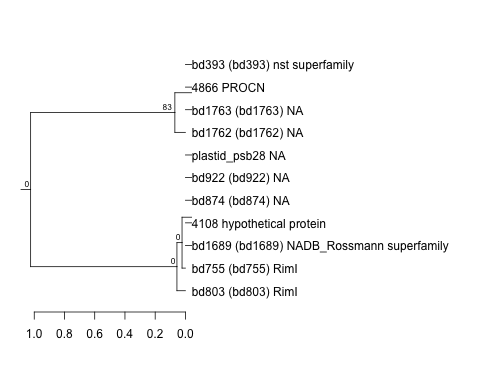
| Title | Cluster Plot | Dendrogram | e-value | e-value | e-value | Condition | Condition FDR | Condition Difference |
|---|---|---|---|---|---|---|---|---|
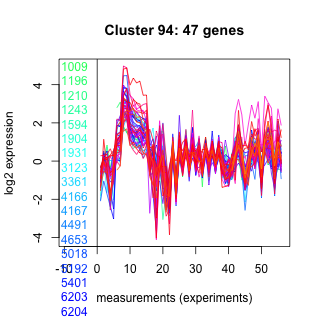
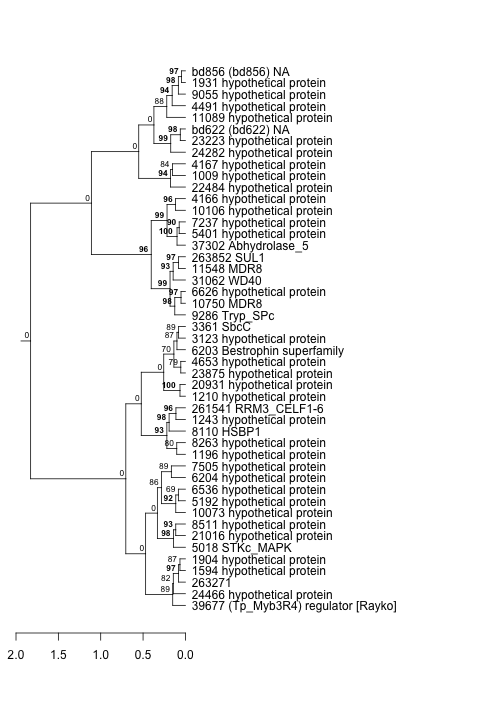
| Thaps_hclust_0194 |
 |
 |
0.27 |
0.6 |
1.5 |
lowFe_KTKB_Day3 | 0.954000 | -0.0187 |
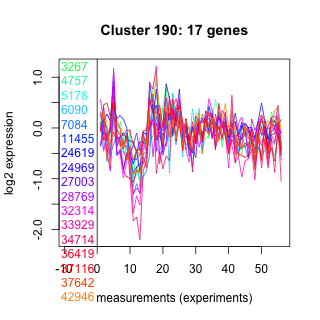
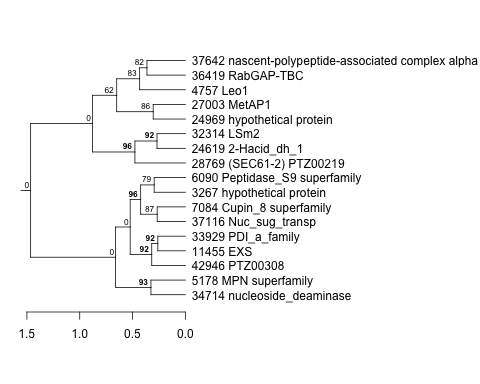
| Thaps_hclust_0194 |
|
|
0.27 |
0.6 |
1.5 |
lowtemp_TMEVA | 0.944000 | -0.0235 |
| Title | Cluster Plot | Dendrogram | e-value | e-value | e-value | Condition | Condition FDR | Condition Difference |
|---|---|---|---|---|---|---|---|---|
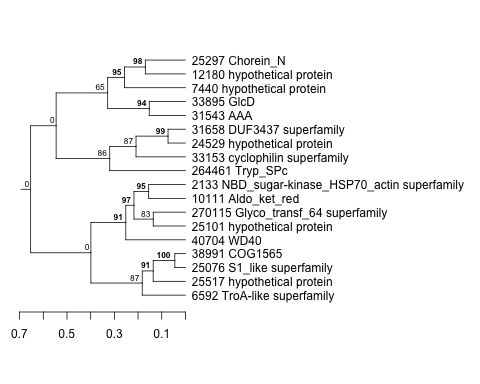
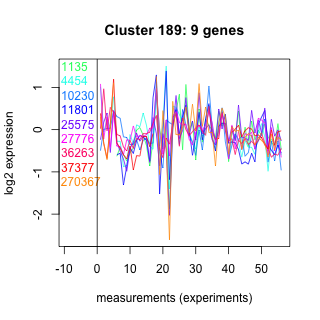
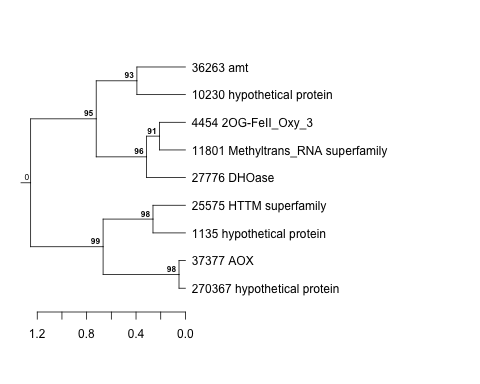
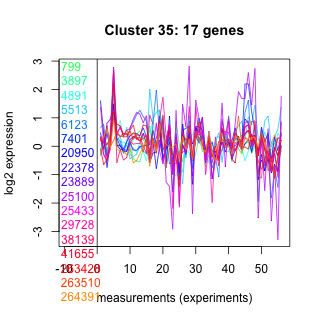
| Thaps_hclust_0161 |
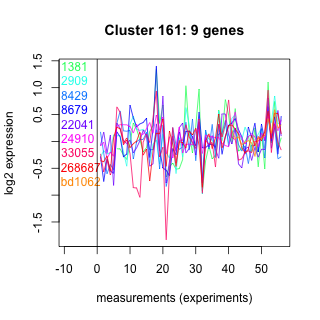 |
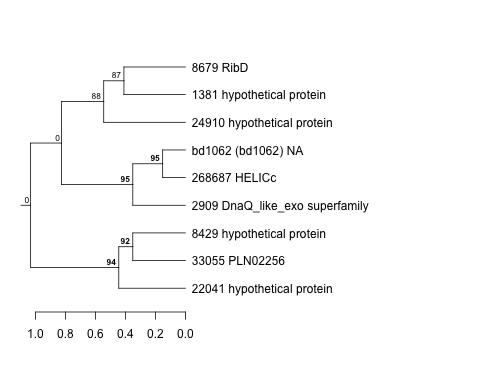 |
1.8 |
13 |
18 |
BaP | 0.954000 | 0.023 |
| Title | Cluster Plot | Dendrogram | e-value | e-value | e-value | Condition | Condition FDR | Condition Difference |
|---|---|---|---|---|---|---|---|---|
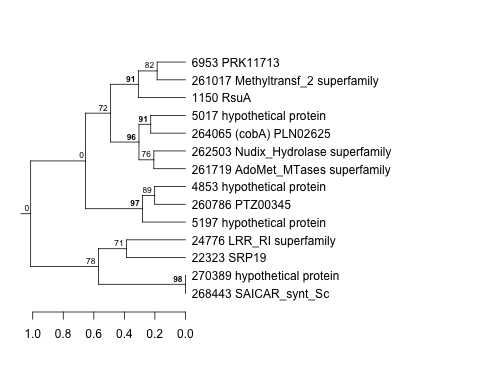
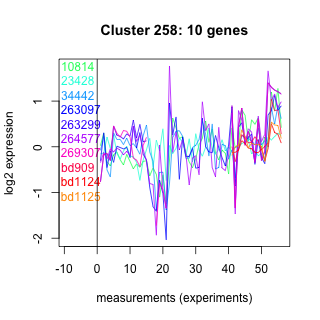
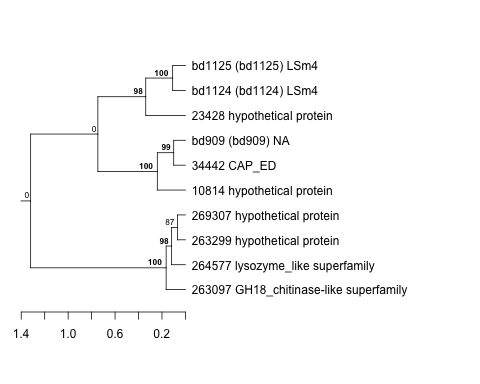
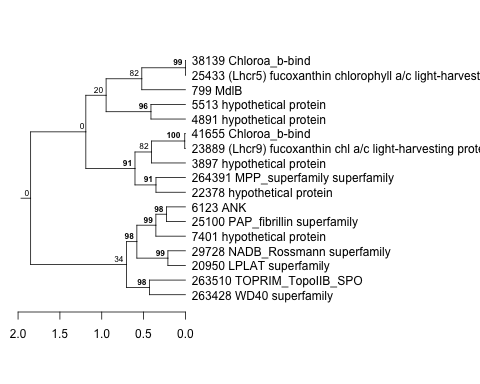
| Thaps_hclust_0402 |
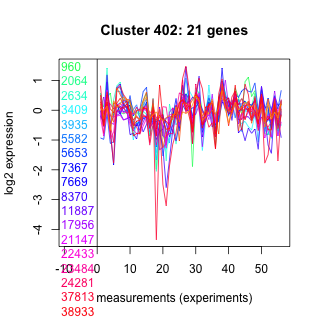 |
 |
0.0022 |
5.7 |
0.07 |
diel_light_vs_dark | 0.954000 | -0.0227 |
| Title | Cluster Plot | Dendrogram | e-value | e-value | e-value | Condition | Condition FDR | Condition Difference |
|---|---|---|---|---|---|---|---|---|
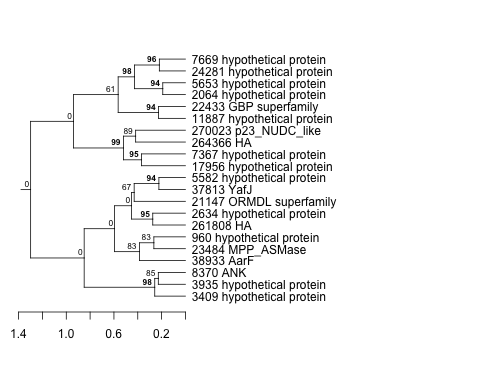
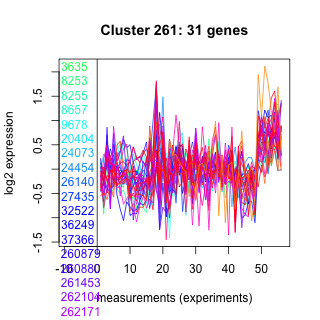
| Thaps_hclust_0187 |
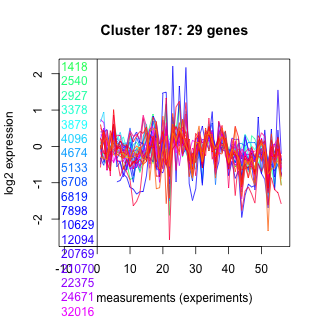 |
 |
0.000000024 |
0.034 |
0.66 |
lowSi_TMEVA | 0.954000 | -0.16 |
| Title | Cluster Plot | Dendrogram | e-value | e-value | e-value | Condition | Condition FDR | Condition Difference |
|---|---|---|---|---|---|---|---|---|
| Thaps_hclust_0495 |
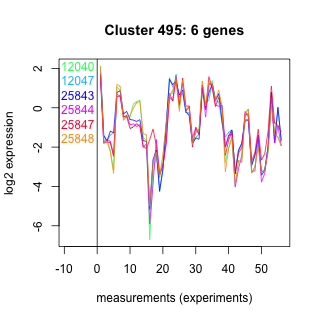 |
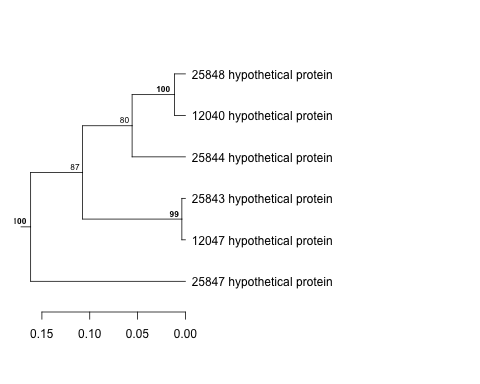 |
0.0000000031 |
0.00000049 |
0.0000038 |
co2_elevated_stat_arrays | 0.954000 | 0.02 |
| Title | Cluster Plot | Dendrogram | e-value | e-value | e-value | Condition | Condition FDR | Condition Difference |
|---|---|---|---|---|---|---|---|---|
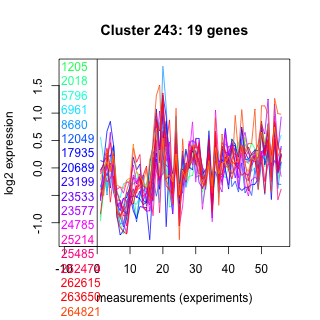
| Thaps_hclust_0243 |
 |
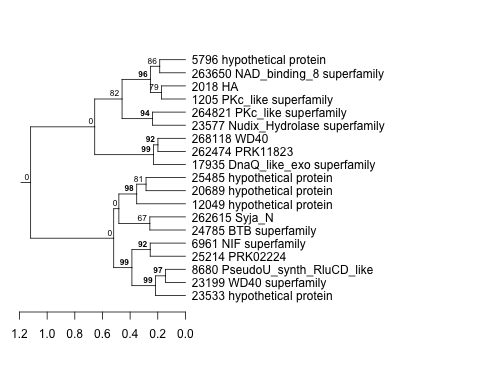 |
0.00018 |
0.14 |
0.0019 |
co2_elevated_stat_arrays | 0.953000 | -0.0142 |
| Title | Cluster Plot | Dendrogram | e-value | e-value | e-value | Condition | Condition FDR | Condition Difference |
|---|---|---|---|---|---|---|---|---|
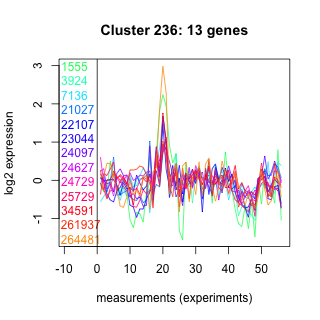
| Thaps_hclust_0236 |
 |
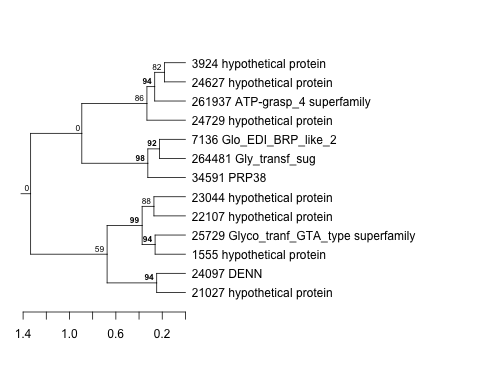 |
0.0078 |
3.3 |
1.1 |
diel_light_vs_dark | 0.953000 | -0.0283 |
| Thaps_hclust_0236 |
|
|
0.0078 |
3.3 |
1.1 |
highpH_TMEVA | 0.943000 | 0.0237 |
| Title | Cluster Plot | Dendrogram | e-value | e-value | e-value | Condition | Condition FDR | Condition Difference |
|---|---|---|---|---|---|---|---|---|
| Thaps_hclust_0472 |
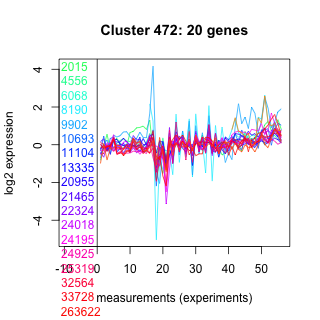 |
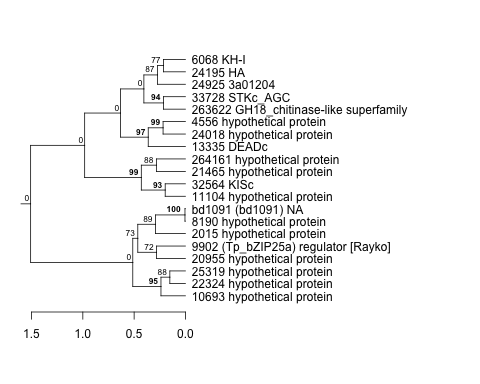 |
0.00000011 |
0.000015 |
0.00015 |
exponential_vs_stationary_24light | 0.953000 | -0.0252 |
| Title | Cluster Plot | Dendrogram | e-value | e-value | e-value | Condition | Condition FDR | Condition Difference |
|---|---|---|---|---|---|---|---|---|
| Thaps_hclust_0430 |
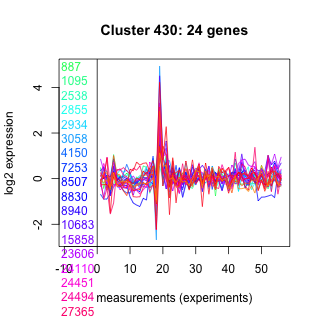 |
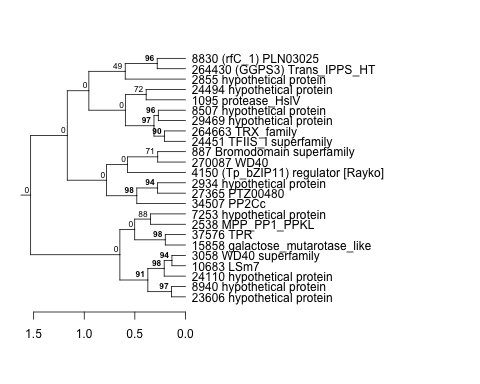 |
0.0000088 |
0.0043 |
0.22 |
co2_elevated_stat_arrays | 0.953000 | -0.0146 |
| Title | Cluster Plot | Dendrogram | e-value | e-value | e-value | Condition | Condition FDR | Condition Difference |
|---|---|---|---|---|---|---|---|---|
| Thaps_hclust_0127 |
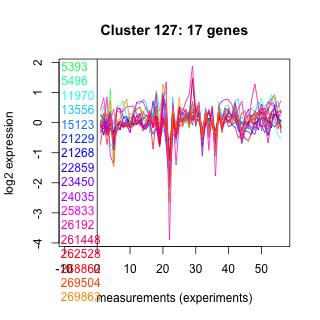 |
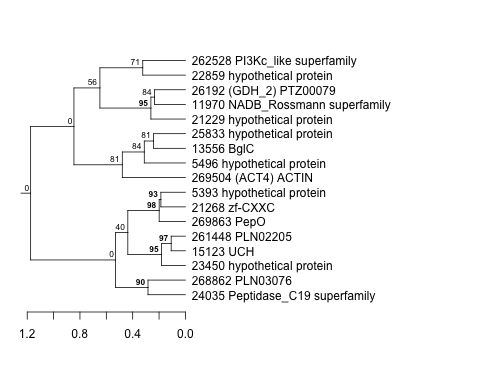 |
2.6 |
32 |
48 |
lowFe_KTKB_Day5 | 0.953000 | 0.0175 |
| Thaps_hclust_0127 |
|
|
2.6 |
32 |
48 |
exponential_vs_stationary_24light | 0.945000 | -0.0306 |
| Title | Cluster Plot | Dendrogram | e-value | e-value | e-value | Condition | Condition FDR | Condition Difference |
|---|---|---|---|---|---|---|---|---|
| Thaps_hclust_0006 |
 |
 |
0.0000000000025 |
0.000000092 |
0.000086 |
co2_elevated_stat_arrays | 0.953000 | -0.0148 |
| Title | Cluster Plot | Dendrogram | e-value | e-value | e-value | Condition | Condition FDR | Condition Difference |
|---|---|---|---|---|---|---|---|---|
| Thaps_hclust_0354 |
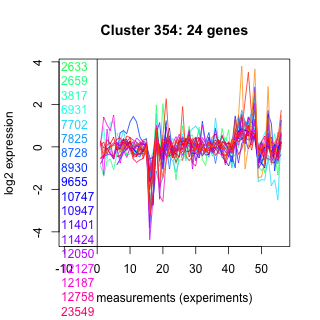 |
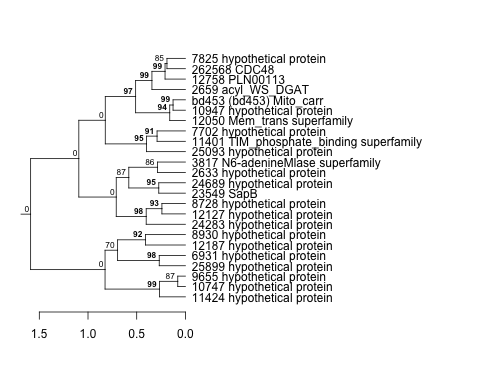 |
0.027 |
0.032 |
0.78 |
BaP | 0.953000 | -0.0163 |
| Thaps_hclust_0354 |
|
|
0.027 |
0.032 |
0.78 |
lowtemp_TMEVA | 0.945000 | -0.0224 |
| Title | Cluster Plot | Dendrogram | e-value | e-value | e-value | Condition | Condition FDR | Condition Difference |
|---|---|---|---|---|---|---|---|---|
| Thaps_hclust_0391 |
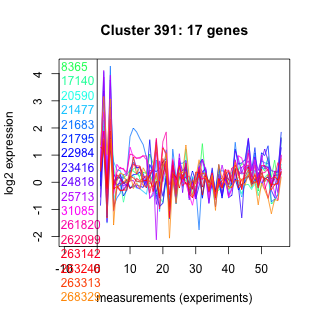 |
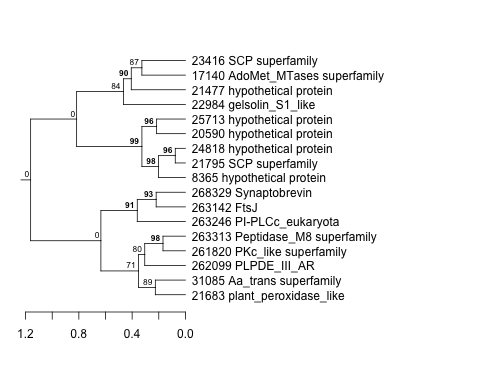 |
1.9 |
34 |
32 |
co2_elevated_stat_arrays | 0.953000 | -0.0141 |
| Title | Cluster Plot | Dendrogram | e-value | e-value | e-value | Condition | Condition FDR | Condition Difference |
|---|---|---|---|---|---|---|---|---|
| Thaps_hclust_0108 |
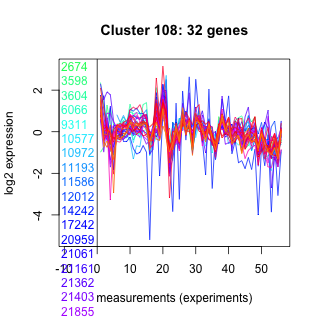 |
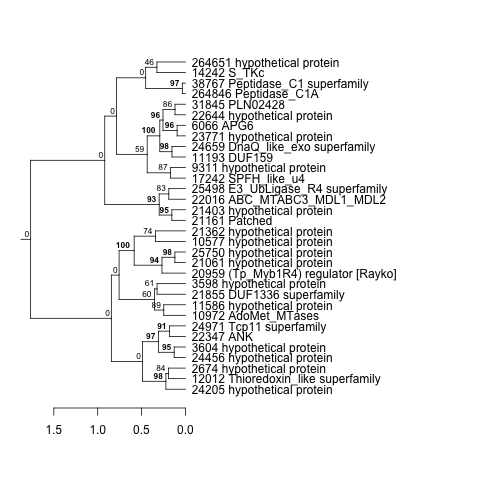 |
0.0000001 |
0.013 |
4 |
co2_elevated_stat_arrays | 0.953000 | -0.0161 |
| Title | Cluster Plot | Dendrogram | e-value | e-value | e-value | Condition | Condition FDR | Condition Difference |
|---|---|---|---|---|---|---|---|---|
| Thaps_hclust_0348 |
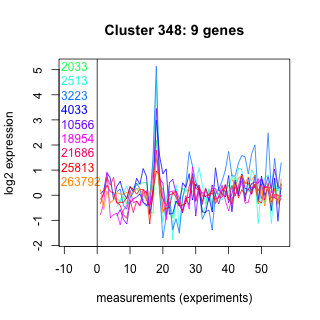 |
 |
8.7 |
34 |
60 |
diel_light_vs_dark | 0.952000 | -0.0376 |
| Title | Cluster Plot | Dendrogram | e-value | e-value | e-value | Condition | Condition FDR | Condition Difference |
|---|---|---|---|---|---|---|---|---|
| Thaps_hclust_0295 |
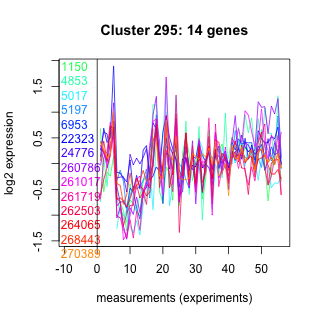 |
 |
0.0000053 |
0.00095 |
0.0005 |
diel_light_vs_dark | 0.952000 | -0.0306 |
| Title | Cluster Plot | Dendrogram | e-value | e-value | e-value | Condition | Condition FDR | Condition Difference |
|---|---|---|---|---|---|---|---|---|
| Thaps_hclust_0284 |
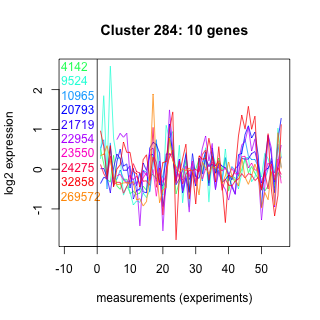 |
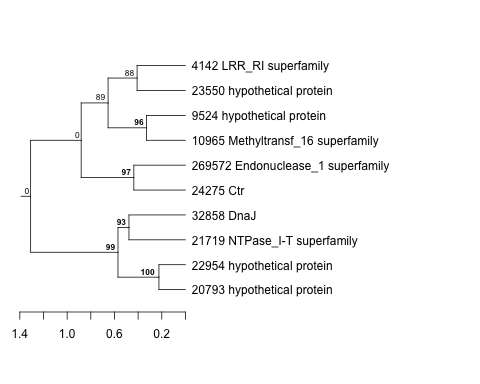 |
0.0011 |
0.067 |
0.038 |
co2_elevated_expo_arrays | 0.952000 | 0.0349 |
| Title | Cluster Plot | Dendrogram | e-value | e-value | e-value | Condition | Condition FDR | Condition Difference |
|---|---|---|---|---|---|---|---|---|
| Thaps_hclust_0237 |
 |
 |
0.0000097 |
0.000009 |
0.000056 |
diel_light_vs_dark | 0.952000 | 0.0245 |
| Title | Cluster Plot | Dendrogram | e-value | e-value | e-value | Condition | Condition FDR | Condition Difference |
|---|---|---|---|---|---|---|---|---|
| Thaps_hclust_0392 |
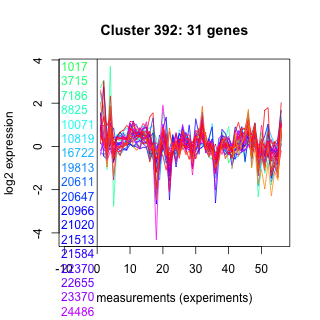 |
 |
0.00055 |
0.0027 |
0.19 |
diel_light_vs_dark | 0.952000 | 0.0185 |
| Title | Cluster Plot | Dendrogram | e-value | e-value | e-value | Condition | Condition FDR | Condition Difference |
|---|---|---|---|---|---|---|---|---|
| Thaps_hclust_0460 |
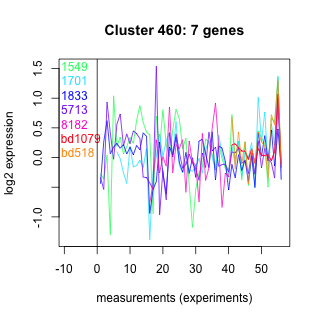 |
 |
0.0073 |
0.0055 |
0.63 |
diel_light_vs_dark | 0.952000 | -0.0398 |
| Title | Cluster Plot | Dendrogram | e-value | e-value | e-value | Condition | Condition FDR | Condition Difference |
|---|---|---|---|---|---|---|---|---|
| Thaps_hclust_0387 |
 |
 |
0.0023 |
0.003 |
0.38 |
diel_light_vs_dark | 0.952000 | 0.0229 |
| Title | Cluster Plot | Dendrogram | e-value | e-value | e-value | Condition | Condition FDR | Condition Difference |
|---|---|---|---|---|---|---|---|---|
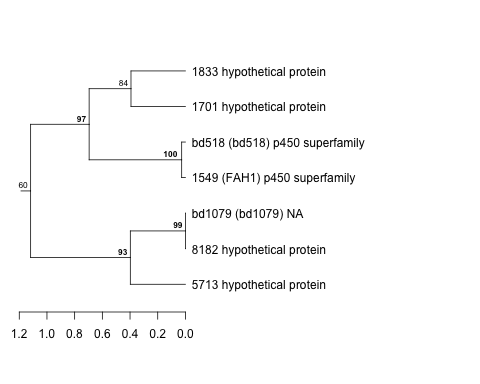
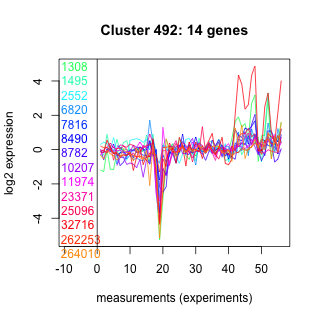
| Thaps_hclust_0492 |
 |
 |
0.29 |
0.47 |
23 |
diel_light_vs_dark | 0.952000 | 0.0282 |
| Title | Cluster Plot | Dendrogram | e-value | e-value | e-value | Condition | Condition FDR | Condition Difference |
|---|---|---|---|---|---|---|---|---|
| Thaps_hclust_0103 |
 |
 |
3.4 |
4.8 |
21 |
diel_light_vs_dark | 0.952000 | -0.0285 |
| Thaps_hclust_0103 |
|
|
3.4 |
4.8 |
21 |
co2_elevated_expo_arrays | 0.943000 | -0.0378 |
| Title | Cluster Plot | Dendrogram | e-value | e-value | e-value | Condition | Condition FDR | Condition Difference |
|---|---|---|---|---|---|---|---|---|
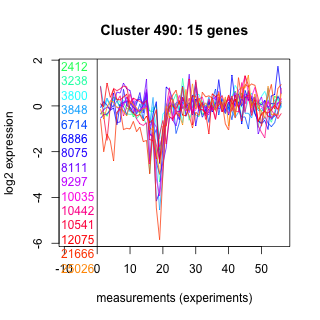
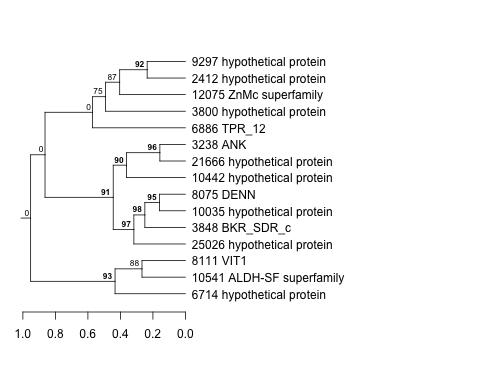
| Thaps_hclust_0490 |
 |
 |
0.6 |
9.5 |
74 |
diel_light_vs_dark | 0.952000 | -0.0304 |
| Title | Cluster Plot | Dendrogram | e-value | e-value | e-value | Condition | Condition FDR | Condition Difference |
|---|---|---|---|---|---|---|---|---|
| Thaps_hclust_0012 |
 |
 |
0.000000000019 |
0.0000000000016 |
0.0000013 |
co2_elevated_expo_arrays | 0.952000 | -0.0312 |
| Title | Cluster Plot | Dendrogram | e-value | e-value | e-value | Condition | Condition FDR | Condition Difference |
|---|---|---|---|---|---|---|---|---|
| Thaps_hclust_0055 |
 |
 |
0.000000038 |
0.0000074 |
0.1 |
highlight_arrays | 0.951000 | 0.0117 |
| Title | Cluster Plot | Dendrogram | e-value | e-value | e-value | Condition | Condition FDR | Condition Difference |
|---|---|---|---|---|---|---|---|---|
| Thaps_hclust_0278 |
 |
 |
0.093 |
0.57 |
39 |
lowtemp_TMEVA | 0.951000 | 0.0296 |
| Title | Cluster Plot | Dendrogram | e-value | e-value | e-value | Condition | Condition FDR | Condition Difference |
|---|---|---|---|---|---|---|---|---|
| Thaps_hclust_0169 |
 |
 |
2.2 |
23 |
3.9 |
co2_elevated_stat_arrays | 0.951000 | -0.0174 |
| Title | Cluster Plot | Dendrogram | e-value | e-value | e-value | Condition | Condition FDR | Condition Difference |
|---|---|---|---|---|---|---|---|---|
| Thaps_hclust_0190 |
 |
 |
0.0000025 |
0.00027 |
0.93 |
lowFe_TMEVA | 0.951000 | 0.0276 |
| Title | Cluster Plot | Dendrogram | e-value | e-value | e-value | Condition | Condition FDR | Condition Difference |
|---|---|---|---|---|---|---|---|---|
| Thaps_hclust_0041 |
 |
 |
4.4e-38 |
0.000000011 |
0.0000042 |
lowFe_TMEVA | 0.951000 | -0.0295 |
| Title | Cluster Plot | Dendrogram | e-value | e-value | e-value | Condition | Condition FDR | Condition Difference |
|---|---|---|---|---|---|---|---|---|
| Thaps_hclust_0094 |
 |
 |
0.0000000025 |
0.000014 |
0.0000045 |
lowFe_TMEVA | 0.951000 | -0.0271 |
| Title | Cluster Plot | Dendrogram | e-value | e-value | e-value | Condition | Condition FDR | Condition Difference |
|---|---|---|---|---|---|---|---|---|
| Thaps_hclust_0418 |
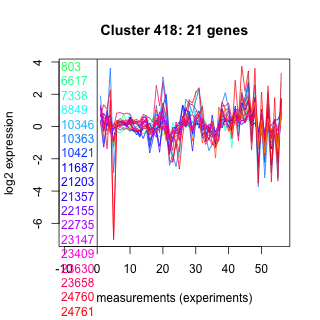 |
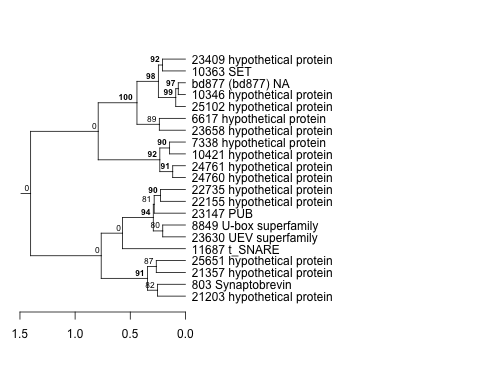 |
0.00074 |
0.0098 |
0.29 |
lowFe_TMEVA | 0.951000 | 0.0296 |
| Title | Cluster Plot | Dendrogram | e-value | e-value | e-value | Condition | Condition FDR | Condition Difference |
|---|---|---|---|---|---|---|---|---|
| Thaps_hclust_0189 |
 |
 |
0.0012 |
0.00048 |
0.015 |
lowFe_TMEVA | 0.951000 | 0.0322 |
| Title | Cluster Plot | Dendrogram | e-value | e-value | e-value | Condition | Condition FDR | Condition Difference |
|---|---|---|---|---|---|---|---|---|
| Thaps_hclust_0258 |
 |
 |
0.027 |
0.021 |
0.036 |
lowFe_TMEVA | 0.951000 | 0.0331 |
| Title | Cluster Plot | Dendrogram | e-value | e-value | e-value | Condition | Condition FDR | Condition Difference |
|---|---|---|---|---|---|---|---|---|
| Thaps_hclust_0395 |
 |
 |
0.0015 |
0.0018 |
0.48 |
lowtemp_TMEVA | 0.951000 | 0.0175 |
| Title | Cluster Plot | Dendrogram | e-value | e-value | e-value | Condition | Condition FDR | Condition Difference |
|---|---|---|---|---|---|---|---|---|
| Thaps_hclust_0375 |
 |
 |
1.8 |
2.9 |
40 |
co2_elevated_stat_arrays | 0.951000 | -0.0179 |
| Title | Cluster Plot | Dendrogram | e-value | e-value | e-value | Condition | Condition FDR | Condition Difference |
|---|---|---|---|---|---|---|---|---|
| Thaps_hclust_0186 |
 |
 |
0.0000000043 |
0.006 |
0.0000084 |
lowFe_TMEVA | 0.951000 | 0.0279 |
| Title | Cluster Plot | Dendrogram | e-value | e-value | e-value | Condition | Condition FDR | Condition Difference |
|---|---|---|---|---|---|---|---|---|
| Thaps_hclust_0426 |
 |
 |
0.0000000000000021 |
0.00000000000026 |
0.000025 |
lowtemp_TMEVA | 0.951000 | 0.0197 |
| Title | Cluster Plot | Dendrogram | e-value | e-value | e-value | Condition | Condition FDR | Condition Difference |
|---|---|---|---|---|---|---|---|---|
| Thaps_hclust_0201 |
 |
 |
0.11 |
7.6 |
12 |
diel_exponential_vs_stationary | 0.949000 | -0.0259 |
| Title | Cluster Plot | Dendrogram | e-value | e-value | e-value | Condition | Condition FDR | Condition Difference |
|---|---|---|---|---|---|---|---|---|
| Thaps_hclust_0292 |
 |
 |
1.4e-30 |
0.00000000000037 |
0.0000067 |
co2_elevated_stat_arrays | 0.949000 | -0.0196 |
| Title | Cluster Plot | Dendrogram | e-value | e-value | e-value | Condition | Condition FDR | Condition Difference |
|---|---|---|---|---|---|---|---|---|
| Thaps_hclust_0253 |
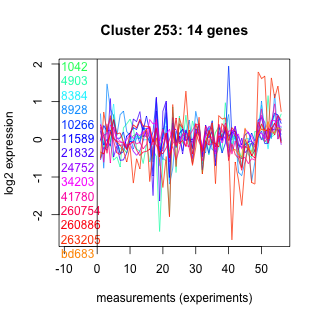 |
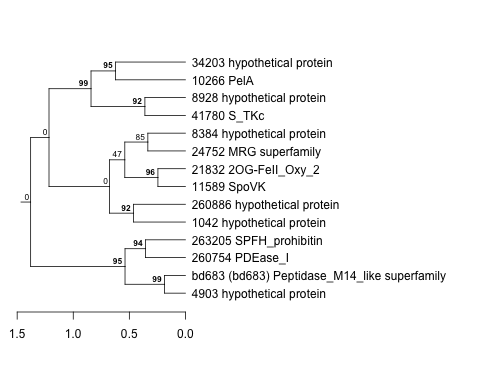 |
1.5 |
61 |
370 |
BaP | 0.949000 | -0.0232 |
| Title | Cluster Plot | Dendrogram | e-value | e-value | e-value | Condition | Condition FDR | Condition Difference |
|---|---|---|---|---|---|---|---|---|
| Thaps_hclust_0113 |
 |
 |
0.00000000011 |
0.000014 |
0.00007 |
co2_elevated_stat_arrays | 0.949000 | 0.0194 |
| Title | Cluster Plot | Dendrogram | e-value | e-value | e-value | Condition | Condition FDR | Condition Difference |
|---|---|---|---|---|---|---|---|---|
| Thaps_hclust_0410 |
 |
 |
0.065 |
0.56 |
0.36 |
BaP | 0.949000 | 0.0159 |
| Title | Cluster Plot | Dendrogram | e-value | e-value | e-value | Condition | Condition FDR | Condition Difference |
|---|---|---|---|---|---|---|---|---|
| Thaps_hclust_0166 |
 |
 |
0.001 |
5.3 |
63 |
co2_elevated_stat_arrays | 0.949000 | 0.0197 |
| Title | Cluster Plot | Dendrogram | e-value | e-value | e-value | Condition | Condition FDR | Condition Difference |
|---|---|---|---|---|---|---|---|---|
| Thaps_hclust_0321 |
 |
 |
0.000000086 |
0.0000000042 |
0.0000028 |
co2_elevated_stat_arrays | 0.949000 | 0.0206 |
| Title | Cluster Plot | Dendrogram | e-value | e-value | e-value | Condition | Condition FDR | Condition Difference |
|---|---|---|---|---|---|---|---|---|
| Thaps_hclust_0125 |
 |
 |
0.1 |
0.35 |
2.4 |
co2_elevated_stat_arrays | 0.949000 | -0.0183 |
| Title | Cluster Plot | Dendrogram | e-value | e-value | e-value | Condition | Condition FDR | Condition Difference |
|---|---|---|---|---|---|---|---|---|
| Thaps_hclust_0042 |
 |
 |
0.26 |
5.9 |
0.46 |
exponential_vs_stationary_24highlight | 0.948000 | -0.0117 |
| Title | Cluster Plot | Dendrogram | e-value | e-value | e-value | Condition | Condition FDR | Condition Difference |
|---|---|---|---|---|---|---|---|---|
| Thaps_hclust_0428 |
 |
 |
0.000000076 |
0.015 |
1.9 |
highlight_arrays | 0.948000 | 0.01 |
| Title | Cluster Plot | Dendrogram | e-value | e-value | e-value | Condition | Condition FDR | Condition Difference |
|---|---|---|---|---|---|---|---|---|
| Thaps_hclust_0374 |
 |
 |
1.4 |
19 |
50 |
exponential_vs_stationary_24highlight | 0.948000 | 0.0126 |
| Title | Cluster Plot | Dendrogram | e-value | e-value | e-value | Condition | Condition FDR | Condition Difference |
|---|---|---|---|---|---|---|---|---|
| Thaps_hclust_0135 |
 |
 |
0.0000000028 |
0.0077 |
0.17 |
lowFe_KTKB_Day3 | 0.947000 | -0.0163 |
| Title | Cluster Plot | Dendrogram | e-value | e-value | e-value | Condition | Condition FDR | Condition Difference |
|---|---|---|---|---|---|---|---|---|
| Thaps_hclust_0035 |
 |
 |
0.00023 |
0.0000098 |
0.064 |
lowSi_TMEVA | 0.947000 | 0.158 |
| Title | Cluster Plot | Dendrogram | e-value | e-value | e-value | Condition | Condition FDR | Condition Difference |
|---|---|---|---|---|---|---|---|---|
| Thaps_hclust_0261 |
 |
 |
0.00000000025 |
0.000000005 |
0.0000069 |
co2_elevated_stat_arrays | 0.947000 | -0.0211 |
| Title | Cluster Plot | Dendrogram | e-value | e-value | e-value | Condition | Condition FDR | Condition Difference |
|---|---|---|---|---|---|---|---|---|
| Thaps_hclust_0210 |
 |
 |
0.0000000000046 |
0.0000033 |
0.086 |
lowFe_TMEVA | 0.947000 | -0.0298 |
| Thaps_hclust_0210 |
|
|
0.0000000000046 |
0.0000033 |
0.086 |
highpH_TMEVA | 0.942000 | 0.0188 |
| Title | Cluster Plot | Dendrogram | e-value | e-value | e-value | Condition | Condition FDR | Condition Difference |
|---|---|---|---|---|---|---|---|---|
| Thaps_hclust_0318 |
 |
 |
1.1e-17 |
0.000000015 |
0.0000081 |
lowSi_TMEVA | 0.947000 | 0.171 |
| Thaps_hclust_0318 |
|
|
1.1e-17 |
0.000000015 |
0.0000081 |
lowFe_TMEVA | 0.943000 | -0.034 |
| Title | Cluster Plot | Dendrogram | e-value | e-value | e-value | Condition | Condition FDR | Condition Difference |
|---|---|---|---|---|---|---|---|---|
| Thaps_hclust_0397 |
 |
 |
0.00003 |
0.00016 |
0.0062 |
lowFe_TMEVA | 0.947000 | -0.0296 |
| Title | Cluster Plot | Dendrogram | e-value | e-value | e-value | Condition | Condition FDR | Condition Difference |
|---|---|---|---|---|---|---|---|---|
| Thaps_hclust_0198 |
 |
 |
0.00091 |
0.017 |
0.0046 |
exponential_vs_stationary_24light | 0.945000 | 0.0272 |
| Thaps_hclust_0198 |
|
|
0.00091 |
0.017 |
0.0046 |
co2_elevated_expo_arrays | 0.943000 | -0.0368 |
| Title | Cluster Plot | Dendrogram | e-value | e-value | e-value | Condition | Condition FDR | Condition Difference |
|---|---|---|---|---|---|---|---|---|
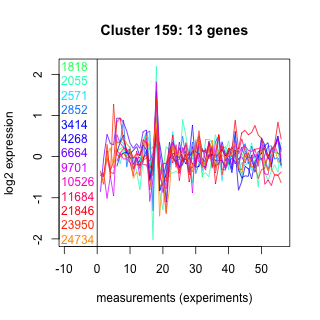
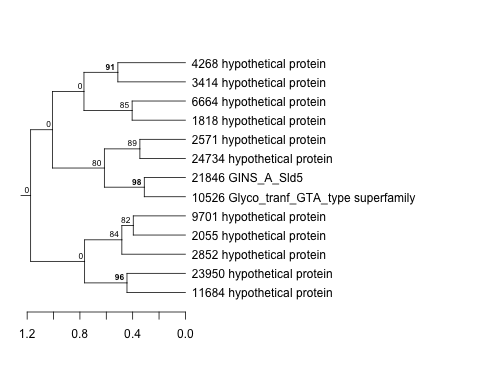
| Thaps_hclust_0159 |
 |
 |
0.087 |
1.3 |
3 |
exponential_vs_stationary_24light | 0.945000 | -0.0337 |
| Title | Cluster Plot | Dendrogram | e-value | e-value | e-value | Condition | Condition FDR | Condition Difference |
|---|---|---|---|---|---|---|---|---|
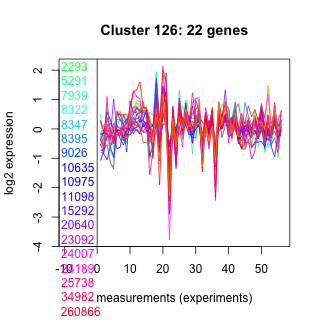
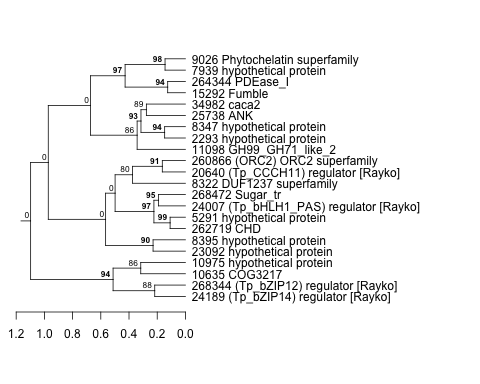
| Thaps_hclust_0126 |
 |
 |
0.025 |
1.3 |
0.6 |
highlight_arrays | 0.945000 | 0.0123 |
| Title | Cluster Plot | Dendrogram | e-value | e-value | e-value | Condition | Condition FDR | Condition Difference |
|---|---|---|---|---|---|---|---|---|
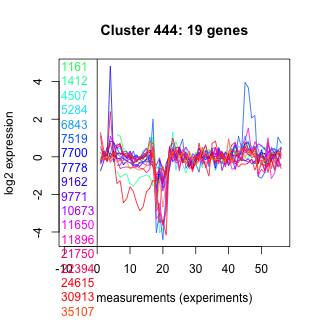
| Thaps_hclust_0444 |
 |
 |
14 |
140 |
1.6 |
co2_elevated_expo_arrays | 0.944000 | -0.0348 |
| Title | Cluster Plot | Dendrogram | e-value | e-value | e-value | Condition | Condition FDR | Condition Difference |
|---|---|---|---|---|---|---|---|---|
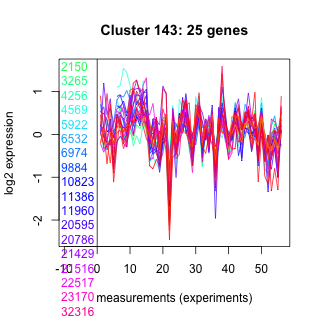
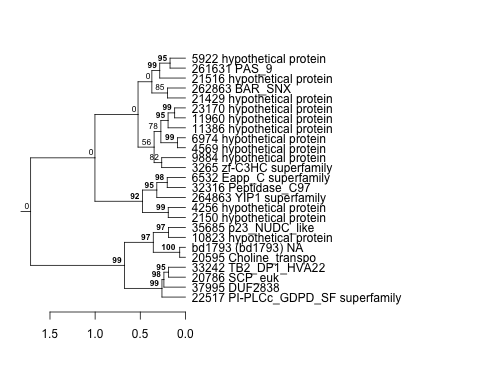
| Thaps_hclust_0143 |
 |
 |
0.018 |
0.041 |
0.67 |
co2_elevated_expo_arrays | 0.944000 | -0.0322 |
| Title | Cluster Plot | Dendrogram | e-value | e-value | e-value | Condition | Condition FDR | Condition Difference |
|---|---|---|---|---|---|---|---|---|
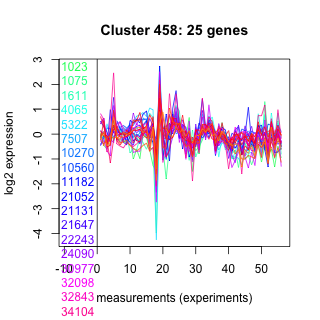
| Thaps_hclust_0458 |
 |
 |
0.0000000041 |
0.000000022 |
0.0024 |
co2_elevated_expo_arrays | 0.944000 | 0.0337 |
| Title | Cluster Plot | Dendrogram | e-value | e-value | e-value | Condition | Condition FDR | Condition Difference |
|---|---|---|---|---|---|---|---|---|
| Thaps_hclust_0043 |
 |
 |
3.9e-18 |
0.0000000053 |
2 |
co2_elevated_expo_arrays | 0.944000 | -0.0319 |
| Title | Cluster Plot | Dendrogram | e-value | e-value | e-value | Condition | Condition FDR | Condition Difference |
|---|---|---|---|---|---|---|---|---|
| Thaps_hclust_0212 |
 |
 |
2.5e-17 |
0.000019 |
0.027 |
lowN_TMEVA | 0.944000 | -0.0263 |
| Title | Cluster Plot | Dendrogram | e-value | e-value | e-value | Condition | Condition FDR | Condition Difference |
|---|---|---|---|---|---|---|---|---|
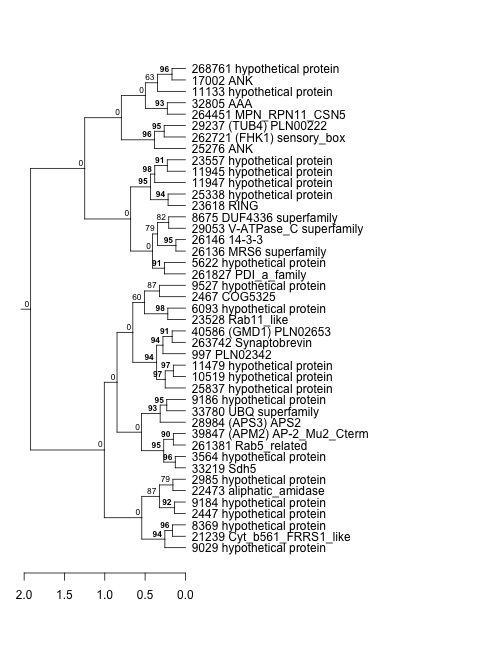
| Thaps_hclust_0244 |
 |
 |
0.000000057 |
0.0001 |
4.1 |
co2_elevated_expo_arrays | 0.944000 | -0.0329 |
| Title | Cluster Plot | Dendrogram | e-value | e-value | e-value | Condition | Condition FDR | Condition Difference |
|---|---|---|---|---|---|---|---|---|
| Thaps_hclust_0102 |
 |
 |
3.2e-16 |
0.00000000002 |
0.0000006 |
co2_elevated_expo_arrays | 0.944000 | -0.0335 |
| Title | Cluster Plot | Dendrogram | e-value | e-value | e-value | Condition | Condition FDR | Condition Difference |
|---|---|---|---|---|---|---|---|---|
| Thaps_hclust_0436 |
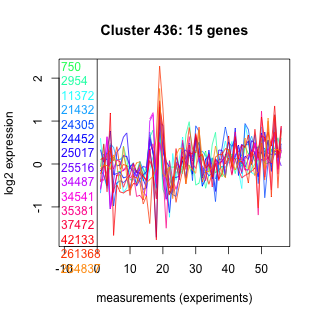 |
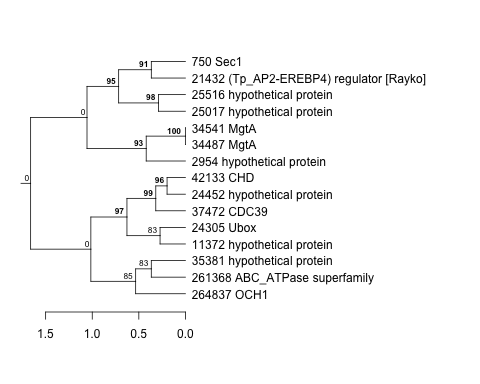 |
0.067 |
0.93 |
0.55 |
co2_elevated_expo_arrays | 0.944000 | 0.034 |
| Title | Cluster Plot | Dendrogram | e-value | e-value | e-value | Condition | Condition FDR | Condition Difference |
|---|---|---|---|---|---|---|---|---|
| Thaps_hclust_0259 |
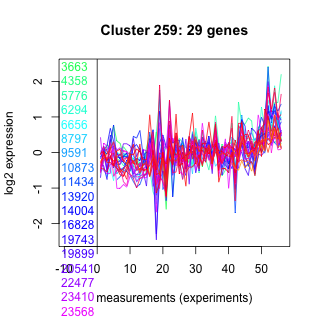 |
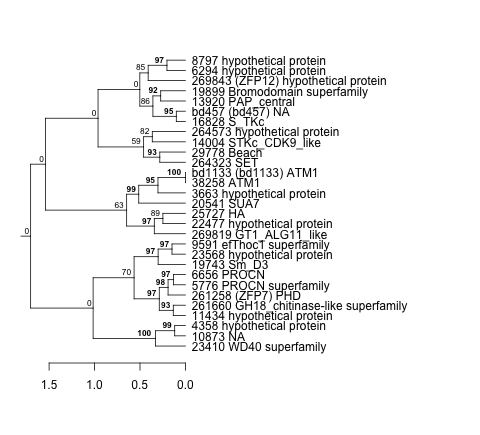 |
0.000051 |
0.026 |
17 |
co2_elevated_expo_arrays | 0.944000 | 0.0327 |
| Title | Cluster Plot | Dendrogram | e-value | e-value | e-value | Condition | Condition FDR | Condition Difference |
|---|---|---|---|---|---|---|---|---|
| Thaps_hclust_0398 |
 |
 |
0.014 |
0.28 |
1.2 |
co2_elevated_expo_arrays | 0.944000 | 0.0347 |
| Title | Cluster Plot | Dendrogram | e-value | e-value | e-value | Condition | Condition FDR | Condition Difference |
|---|---|---|---|---|---|---|---|---|
| Thaps_hclust_0051 |
 |
 |
0.012 |
0.033 |
0.41 |
co2_elevated_expo_arrays | 0.944000 | -0.0361 |
| Title | Cluster Plot | Dendrogram | e-value | e-value | e-value | Condition | Condition FDR | Condition Difference |
|---|---|---|---|---|---|---|---|---|
| Thaps_hclust_0468 |
 |
 |
0.0023 |
0.08 |
2.3 |
co2_elevated_expo_arrays | 0.944000 | -0.0332 |
| Title | Cluster Plot | Dendrogram | e-value | e-value | e-value | Condition | Condition FDR | Condition Difference |
|---|---|---|---|---|---|---|---|---|
| Thaps_hclust_0327 |
 |
 |
0.0000000037 |
0.013 |
3.8 |
co2_elevated_expo_arrays | 0.944000 | 0.0345 |
| Title | Cluster Plot | Dendrogram | e-value | e-value | e-value | Condition | Condition FDR | Condition Difference |
|---|---|---|---|---|---|---|---|---|
| Thaps_hclust_0326 |
 |
 |
0.000000000000042 |
0.00000000011 |
0.00000051 |
co2_elevated_expo_arrays | 0.944000 | 0.0372 |
| Title | Cluster Plot | Dendrogram | e-value | e-value | e-value | Condition | Condition FDR | Condition Difference |
|---|---|---|---|---|---|---|---|---|
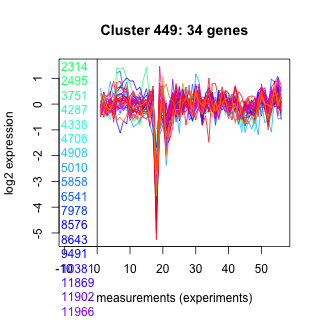
| Thaps_hclust_0449 |
 |
 |
0.0000000011 |
0.012 |
3.5 |
co2_elevated_expo_arrays | 0.944000 | 0.0345 |
| Title | Cluster Plot | Dendrogram | e-value | e-value | e-value | Condition | Condition FDR | Condition Difference |
|---|---|---|---|---|---|---|---|---|
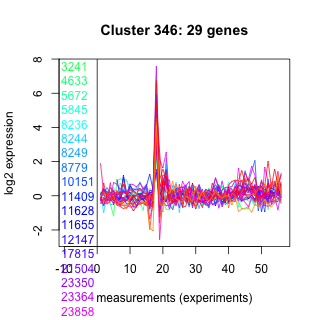
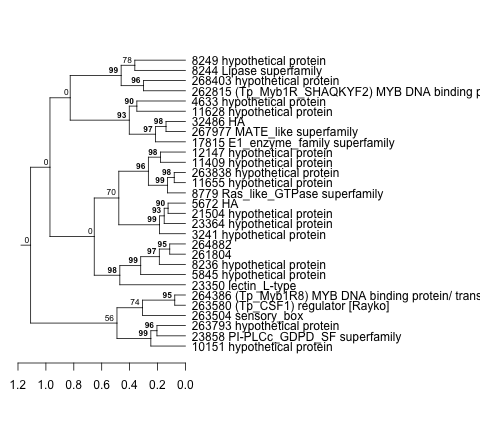
| Thaps_hclust_0346 |
 |
 |
0.00053 |
4.7 |
80 |
lowN_TMEVA | 0.944000 | -0.0276 |
| Title | Cluster Plot | Dendrogram | e-value | e-value | e-value | Condition | Condition FDR | Condition Difference |
|---|---|---|---|---|---|---|---|---|
| Thaps_hclust_0182 |
 |
 |
0.13 |
130 |
0.14 |
co2_elevated_expo_arrays | 0.944000 | 0.0345 |
| Title | Cluster Plot | Dendrogram | e-value | e-value | e-value | Condition | Condition FDR | Condition Difference |
|---|---|---|---|---|---|---|---|---|
| Thaps_hclust_0162 |
 |
 |
0.032 |
3.2 |
58 |
co2_elevated_expo_arrays | 0.943000 | -0.0395 |
| Title | Cluster Plot | Dendrogram | e-value | e-value | e-value | Condition | Condition FDR | Condition Difference |
|---|---|---|---|---|---|---|---|---|
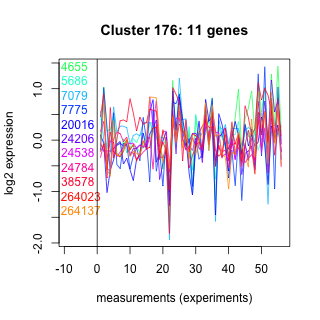
| Thaps_hclust_0218 |
 |
 |
0.02 |
0.065 |
7.1 |
exponential_vs_stationary_24light | 0.943000 | 0.0328 |
| Title | Cluster Plot | Dendrogram | e-value | e-value | e-value | Condition | Condition FDR | Condition Difference |
|---|---|---|---|---|---|---|---|---|
| Thaps_hclust_0461 |
 |
 |
0.00000000082 |
0.01 |
0.079 |
co2_elevated_expo_arrays | 0.943000 | 0.0461 |
| Title | Cluster Plot | Dendrogram | e-value | e-value | e-value | Condition | Condition FDR | Condition Difference |
|---|---|---|---|---|---|---|---|---|
| Thaps_hclust_0479 |
 |
 |
0.11 |
0.2 |
1.5 |
co2_elevated_expo_arrays | 0.943000 | -0.0399 |
| Title | Cluster Plot | Dendrogram | e-value | e-value | e-value | Condition | Condition FDR | Condition Difference |
|---|---|---|---|---|---|---|---|---|
| Thaps_hclust_0335 |
 |
 |
0.0000000032 |
0.000001 |
0.019 |
highpH_TMEVA | 0.943000 | -0.0162 |
| Title | Cluster Plot | Dendrogram | e-value | e-value | e-value | Condition | Condition FDR | Condition Difference |
|---|---|---|---|---|---|---|---|---|
| Thaps_hclust_0106 |
 |
 |
0.48 |
3.7 |
8.9 |
co2_elevated_expo_arrays | 0.943000 | -0.0372 |
| Title | Cluster Plot | Dendrogram | e-value | e-value | e-value | Condition | Condition FDR | Condition Difference |
|---|---|---|---|---|---|---|---|---|
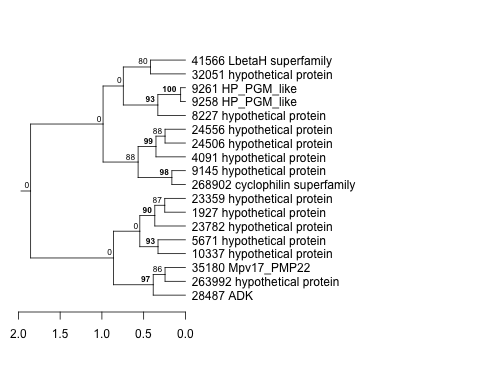
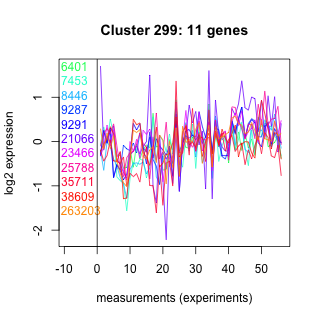
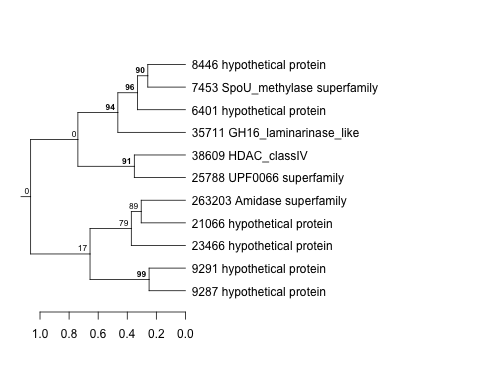
| Thaps_hclust_0299 |
 |
 |
0.0056 |
1.7 |
6.7 |
highpH_TMEVA | 0.943000 | 0.0253 |
| Title | Cluster Plot | Dendrogram | e-value | e-value | e-value | Condition | Condition FDR | Condition Difference |
|---|---|---|---|---|---|---|---|---|
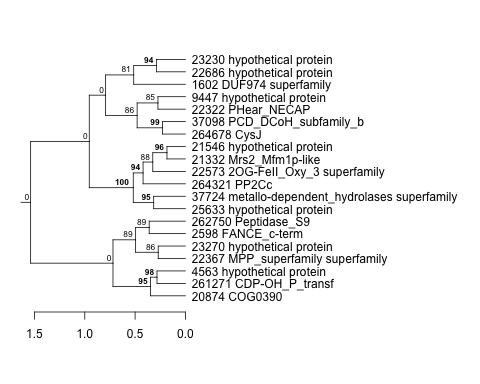
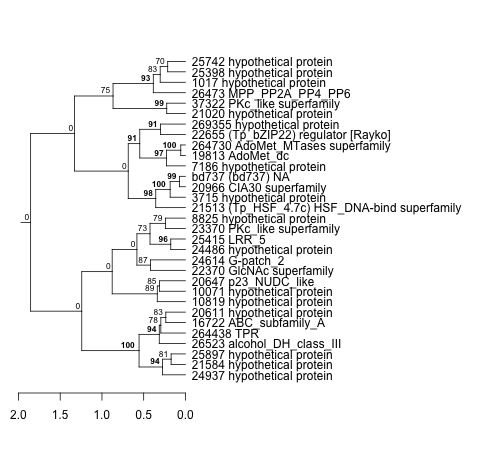
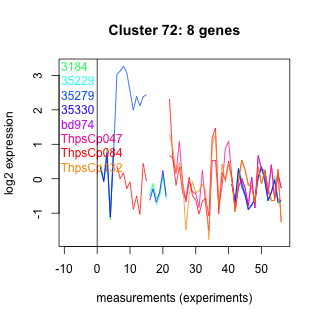
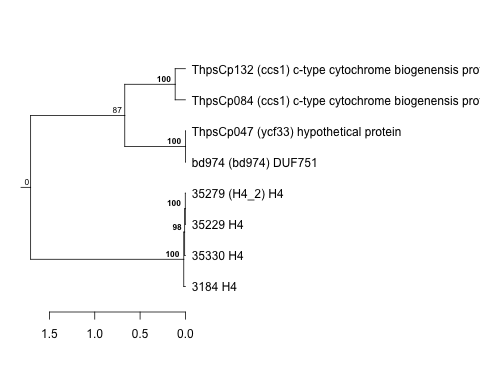
| Thaps_hclust_0230 |
 |
|
|
1.1e-30 |
0.0000000000029 |
lowFe_TMEVA | 0.943000 | 0.0434 |
| Title | Cluster Plot | Dendrogram | e-value | e-value | e-value | Condition | Condition FDR | Condition Difference |
|---|---|---|---|---|---|---|---|---|
| Thaps_hclust_0176 |
 |
 |
29 |
59 |
110 |
co2_elevated_expo_arrays | 0.943000 | 0.0398 |
| Title | Cluster Plot | Dendrogram | e-value | e-value | e-value | Condition | Condition FDR | Condition Difference |
|---|---|---|---|---|---|---|---|---|
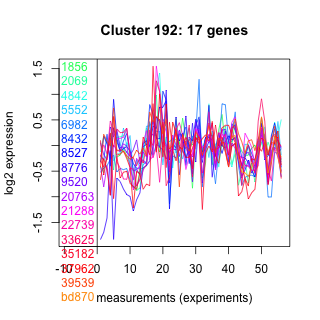
| Thaps_hclust_0192 |
 |
 |
0.000012 |
0.017 |
1.3 |
co2_elevated_expo_arrays | 0.943000 | -0.0379 |
| Title | Cluster Plot | Dendrogram | e-value | e-value | e-value | Condition | Condition FDR | Condition Difference |
|---|---|---|---|---|---|---|---|---|
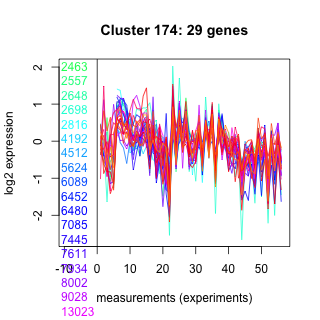
| Thaps_hclust_0174 |
 |
 |
1.3 |
0.99 |
2.2 |
co2_elevated_expo_arrays | 0.943000 | 0.0369 |
| Title | Cluster Plot | Dendrogram | e-value | e-value | e-value | Condition | Condition FDR | Condition Difference |
|---|---|---|---|---|---|---|---|---|
| Thaps_hclust_0074 |
 |
 |
77 |
130 |
300 |
co2_elevated_expo_arrays | 0.943000 | -0.0406 |
| Title | Cluster Plot | Dendrogram | e-value | e-value | e-value | Condition | Condition FDR | Condition Difference |
|---|---|---|---|---|---|---|---|---|
| Thaps_hclust_0401 |
 |
 |
3.5e-16 |
0.000000000077 |
0.000000012 |
co2_elevated_expo_arrays | 0.943000 | -0.0366 |
| Title | Cluster Plot | Dendrogram | e-value | e-value | e-value | Condition | Condition FDR | Condition Difference |
|---|---|---|---|---|---|---|---|---|
| Thaps_hclust_0452 |
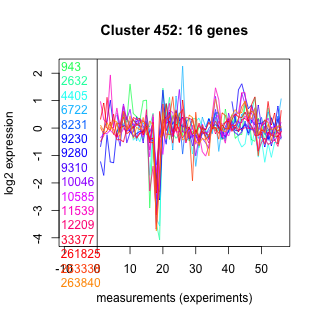 |
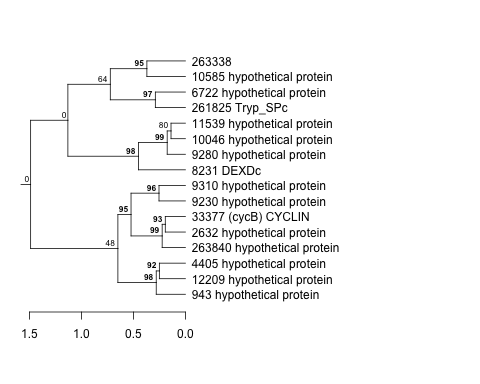 |
84 |
200 |
220 |
co2_elevated_expo_arrays | 0.943000 | -0.0398 |
| Title | Cluster Plot | Dendrogram | e-value | e-value | e-value | Condition | Condition FDR | Condition Difference |
|---|---|---|---|---|---|---|---|---|
| Thaps_hclust_0072 |
 |
 |
1.2e-22 |
1.1e-16 |
0.000000000000011 |
co2_elevated_expo_arrays | 0.943000 | -0.0434 |
| Title | Cluster Plot | Dendrogram | e-value | e-value | e-value | Condition | Condition FDR | Condition Difference |
|---|---|---|---|---|---|---|---|---|
| Thaps_hclust_0343 |
 |
 |
9.7e-16 |
0.000000023 |
0.0000000024 |
highpH_TMEVA | 0.943000 | 0.0172 |
| Title | Cluster Plot | Dendrogram | e-value | e-value | e-value | Condition | Condition FDR | Condition Difference |
|---|---|---|---|---|---|---|---|---|
| Thaps_hclust_0057 |
 |
 |
1.5 |
1.7 |
12 |
highlight_arrays | 0.942000 | -0.0176 |