Hierarchical Clusters
Displaying 1001 - 1100 of 7500
| Title | Cluster Plot | Dendrogram | e-value | e-value | e-value | Condition | Condition FDR | Condition Difference |
|---|---|---|---|---|---|---|---|---|
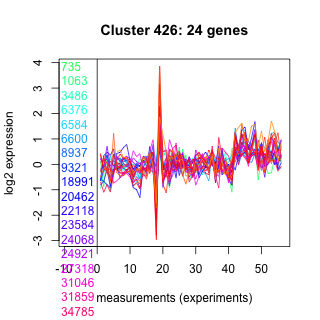
| Thaps_hclust_0426 |
 |
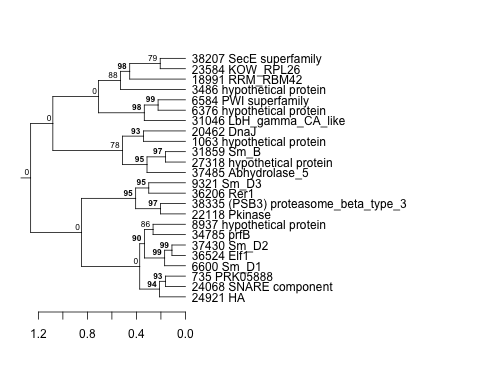 |
0.0000000000000021 |
0.00000000000026 |
0.000025 |
lowN_TMEVA | 0.894000 | -0.0432 |
| Title | Cluster Plot | Dendrogram | e-value | e-value | e-value | Condition | Condition FDR | Condition Difference |
|---|---|---|---|---|---|---|---|---|
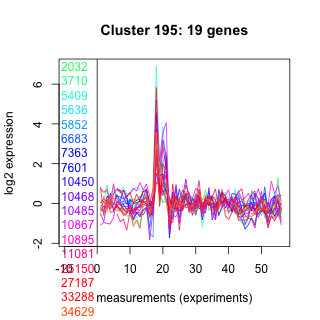
| Thaps_hclust_0195 |
 |
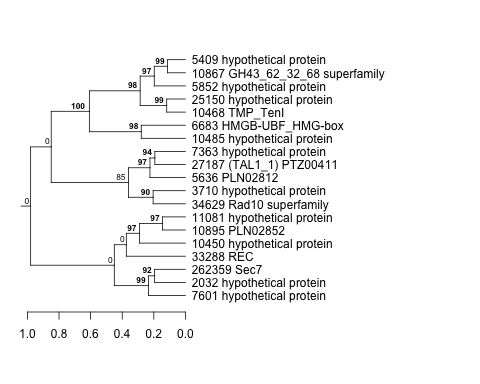 |
0.0031 |
0.024 |
0.00037 |
lowN_TMEVA | 0.894000 | 0.0444 |
| Thaps_hclust_0195 |
|
|
0.0031 |
0.024 |
0.00037 |
highlight_arrays | 0.892000 | -0.0262 |
| Title | Cluster Plot | Dendrogram | e-value | e-value | e-value | Condition | Condition FDR | Condition Difference |
|---|---|---|---|---|---|---|---|---|
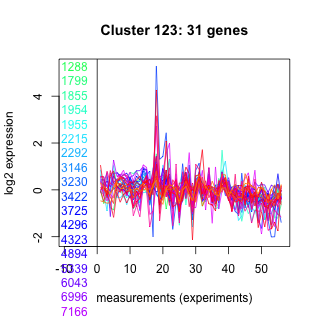
| Thaps_hclust_0123 |
 |
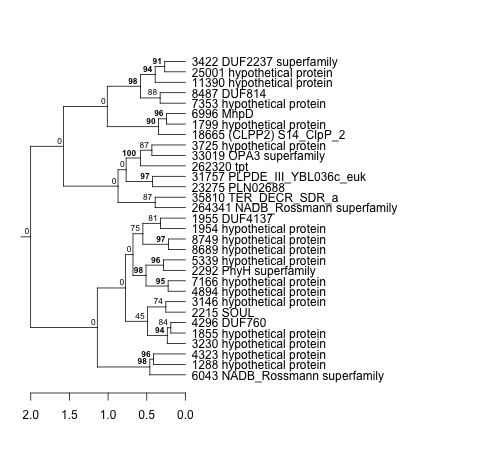 |
0.000073 |
0.05 |
0.076 |
lowN_TMEVA | 0.894000 | -0.0399 |
| Title | Cluster Plot | Dendrogram | e-value | e-value | e-value | Condition | Condition FDR | Condition Difference |
|---|---|---|---|---|---|---|---|---|
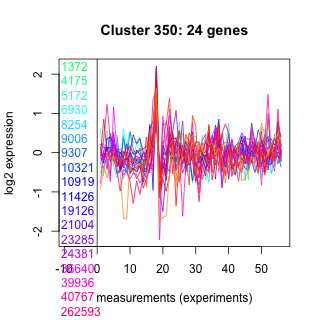
| Thaps_hclust_0350 |
 |
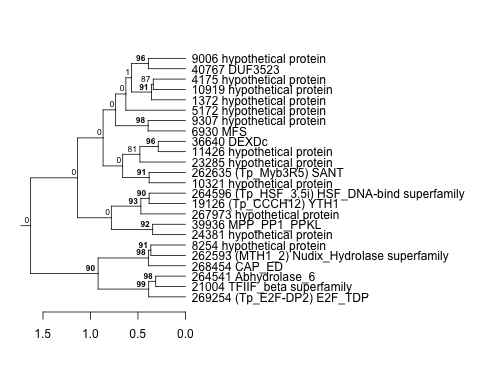 |
0.00016 |
0.13 |
7.1 |
lowN_TMEVA | 0.894000 | 0.042 |
| Thaps_hclust_0350 |
|
|
0.00016 |
0.13 |
7.1 |
lowFe_TMEVA | 0.890000 | -0.0529 |
| Title | Cluster Plot | Dendrogram | e-value | e-value | e-value | Condition | Condition FDR | Condition Difference |
|---|---|---|---|---|---|---|---|---|
| Thaps_hclust_0095 |
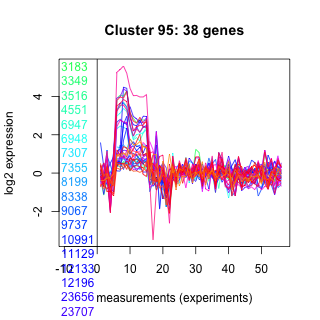 |
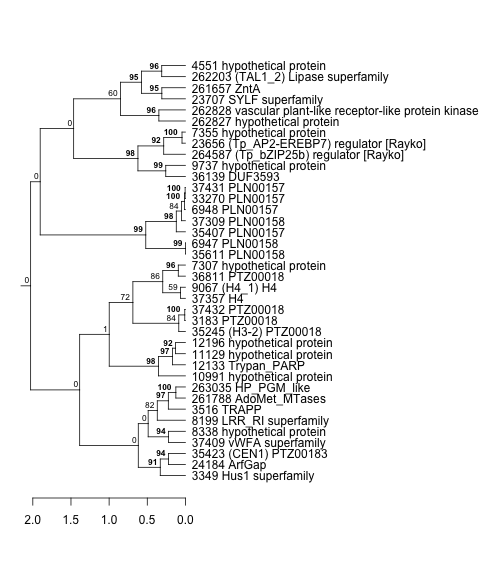 |
5.3e-28 |
1.7e-25 |
1.6e-17 |
lowN_TMEVA | 0.894000 | 0.0437 |
| Title | Cluster Plot | Dendrogram | e-value | e-value | e-value | Condition | Condition FDR | Condition Difference |
|---|---|---|---|---|---|---|---|---|
| Thaps_hclust_0035 |
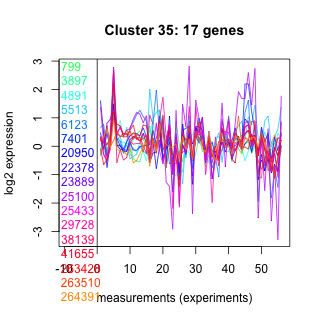 |
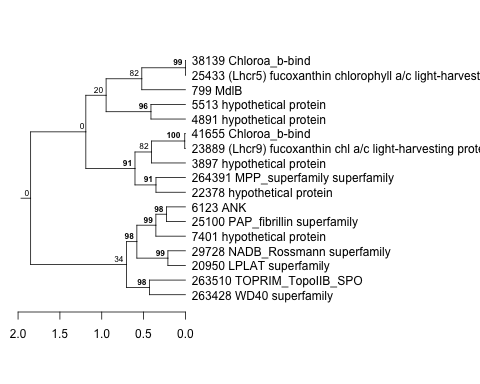 |
0.00023 |
0.0000098 |
0.064 |
lowN_TMEVA | 0.894000 | 0.0451 |
| Title | Cluster Plot | Dendrogram | e-value | e-value | e-value | Condition | Condition FDR | Condition Difference |
|---|---|---|---|---|---|---|---|---|
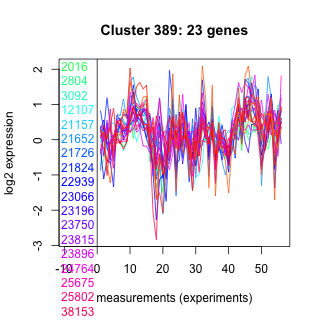
| Thaps_hclust_0389 |
 |
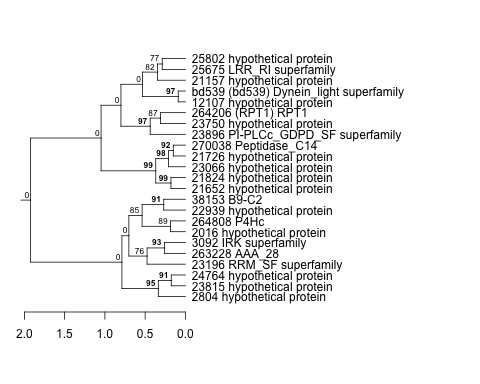 |
0.00000008 |
0.00077 |
340 |
lowN_TMEVA | 0.893000 | -0.0455 |
| Title | Cluster Plot | Dendrogram | e-value | e-value | e-value | Condition | Condition FDR | Condition Difference |
|---|---|---|---|---|---|---|---|---|
| Thaps_hclust_0497 |
 |
 |
0.1 |
5.2 |
29 |
lowSi_TMEVA | 0.893000 | -0.186 |
| Title | Cluster Plot | Dendrogram | e-value | e-value | e-value | Condition | Condition FDR | Condition Difference |
|---|---|---|---|---|---|---|---|---|
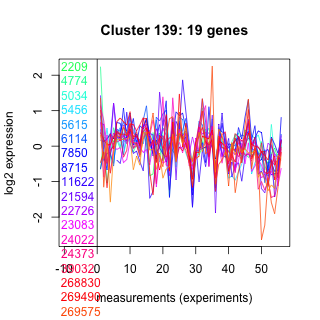
| Thaps_hclust_0139 |
 |
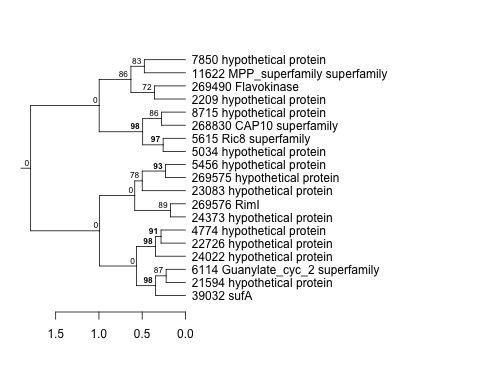 |
0.00014 |
0.00066 |
3 |
co2_elevated_stat_arrays | 0.892000 | 0.0403 |
| Title | Cluster Plot | Dendrogram | e-value | e-value | e-value | Condition | Condition FDR | Condition Difference |
|---|---|---|---|---|---|---|---|---|
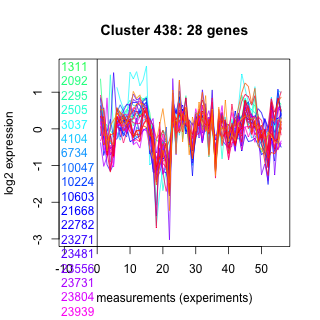
| Thaps_hclust_0438 |
 |
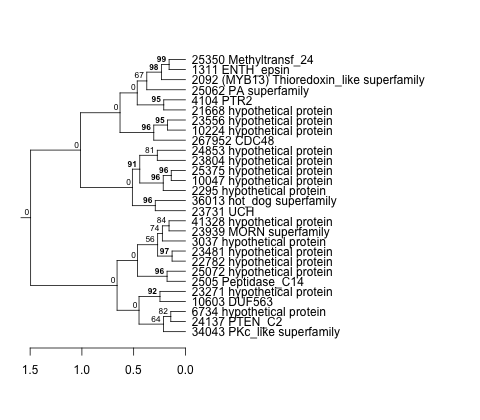 |
0.0024 |
1.5 |
3.6 |
co2_elevated_stat_arrays | 0.892000 | 0.0376 |
| Title | Cluster Plot | Dendrogram | e-value | e-value | e-value | Condition | Condition FDR | Condition Difference |
|---|---|---|---|---|---|---|---|---|
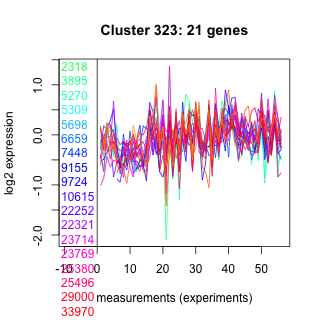
| Thaps_hclust_0323 |
 |
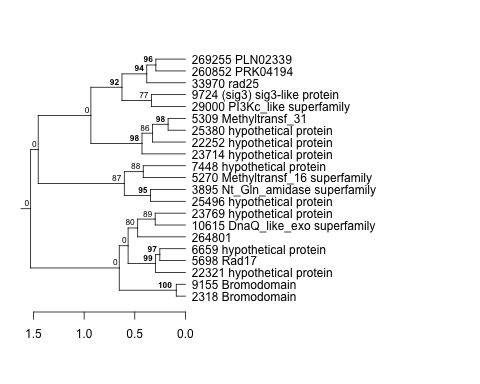 |
0.0011 |
0.014 |
36 |
highlight_arrays | 0.892000 | 0.0253 |
| Title | Cluster Plot | Dendrogram | e-value | e-value | e-value | Condition | Condition FDR | Condition Difference |
|---|---|---|---|---|---|---|---|---|
| Thaps_hclust_0435 |
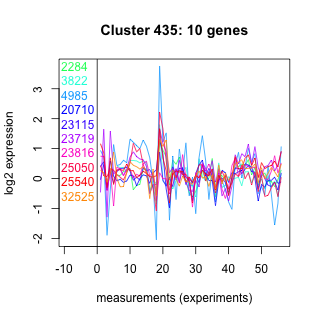 |
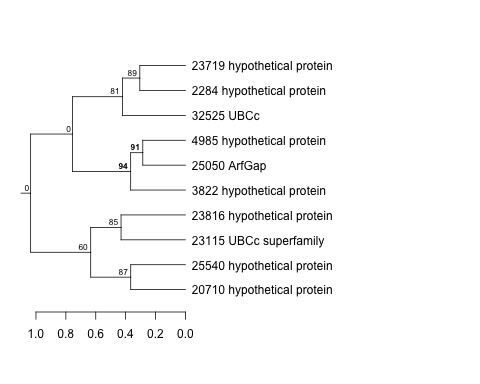 |
0.17 |
0.24 |
1.5 |
co2_elevated_stat_arrays | 0.892000 | 0.0437 |
| Title | Cluster Plot | Dendrogram | e-value | e-value | e-value | Condition | Condition FDR | Condition Difference |
|---|---|---|---|---|---|---|---|---|
| Thaps_hclust_0347 |
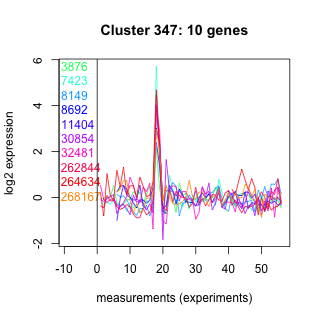 |
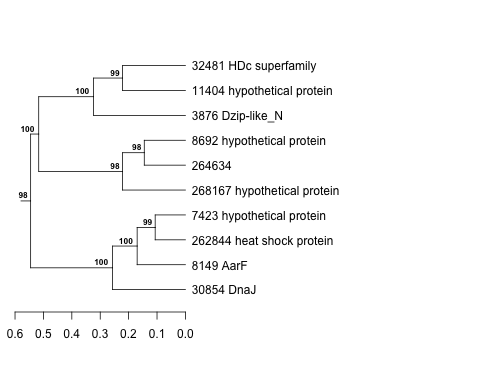 |
1.2 |
0.85 |
91 |
co2_elevated_stat_arrays | 0.892000 | -0.0457 |
| Title | Cluster Plot | Dendrogram | e-value | e-value | e-value | Condition | Condition FDR | Condition Difference |
|---|---|---|---|---|---|---|---|---|
| Thaps_hclust_0145 |
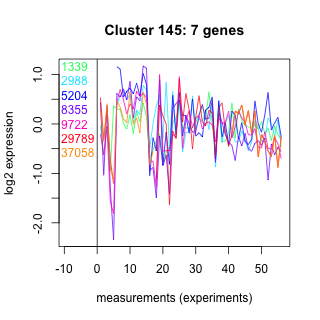 |
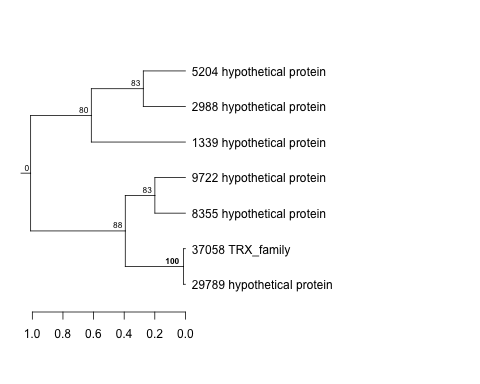 |
0.015 |
1.6 |
11 |
co2_elevated_stat_arrays | 0.892000 | 0.053 |
| Title | Cluster Plot | Dendrogram | e-value | e-value | e-value | Condition | Condition FDR | Condition Difference |
|---|---|---|---|---|---|---|---|---|
| Thaps_hclust_0443 |
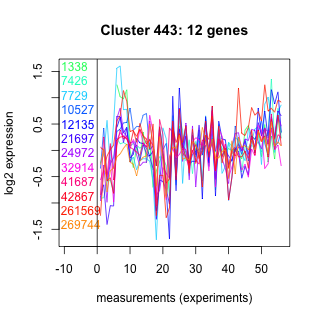 |
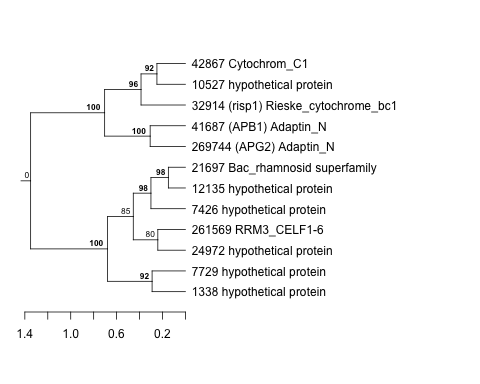 |
0.96 |
9.8 |
42 |
co2_elevated_stat_arrays | 0.892000 | 0.0413 |
| Title | Cluster Plot | Dendrogram | e-value | e-value | e-value | Condition | Condition FDR | Condition Difference |
|---|---|---|---|---|---|---|---|---|
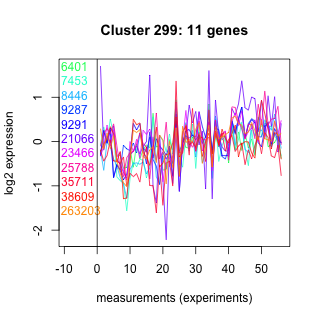
| Thaps_hclust_0299 |
 |
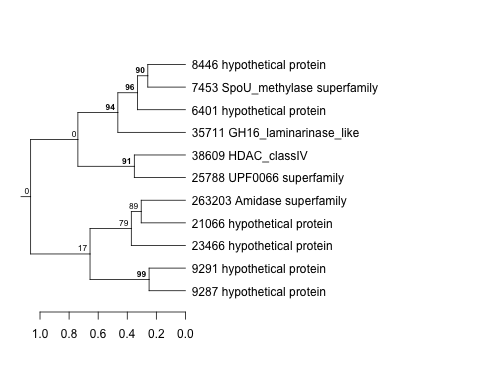 |
0.0056 |
1.7 |
6.7 |
co2_elevated_stat_arrays | 0.892000 | -0.0432 |
| Thaps_hclust_0299 |
|
|
0.0056 |
1.7 |
6.7 |
lowFe_TMEVA | 0.888000 | -0.0605 |
| Thaps_hclust_0299 |
|
|
0.0056 |
1.7 |
6.7 |
co2_elevated_expo_arrays | 0.873000 | 0.0692 |
| Title | Cluster Plot | Dendrogram | e-value | e-value | e-value | Condition | Condition FDR | Condition Difference |
|---|---|---|---|---|---|---|---|---|
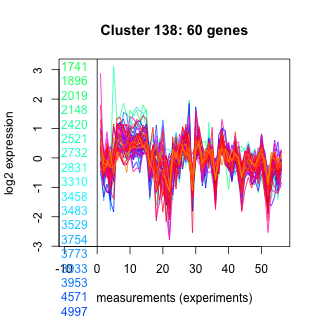
| Thaps_hclust_0138 |
 |
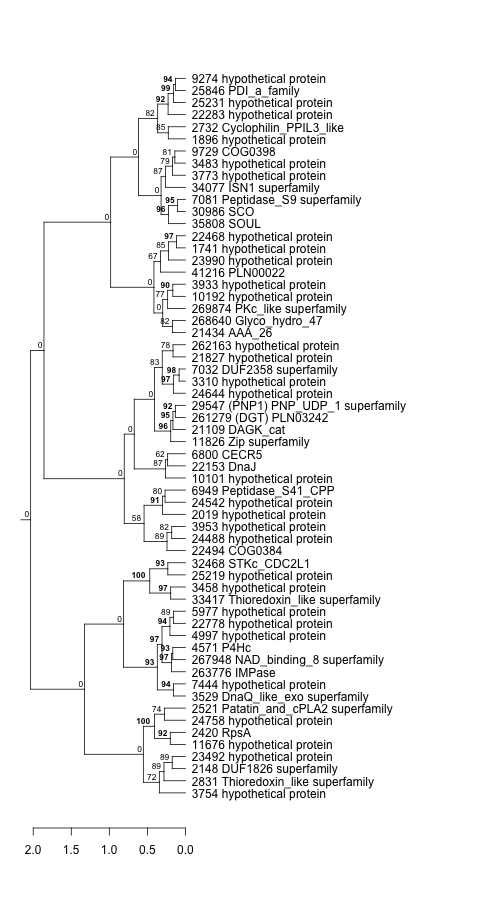 |
0.00000000000028 |
0.0000000011 |
0.0000065 |
exponential_vs_stationary_24light | 0.891000 | -0.0446 |
| Title | Cluster Plot | Dendrogram | e-value | e-value | e-value | Condition | Condition FDR | Condition Difference |
|---|---|---|---|---|---|---|---|---|
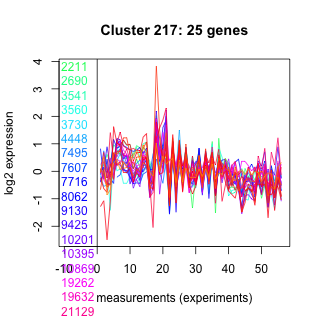
| Thaps_hclust_0217 |
 |
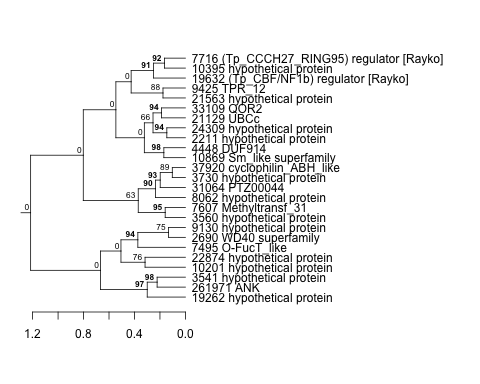 |
0.00000028 |
0.95 |
9.7 |
co2_elevated_expo_arrays | 0.890000 | 0.0566 |
| Title | Cluster Plot | Dendrogram | e-value | e-value | e-value | Condition | Condition FDR | Condition Difference |
|---|---|---|---|---|---|---|---|---|
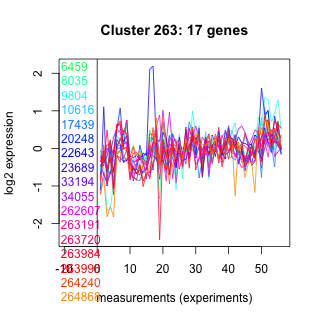
| Thaps_hclust_0263 |
 |
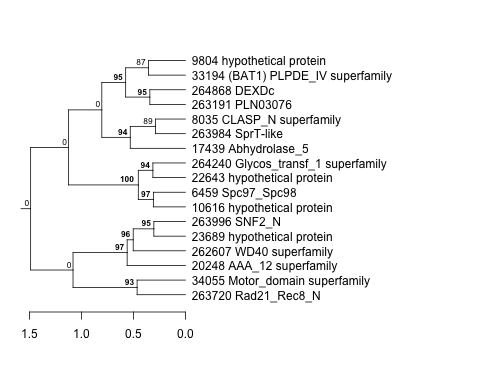 |
0.15 |
0.25 |
1.4 |
exponential_vs_stationary_24highlight | 0.890000 | 0.0208 |
| Title | Cluster Plot | Dendrogram | e-value | e-value | e-value | Condition | Condition FDR | Condition Difference |
|---|---|---|---|---|---|---|---|---|
| Thaps_hclust_0197 |
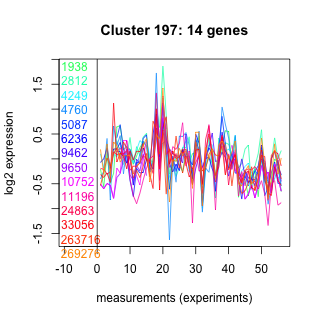 |
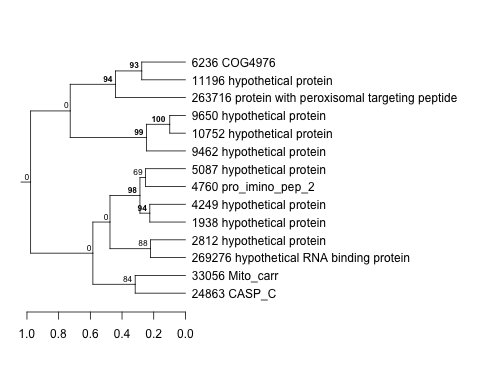 |
0.12 |
0.3 |
0.65 |
co2_elevated_expo_arrays | 0.890000 | -0.0614 |
| Title | Cluster Plot | Dendrogram | e-value | e-value | e-value | Condition | Condition FDR | Condition Difference |
|---|---|---|---|---|---|---|---|---|
| Thaps_hclust_0441 |
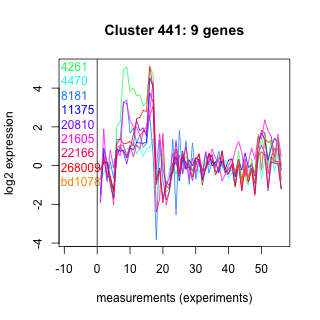 |
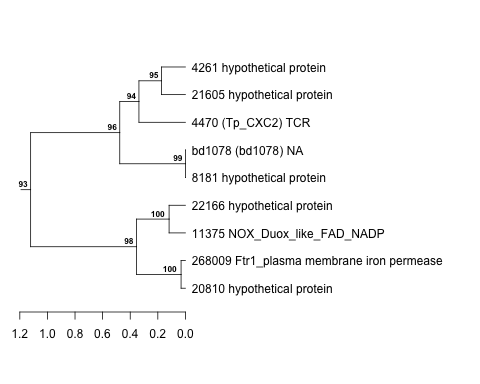 |
0.00081 |
0.001 |
0.0015 |
diel_exponential_vs_stationary | 0.889000 | -0.0488 |
| Title | Cluster Plot | Dendrogram | e-value | e-value | e-value | Condition | Condition FDR | Condition Difference |
|---|---|---|---|---|---|---|---|---|
| Thaps_hclust_0168 |
 |
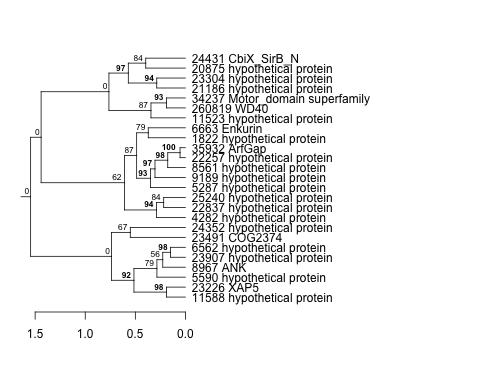 |
0.00000076 |
0.000000022 |
0.0000028 |
diel_exponential_vs_stationary | 0.889000 | 0.0312 |
| Title | Cluster Plot | Dendrogram | e-value | e-value | e-value | Condition | Condition FDR | Condition Difference |
|---|---|---|---|---|---|---|---|---|
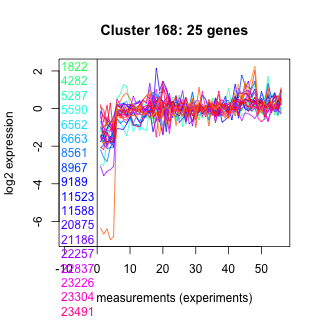
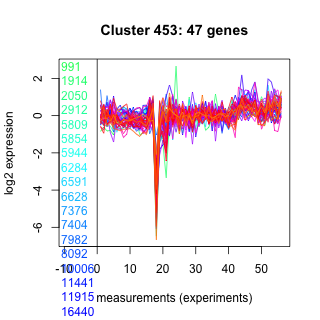
| Thaps_hclust_0453 |
 |
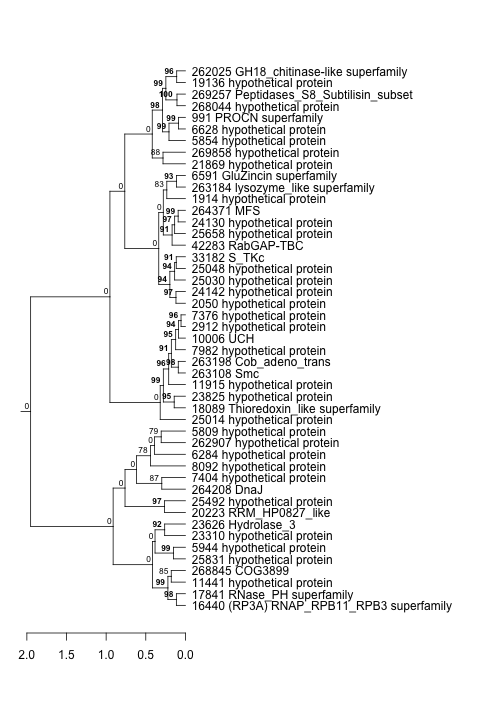 |
0.000000000093 |
0.000000041 |
0.00016 |
lowFe_KTKB_Day3 | 0.889000 | 0.0296 |
| Title | Cluster Plot | Dendrogram | e-value | e-value | e-value | Condition | Condition FDR | Condition Difference |
|---|---|---|---|---|---|---|---|---|
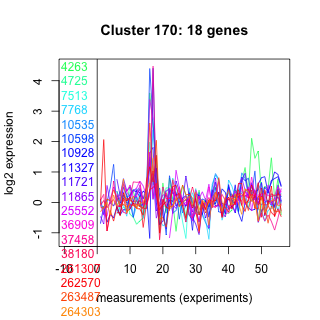
| Thaps_hclust_0170 |
 |
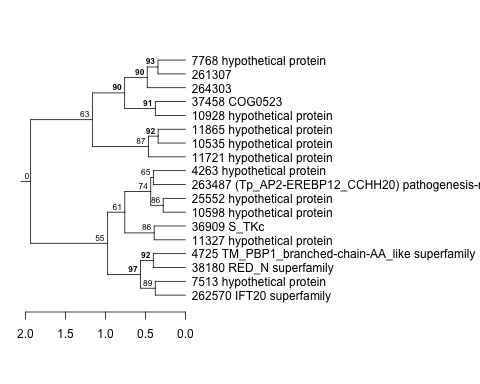 |
0.028 |
1.8 |
150 |
diel_light_vs_dark | 0.889000 | -0.0496 |
| Title | Cluster Plot | Dendrogram | e-value | e-value | e-value | Condition | Condition FDR | Condition Difference |
|---|---|---|---|---|---|---|---|---|
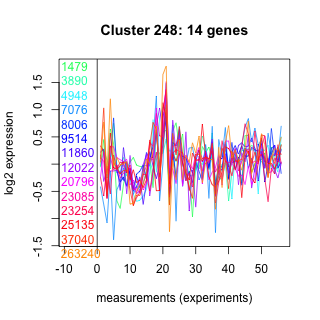
| Thaps_hclust_0248 |
 |
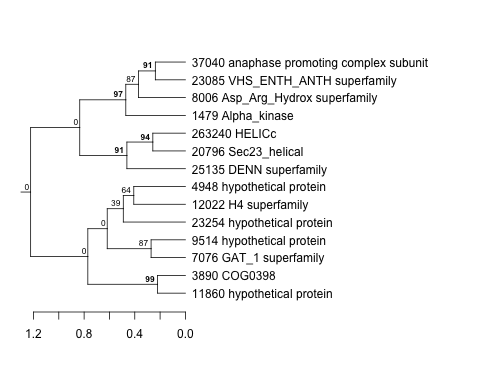 |
0.000037 |
0.000078 |
39 |
co2_elevated_expo_arrays | 0.888000 | -0.0622 |
| Thaps_hclust_0248 |
|
|
0.000037 |
0.000078 |
39 |
diel_exponential_vs_stationary | 0.880000 | 0.0437 |
| Title | Cluster Plot | Dendrogram | e-value | e-value | e-value | Condition | Condition FDR | Condition Difference |
|---|---|---|---|---|---|---|---|---|
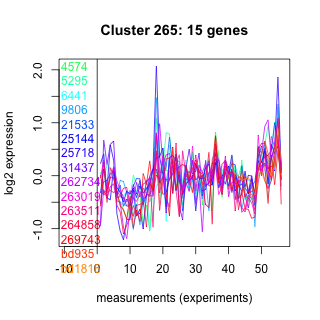
| Thaps_hclust_0265 |
 |
 |
0.02 |
0.000051 |
27 |
lowFe_TMEVA | 0.888000 | 0.0586 |
| Title | Cluster Plot | Dendrogram | e-value | e-value | e-value | Condition | Condition FDR | Condition Difference |
|---|---|---|---|---|---|---|---|---|
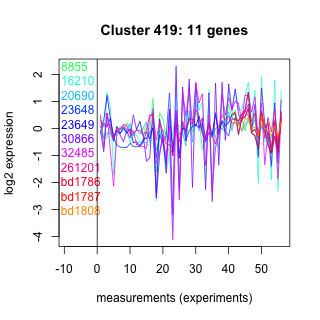
| Thaps_hclust_0419 |
 |
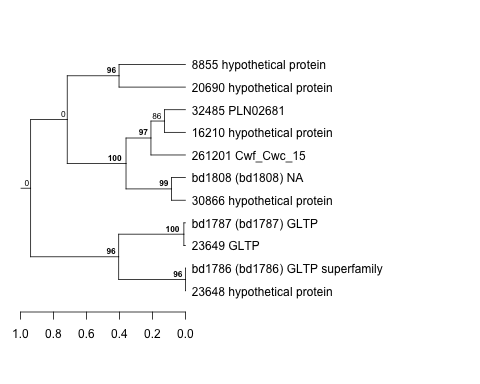 |
0.0014 |
0.00031 |
0.0014 |
co2_elevated_expo_arrays | 0.888000 | -0.0645 |
| Title | Cluster Plot | Dendrogram | e-value | e-value | e-value | Condition | Condition FDR | Condition Difference |
|---|---|---|---|---|---|---|---|---|
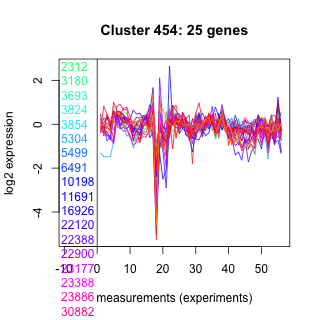
| Thaps_hclust_0454 |
 |
 |
0.0000012 |
0.00054 |
0.21 |
co2_elevated_expo_arrays | 0.888000 | 0.0582 |
| Title | Cluster Plot | Dendrogram | e-value | e-value | e-value | Condition | Condition FDR | Condition Difference |
|---|---|---|---|---|---|---|---|---|
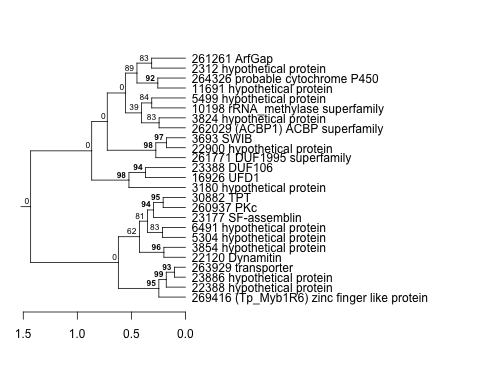
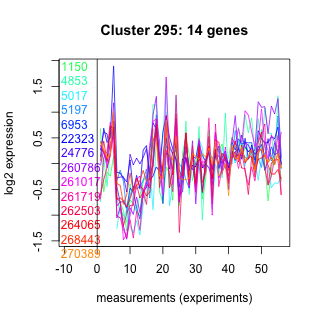
| Thaps_hclust_0295 |
 |
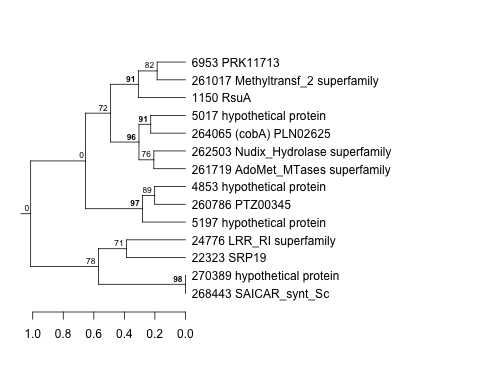 |
0.0000053 |
0.00095 |
0.0005 |
co2_elevated_expo_arrays | 0.888000 | 0.0619 |
| Thaps_hclust_0295 |
|
|
0.0000053 |
0.00095 |
0.0005 |
diel_exponential_vs_stationary | 0.882000 | -0.043 |
| Title | Cluster Plot | Dendrogram | e-value | e-value | e-value | Condition | Condition FDR | Condition Difference |
|---|---|---|---|---|---|---|---|---|
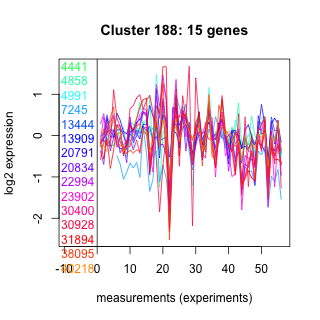
| Thaps_hclust_0188 |
 |
 |
0.0058 |
0.31 |
0.34 |
lowFe_TMEVA | 0.888000 | -0.0592 |
| Title | Cluster Plot | Dendrogram | e-value | e-value | e-value | Condition | Condition FDR | Condition Difference |
|---|---|---|---|---|---|---|---|---|
| Thaps_hclust_0221 |
 |
|
|
1e-37 |
0.0000000000012 |
lowFe_TMEVA | 0.888000 | -0.0579 |
| Title | Cluster Plot | Dendrogram | e-value | e-value | e-value | Condition | Condition FDR | Condition Difference |
|---|---|---|---|---|---|---|---|---|
| Thaps_hclust_0327 |
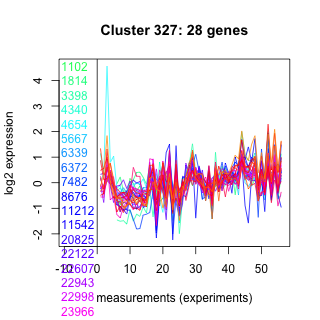 |
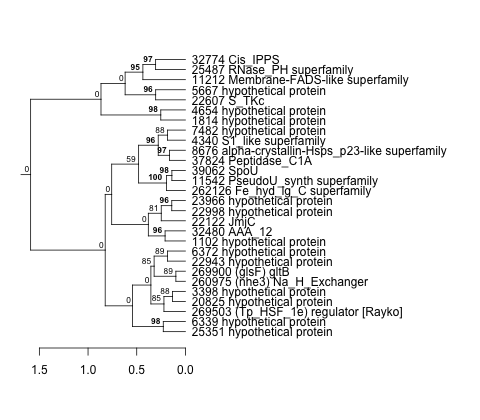 |
0.0000000037 |
0.013 |
3.8 |
lowFe_TMEVA | 0.888000 | -0.0562 |
| Title | Cluster Plot | Dendrogram | e-value | e-value | e-value | Condition | Condition FDR | Condition Difference |
|---|---|---|---|---|---|---|---|---|
| Thaps_hclust_0096 |
 |
 |
0.0000028 |
0.9 |
0.38 |
lowFe_TMEVA | 0.888000 | -0.0538 |
| Title | Cluster Plot | Dendrogram | e-value | e-value | e-value | Condition | Condition FDR | Condition Difference |
|---|---|---|---|---|---|---|---|---|
| Thaps_hclust_0202 |
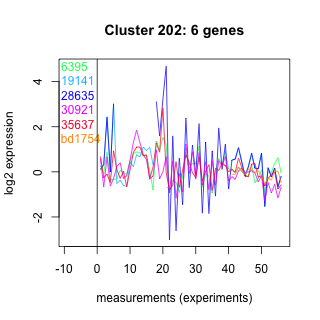 |
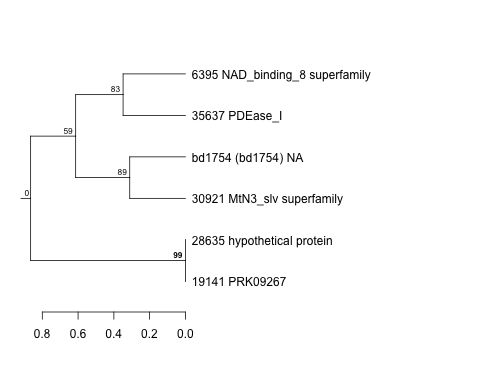 |
0.0064 |
0.023 |
0.32 |
lowFe_TMEVA | 0.888000 | -0.0684 |
| Title | Cluster Plot | Dendrogram | e-value | e-value | e-value | Condition | Condition FDR | Condition Difference |
|---|---|---|---|---|---|---|---|---|
| Thaps_hclust_0429 |
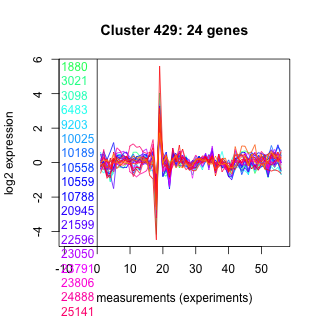 |
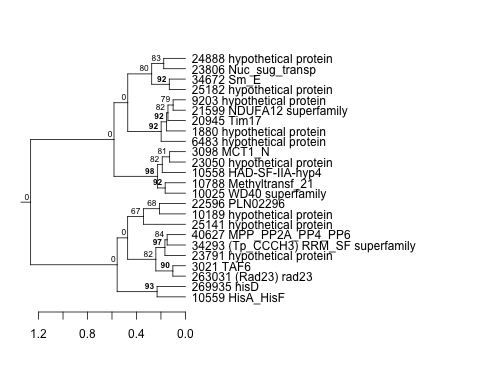 |
0.0000000033 |
0.00000039 |
0.000054 |
lowFe_TMEVA | 0.888000 | 0.0538 |
| Title | Cluster Plot | Dendrogram | e-value | e-value | e-value | Condition | Condition FDR | Condition Difference |
|---|---|---|---|---|---|---|---|---|
| Thaps_hclust_0252 |
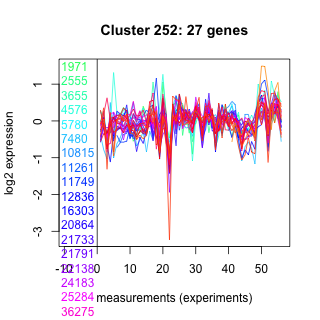 |
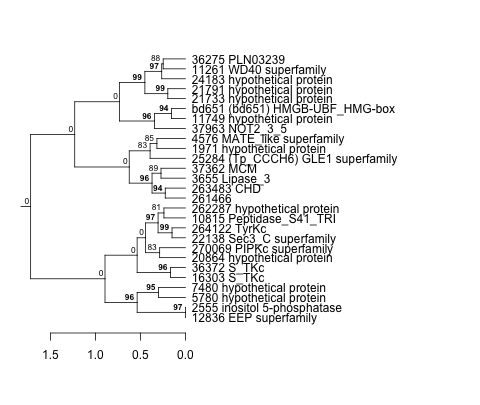 |
0.000053 |
0.0057 |
2.1 |
lowFe_TMEVA | 0.888000 | -0.0535 |
| Title | Cluster Plot | Dendrogram | e-value | e-value | e-value | Condition | Condition FDR | Condition Difference |
|---|---|---|---|---|---|---|---|---|
| Thaps_hclust_0357 |
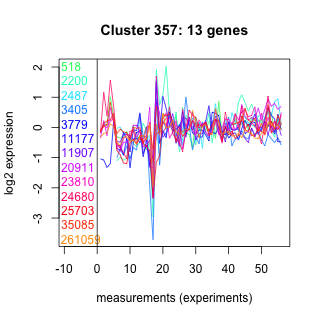 |
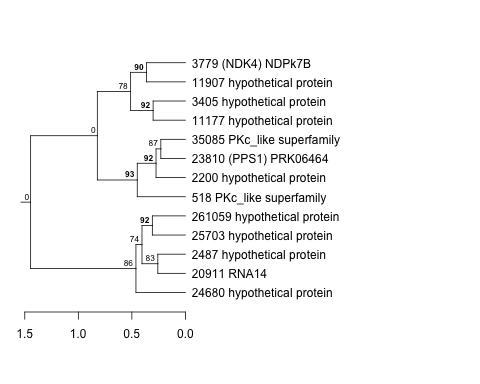 |
0.077 |
0.1 |
0.81 |
lowFe_TMEVA | 0.888000 | 0.0622 |
| Title | Cluster Plot | Dendrogram | e-value | e-value | e-value | Condition | Condition FDR | Condition Difference |
|---|---|---|---|---|---|---|---|---|
| Thaps_hclust_0127 |
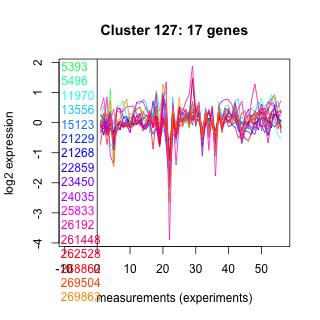 |
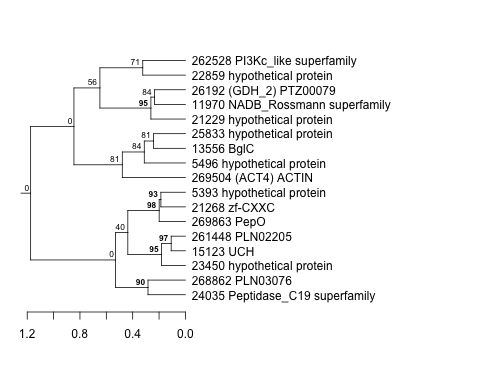 |
2.6 |
32 |
48 |
lowFe_TMEVA | 0.888000 | 0.0583 |
| Title | Cluster Plot | Dendrogram | e-value | e-value | e-value | Condition | Condition FDR | Condition Difference |
|---|---|---|---|---|---|---|---|---|
| Thaps_hclust_0445 |
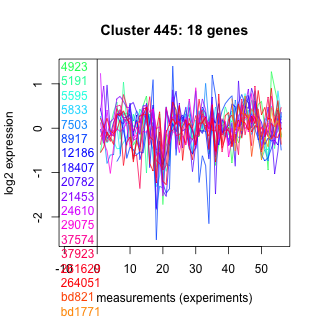 |
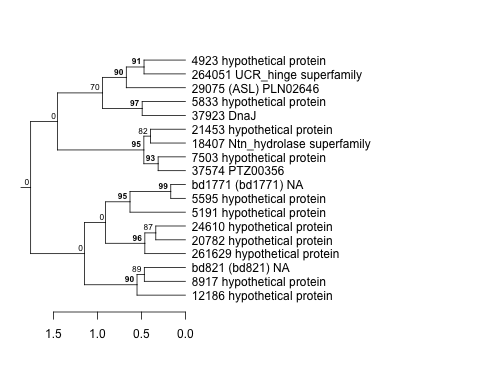 |
0.000046 |
6.9 |
33 |
lowFe_TMEVA | 0.888000 | -0.0577 |
| Title | Cluster Plot | Dendrogram | e-value | e-value | e-value | Condition | Condition FDR | Condition Difference |
|---|---|---|---|---|---|---|---|---|
| Thaps_hclust_0099 |
 |
 |
0.0000000000000032 |
0.000000000000013 |
0.000000000000025 |
lowFe_KTKB_Day3 | 0.887000 | 0.0802 |
| Title | Cluster Plot | Dendrogram | e-value | e-value | e-value | Condition | Condition FDR | Condition Difference |
|---|---|---|---|---|---|---|---|---|
| Thaps_hclust_0235 |
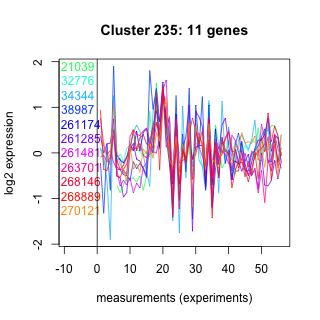 |
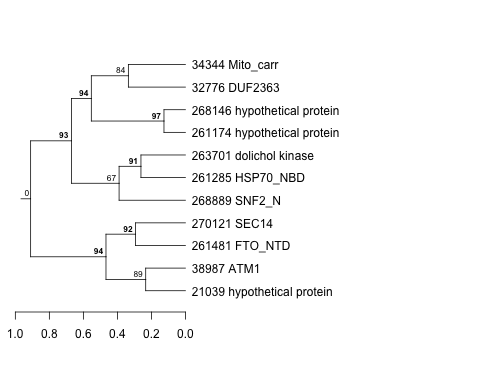 |
0.47 |
5.6 |
74 |
co2_elevated_stat_arrays | 0.887000 | 0.0467 |
| Title | Cluster Plot | Dendrogram | e-value | e-value | e-value | Condition | Condition FDR | Condition Difference |
|---|---|---|---|---|---|---|---|---|
| Thaps_hclust_0272 |
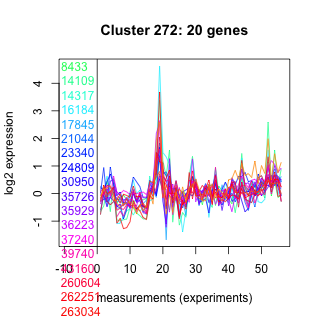 |
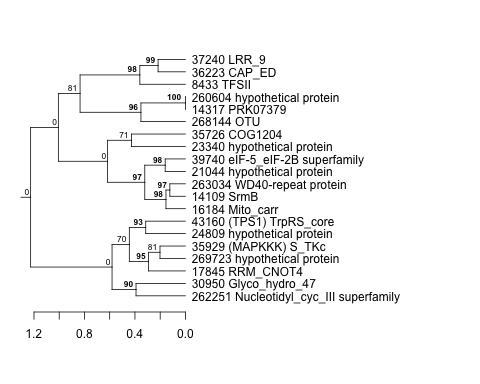 |
0.0048 |
0.01 |
0.059 |
diel_exponential_vs_stationary | 0.887000 | -0.0341 |
| Title | Cluster Plot | Dendrogram | e-value | e-value | e-value | Condition | Condition FDR | Condition Difference |
|---|---|---|---|---|---|---|---|---|
| Thaps_hclust_0042 |
 |
 |
0.26 |
5.9 |
0.46 |
lowFe_TMEVA | 0.886000 | 0.0632 |
| Title | Cluster Plot | Dendrogram | e-value | e-value | e-value | Condition | Condition FDR | Condition Difference |
|---|---|---|---|---|---|---|---|---|
| Thaps_hclust_0498 |
 |
 |
1.3 |
1.8 |
1.8 |
lowFe_KTKB_Day3 | 0.886000 | 0.0502 |
| Title | Cluster Plot | Dendrogram | e-value | e-value | e-value | Condition | Condition FDR | Condition Difference |
|---|---|---|---|---|---|---|---|---|
| Thaps_hclust_0373 |
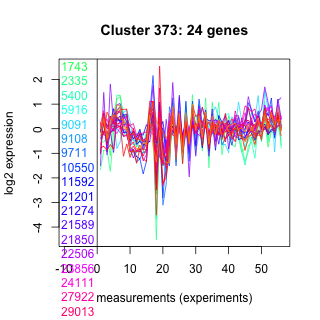 |
 |
0.00017 |
0.001 |
0.066 |
co2_elevated_stat_arrays | 0.886000 | -0.0432 |
| Title | Cluster Plot | Dendrogram | e-value | e-value | e-value | Condition | Condition FDR | Condition Difference |
|---|---|---|---|---|---|---|---|---|
| Thaps_hclust_0128 |
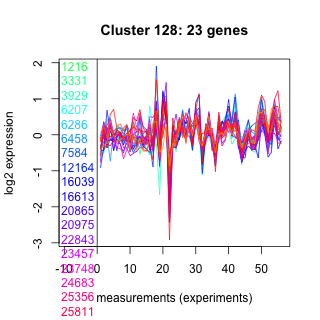 |
 |
0.0000000058 |
0.00033 |
21 |
lowFe_TMEVA | 0.886000 | -0.0595 |
| Title | Cluster Plot | Dendrogram | e-value | e-value | e-value | Condition | Condition FDR | Condition Difference |
|---|---|---|---|---|---|---|---|---|
| Thaps_hclust_0356 |
 |
 |
2.1 |
41 |
71 |
lowFe_TMEVA | 0.886000 | 0.0714 |
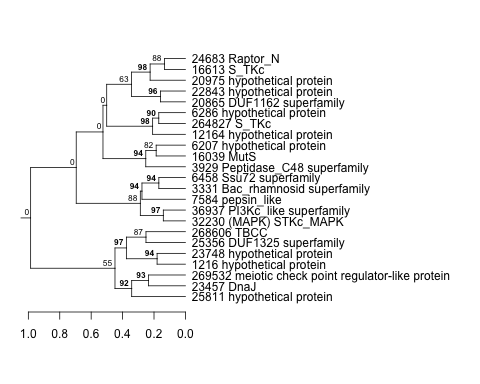
| Title | Cluster Plot | Dendrogram | e-value | e-value | e-value | Condition | Condition FDR | Condition Difference |
|---|---|---|---|---|---|---|---|---|
| Thaps_hclust_0292 |
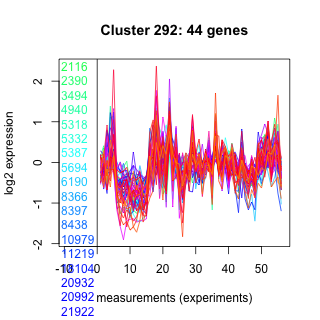 |
 |
1.4e-30 |
0.00000000000037 |
0.0000067 |
lowFe_KTKB_Day3 | 0.885000 | 0.0319 |
| Title | Cluster Plot | Dendrogram | e-value | e-value | e-value | Condition | Condition FDR | Condition Difference |
|---|---|---|---|---|---|---|---|---|
| Thaps_hclust_0355 |
 |
 |
0.49 |
16 |
310 |
lowN_TMEVA | 0.885000 | -0.0594 |
| Title | Cluster Plot | Dendrogram | e-value | e-value | e-value | Condition | Condition FDR | Condition Difference |
|---|---|---|---|---|---|---|---|---|
| Thaps_hclust_0008 |
 |
 |
0.000000000000034 |
0.0000000000037 |
0.0000000000018 |
diel_light_vs_dark | 0.885000 | 0.0454 |
| Title | Cluster Plot | Dendrogram | e-value | e-value | e-value | Condition | Condition FDR | Condition Difference |
|---|---|---|---|---|---|---|---|---|
| Thaps_hclust_0423 |
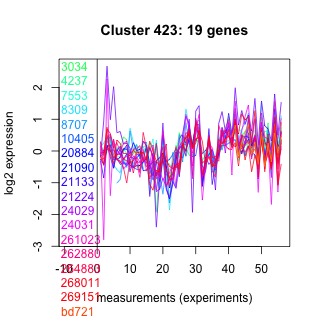 |
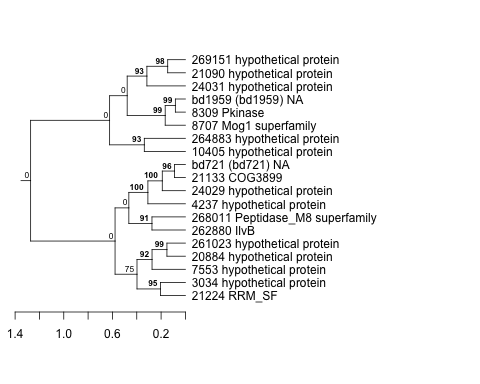 |
0.00046 |
0.13 |
9.2 |
lowtemp_TMEVA | 0.884000 | 0.0461 |
| Title | Cluster Plot | Dendrogram | e-value | e-value | e-value | Condition | Condition FDR | Condition Difference |
|---|---|---|---|---|---|---|---|---|
| Thaps_hclust_0348 |
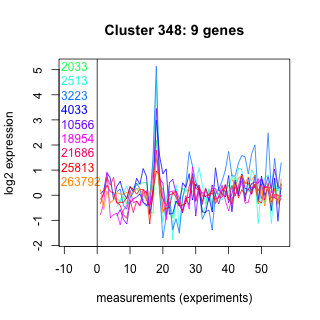 |
 |
8.7 |
34 |
60 |
lowtemp_TMEVA | 0.884000 | -0.0656 |
| Title | Cluster Plot | Dendrogram | e-value | e-value | e-value | Condition | Condition FDR | Condition Difference |
|---|---|---|---|---|---|---|---|---|
| Thaps_hclust_0343 |
 |
 |
9.7e-16 |
0.000000023 |
0.0000000024 |
lowFe_KTKB_Day5 | 0.884000 | 0.029 |
| Title | Cluster Plot | Dendrogram | e-value | e-value | e-value | Condition | Condition FDR | Condition Difference |
|---|---|---|---|---|---|---|---|---|
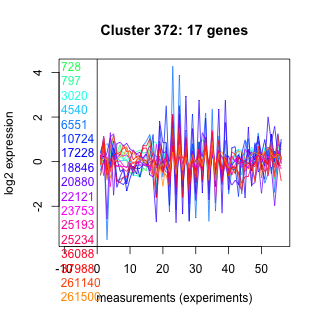
| Thaps_hclust_0372 |
 |
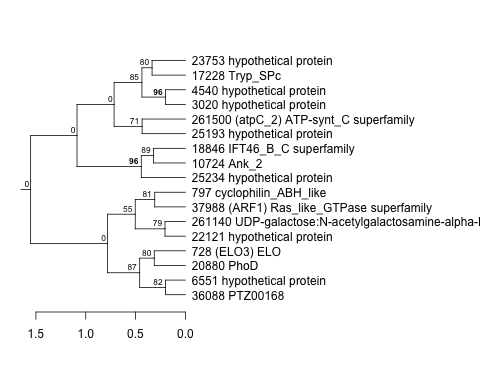 |
0.0016 |
0.064 |
18 |
diel_exponential_vs_stationary | 0.884000 | 0.0366 |
| Thaps_hclust_0372 |
|
|
0.0016 |
0.064 |
18 |
co2_elevated_stat_arrays | 0.884000 | 0.0445 |
| Title | Cluster Plot | Dendrogram | e-value | e-value | e-value | Condition | Condition FDR | Condition Difference |
|---|---|---|---|---|---|---|---|---|
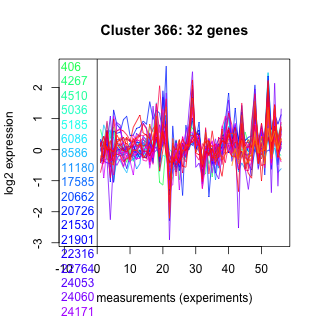
| Thaps_hclust_0366 |
 |
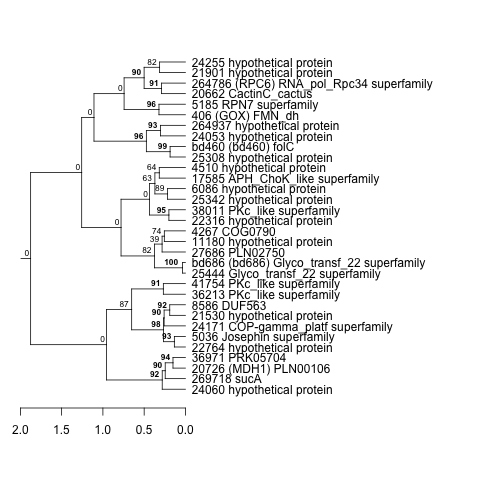 |
0.000011 |
0.054 |
0.47 |
lowFe_TMEVA | 0.884000 | -0.0585 |
| Thaps_hclust_0366 |
|
|
0.000011 |
0.054 |
0.47 |
co2_elevated_expo_arrays | 0.873000 | -0.0621 |
| Title | Cluster Plot | Dendrogram | e-value | e-value | e-value | Condition | Condition FDR | Condition Difference |
|---|---|---|---|---|---|---|---|---|
| Thaps_hclust_0019 |
 |
 |
0.0000001 |
0.00000017 |
0.000037 |
lowtemp_TMEVA | 0.884000 | -0.0408 |
| Title | Cluster Plot | Dendrogram | e-value | e-value | e-value | Condition | Condition FDR | Condition Difference |
|---|---|---|---|---|---|---|---|---|
| Thaps_hclust_0161 |
 |
 |
1.8 |
13 |
18 |
co2_elevated_stat_arrays | 0.884000 | -0.0521 |
| Title | Cluster Plot | Dendrogram | e-value | e-value | e-value | Condition | Condition FDR | Condition Difference |
|---|---|---|---|---|---|---|---|---|
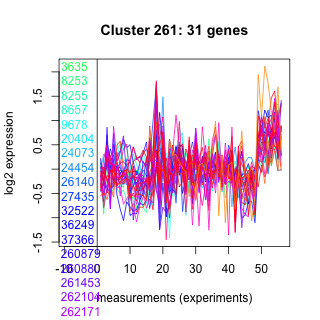
| Thaps_hclust_0261 |
 |
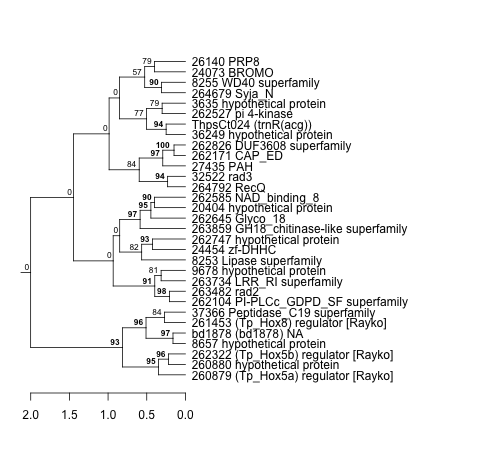 |
0.00000000025 |
0.000000005 |
0.0000069 |
lowFe_KTKB_Day5 | 0.884000 | -0.0282 |
| Title | Cluster Plot | Dendrogram | e-value | e-value | e-value | Condition | Condition FDR | Condition Difference |
|---|---|---|---|---|---|---|---|---|
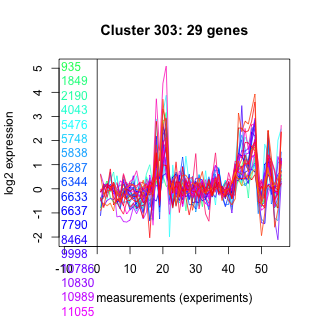
| Thaps_hclust_0303 |
 |
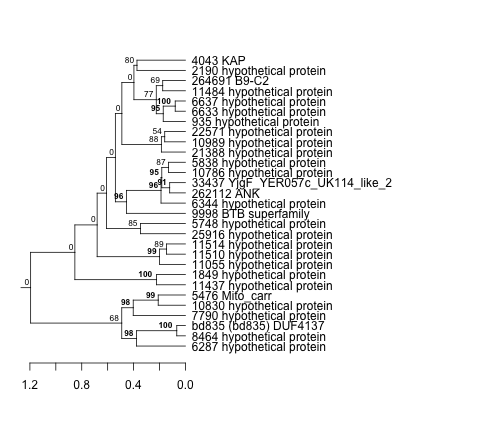 |
0.00096 |
0.0021 |
0.0014 |
diel_exponential_vs_stationary | 0.883000 | 0.0308 |
| Title | Cluster Plot | Dendrogram | e-value | e-value | e-value | Condition | Condition FDR | Condition Difference |
|---|---|---|---|---|---|---|---|---|
| Thaps_hclust_0383 |
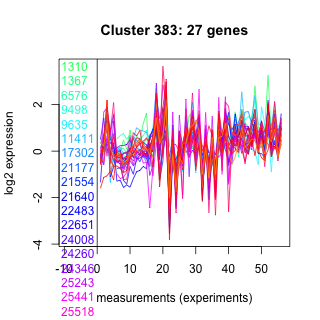 |
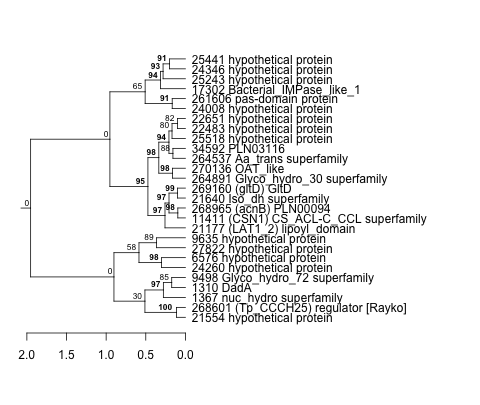 |
0.00049 |
0.088 |
0.58 |
highlight_arrays | 0.883000 | 0.0238 |
| Title | Cluster Plot | Dendrogram | e-value | e-value | e-value | Condition | Condition FDR | Condition Difference |
|---|---|---|---|---|---|---|---|---|
| Thaps_hclust_0140 |
 |
 |
0.0000000084 |
0.000091 |
0.0000072 |
co2_elevated_expo_arrays | 0.882000 | 0.0594 |
| Title | Cluster Plot | Dendrogram | e-value | e-value | e-value | Condition | Condition FDR | Condition Difference |
|---|---|---|---|---|---|---|---|---|
| Thaps_hclust_0157 |
 |
 |
2 |
4.6 |
4.9 |
diel_light_vs_dark | 0.882000 | -0.0678 |
| Title | Cluster Plot | Dendrogram | e-value | e-value | e-value | Condition | Condition FDR | Condition Difference |
|---|---|---|---|---|---|---|---|---|
| Thaps_hclust_0155 |
 |
 |
0.32 |
5.4 |
2 |
diel_light_vs_dark | 0.882000 | 0.0596 |
| Title | Cluster Plot | Dendrogram | e-value | e-value | e-value | Condition | Condition FDR | Condition Difference |
|---|---|---|---|---|---|---|---|---|
| Thaps_hclust_0369 |
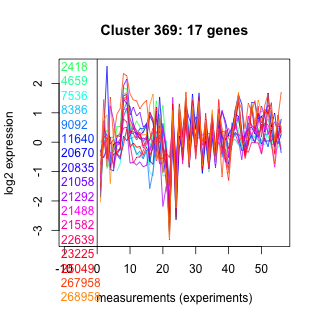 |
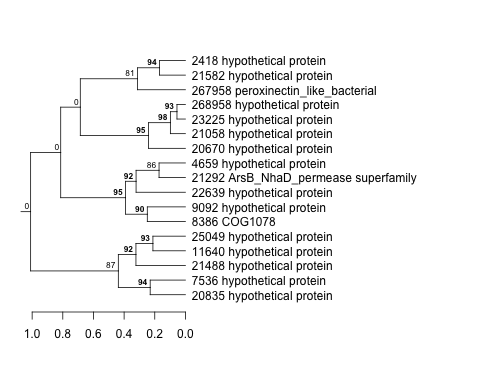 |
0.34 |
2.4 |
5 |
highlight_arrays | 0.881000 | -0.0299 |
| Title | Cluster Plot | Dendrogram | e-value | e-value | e-value | Condition | Condition FDR | Condition Difference |
|---|---|---|---|---|---|---|---|---|
| Thaps_hclust_0305 |
 |
 |
0.66 |
3.2 |
6.5 |
exponential_vs_stationary_24highlight | 0.880000 | -0.0181 |
| Title | Cluster Plot | Dendrogram | e-value | e-value | e-value | Condition | Condition FDR | Condition Difference |
|---|---|---|---|---|---|---|---|---|
| Thaps_hclust_0397 |
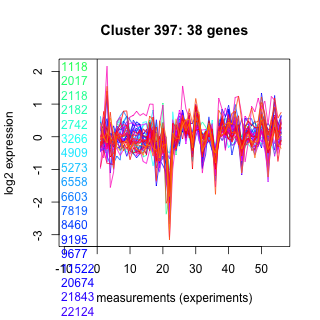 |
 |
0.00003 |
0.00016 |
0.0062 |
lowN_TMEVA | 0.880000 | 0.0494 |
| Thaps_hclust_0397 |
|
|
0.00003 |
0.00016 |
0.0062 |
exponential_vs_stationary_24light | 0.874000 | -0.0537 |
| Title | Cluster Plot | Dendrogram | e-value | e-value | e-value | Condition | Condition FDR | Condition Difference |
|---|---|---|---|---|---|---|---|---|
| Thaps_hclust_0474 |
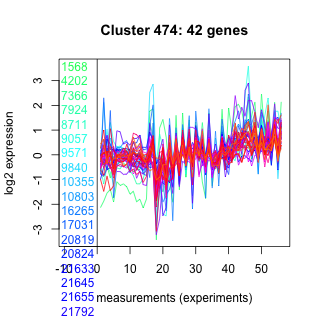 |
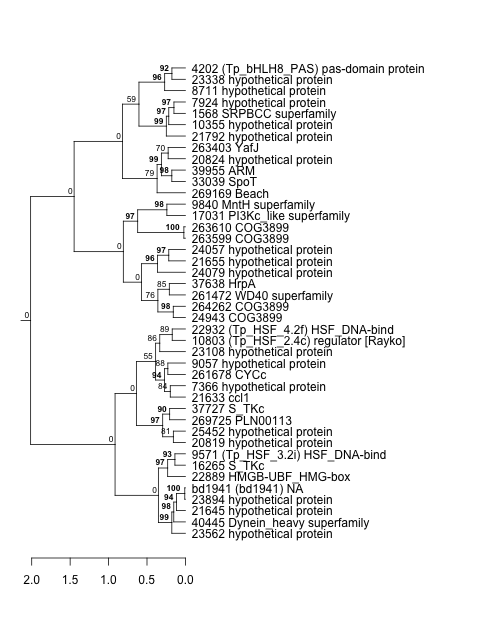 |
0.0078 |
0.000018 |
0.003 |
lowFe_TMEVA | 0.877000 | -0.0596 |
| Title | Cluster Plot | Dendrogram | e-value | e-value | e-value | Condition | Condition FDR | Condition Difference |
|---|---|---|---|---|---|---|---|---|
| Thaps_hclust_0242 |
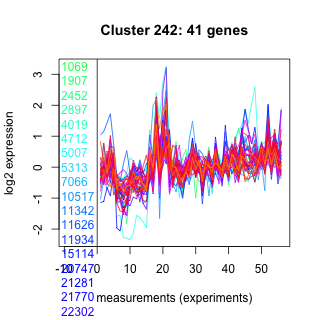 |
 |
3e-20 |
0.0000000000034 |
0.0085 |
lowFe_KTKB_Day5 | 0.876000 | -0.0262 |
| Title | Cluster Plot | Dendrogram | e-value | e-value | e-value | Condition | Condition FDR | Condition Difference |
|---|---|---|---|---|---|---|---|---|
| Thaps_hclust_0304 |
 |
 |
0.16 |
1.3 |
16 |
diel_exponential_vs_stationary | 0.876000 | 0.0296 |
| Title | Cluster Plot | Dendrogram | e-value | e-value | e-value | Condition | Condition FDR | Condition Difference |
|---|---|---|---|---|---|---|---|---|
| Thaps_hclust_0385 |
 |
 |
0.000029 |
2.1 |
2.2 |
co2_elevated_expo_arrays | 0.876000 | 0.0617 |
| Title | Cluster Plot | Dendrogram | e-value | e-value | e-value | Condition | Condition FDR | Condition Difference |
|---|---|---|---|---|---|---|---|---|
| Thaps_hclust_0349 |
 |
 |
360 |
5.4 |
67 |
co2_elevated_expo_arrays | 0.876000 | 0.0624 |
| Title | Cluster Plot | Dendrogram | e-value | e-value | e-value | Condition | Condition FDR | Condition Difference |
|---|---|---|---|---|---|---|---|---|
| Thaps_hclust_0377 |
 |
 |
0.00016 |
0.034 |
0.95 |
co2_elevated_stat_arrays | 0.876000 | -0.0448 |
| Title | Cluster Plot | Dendrogram | e-value | e-value | e-value | Condition | Condition FDR | Condition Difference |
|---|---|---|---|---|---|---|---|---|
| Thaps_hclust_0196 |
 |
 |
0.0000000000000088 |
0.00000034 |
0.000017 |
lowFe_KTKB_Day5 | 0.876000 | 0.0224 |
| Title | Cluster Plot | Dendrogram | e-value | e-value | e-value | Condition | Condition FDR | Condition Difference |
|---|---|---|---|---|---|---|---|---|
| Thaps_hclust_0179 |
 |
 |
0.0000039 |
0.056 |
2.8 |
diel_light_vs_dark | 0.875000 | 0.0497 |
| Title | Cluster Plot | Dendrogram | e-value | e-value | e-value | Condition | Condition FDR | Condition Difference |
|---|---|---|---|---|---|---|---|---|
| Thaps_hclust_0021 |
 |
 |
0.00000000002 |
0.0000088 |
0.0012 |
highpH_TMEVA | 0.875000 | -0.0269 |
| Title | Cluster Plot | Dendrogram | e-value | e-value | e-value | Condition | Condition FDR | Condition Difference |
|---|---|---|---|---|---|---|---|---|
| Thaps_hclust_0337 |
 |
 |
3.5 |
3 |
280 |
diel_light_vs_dark | 0.875000 | -0.0678 |
| Title | Cluster Plot | Dendrogram | e-value | e-value | e-value | Condition | Condition FDR | Condition Difference |
|---|---|---|---|---|---|---|---|---|
| Thaps_hclust_0374 |
 |
 |
1.4 |
19 |
50 |
lowN_TMEVA | 0.874000 | 0.0548 |
| Title | Cluster Plot | Dendrogram | e-value | e-value | e-value | Condition | Condition FDR | Condition Difference |
|---|---|---|---|---|---|---|---|---|
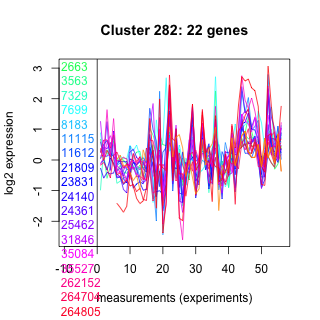
| Thaps_hclust_0282 |
 |
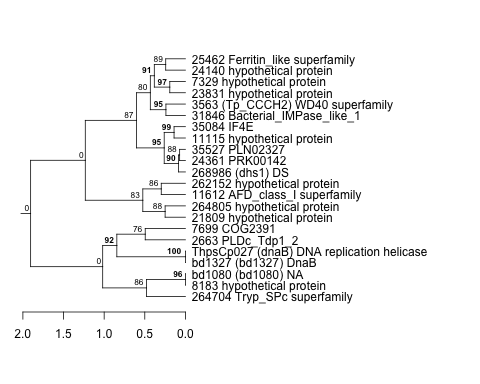 |
0.0005 |
0.0059 |
0.15 |
exponential_vs_stationary_24light | 0.874000 | -0.063 |
| Title | Cluster Plot | Dendrogram | e-value | e-value | e-value | Condition | Condition FDR | Condition Difference |
|---|---|---|---|---|---|---|---|---|
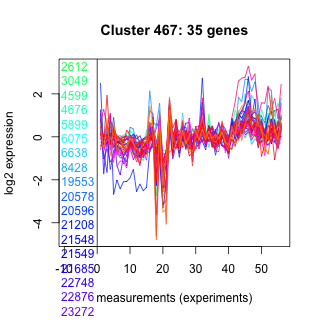
| Thaps_hclust_0467 |
 |
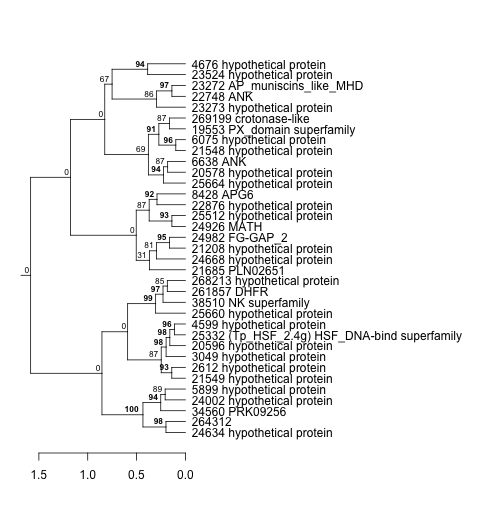 |
0.000000000002 |
0.0000014 |
0.035 |
lowN_TMEVA | 0.874000 | 0.0513 |
| Title | Cluster Plot | Dendrogram | e-value | e-value | e-value | Condition | Condition FDR | Condition Difference |
|---|---|---|---|---|---|---|---|---|
| Thaps_hclust_0270 |
 |
 |
0.0000000000069 |
0.000026 |
0.0036 |
exponential_vs_stationary_24light | 0.874000 | 0.0571 |
| Title | Cluster Plot | Dendrogram | e-value | e-value | e-value | Condition | Condition FDR | Condition Difference |
|---|---|---|---|---|---|---|---|---|
| Thaps_hclust_0407 |
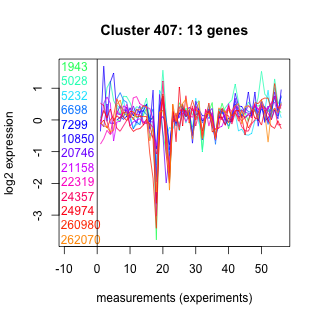 |
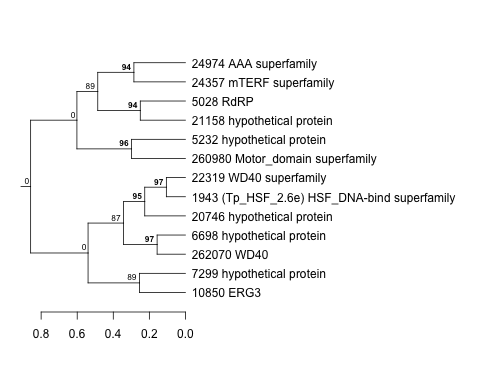 |
25 |
77 |
290 |
co2_elevated_expo_arrays | 0.873000 | 0.0689 |
| Title | Cluster Plot | Dendrogram | e-value | e-value | e-value | Condition | Condition FDR | Condition Difference |
|---|---|---|---|---|---|---|---|---|
| Thaps_hclust_0249 |
 |
 |
14 |
39 |
180 |
co2_elevated_expo_arrays | 0.873000 | -0.0718 |
| Title | Cluster Plot | Dendrogram | e-value | e-value | e-value | Condition | Condition FDR | Condition Difference |
|---|---|---|---|---|---|---|---|---|
| Thaps_hclust_0266 |
 |
 |
0.44 |
17 |
30 |
co2_elevated_expo_arrays | 0.873000 | 0.0807 |
| Title | Cluster Plot | Dendrogram | e-value | e-value | e-value | Condition | Condition FDR | Condition Difference |
|---|---|---|---|---|---|---|---|---|
| Thaps_hclust_0405 |
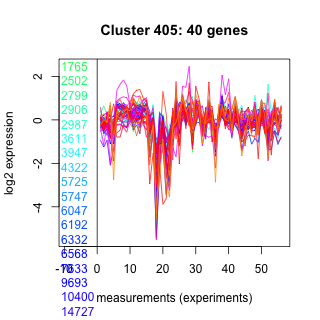 |
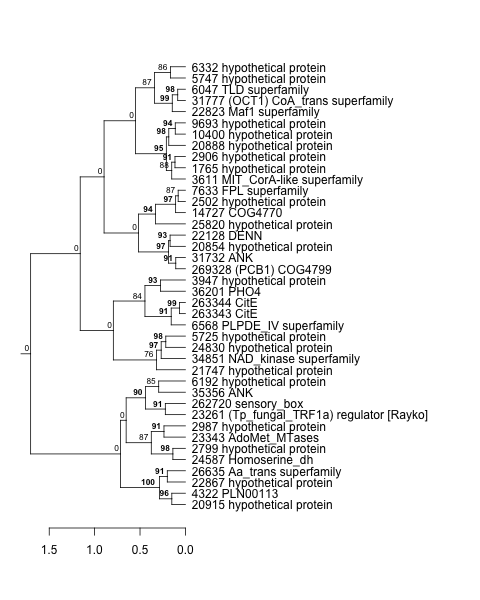 |
0.00000000036 |
0.0000000063 |
0.005 |
co2_elevated_expo_arrays | 0.873000 | 0.0584 |
| Title | Cluster Plot | Dendrogram | e-value | e-value | e-value | Condition | Condition FDR | Condition Difference |
|---|---|---|---|---|---|---|---|---|
| Thaps_hclust_0457 |
 |
 |
0.0000081 |
0.1 |
0.53 |
co2_elevated_expo_arrays | 0.873000 | 0.0687 |
| Title | Cluster Plot | Dendrogram | e-value | e-value | e-value | Condition | Condition FDR | Condition Difference |
|---|---|---|---|---|---|---|---|---|
| Thaps_hclust_0083 |
 |
 |
0.0039 |
6.3 |
14 |
lowtemp_TMEVA | 0.873000 | -0.05 |
| Title | Cluster Plot | Dendrogram | e-value | e-value | e-value | Condition | Condition FDR | Condition Difference |
|---|---|---|---|---|---|---|---|---|
| Thaps_hclust_0473 |
 |
 |
0.00036 |
0.0036 |
0.68 |
co2_elevated_expo_arrays | 0.873000 | -0.0596 |
| Title | Cluster Plot | Dendrogram | e-value | e-value | e-value | Condition | Condition FDR | Condition Difference |
|---|---|---|---|---|---|---|---|---|
| Thaps_hclust_0418 |
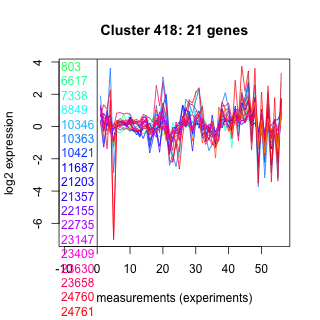 |
 |
0.00074 |
0.0098 |
0.29 |
co2_elevated_expo_arrays | 0.873000 | -0.0633 |
| Title | Cluster Plot | Dendrogram | e-value | e-value | e-value | Condition | Condition FDR | Condition Difference |
|---|---|---|---|---|---|---|---|---|
| Thaps_hclust_0159 |
 |
 |
0.087 |
1.3 |
3 |
lowSi_TMEVA | 0.873000 | -0.194 |
| Title | Cluster Plot | Dendrogram | e-value | e-value | e-value | Condition | Condition FDR | Condition Difference |
|---|---|---|---|---|---|---|---|---|
| Thaps_hclust_0150 |
 |
 |
0.16 |
0.73 |
6.8 |
co2_elevated_expo_arrays | 0.873000 | -0.0687 |
| Title | Cluster Plot | Dendrogram | e-value | e-value | e-value | Condition | Condition FDR | Condition Difference |
|---|---|---|---|---|---|---|---|---|
| Thaps_hclust_0061 |
 |
 |
0.000000062 |
0.00063 |
0.032 |
co2_elevated_expo_arrays | 0.873000 | 0.0678 |