Hierarchical Clusters
Displaying 201 - 300 of 7500
| Title | Cluster Plot | Dendrogram | e-value | e-value | e-value | Condition | Condition FDR | Condition Difference |
|---|---|---|---|---|---|---|---|---|
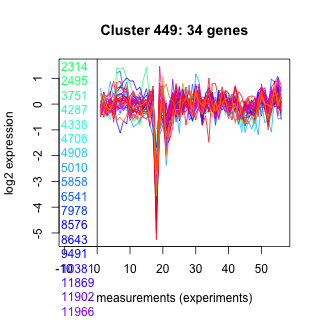
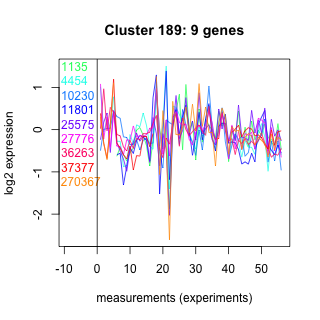
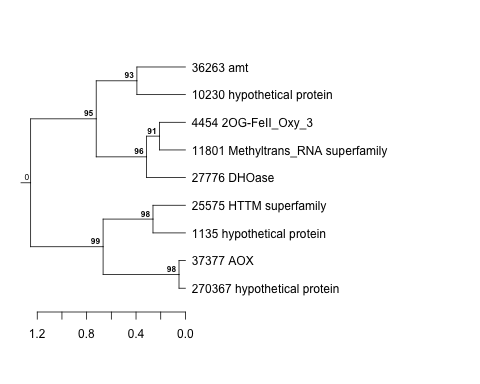
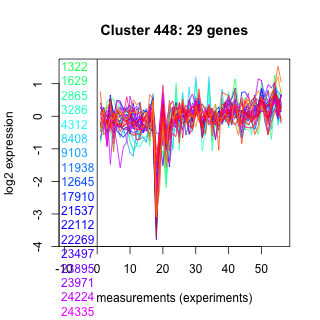
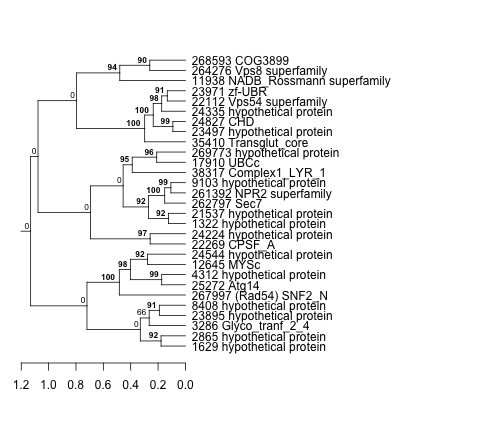
| Thaps_hclust_0449 |
 |
 |
0.0000000011 |
0.012 |
3.5 |
lowFe_TMEVA | 0.996000 | -0.00728 |
| Title | Cluster Plot | Dendrogram | e-value | e-value | e-value | Condition | Condition FDR | Condition Difference |
|---|---|---|---|---|---|---|---|---|
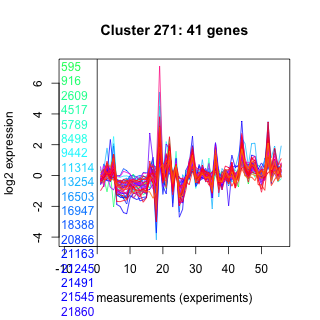
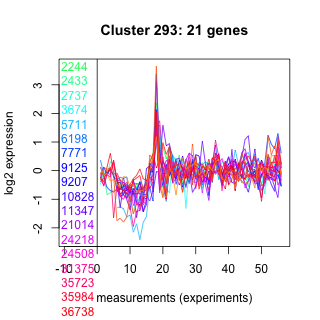
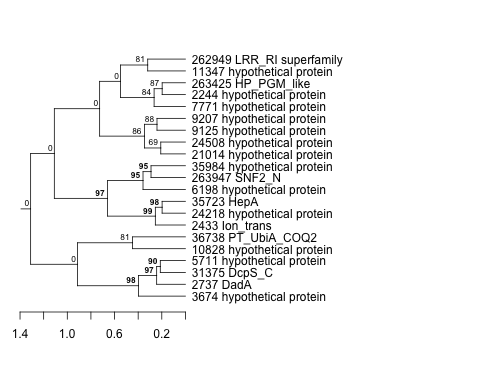
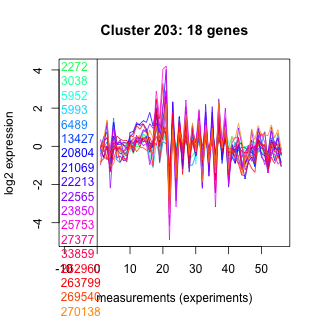
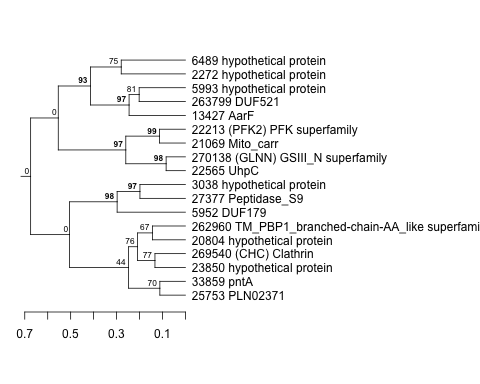
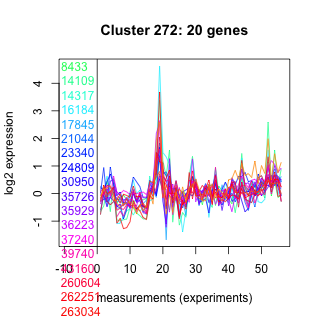
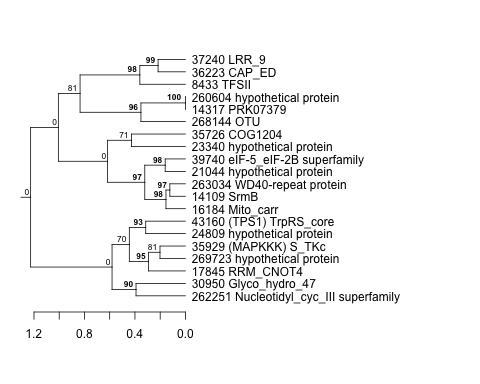
| Thaps_hclust_0271 |
 |
 |
Not available | Not available | Not available | lowFe_TMEVA | 0.996000 | -0.00446 |
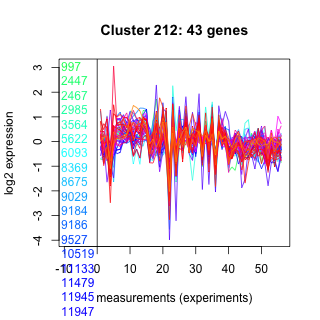
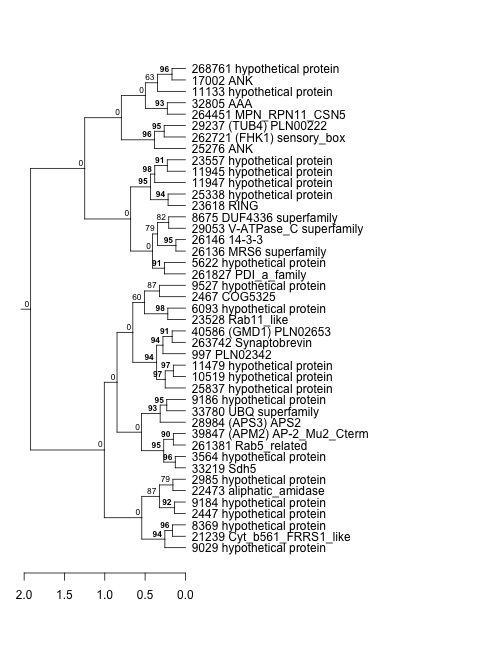
| Thaps_hclust_0271 |
|
|
Not available | Not available | Not available | co2_elevated_expo_arrays | 0.985000 | -0.00829 |
| Title | Cluster Plot | Dendrogram | e-value | e-value | e-value | Condition | Condition FDR | Condition Difference |
|---|---|---|---|---|---|---|---|---|
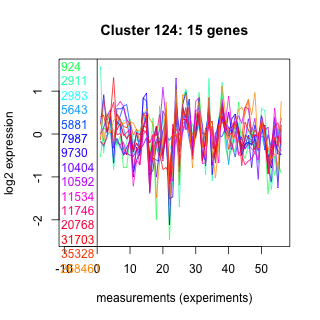
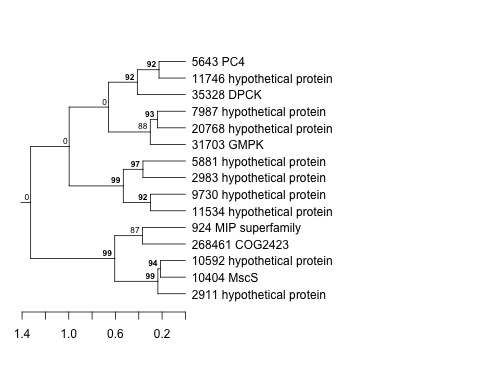
| Thaps_hclust_0096 |
 |
 |
0.0000028 |
0.9 |
0.38 |
lowN_TMEVA | 0.996000 | -0.00685 |
| Title | Cluster Plot | Dendrogram | e-value | e-value | e-value | Condition | Condition FDR | Condition Difference |
|---|---|---|---|---|---|---|---|---|
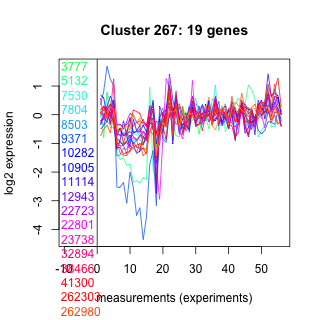
| Thaps_hclust_0267 |
 |
 |
0.00000003 |
0.39 |
0.58 |
lowFe_TMEVA | 0.996000 | 0.00375 |
| Thaps_hclust_0267 |
|
|
0.00000003 |
0.39 |
0.58 |
lowSi_TMEVA | 0.989000 | 0.1 |
| Thaps_hclust_0267 |
|
|
0.00000003 |
0.39 |
0.58 |
co2_elevated_expo_arrays | 0.985000 | 0.0131 |
| Title | Cluster Plot | Dendrogram | e-value | e-value | e-value | Condition | Condition FDR | Condition Difference |
|---|---|---|---|---|---|---|---|---|
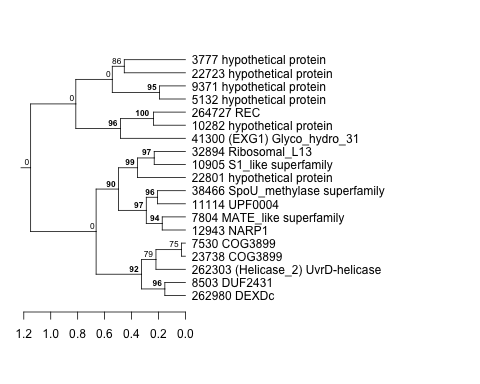
| Thaps_hclust_0123 |
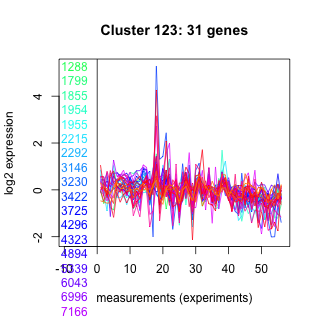 |
 |
0.000073 |
0.05 |
0.076 |
lowFe_TMEVA | 0.996000 | 0.00289 |
| Title | Cluster Plot | Dendrogram | e-value | e-value | e-value | Condition | Condition FDR | Condition Difference |
|---|---|---|---|---|---|---|---|---|
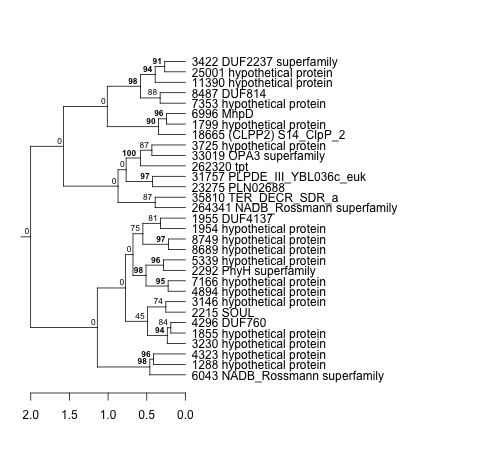
| Thaps_hclust_0430 |
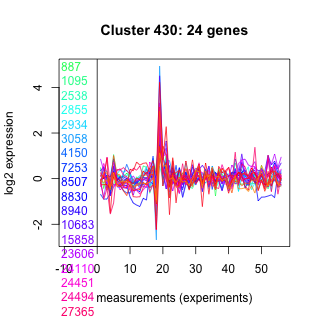 |
 |
0.0000088 |
0.0043 |
0.22 |
lowFe_KTKB_Day3 | 0.996000 | -0.00183 |
| Thaps_hclust_0430 |
|
|
0.0000088 |
0.0043 |
0.22 |
lowN_TMEVA | 0.995000 | -0.00696 |
| Title | Cluster Plot | Dendrogram | e-value | e-value | e-value | Condition | Condition FDR | Condition Difference |
|---|---|---|---|---|---|---|---|---|
| Thaps_hclust_0208 |
 |
|
1.2e-20 |
0.0000000000000057 |
0.0000000099 |
lowFe_TMEVA | 0.996000 | -0.00415 |
| Title | Cluster Plot | Dendrogram | e-value | e-value | e-value | Condition | Condition FDR | Condition Difference |
|---|---|---|---|---|---|---|---|---|
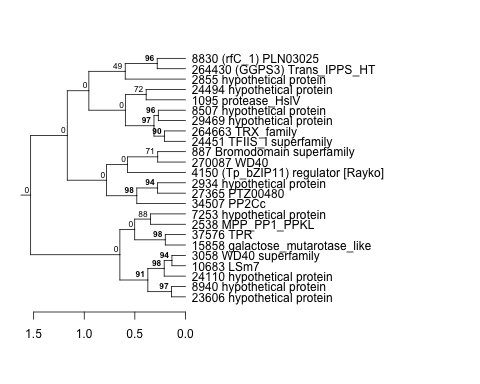
| Thaps_hclust_0119 |
 |
 |
0.000017 |
0.0015 |
0.0058 |
lowFe_TMEVA | 0.996000 | 0.00697 |
| Title | Cluster Plot | Dendrogram | e-value | e-value | e-value | Condition | Condition FDR | Condition Difference |
|---|---|---|---|---|---|---|---|---|
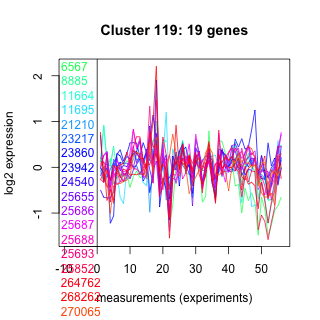
| Thaps_hclust_0243 |
 |
 |
0.00018 |
0.14 |
0.0019 |
lowN_TMEVA | 0.995000 | 0.00676 |
| Title | Cluster Plot | Dendrogram | e-value | e-value | e-value | Condition | Condition FDR | Condition Difference |
|---|---|---|---|---|---|---|---|---|
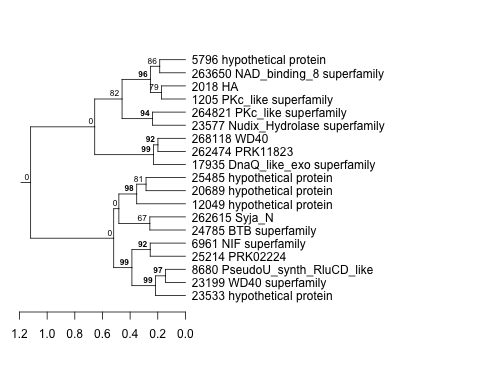
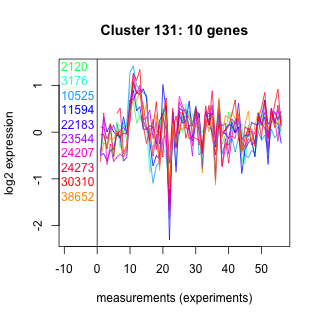
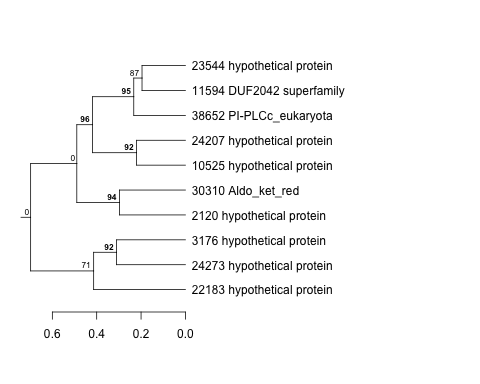
| Thaps_hclust_0131 |
 |
 |
260 |
48 |
370 |
lowFe_TMEVA | 0.995000 | 0.0095 |
| Thaps_hclust_0131 |
|
|
260 |
48 |
370 |
BaP | 0.991000 | 0.00824 |
| Title | Cluster Plot | Dendrogram | e-value | e-value | e-value | Condition | Condition FDR | Condition Difference |
|---|---|---|---|---|---|---|---|---|
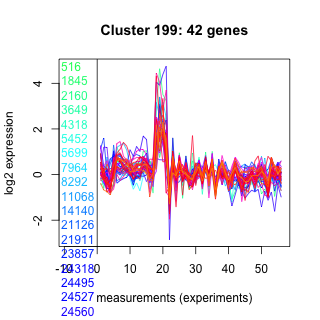
| Thaps_hclust_0199 |
 |
 |
2.7e-19 |
0.000000062 |
0.00000065 |
lowFe_TMEVA | 0.995000 | 0.00909 |
| Title | Cluster Plot | Dendrogram | e-value | e-value | e-value | Condition | Condition FDR | Condition Difference |
|---|---|---|---|---|---|---|---|---|
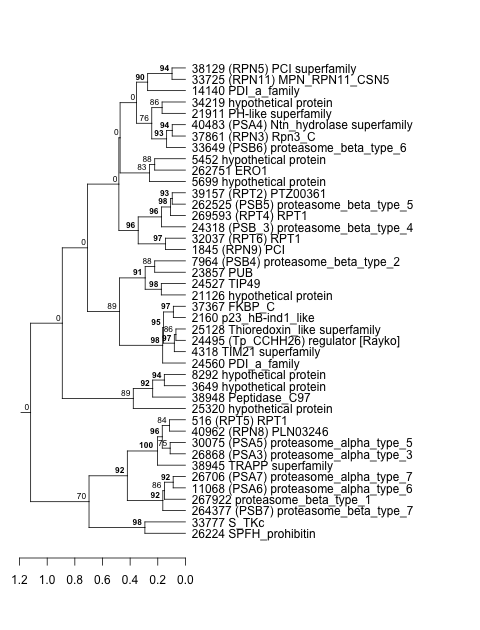
| Thaps_hclust_0250 |
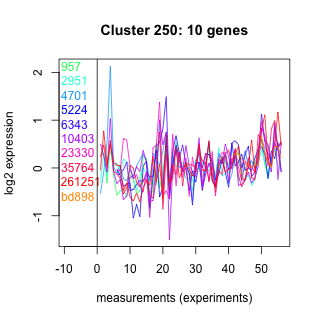 |
 |
0.38 |
88 |
290 |
lowN_TMEVA | 0.995000 | 0.00822 |
| Title | Cluster Plot | Dendrogram | e-value | e-value | e-value | Condition | Condition FDR | Condition Difference |
|---|---|---|---|---|---|---|---|---|
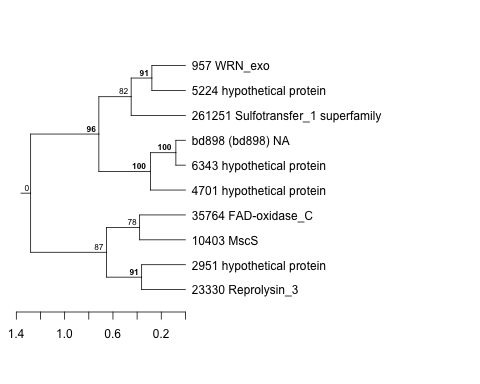
| Thaps_hclust_0159 |
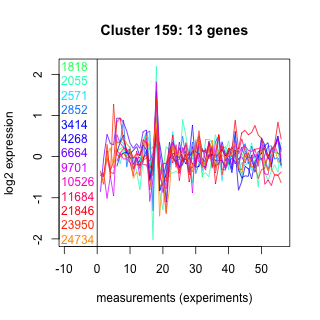 |
 |
0.087 |
1.3 |
3 |
lowN_TMEVA | 0.995000 | -0.00815 |
| Title | Cluster Plot | Dendrogram | e-value | e-value | e-value | Condition | Condition FDR | Condition Difference |
|---|---|---|---|---|---|---|---|---|
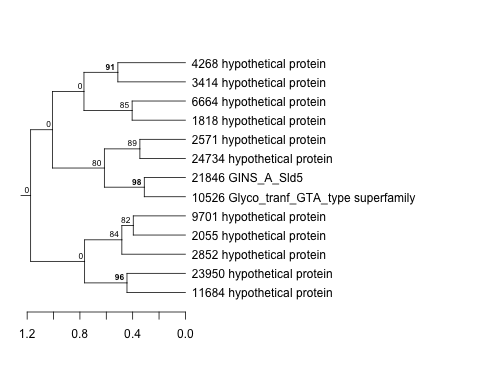
| Thaps_hclust_0463 |
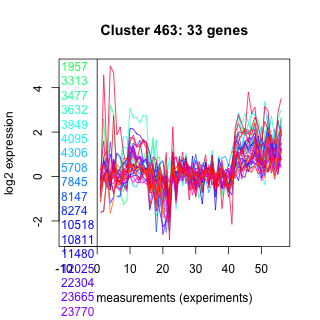 |
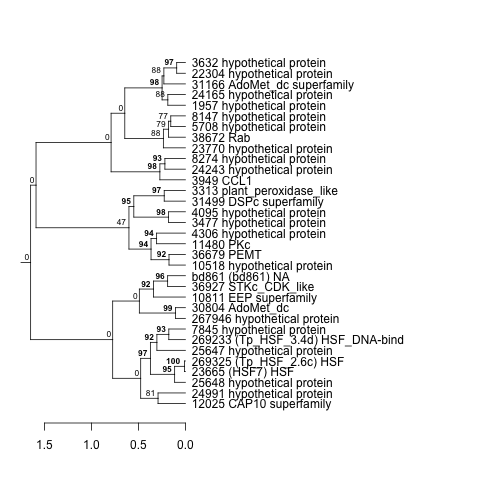 |
0.0000000063 |
0.000000075 |
0.78 |
lowFe_KTKB_Day5 | 0.994000 | 0.00255 |
| Title | Cluster Plot | Dendrogram | e-value | e-value | e-value | Condition | Condition FDR | Condition Difference |
|---|---|---|---|---|---|---|---|---|
| Thaps_hclust_0372 |
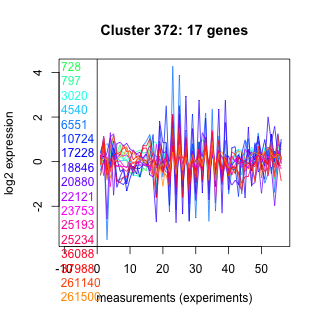 |
 |
0.0016 |
0.064 |
18 |
BaP | 0.994000 | -0.00461 |
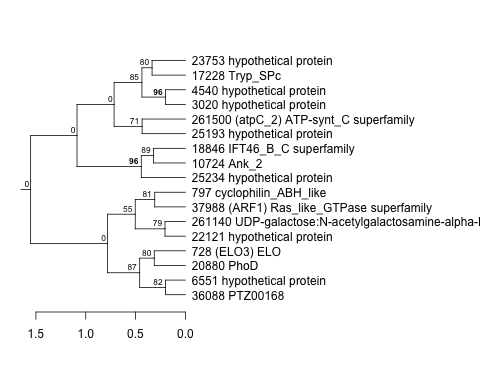
| Title | Cluster Plot | Dendrogram | e-value | e-value | e-value | Condition | Condition FDR | Condition Difference |
|---|---|---|---|---|---|---|---|---|
| Thaps_hclust_0281 |
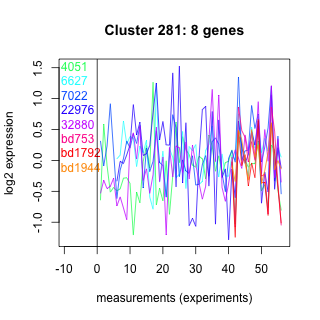 |
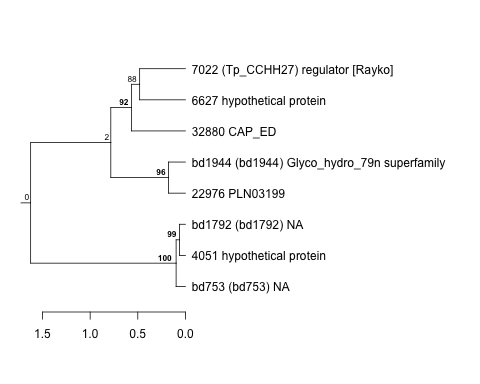 |
0.0000064 |
0.00064 |
0.03 |
BaP | 0.994000 | -0.00516 |
| Title | Cluster Plot | Dendrogram | e-value | e-value | e-value | Condition | Condition FDR | Condition Difference |
|---|---|---|---|---|---|---|---|---|
| Thaps_hclust_0170 |
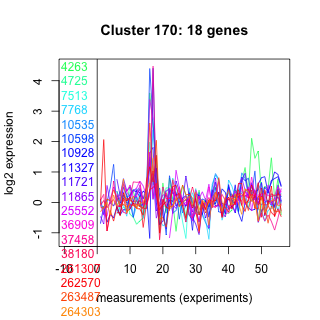 |
 |
0.028 |
1.8 |
150 |
BaP | 0.994000 | -0.00315 |
| Thaps_hclust_0170 |
|
|
0.028 |
1.8 |
150 |
exponential_vs_stationary_24highlight | 0.986000 | 0.00357 |
| Title | Cluster Plot | Dendrogram | e-value | e-value | e-value | Condition | Condition FDR | Condition Difference |
|---|---|---|---|---|---|---|---|---|
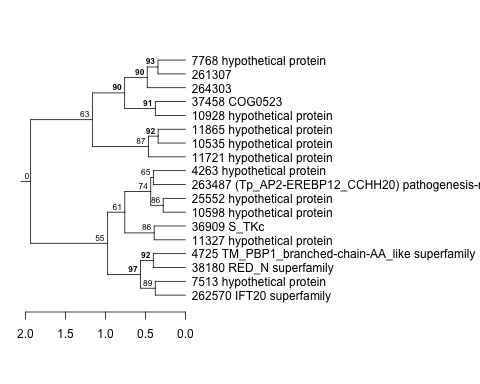
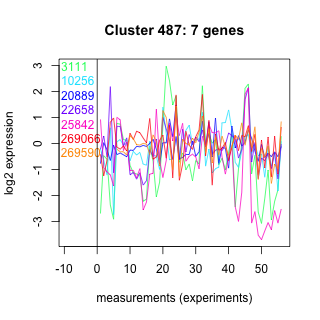
| Thaps_hclust_0487 |
 |
 |
2.2 |
14 |
320 |
BaP | 0.994000 | 0.0056 |
| Title | Cluster Plot | Dendrogram | e-value | e-value | e-value | Condition | Condition FDR | Condition Difference |
|---|---|---|---|---|---|---|---|---|
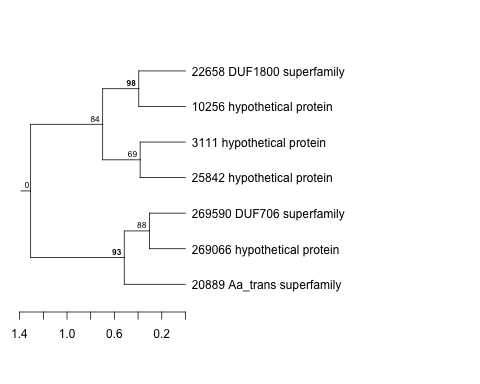
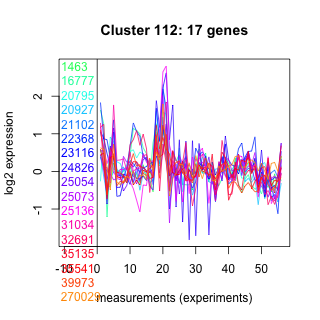
| Thaps_hclust_0112 |
 |
 |
0.00000035 |
0.017 |
0.34 |
lowFe_KTKB_Day3 | 0.994000 | 0.00293 |
| Title | Cluster Plot | Dendrogram | e-value | e-value | e-value | Condition | Condition FDR | Condition Difference |
|---|---|---|---|---|---|---|---|---|
| Thaps_hclust_0025 |
 |
 |
0.14 |
0.45 |
4.6 |
co2_elevated_stat_arrays | 0.993000 | -0.00271 |
| Title | Cluster Plot | Dendrogram | e-value | e-value | e-value | Condition | Condition FDR | Condition Difference |
|---|---|---|---|---|---|---|---|---|
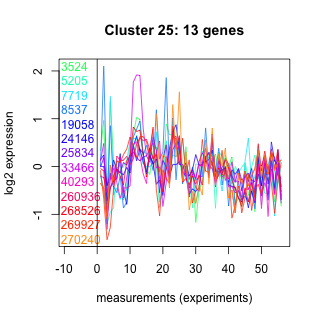
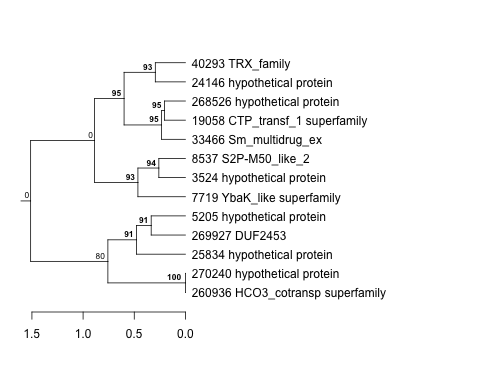
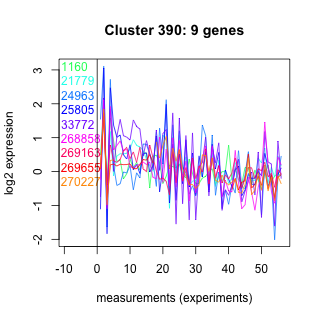
| Thaps_hclust_0390 |
 |
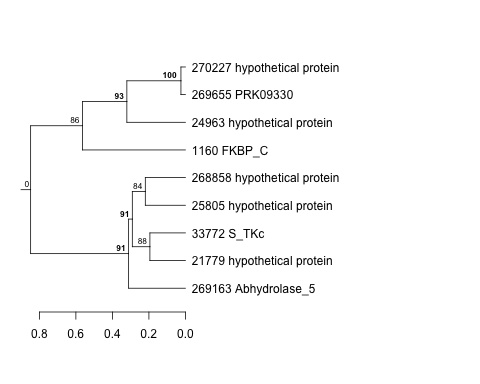 |
0.013 |
0.066 |
0.15 |
co2_elevated_stat_arrays | 0.993000 | -0.00341 |
| Thaps_hclust_0390 |
|
|
0.013 |
0.066 |
0.15 |
highpH_TMEVA | 0.993000 | -0.00576 |
| Title | Cluster Plot | Dendrogram | e-value | e-value | e-value | Condition | Condition FDR | Condition Difference |
|---|---|---|---|---|---|---|---|---|
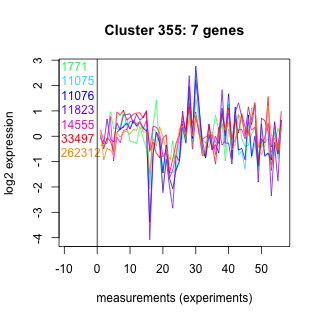
| Thaps_hclust_0355 |
 |
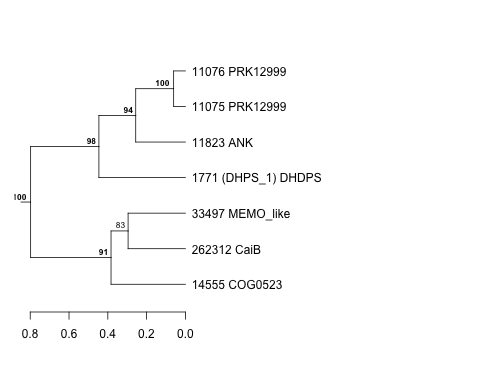 |
0.49 |
16 |
310 |
highpH_TMEVA | 0.993000 | 0.00671 |
| Title | Cluster Plot | Dendrogram | e-value | e-value | e-value | Condition | Condition FDR | Condition Difference |
|---|---|---|---|---|---|---|---|---|
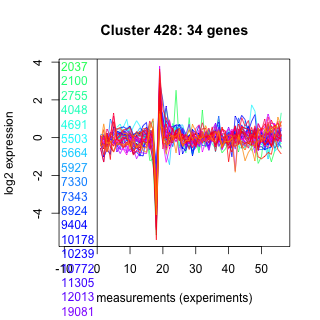
| Thaps_hclust_0428 |
 |
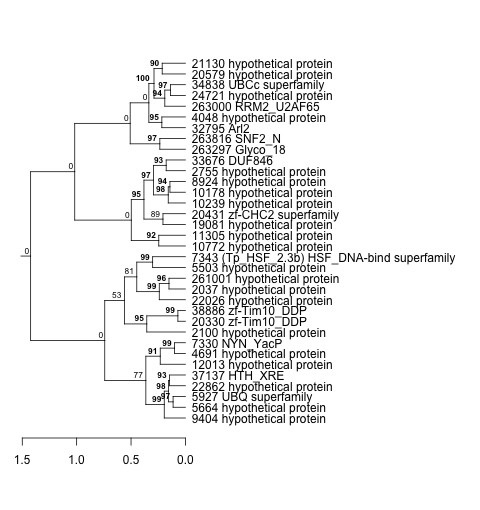 |
0.000000076 |
0.015 |
1.9 |
diel_light_vs_dark | 0.993000 | -0.00165 |
| Title | Cluster Plot | Dendrogram | e-value | e-value | e-value | Condition | Condition FDR | Condition Difference |
|---|---|---|---|---|---|---|---|---|
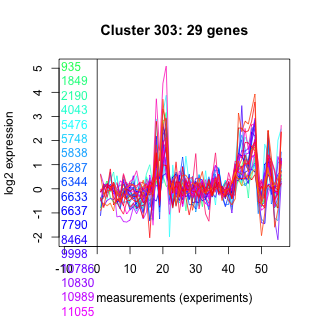
| Thaps_hclust_0303 |
 |
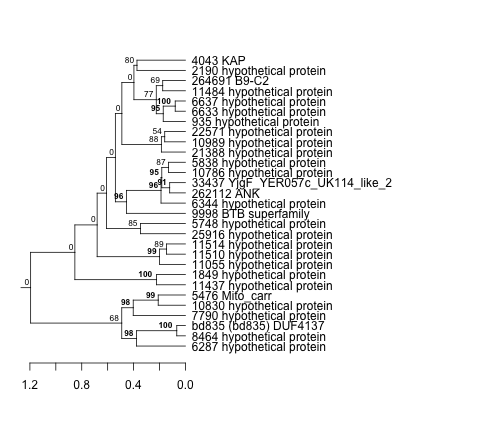 |
0.00096 |
0.0021 |
0.0014 |
diel_light_vs_dark | 0.993000 | 0.00145 |
| Title | Cluster Plot | Dendrogram | e-value | e-value | e-value | Condition | Condition FDR | Condition Difference |
|---|---|---|---|---|---|---|---|---|
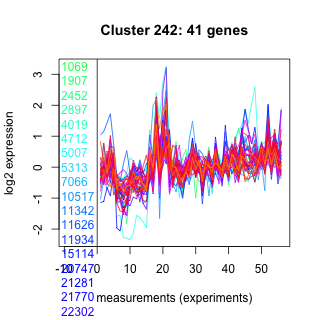
| Thaps_hclust_0242 |
 |
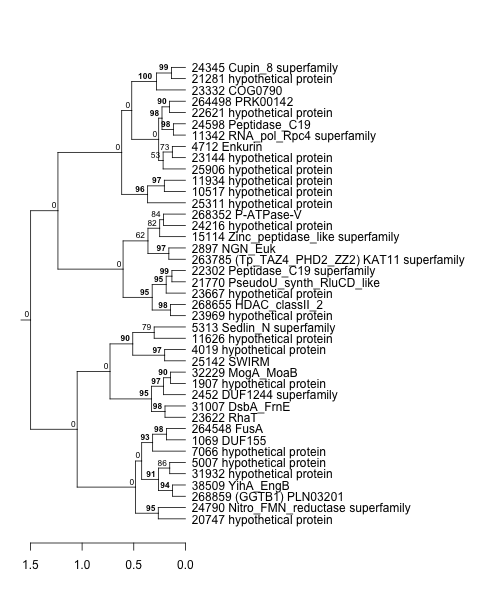 |
3e-20 |
0.0000000000034 |
0.0085 |
lowSi_TMEVA | 0.992000 | 0.119 |
| Title | Cluster Plot | Dendrogram | e-value | e-value | e-value | Condition | Condition FDR | Condition Difference |
|---|---|---|---|---|---|---|---|---|
| Thaps_hclust_0129 |
 |
 |
0.015 |
0.29 |
1 |
highpH_TMEVA | 0.992000 | 0.00467 |
| Thaps_hclust_0129 |
|
|
0.015 |
0.29 |
1 |
highlight_arrays | 0.988000 | 0.00148 |
| Title | Cluster Plot | Dendrogram | e-value | e-value | e-value | Condition | Condition FDR | Condition Difference |
|---|---|---|---|---|---|---|---|---|
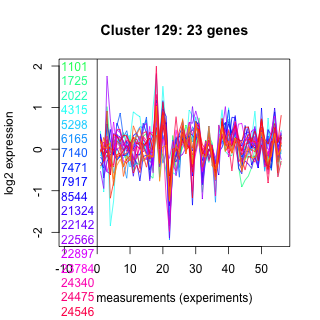
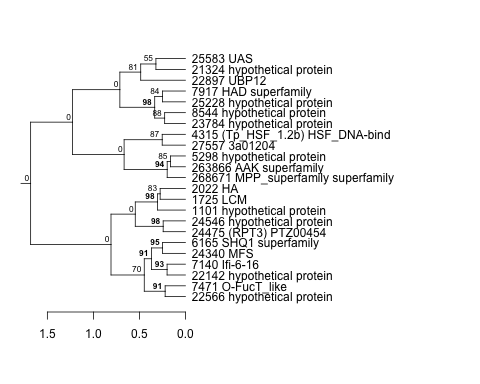
| Thaps_hclust_0217 |
 |
 |
0.00000028 |
0.95 |
9.7 |
lowFe_TMEVA | 0.992000 | 0.0106 |
| Title | Cluster Plot | Dendrogram | e-value | e-value | e-value | Condition | Condition FDR | Condition Difference |
|---|---|---|---|---|---|---|---|---|
| Thaps_hclust_0187 |
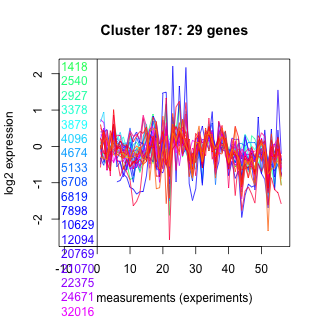 |
 |
0.000000024 |
0.034 |
0.66 |
lowFe_KTKB_Day3 | 0.992000 | -0.00322 |
| Title | Cluster Plot | Dendrogram | e-value | e-value | e-value | Condition | Condition FDR | Condition Difference |
|---|---|---|---|---|---|---|---|---|
| Thaps_hclust_0305 |
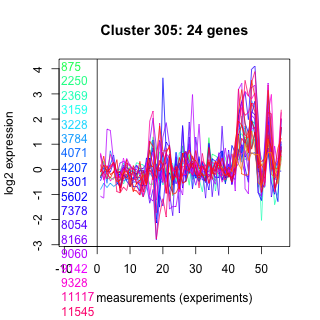 |
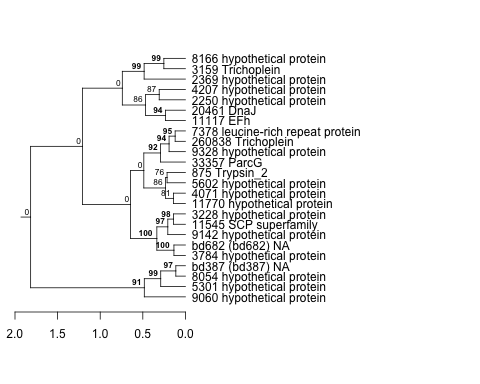 |
0.66 |
3.2 |
6.5 |
lowSi_TMEVA | 0.992000 | 0.103 |
| Title | Cluster Plot | Dendrogram | e-value | e-value | e-value | Condition | Condition FDR | Condition Difference |
|---|---|---|---|---|---|---|---|---|
| Thaps_hclust_0155 |
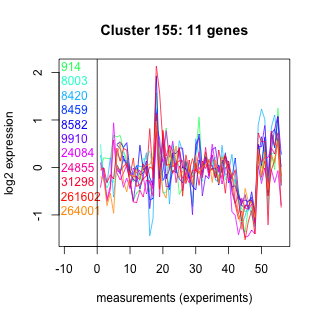 |
 |
0.32 |
5.4 |
2 |
lowtemp_TMEVA | 0.992000 | 0.00776 |
| Title | Cluster Plot | Dendrogram | e-value | e-value | e-value | Condition | Condition FDR | Condition Difference |
|---|---|---|---|---|---|---|---|---|
| Thaps_hclust_0253 |
 |
 |
1.5 |
61 |
370 |
lowFe_KTKB_Day3 | 0.992000 | -0.00493 |
| Title | Cluster Plot | Dendrogram | e-value | e-value | e-value | Condition | Condition FDR | Condition Difference |
|---|---|---|---|---|---|---|---|---|
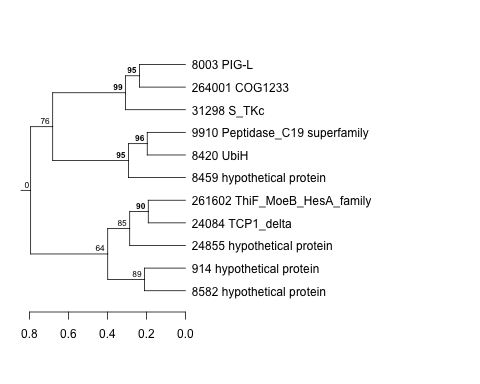
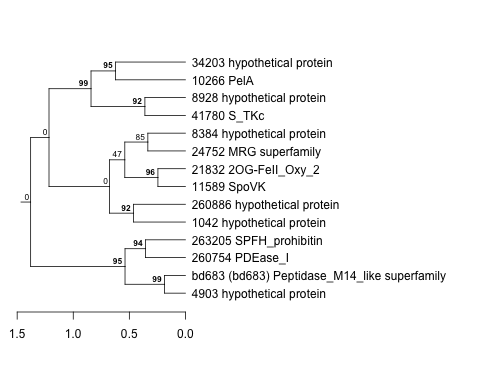
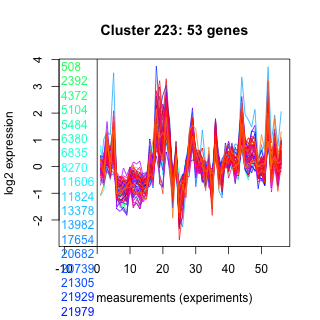
| Thaps_hclust_0223 |
 |
 |
1.70006e-41 |
0.000000000000099 |
0.0011 |
co2_elevated_expo_arrays | 0.991000 | -0.00671 |
| Title | Cluster Plot | Dendrogram | e-value | e-value | e-value | Condition | Condition FDR | Condition Difference |
|---|---|---|---|---|---|---|---|---|
| Thaps_hclust_0266 |
 |
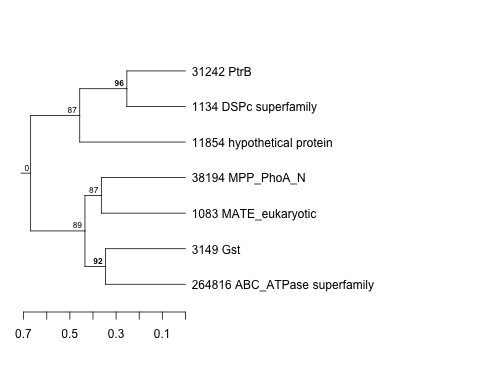 |
0.44 |
17 |
30 |
diel_light_vs_dark | 0.991000 | 0.00476 |
| Title | Cluster Plot | Dendrogram | e-value | e-value | e-value | Condition | Condition FDR | Condition Difference |
|---|---|---|---|---|---|---|---|---|
| Thaps_hclust_0154 |
 |
 |
0.00015 |
0.0049 |
0.29 |
diel_exponential_vs_stationary | 0.991000 | 0.00329 |
| Title | Cluster Plot | Dendrogram | e-value | e-value | e-value | Condition | Condition FDR | Condition Difference |
|---|---|---|---|---|---|---|---|---|
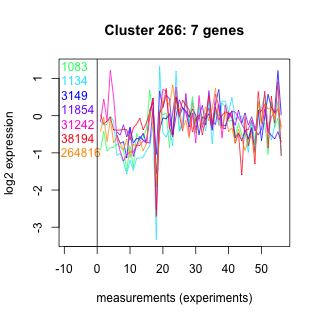
| Thaps_hclust_0104 |
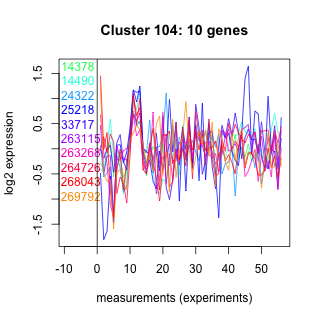 |
 |
23 |
24 |
220 |
lowFe_KTKB_Day3 | 0.991000 | 0.0064 |
| Title | Cluster Plot | Dendrogram | e-value | e-value | e-value | Condition | Condition FDR | Condition Difference |
|---|---|---|---|---|---|---|---|---|
| Thaps_hclust_0066 |
 |
 |
0.0000000000000019 |
0.00000025 |
0.00000047 |
diel_light_vs_dark | 0.991000 | -0.00253 |
| Title | Cluster Plot | Dendrogram | e-value | e-value | e-value | Condition | Condition FDR | Condition Difference |
|---|---|---|---|---|---|---|---|---|
| Thaps_hclust_0038 |
 |
 |
0.0016 |
0.024 |
17 |
diel_exponential_vs_stationary | 0.991000 | -0.0048 |
| Title | Cluster Plot | Dendrogram | e-value | e-value | e-value | Condition | Condition FDR | Condition Difference |
|---|---|---|---|---|---|---|---|---|
| Thaps_hclust_0193 |
 |
 |
0.00027 |
0.013 |
6.2 |
diel_exponential_vs_stationary | 0.991000 | -0.0036 |
| Title | Cluster Plot | Dendrogram | e-value | e-value | e-value | Condition | Condition FDR | Condition Difference |
|---|---|---|---|---|---|---|---|---|
| Thaps_hclust_0211 |
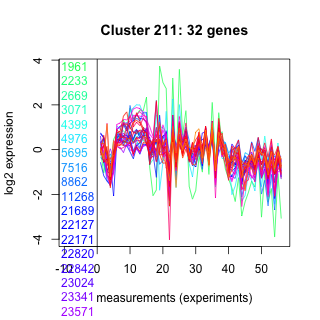 |
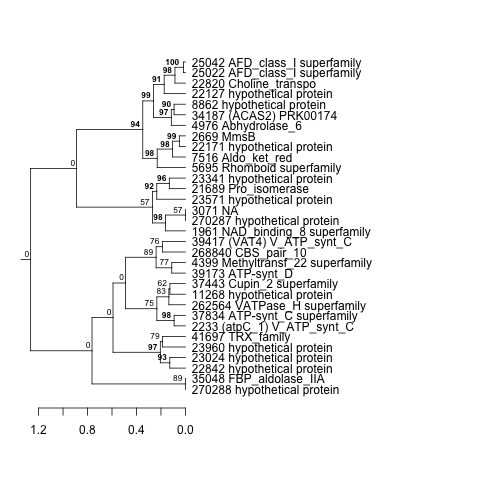 |
0.000000055 |
0.00014 |
0.026 |
diel_exponential_vs_stationary | 0.991000 | -0.00345 |
| Title | Cluster Plot | Dendrogram | e-value | e-value | e-value | Condition | Condition FDR | Condition Difference |
|---|---|---|---|---|---|---|---|---|
| Thaps_hclust_0317 |
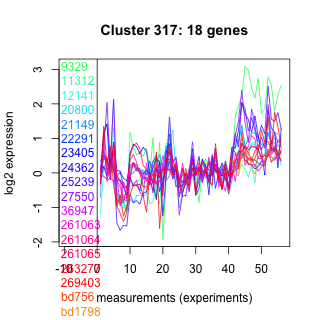 |
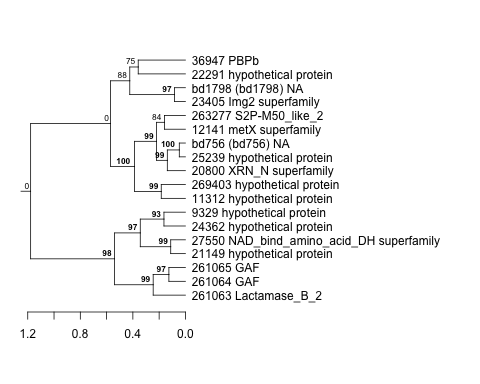 |
0.000000000082 |
0.00000001 |
0.00000042 |
diel_light_vs_dark | 0.990000 | 0.00462 |
| Title | Cluster Plot | Dendrogram | e-value | e-value | e-value | Condition | Condition FDR | Condition Difference |
|---|---|---|---|---|---|---|---|---|
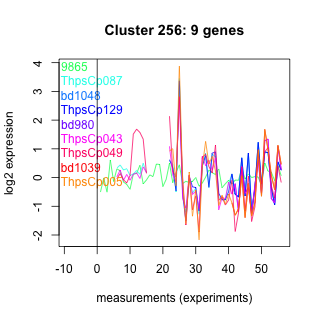
| Thaps_hclust_0256 |
 |
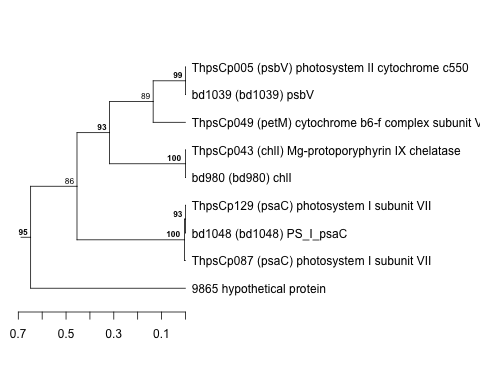 |
0.0000000000016 |
0.0000000000033 |
0.0000000000017 |
lowFe_TMEVA | 0.990000 | -0.0121 |
| Title | Cluster Plot | Dendrogram | e-value | e-value | e-value | Condition | Condition FDR | Condition Difference |
|---|---|---|---|---|---|---|---|---|
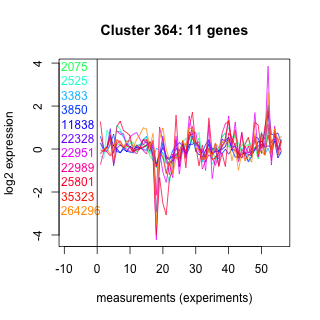
| Thaps_hclust_0364 |
 |
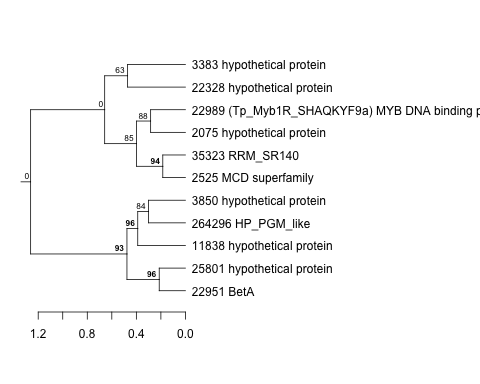 |
4.5 |
28 |
590 |
lowFe_KTKB_Day5 | 0.990000 | 0.00503 |
| Title | Cluster Plot | Dendrogram | e-value | e-value | e-value | Condition | Condition FDR | Condition Difference |
|---|---|---|---|---|---|---|---|---|
| Thaps_hclust_0371 |
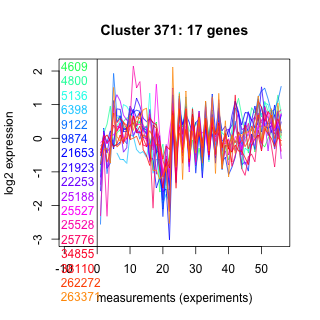 |
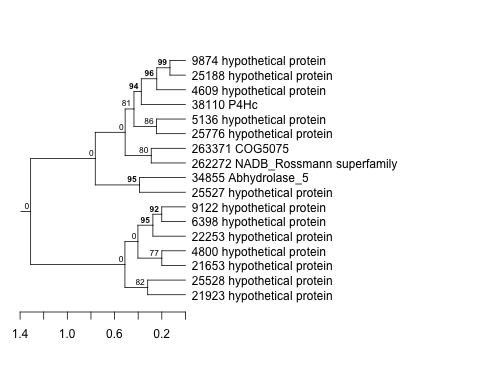 |
0.0051 |
0.11 |
1.1 |
lowFe_TMEVA | 0.990000 | 0.0104 |
| Title | Cluster Plot | Dendrogram | e-value | e-value | e-value | Condition | Condition FDR | Condition Difference |
|---|---|---|---|---|---|---|---|---|
| Thaps_hclust_0264 |
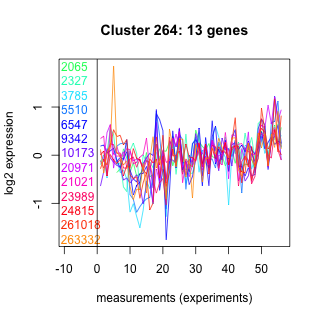 |
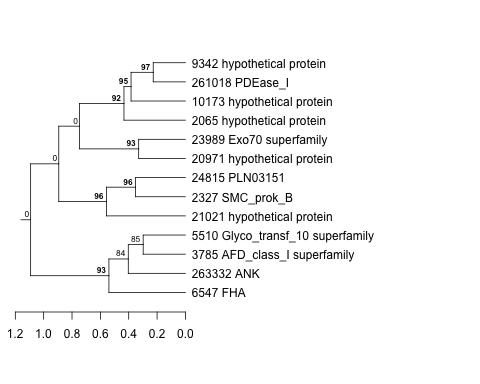 |
0.0079 |
0.24 |
5.8 |
exponential_vs_stationary_24light | 0.990000 | 0.00347 |
| Title | Cluster Plot | Dendrogram | e-value | e-value | e-value | Condition | Condition FDR | Condition Difference |
|---|---|---|---|---|---|---|---|---|
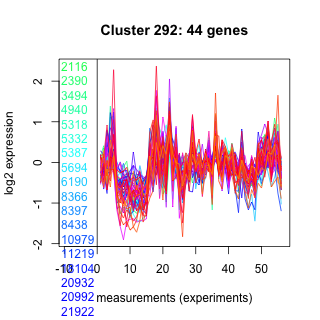
| Thaps_hclust_0292 |
 |
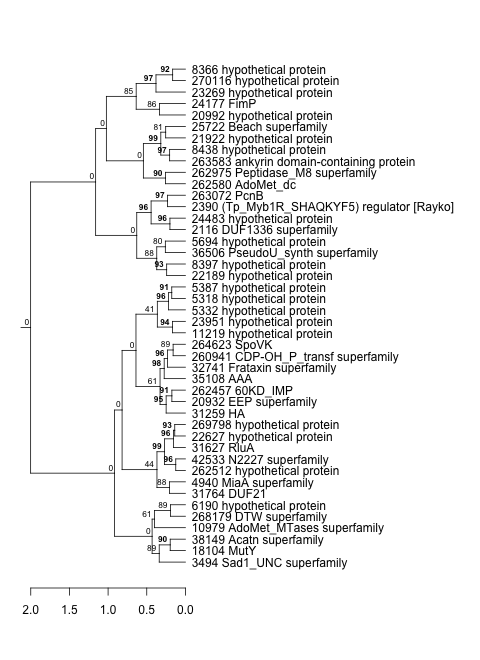 |
1.4e-30 |
0.00000000000037 |
0.0000067 |
exponential_vs_stationary_24light | 0.989000 | 0.00306 |
| Thaps_hclust_0292 |
|
|
1.4e-30 |
0.00000000000037 |
0.0000067 |
co2_elevated_expo_arrays | 0.985000 | 0.0103 |
| Title | Cluster Plot | Dendrogram | e-value | e-value | e-value | Condition | Condition FDR | Condition Difference |
|---|---|---|---|---|---|---|---|---|
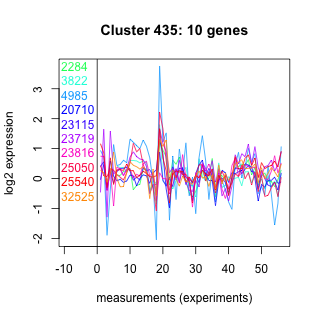
| Thaps_hclust_0435 |
 |
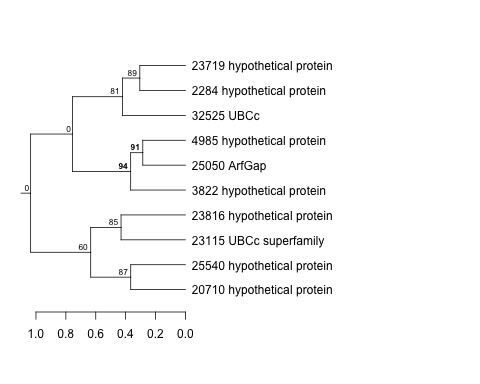 |
0.17 |
0.24 |
1.5 |
lowFe_KTKB_Day5 | 0.989000 | -0.0064 |
| Title | Cluster Plot | Dendrogram | e-value | e-value | e-value | Condition | Condition FDR | Condition Difference |
|---|---|---|---|---|---|---|---|---|
| Thaps_hclust_0496 |
 |
 |
0.00082 |
0.0031 |
0.43 |
exponential_vs_stationary_24light | 0.989000 | 0.00372 |
| Title | Cluster Plot | Dendrogram | e-value | e-value | e-value | Condition | Condition FDR | Condition Difference |
|---|---|---|---|---|---|---|---|---|
| Thaps_hclust_0252 |
 |
 |
0.000053 |
0.0057 |
2.1 |
lowSi_TMEVA | 0.989000 | -0.106 |
| Thaps_hclust_0252 |
|
|
0.000053 |
0.0057 |
2.1 |
co2_elevated_expo_arrays | 0.985000 | -0.0101 |
| Title | Cluster Plot | Dendrogram | e-value | e-value | e-value | Condition | Condition FDR | Condition Difference |
|---|---|---|---|---|---|---|---|---|
| Thaps_hclust_0491 |
 |
 |
0.35 |
17 |
52 |
exponential_vs_stationary_24light | 0.989000 | -0.0046 |
| Title | Cluster Plot | Dendrogram | e-value | e-value | e-value | Condition | Condition FDR | Condition Difference |
|---|---|---|---|---|---|---|---|---|
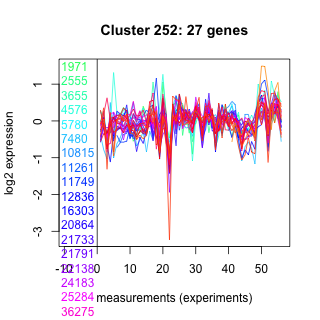
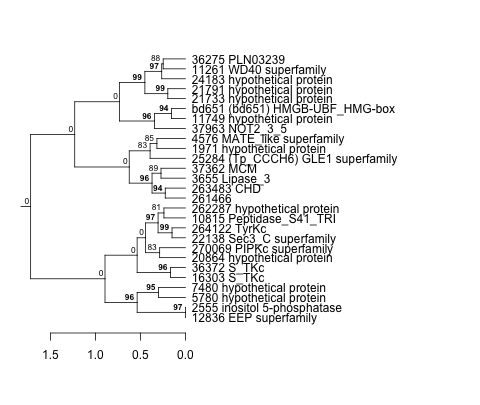
| Thaps_hclust_0409 |
 |
 |
0.0000000066 |
0.0028 |
0.21 |
diel_light_vs_dark | 0.989000 | 0.00402 |
| Thaps_hclust_0409 |
|
|
0.0000000066 |
0.0028 |
0.21 |
co2_elevated_expo_arrays | 0.985000 | -0.00796 |
| Title | Cluster Plot | Dendrogram | e-value | e-value | e-value | Condition | Condition FDR | Condition Difference |
|---|---|---|---|---|---|---|---|---|
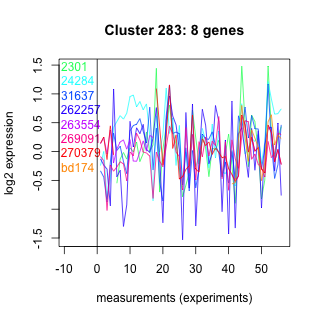
| Thaps_hclust_0283 |
 |
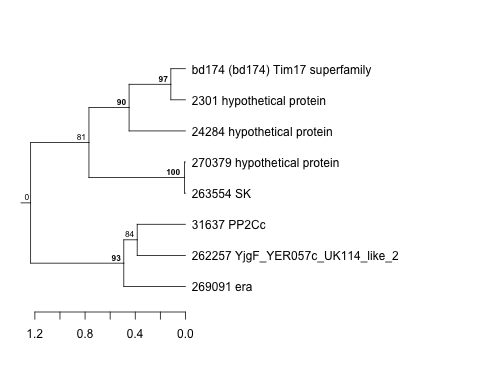 |
0.0022 |
0.0079 |
0.019 |
highlight_arrays | 0.988000 | -0.00321 |
| Title | Cluster Plot | Dendrogram | e-value | e-value | e-value | Condition | Condition FDR | Condition Difference |
|---|---|---|---|---|---|---|---|---|
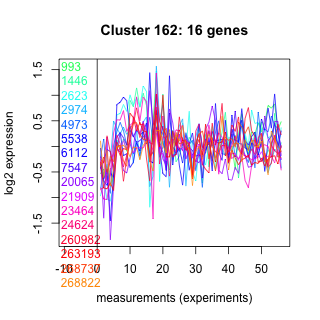
| Thaps_hclust_0162 |
 |
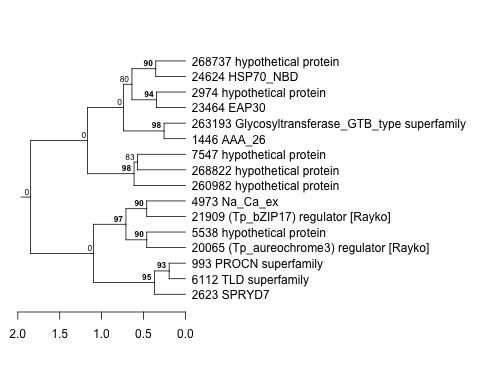 |
0.032 |
3.2 |
58 |
exponential_vs_stationary_24highlight | 0.988000 | 0.00181 |
| Title | Cluster Plot | Dendrogram | e-value | e-value | e-value | Condition | Condition FDR | Condition Difference |
|---|---|---|---|---|---|---|---|---|
| Thaps_hclust_0189 |
 |
 |
0.0012 |
0.00048 |
0.015 |
highlight_arrays | 0.988000 | 0.00285 |
| Title | Cluster Plot | Dendrogram | e-value | e-value | e-value | Condition | Condition FDR | Condition Difference |
|---|---|---|---|---|---|---|---|---|
| Thaps_hclust_0212 |
 |
 |
2.5e-17 |
0.000019 |
0.027 |
exponential_vs_stationary_24highlight | 0.988000 | 0.00138 |
| Thaps_hclust_0212 |
|
|
2.5e-17 |
0.000019 |
0.027 |
co2_elevated_expo_arrays | 0.987000 | 0.00733 |
| Title | Cluster Plot | Dendrogram | e-value | e-value | e-value | Condition | Condition FDR | Condition Difference |
|---|---|---|---|---|---|---|---|---|
| Thaps_hclust_0124 |
 |
 |
1 |
0.23 |
42 |
exponential_vs_stationary_24highlight | 0.988000 | -0.00225 |
| Title | Cluster Plot | Dendrogram | e-value | e-value | e-value | Condition | Condition FDR | Condition Difference |
|---|---|---|---|---|---|---|---|---|
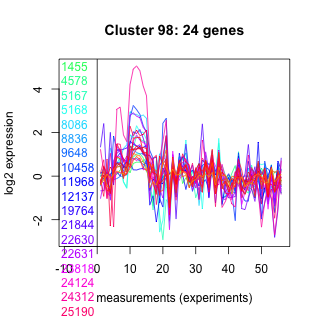
| Thaps_hclust_0098 |
 |
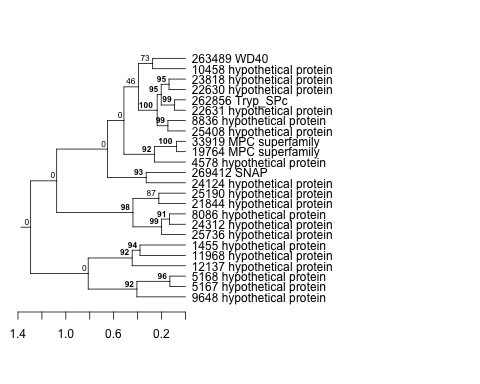 |
0.0000000015 |
0.17 |
19 |
highlight_arrays | 0.988000 | -0.00199 |
| Title | Cluster Plot | Dendrogram | e-value | e-value | e-value | Condition | Condition FDR | Condition Difference |
|---|---|---|---|---|---|---|---|---|
| Thaps_hclust_0248 |
 |
 |
0.000037 |
0.000078 |
39 |
highlight_arrays | 0.988000 | 0.00425 |
| Title | Cluster Plot | Dendrogram | e-value | e-value | e-value | Condition | Condition FDR | Condition Difference |
|---|---|---|---|---|---|---|---|---|
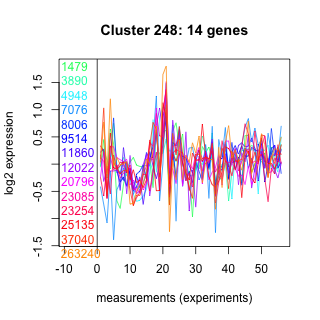
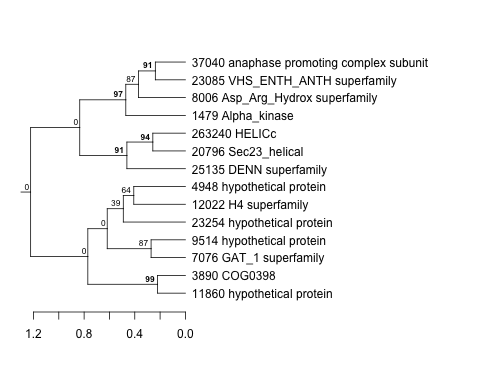
| Thaps_hclust_0323 |
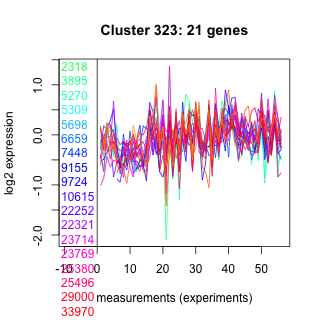 |
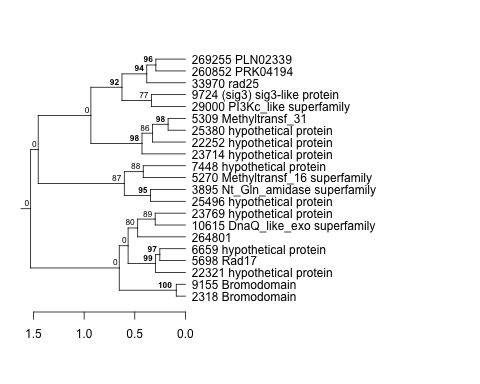 |
0.0011 |
0.014 |
36 |
exponential_vs_stationary_24highlight | 0.986000 | -0.00274 |
| Title | Cluster Plot | Dendrogram | e-value | e-value | e-value | Condition | Condition FDR | Condition Difference |
|---|---|---|---|---|---|---|---|---|
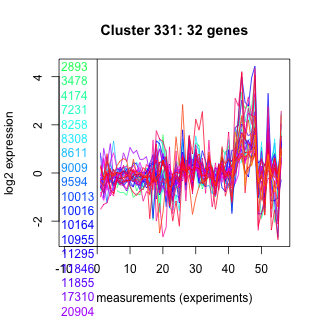
| Thaps_hclust_0331 |
 |
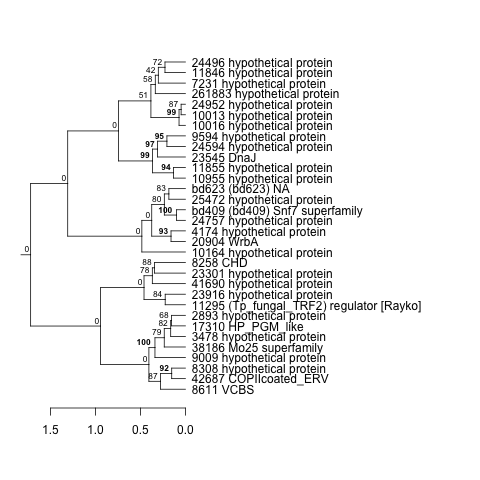 |
0.000000000011 |
20 |
1600 |
lowSi_TMEVA | 0.986000 | -0.116 |
| Title | Cluster Plot | Dendrogram | e-value | e-value | e-value | Condition | Condition FDR | Condition Difference |
|---|---|---|---|---|---|---|---|---|
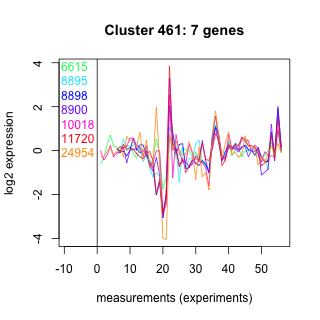
| Thaps_hclust_0461 |
 |
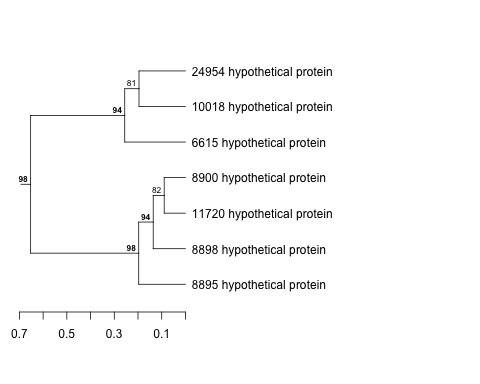 |
0.00000000082 |
0.01 |
0.079 |
exponential_vs_stationary_24highlight | 0.986000 | -0.004 |
| Title | Cluster Plot | Dendrogram | e-value | e-value | e-value | Condition | Condition FDR | Condition Difference |
|---|---|---|---|---|---|---|---|---|
| Thaps_hclust_0459 |
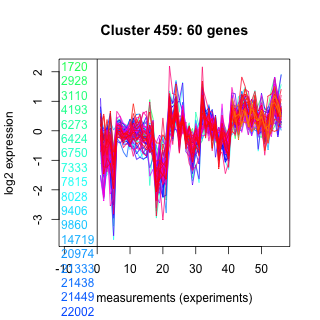 |
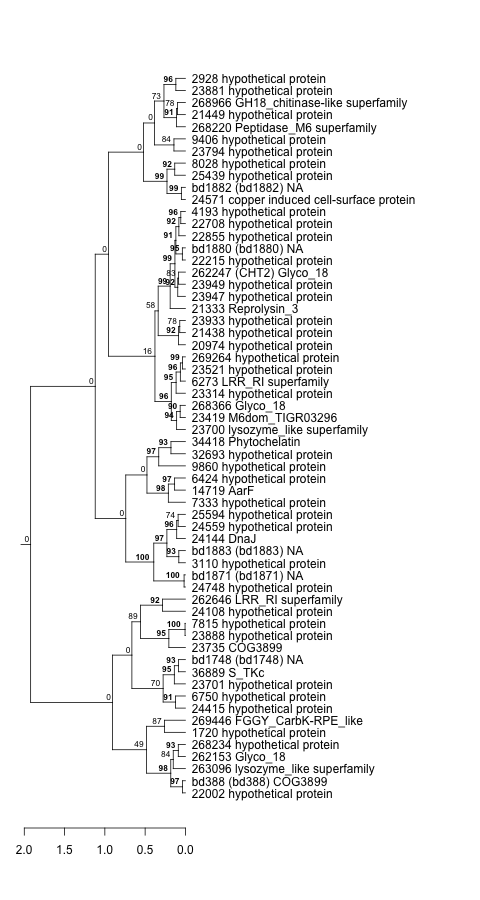 |
0.00000000015 |
0.0000000056 |
0.000000015 |
exponential_vs_stationary_24highlight | 0.986000 | 0.00134 |
| Title | Cluster Plot | Dendrogram | e-value | e-value | e-value | Condition | Condition FDR | Condition Difference |
|---|---|---|---|---|---|---|---|---|
| Thaps_hclust_0378 |
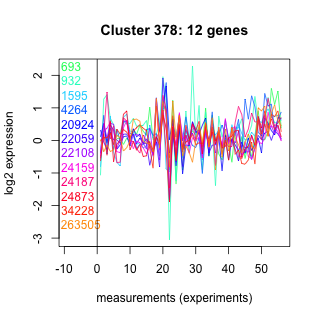 |
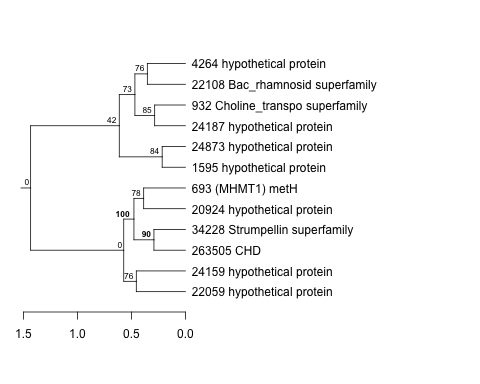 |
0.0003 |
210 |
10 |
exponential_vs_stationary_24highlight | 0.986000 | 0.0033 |
| Title | Cluster Plot | Dendrogram | e-value | e-value | e-value | Condition | Condition FDR | Condition Difference |
|---|---|---|---|---|---|---|---|---|
| Thaps_hclust_0389 |
 |
 |
0.00000008 |
0.00077 |
340 |
lowSi_TMEVA | 0.986000 | -0.107 |
| Title | Cluster Plot | Dendrogram | e-value | e-value | e-value | Condition | Condition FDR | Condition Difference |
|---|---|---|---|---|---|---|---|---|
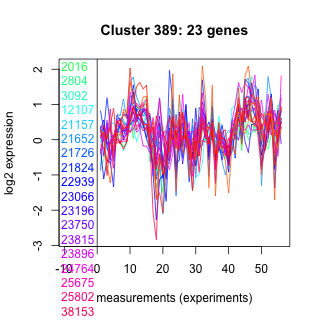
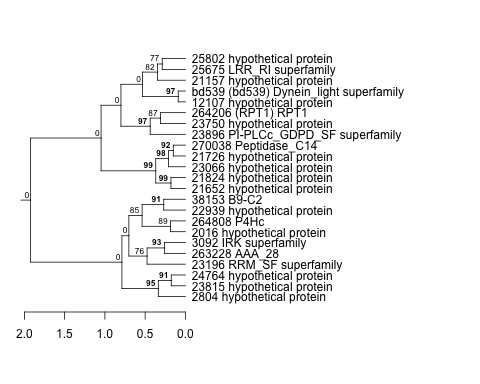
| Thaps_hclust_0399 |
 |
 |
0.0039 |
0.16 |
0.0016 |
co2_elevated_expo_arrays | 0.985000 | 0.0119 |
| Title | Cluster Plot | Dendrogram | e-value | e-value | e-value | Condition | Condition FDR | Condition Difference |
|---|---|---|---|---|---|---|---|---|
| Thaps_hclust_0011 |
 |
 |
0.000023 |
10 |
1.3 |
co2_elevated_expo_arrays | 0.985000 | 0.00679 |
| Title | Cluster Plot | Dendrogram | e-value | e-value | e-value | Condition | Condition FDR | Condition Difference |
|---|---|---|---|---|---|---|---|---|
| Thaps_hclust_0347 |
 |
 |
1.2 |
0.85 |
91 |
co2_elevated_expo_arrays | 0.985000 | 0.0129 |
| Title | Cluster Plot | Dendrogram | e-value | e-value | e-value | Condition | Condition FDR | Condition Difference |
|---|---|---|---|---|---|---|---|---|
| Thaps_hclust_0293 |
 |
 |
0.16 |
120 |
360 |
co2_elevated_expo_arrays | 0.985000 | 0.0161 |
| Title | Cluster Plot | Dendrogram | e-value | e-value | e-value | Condition | Condition FDR | Condition Difference |
|---|---|---|---|---|---|---|---|---|
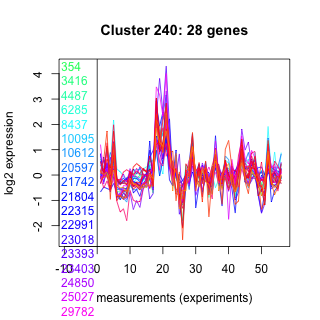
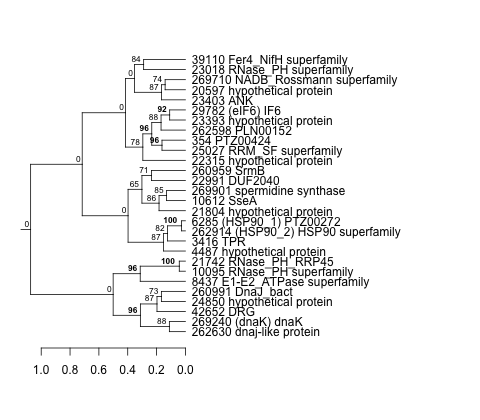
| Thaps_hclust_0240 |
 |
 |
0.000000064 |
0.000021 |
0.00078 |
co2_elevated_expo_arrays | 0.985000 | 0.0085 |
| Title | Cluster Plot | Dendrogram | e-value | e-value | e-value | Condition | Condition FDR | Condition Difference |
|---|---|---|---|---|---|---|---|---|
| Thaps_hclust_0203 |
 |
 |
0.00051 |
1.2 |
1.3 |
co2_elevated_expo_arrays | 0.985000 | 0.00936 |
| Title | Cluster Plot | Dendrogram | e-value | e-value | e-value | Condition | Condition FDR | Condition Difference |
|---|---|---|---|---|---|---|---|---|
| Thaps_hclust_0415 |
 |
 |
0.0000000000041 |
0.000000046 |
0.000024 |
co2_elevated_expo_arrays | 0.985000 | 0.0186 |
| Title | Cluster Plot | Dendrogram | e-value | e-value | e-value | Condition | Condition FDR | Condition Difference |
|---|---|---|---|---|---|---|---|---|
| Thaps_hclust_0432 |
 |
 |
0.011 |
0.06 |
2.4 |
co2_elevated_expo_arrays | 0.985000 | 0.0127 |
| Title | Cluster Plot | Dendrogram | e-value | e-value | e-value | Condition | Condition FDR | Condition Difference |
|---|---|---|---|---|---|---|---|---|
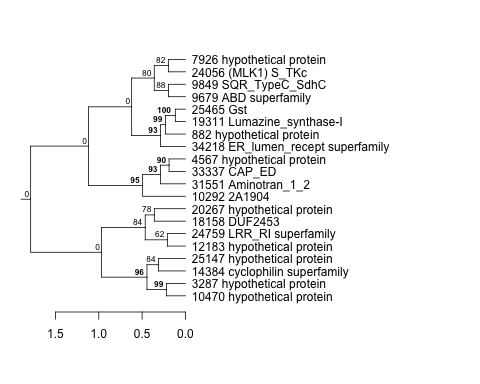
| Thaps_hclust_0397 |
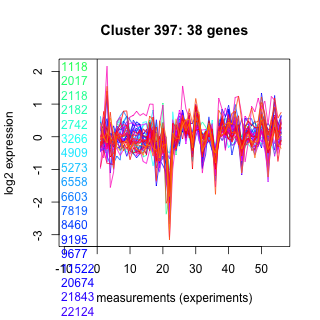 |
 |
0.00003 |
0.00016 |
0.0062 |
co2_elevated_expo_arrays | 0.985000 | 0.0115 |
| Title | Cluster Plot | Dendrogram | e-value | e-value | e-value | Condition | Condition FDR | Condition Difference |
|---|---|---|---|---|---|---|---|---|
| Thaps_hclust_0167 |
 |
 |
1 |
15 |
160 |
co2_elevated_expo_arrays | 0.985000 | 0.0142 |
| Title | Cluster Plot | Dendrogram | e-value | e-value | e-value | Condition | Condition FDR | Condition Difference |
|---|---|---|---|---|---|---|---|---|
| Thaps_hclust_0414 |
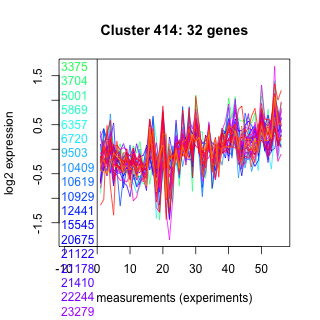 |
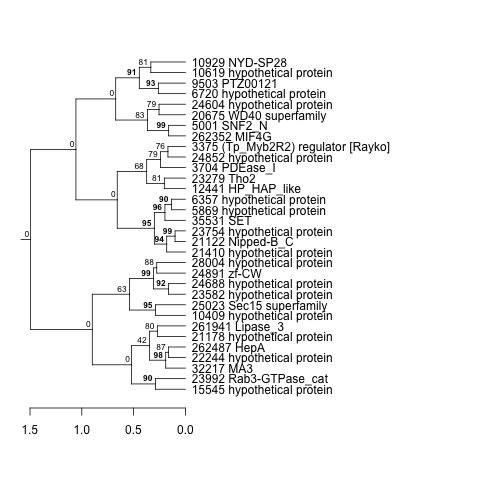 |
0.0000000000028 |
0.00000026 |
0.000019 |
co2_elevated_expo_arrays | 0.985000 | -0.0136 |
| Title | Cluster Plot | Dendrogram | e-value | e-value | e-value | Condition | Condition FDR | Condition Difference |
|---|---|---|---|---|---|---|---|---|
| Thaps_hclust_0431 |
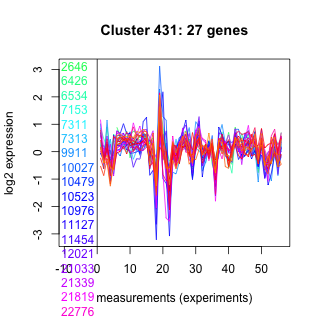 |
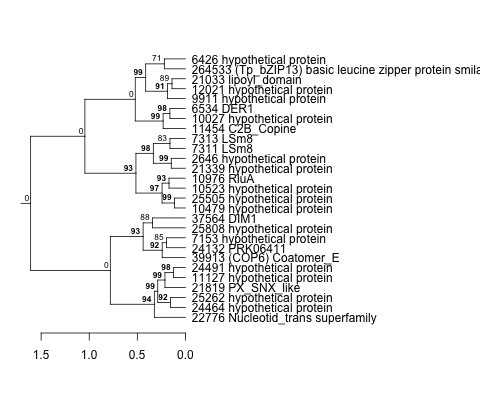 |
0.003 |
0.00095 |
0.0043 |
co2_elevated_expo_arrays | 0.985000 | -0.013 |
| Title | Cluster Plot | Dendrogram | e-value | e-value | e-value | Condition | Condition FDR | Condition Difference |
|---|---|---|---|---|---|---|---|---|
| Thaps_hclust_0448 |
 |
 |
0.0000000026 |
0.00021 |
8.2 |
co2_elevated_expo_arrays | 0.985000 | -0.0106 |
| Title | Cluster Plot | Dendrogram | e-value | e-value | e-value | Condition | Condition FDR | Condition Difference |
|---|---|---|---|---|---|---|---|---|
| Thaps_hclust_0272 |
 |
 |
0.0048 |
0.01 |
0.059 |
co2_elevated_expo_arrays | 0.985000 | 0.0108 |
| Title | Cluster Plot | Dendrogram | e-value | e-value | e-value | Condition | Condition FDR | Condition Difference |
|---|---|---|---|---|---|---|---|---|
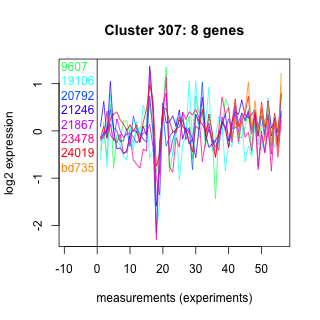
| Thaps_hclust_0307 |
 |
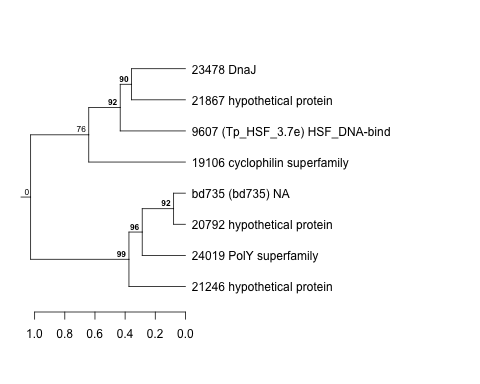 |
46 |
50 |
580 |
co2_elevated_expo_arrays | 0.985000 | -0.00834 |
| Title | Cluster Plot | Dendrogram | e-value | e-value | e-value | Condition | Condition FDR | Condition Difference |
|---|---|---|---|---|---|---|---|---|
| Thaps_hclust_0247 |
 |
 |
8.7e-16 |
0.00000000045 |
0.0000019 |
lowFe_KTKB_Day5 | 0.985000 | 0.0036 |
| Title | Cluster Plot | Dendrogram | e-value | e-value | e-value | Condition | Condition FDR | Condition Difference |
|---|---|---|---|---|---|---|---|---|
| Thaps_hclust_0325 |
 |
 |
0.00000000000002 |
0.000000076 |
0.17 |
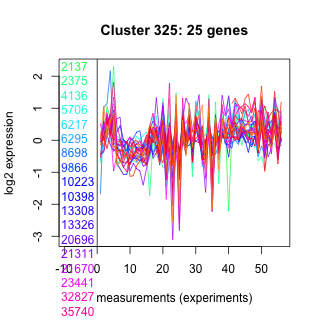
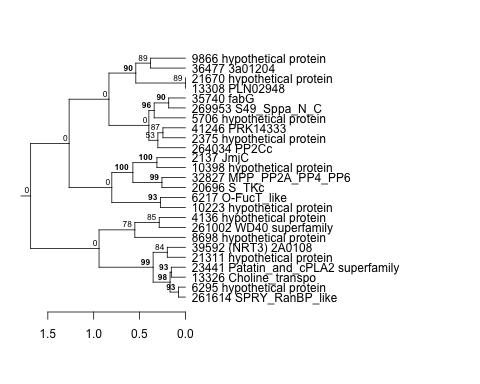
co2_elevated_expo_arrays | 0.985000 | 0.0138 |
| Title | Cluster Plot | Dendrogram | e-value | e-value | e-value | Condition | Condition FDR | Condition Difference |
|---|---|---|---|---|---|---|---|---|
| Thaps_hclust_0339 |
 |
 |
0.000016 |
0.00038 |
0.0017 |
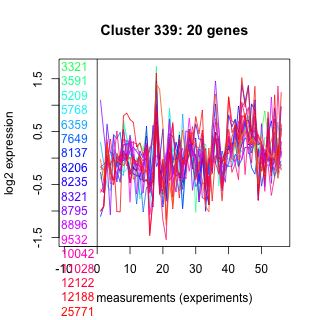
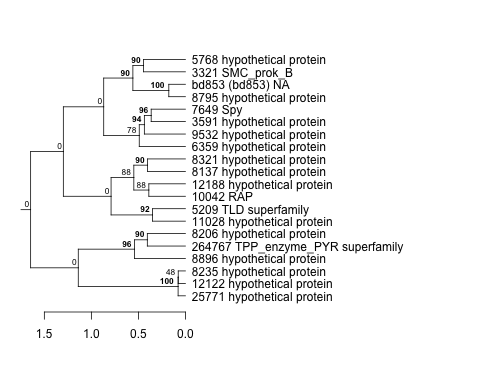
co2_elevated_expo_arrays | 0.985000 | -0.0171 |
| Title | Cluster Plot | Dendrogram | e-value | e-value | e-value | Condition | Condition FDR | Condition Difference |
|---|---|---|---|---|---|---|---|---|
| Thaps_hclust_0145 |
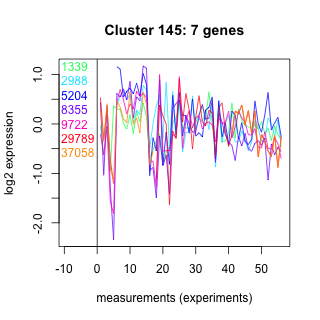 |
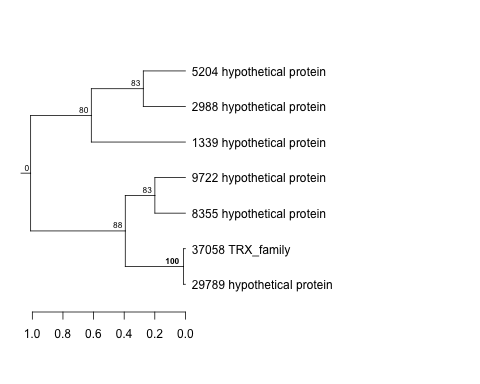 |
0.015 |
1.6 |
11 |
co2_elevated_expo_arrays | 0.985000 | 0.019 |
| Title | Cluster Plot | Dendrogram | e-value | e-value | e-value | Condition | Condition FDR | Condition Difference |
|---|---|---|---|---|---|---|---|---|
| Thaps_hclust_0214 |
 |
 |
0.00006 |
0.0000000031 |
0.00076 |
co2_elevated_expo_arrays | 0.985000 | -0.0179 |
| Title | Cluster Plot | Dendrogram | e-value | e-value | e-value | Condition | Condition FDR | Condition Difference |
|---|---|---|---|---|---|---|---|---|
| Thaps_hclust_0144 |
 |
 |
0.000000001 |
0.0000000019 |
0.00000019 |
co2_elevated_expo_arrays | 0.985000 | -0.0139 |
| Title | Cluster Plot | Dendrogram | e-value | e-value | e-value | Condition | Condition FDR | Condition Difference |
|---|---|---|---|---|---|---|---|---|
| Thaps_hclust_0161 |
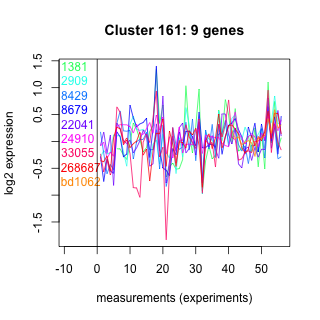 |
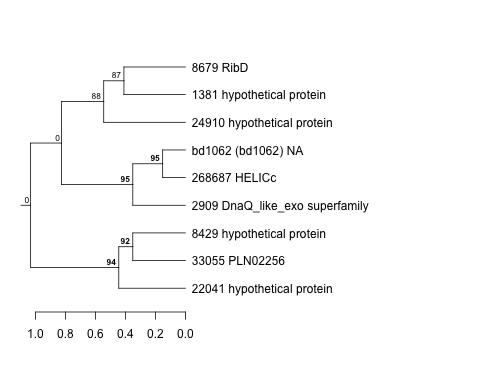 |
1.8 |
13 |
18 |
co2_elevated_expo_arrays | 0.985000 | -0.0156 |
| Title | Cluster Plot | Dendrogram | e-value | e-value | e-value | Condition | Condition FDR | Condition Difference |
|---|---|---|---|---|---|---|---|---|
| Thaps_hclust_0054 |
 |
 |
1.6e-17 |
0.0000000000053 |
0.000000000000024 |
co2_elevated_expo_arrays | 0.985000 | 0.00824 |
| Title | Cluster Plot | Dendrogram | e-value | e-value | e-value | Condition | Condition FDR | Condition Difference |
|---|---|---|---|---|---|---|---|---|
| Thaps_hclust_0130 |
 |
 |
0.64 |
15 |
13 |
lowSi_TMEVA | 0.985000 | -0.11 |
| Title | Cluster Plot | Dendrogram | e-value | e-value | e-value | Condition | Condition FDR | Condition Difference |
|---|---|---|---|---|---|---|---|---|
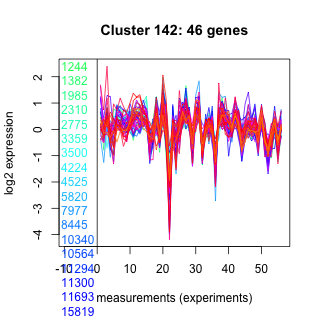
| Thaps_hclust_0142 |
 |
 |
0.000000000000013 |
0.0000000004 |
0.001 |
co2_elevated_expo_arrays | 0.985000 | 0.0136 |