Hierarchical Clusters
Displaying 1601 - 1700 of 7500
| Title | Cluster Plot | Dendrogram | e-value | e-value | e-value | Condition | Condition FDR | Condition Difference |
|---|---|---|---|---|---|---|---|---|
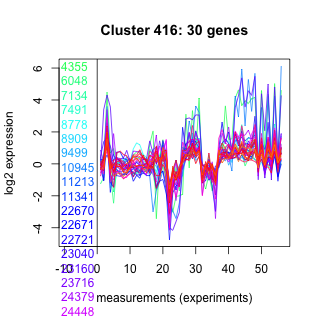
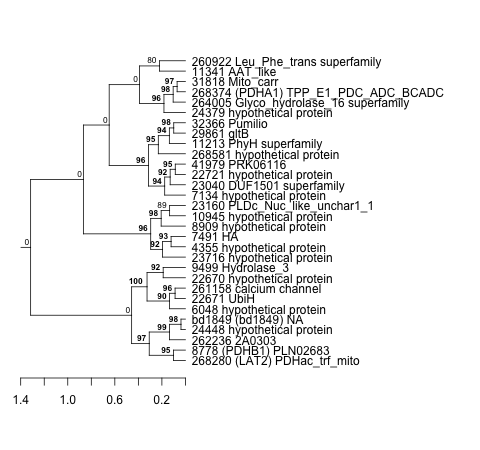
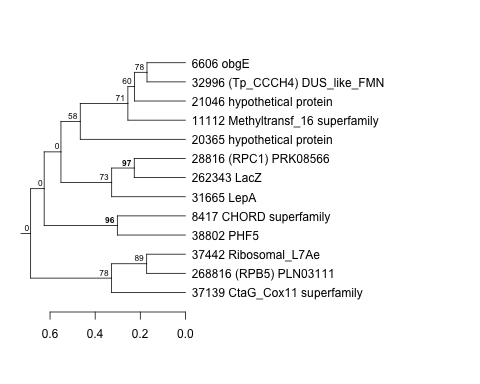
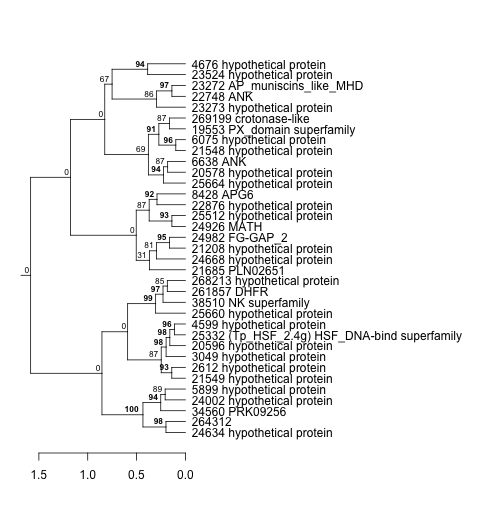
| Thaps_hclust_0416 |
 |
 |
0.00000015 |
0.00000035 |
0.7 |
co2_elevated_stat_arrays | 0.801000 | 0.0707 |
| Title | Cluster Plot | Dendrogram | e-value | e-value | e-value | Condition | Condition FDR | Condition Difference |
|---|---|---|---|---|---|---|---|---|
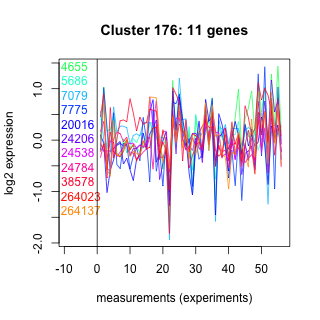
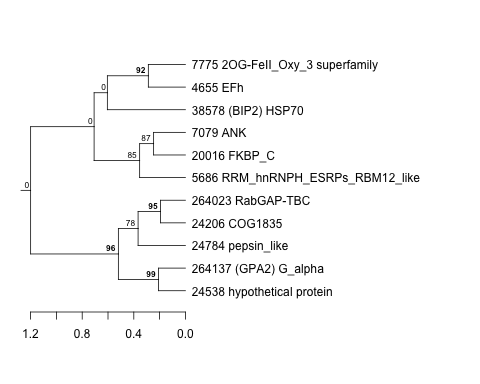
| Thaps_hclust_0152 |
 |
 |
0.00015 |
0.00023 |
0.031 |
co2_elevated_stat_arrays | 0.801000 | -0.0855 |
| Title | Cluster Plot | Dendrogram | e-value | e-value | e-value | Condition | Condition FDR | Condition Difference |
|---|---|---|---|---|---|---|---|---|
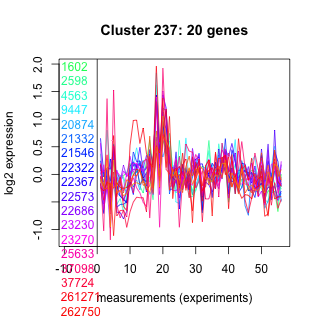
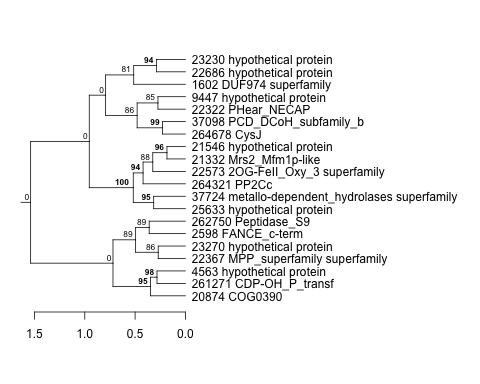
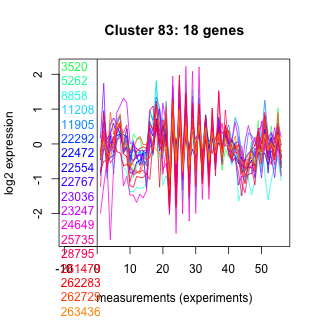
| Thaps_hclust_0237 |
 |
 |
0.0000097 |
0.000009 |
0.000056 |
co2_elevated_stat_arrays | 0.801000 | -0.0715 |
| Title | Cluster Plot | Dendrogram | e-value | e-value | e-value | Condition | Condition FDR | Condition Difference |
|---|---|---|---|---|---|---|---|---|
| Thaps_hclust_0087 |
 |
 |
0.00000000000011 |
0.000026 |
0.028 |
co2_elevated_stat_arrays | 0.801000 | -0.07 |
| Title | Cluster Plot | Dendrogram | e-value | e-value | e-value | Condition | Condition FDR | Condition Difference |
|---|---|---|---|---|---|---|---|---|
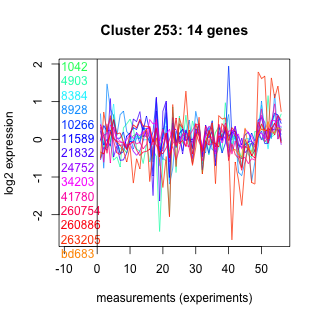
| Thaps_hclust_0253 |
 |
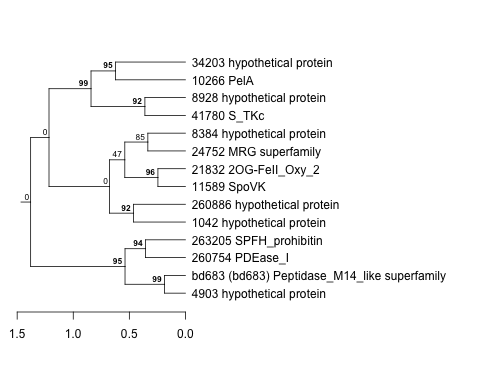 |
1.5 |
61 |
370 |
lowSi_TMEVA | 0.801000 | 0.262 |
| Title | Cluster Plot | Dendrogram | e-value | e-value | e-value | Condition | Condition FDR | Condition Difference |
|---|---|---|---|---|---|---|---|---|
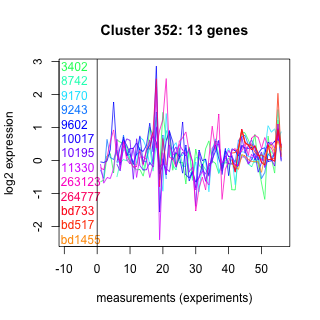
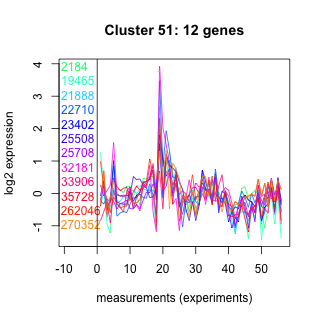
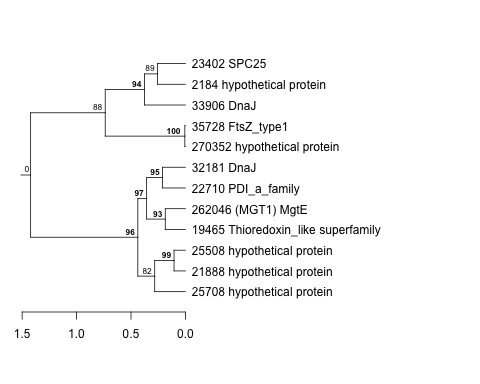
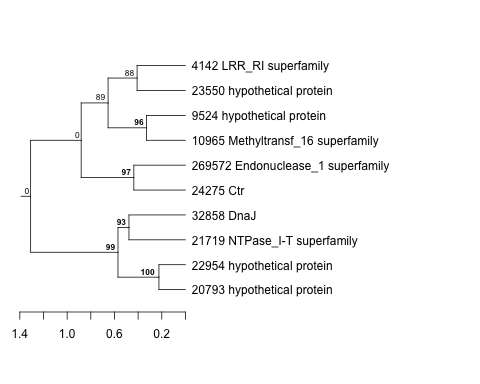
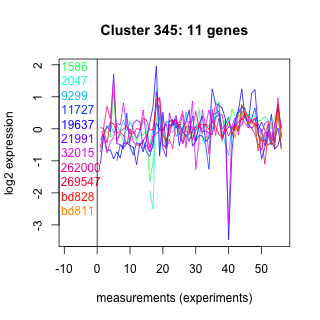
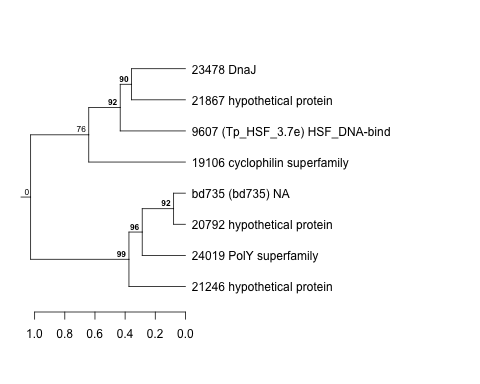
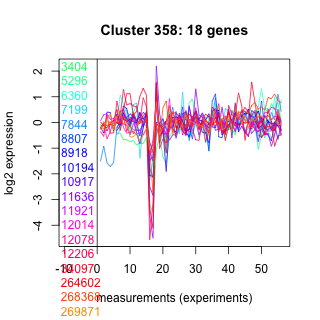
| Thaps_hclust_0352 |
 |
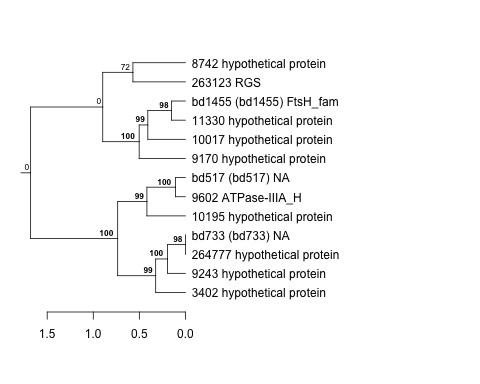 |
8.7 |
78 |
79 |
exponential_vs_stationary_24light | 0.800000 | 0.125 |
| Thaps_hclust_0352 |
|
|
8.7 |
78 |
79 |
highlight_arrays | 0.799000 | -0.0585 |
| Title | Cluster Plot | Dendrogram | e-value | e-value | e-value | Condition | Condition FDR | Condition Difference |
|---|---|---|---|---|---|---|---|---|
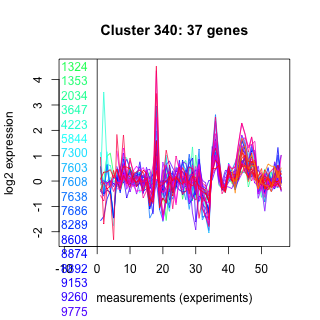
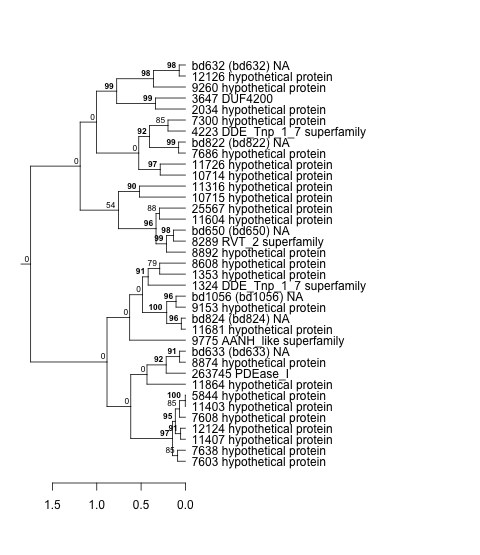
| Thaps_hclust_0340 |
 |
 |
0.00000000039 |
0.0000000031 |
0.0000002 |
exponential_vs_stationary_24light | 0.800000 | -0.0856 |
| Title | Cluster Plot | Dendrogram | e-value | e-value | e-value | Condition | Condition FDR | Condition Difference |
|---|---|---|---|---|---|---|---|---|
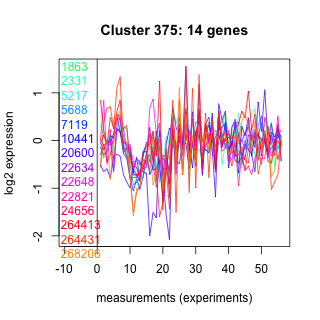
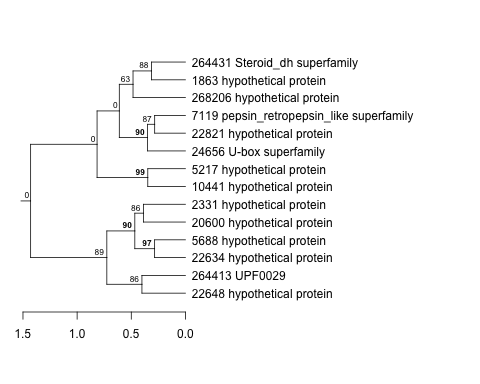
| Thaps_hclust_0375 |
 |
 |
1.8 |
2.9 |
40 |
exponential_vs_stationary_24light | 0.800000 | 0.123 |
| Thaps_hclust_0375 |
|
|
1.8 |
2.9 |
40 |
co2_elevated_expo_arrays | 0.796000 | 0.0905 |
| Title | Cluster Plot | Dendrogram | e-value | e-value | e-value | Condition | Condition FDR | Condition Difference |
|---|---|---|---|---|---|---|---|---|
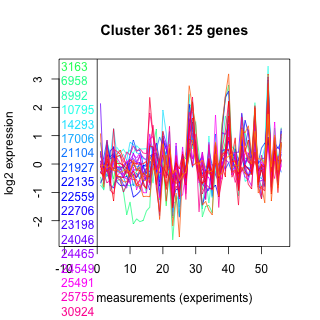
| Thaps_hclust_0361 |
 |
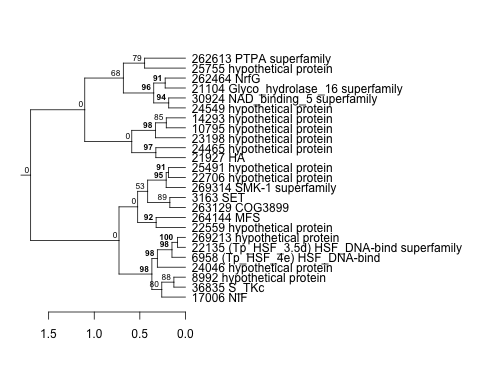 |
0.00000000081 |
0.14 |
2.1 |
highlight_arrays | 0.800000 | 0.0433 |
| Thaps_hclust_0361 |
|
|
0.00000000081 |
0.14 |
2.1 |
lowFe_KTKB_Day3 | 0.795000 | 0.0667 |
| Title | Cluster Plot | Dendrogram | e-value | e-value | e-value | Condition | Condition FDR | Condition Difference |
|---|---|---|---|---|---|---|---|---|
| Thaps_hclust_0208 |
 |
|
1.2e-20 |
0.0000000000000057 |
0.0000000099 |
lowtemp_TMEVA | 0.800000 | 0.0444 |
| Title | Cluster Plot | Dendrogram | e-value | e-value | e-value | Condition | Condition FDR | Condition Difference |
|---|---|---|---|---|---|---|---|---|
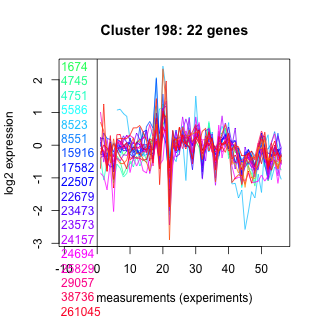
| Thaps_hclust_0198 |
 |
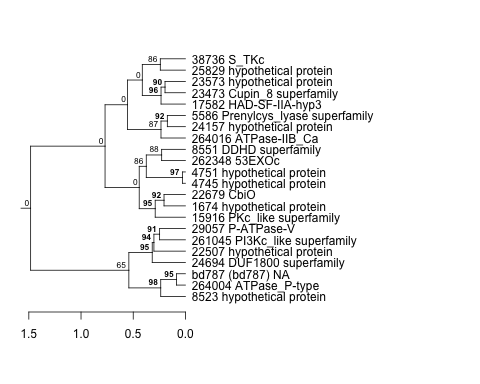 |
0.00091 |
0.017 |
0.0046 |
lowFe_KTKB_Day3 | 0.799000 | -0.0671 |
| Title | Cluster Plot | Dendrogram | e-value | e-value | e-value | Condition | Condition FDR | Condition Difference |
|---|---|---|---|---|---|---|---|---|
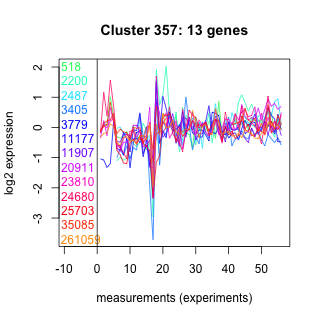
| Thaps_hclust_0357 |
 |
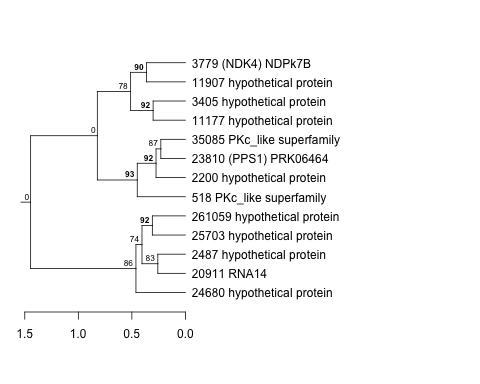 |
0.077 |
0.1 |
0.81 |
exponential_vs_stationary_24highlight | 0.799000 | -0.0389 |
| Title | Cluster Plot | Dendrogram | e-value | e-value | e-value | Condition | Condition FDR | Condition Difference |
|---|---|---|---|---|---|---|---|---|
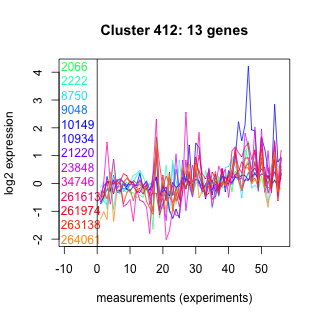
| Thaps_hclust_0412 |
 |
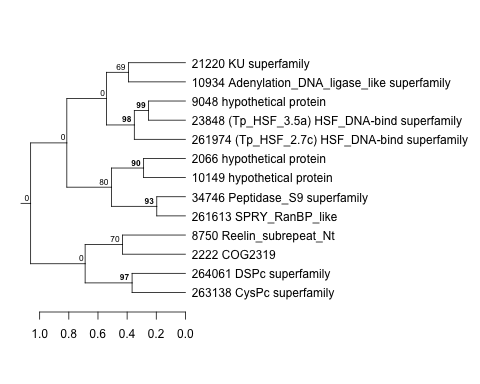 |
0.39 |
17 |
2.9 |
lowtemp_TMEVA | 0.799000 | -0.0909 |
| Title | Cluster Plot | Dendrogram | e-value | e-value | e-value | Condition | Condition FDR | Condition Difference |
|---|---|---|---|---|---|---|---|---|
| Thaps_hclust_0113 |
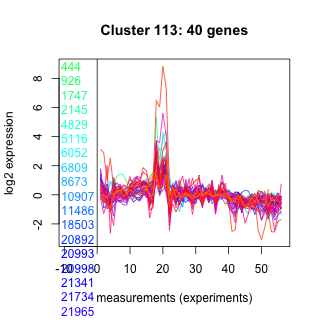 |
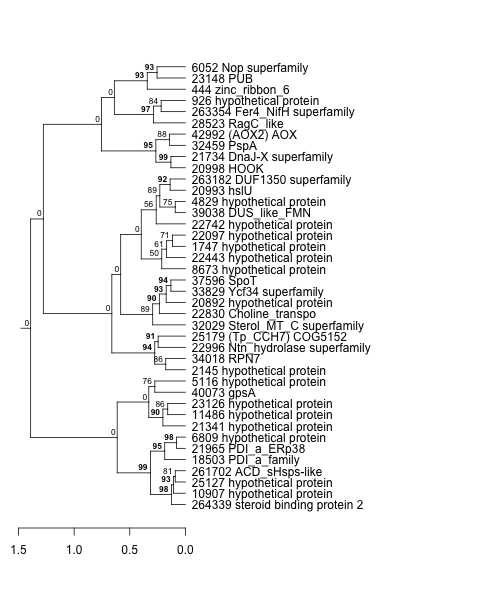 |
0.00000000011 |
0.000014 |
0.00007 |
co2_elevated_expo_arrays | 0.799000 | 0.0759 |
| Title | Cluster Plot | Dendrogram | e-value | e-value | e-value | Condition | Condition FDR | Condition Difference |
|---|---|---|---|---|---|---|---|---|
| Thaps_hclust_0110 |
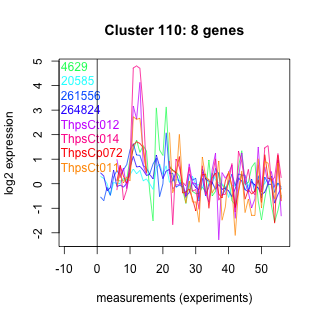 |
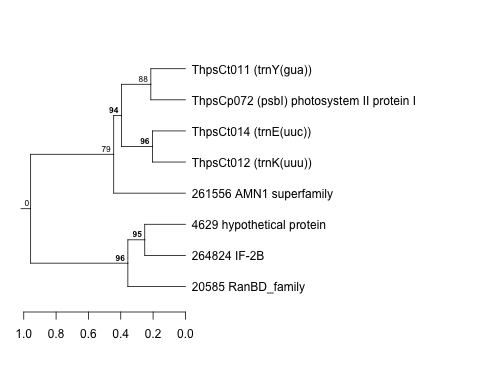 |
0.64 |
35 |
160 |
highpH_TMEVA | 0.799000 | 0.0738 |
| Thaps_hclust_0110 |
|
|
0.64 |
35 |
160 |
lowFe_KTKB_Day3 | 0.795000 | 0.11 |
| Title | Cluster Plot | Dendrogram | e-value | e-value | e-value | Condition | Condition FDR | Condition Difference |
|---|---|---|---|---|---|---|---|---|
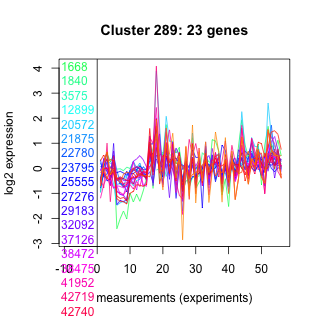
| Thaps_hclust_0289 |
 |
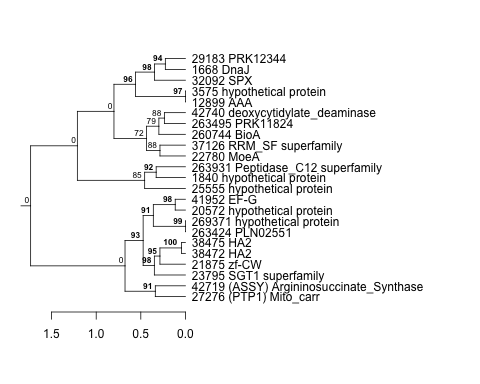 |
0.0000000000026 |
0.00000000000025 |
0.0000045 |
exponential_vs_stationary_24light | 0.799000 | 0.101 |
| Thaps_hclust_0289 |
|
|
0.0000000000026 |
0.00000000000025 |
0.0000045 |
lowN_TMEVA | 0.789000 | 0.0987 |
| Title | Cluster Plot | Dendrogram | e-value | e-value | e-value | Condition | Condition FDR | Condition Difference |
|---|---|---|---|---|---|---|---|---|
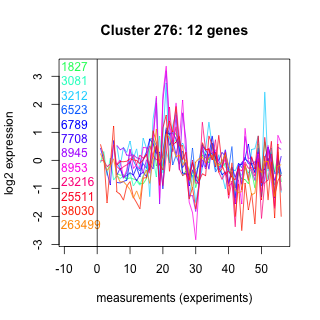
| Thaps_hclust_0276 |
 |
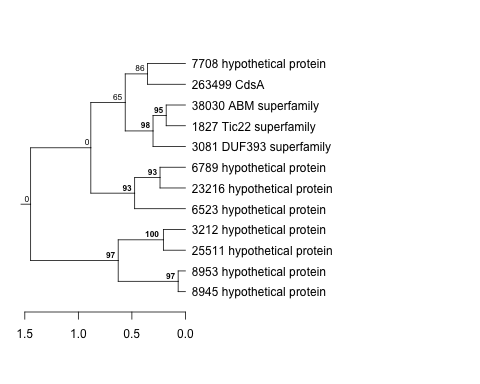 |
0.063 |
39 |
53 |
lowFe_KTKB_Day3 | 0.799000 | -0.0908 |
| Title | Cluster Plot | Dendrogram | e-value | e-value | e-value | Condition | Condition FDR | Condition Difference |
|---|---|---|---|---|---|---|---|---|
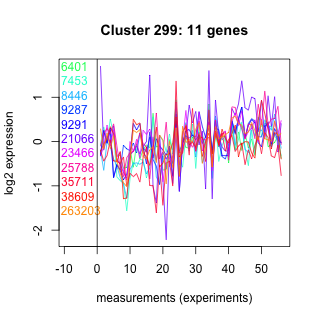
| Thaps_hclust_0299 |
 |
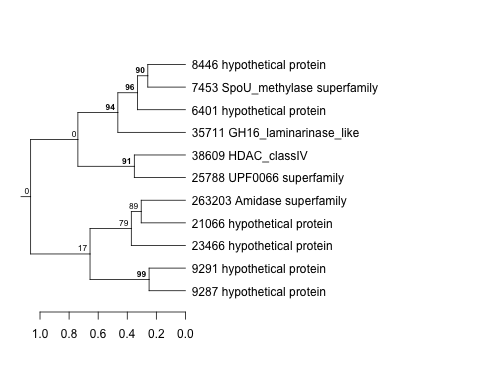 |
0.0056 |
1.7 |
6.7 |
lowtemp_TMEVA | 0.799000 | -0.0964 |
| Thaps_hclust_0299 |
|
|
0.0056 |
1.7 |
6.7 |
exponential_vs_stationary_24highlight | 0.790000 | 0.0428 |
| Title | Cluster Plot | Dendrogram | e-value | e-value | e-value | Condition | Condition FDR | Condition Difference |
|---|---|---|---|---|---|---|---|---|
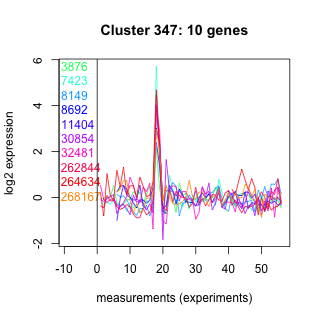
| Thaps_hclust_0347 |
 |
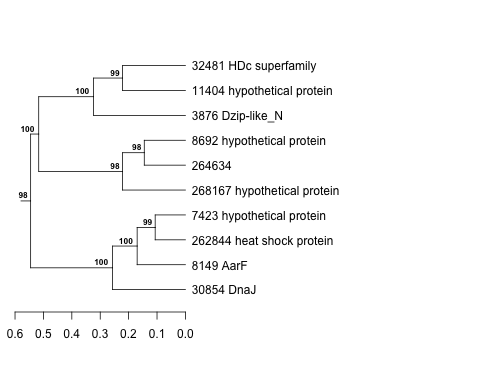 |
1.2 |
0.85 |
91 |
lowFe_KTKB_Day3 | 0.799000 | -0.0972 |
| Thaps_hclust_0347 |
|
|
1.2 |
0.85 |
91 |
lowN_TMEVA | 0.789000 | 0.114 |
| Title | Cluster Plot | Dendrogram | e-value | e-value | e-value | Condition | Condition FDR | Condition Difference |
|---|---|---|---|---|---|---|---|---|
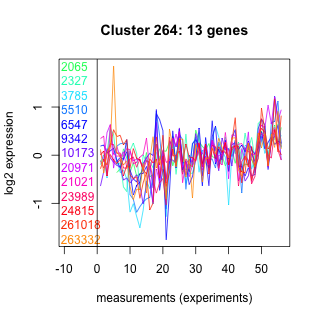
| Thaps_hclust_0264 |
 |
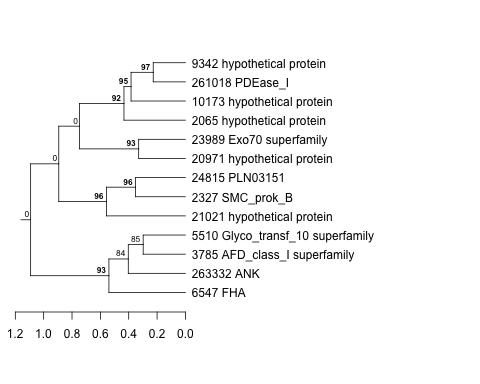 |
0.0079 |
0.24 |
5.8 |
highpH_TMEVA | 0.799000 | -0.062 |
| Title | Cluster Plot | Dendrogram | e-value | e-value | e-value | Condition | Condition FDR | Condition Difference |
|---|---|---|---|---|---|---|---|---|
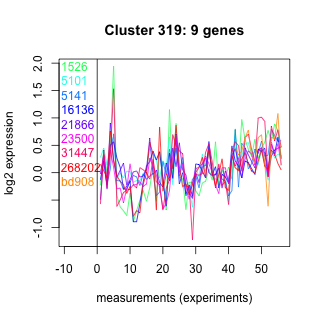
| Thaps_hclust_0319 |
 |
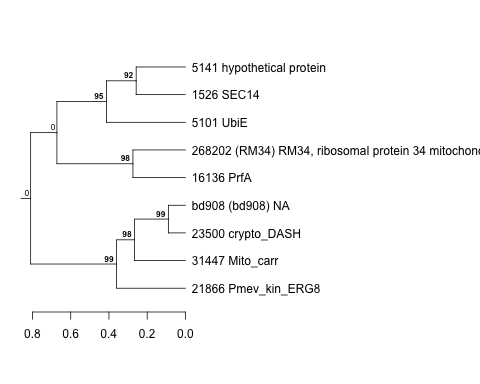 |
2.4 |
46 |
70 |
exponential_vs_stationary_24light | 0.799000 | 0.146 |
| Title | Cluster Plot | Dendrogram | e-value | e-value | e-value | Condition | Condition FDR | Condition Difference |
|---|---|---|---|---|---|---|---|---|
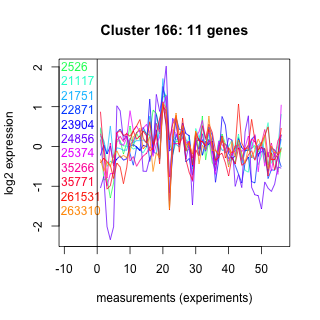
| Thaps_hclust_0166 |
 |
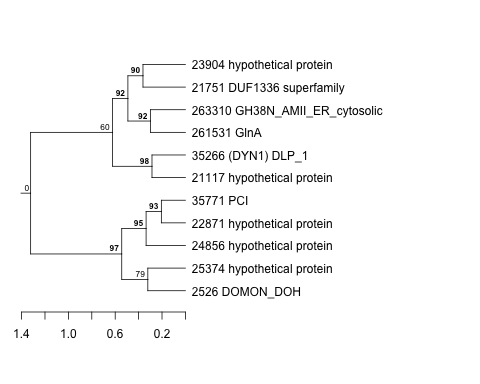 |
0.001 |
5.3 |
63 |
diel_light_vs_dark | 0.799000 | -0.0931 |
| Title | Cluster Plot | Dendrogram | e-value | e-value | e-value | Condition | Condition FDR | Condition Difference |
|---|---|---|---|---|---|---|---|---|
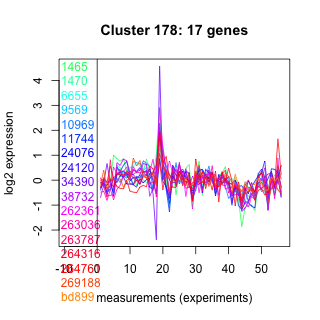
| Thaps_hclust_0178 |
 |
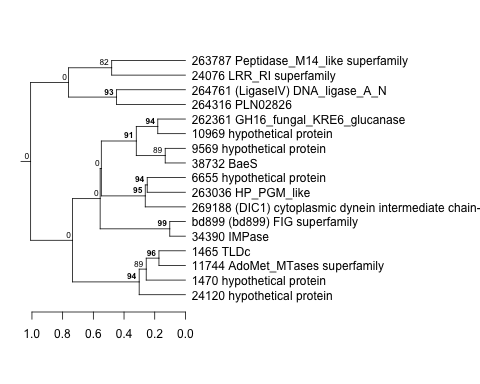 |
0.0000000019 |
0.00000047 |
0.000019 |
diel_light_vs_dark | 0.798000 | 0.0796 |
| Title | Cluster Plot | Dendrogram | e-value | e-value | e-value | Condition | Condition FDR | Condition Difference |
|---|---|---|---|---|---|---|---|---|
| Thaps_hclust_0051 |
 |
 |
0.012 |
0.033 |
0.41 |
diel_light_vs_dark | 0.798000 | -0.0899 |
| Title | Cluster Plot | Dendrogram | e-value | e-value | e-value | Condition | Condition FDR | Condition Difference |
|---|---|---|---|---|---|---|---|---|
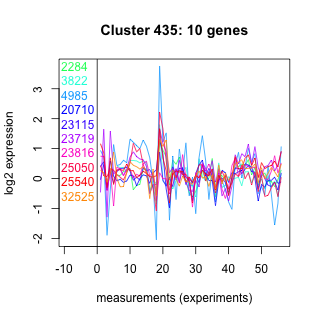
| Thaps_hclust_0435 |
 |
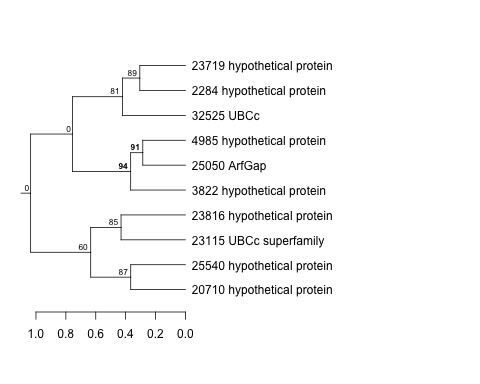 |
0.17 |
0.24 |
1.5 |
lowFe_KTKB_Day3 | 0.797000 | -0.0985 |
| Title | Cluster Plot | Dendrogram | e-value | e-value | e-value | Condition | Condition FDR | Condition Difference |
|---|---|---|---|---|---|---|---|---|
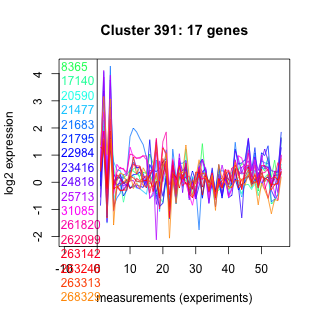
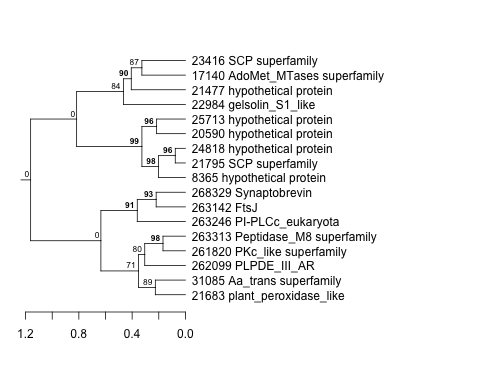
| Thaps_hclust_0391 |
 |
 |
1.9 |
34 |
32 |
diel_exponential_vs_stationary | 0.797000 | -0.0601 |
| Title | Cluster Plot | Dendrogram | e-value | e-value | e-value | Condition | Condition FDR | Condition Difference |
|---|---|---|---|---|---|---|---|---|
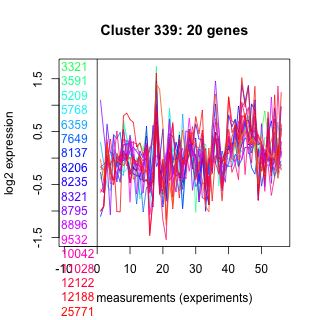
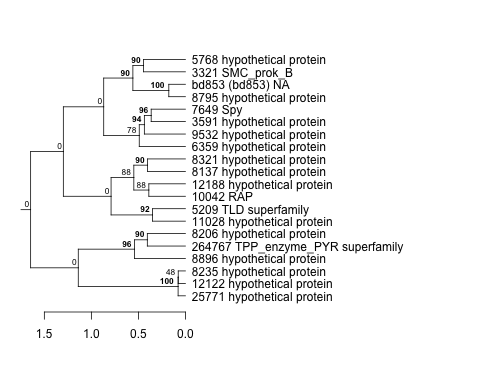
| Thaps_hclust_0339 |
 |
 |
0.000016 |
0.00038 |
0.0017 |
BaP | 0.796000 | -0.0689 |
| Title | Cluster Plot | Dendrogram | e-value | e-value | e-value | Condition | Condition FDR | Condition Difference |
|---|---|---|---|---|---|---|---|---|
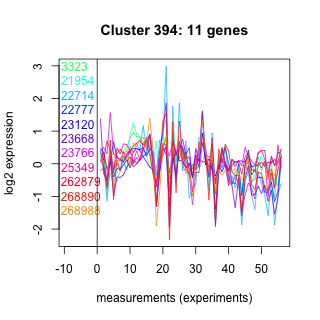
| Thaps_hclust_0394 |
 |
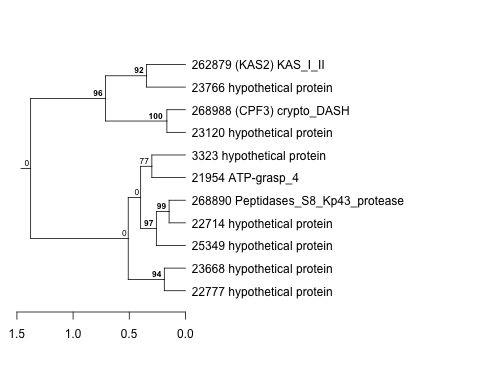 |
0.044 |
0.46 |
610 |
exponential_vs_stationary_24light | 0.796000 | 0.132 |
| Title | Cluster Plot | Dendrogram | e-value | e-value | e-value | Condition | Condition FDR | Condition Difference |
|---|---|---|---|---|---|---|---|---|
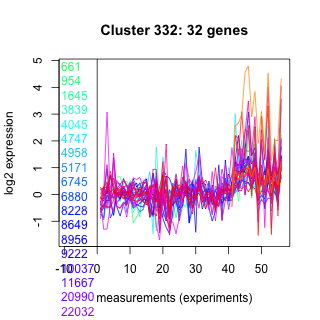
| Thaps_hclust_0332 |
 |
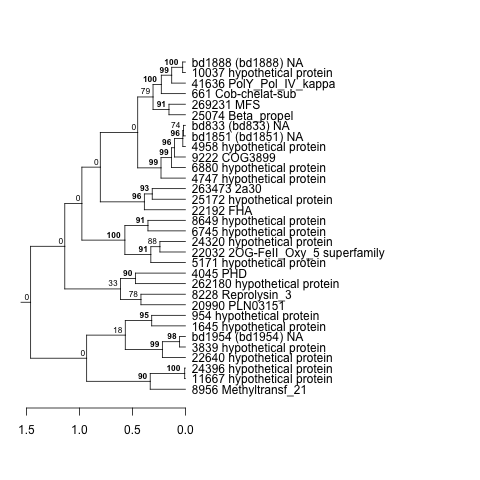 |
0.000000055 |
0.0000013 |
0.0037 |
BaP | 0.796000 | -0.0518 |
| Title | Cluster Plot | Dendrogram | e-value | e-value | e-value | Condition | Condition FDR | Condition Difference |
|---|---|---|---|---|---|---|---|---|
| Thaps_hclust_0114 |
 |
 |
0.086 |
4.8 |
3.2 |
diel_light_vs_dark | 0.796000 | -0.0787 |
| Title | Cluster Plot | Dendrogram | e-value | e-value | e-value | Condition | Condition FDR | Condition Difference |
|---|---|---|---|---|---|---|---|---|
| Thaps_hclust_0046 |
 |
 |
0.00000051 |
0.000067 |
0.29 |
BaP | 0.796000 | -0.0603 |
| Title | Cluster Plot | Dendrogram | e-value | e-value | e-value | Condition | Condition FDR | Condition Difference |
|---|---|---|---|---|---|---|---|---|
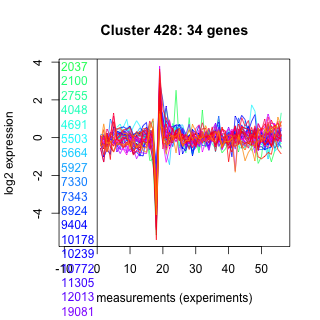
| Thaps_hclust_0428 |
 |
 |
0.000000076 |
0.015 |
1.9 |
lowFe_KTKB_Day3 | 0.795000 | -0.0578 |
| Title | Cluster Plot | Dendrogram | e-value | e-value | e-value | Condition | Condition FDR | Condition Difference |
|---|---|---|---|---|---|---|---|---|
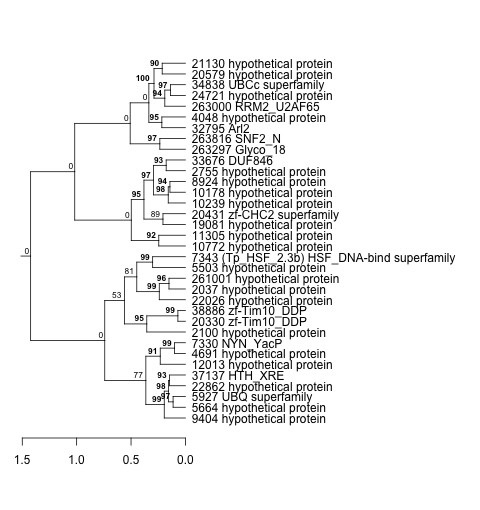
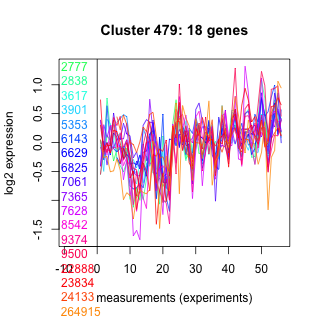
| Thaps_hclust_0479 |
 |
 |
0.11 |
0.2 |
1.5 |
lowFe_KTKB_Day3 | 0.795000 | -0.079 |
| Title | Cluster Plot | Dendrogram | e-value | e-value | e-value | Condition | Condition FDR | Condition Difference |
|---|---|---|---|---|---|---|---|---|
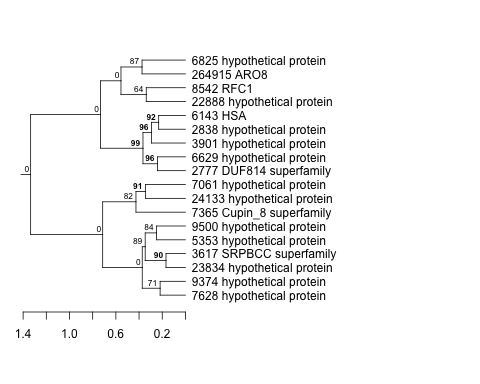
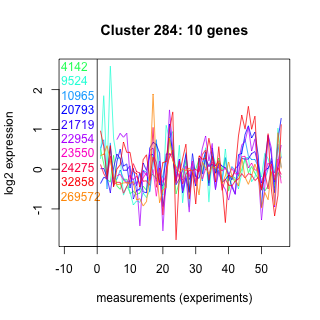
| Thaps_hclust_0284 |
 |
 |
0.0011 |
0.067 |
0.038 |
lowFe_KTKB_Day3 | 0.795000 | -0.105 |
| Title | Cluster Plot | Dendrogram | e-value | e-value | e-value | Condition | Condition FDR | Condition Difference |
|---|---|---|---|---|---|---|---|---|
| Thaps_hclust_0345 |
 |
 |
1.1 |
7 |
2.7 |
lowFe_TMEVA | 0.795000 | -0.113 |
| Thaps_hclust_0345 |
|
|
1.1 |
7 |
2.7 |
exponential_vs_stationary_24light | 0.787000 | 0.14 |
| Title | Cluster Plot | Dendrogram | e-value | e-value | e-value | Condition | Condition FDR | Condition Difference |
|---|---|---|---|---|---|---|---|---|
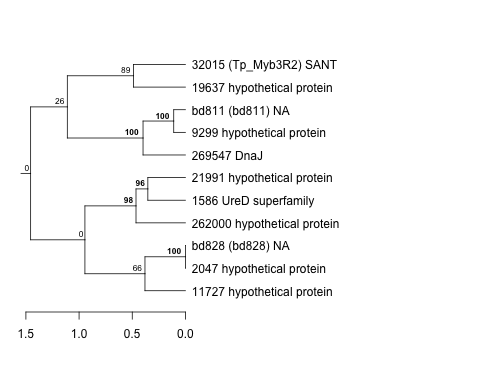
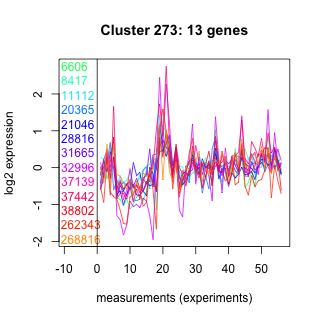
| Thaps_hclust_0273 |
 |
 |
0.052 |
0.27 |
12 |
lowFe_TMEVA | 0.795000 | -0.112 |
| Title | Cluster Plot | Dendrogram | e-value | e-value | e-value | Condition | Condition FDR | Condition Difference |
|---|---|---|---|---|---|---|---|---|
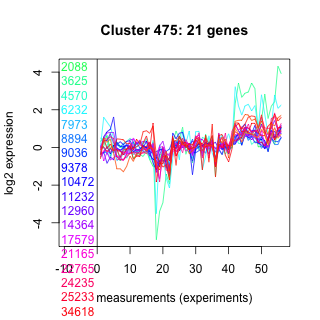
| Thaps_hclust_0475 |
 |
 |
0.011 |
0.95 |
0.77 |
lowFe_KTKB_Day3 | 0.795000 | -0.0726 |
| Thaps_hclust_0475 |
|
|
0.011 |
0.95 |
0.77 |
highlight_arrays | 0.790000 | 0.0493 |
| Title | Cluster Plot | Dendrogram | e-value | e-value | e-value | Condition | Condition FDR | Condition Difference |
|---|---|---|---|---|---|---|---|---|
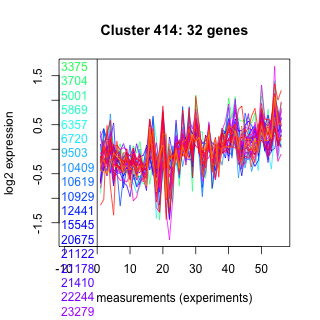
| Thaps_hclust_0414 |
 |
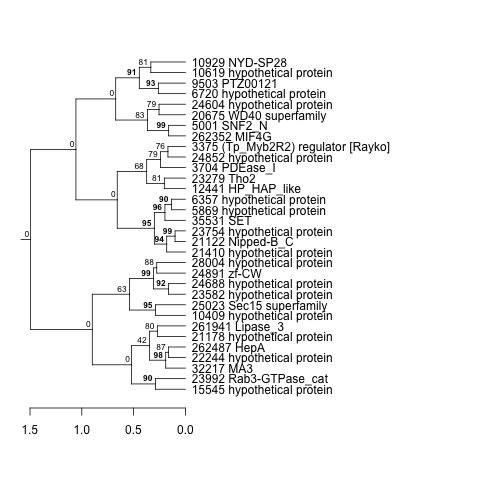 |
0.0000000000028 |
0.00000026 |
0.000019 |
lowFe_TMEVA | 0.795000 | -0.096 |
| Title | Cluster Plot | Dendrogram | e-value | e-value | e-value | Condition | Condition FDR | Condition Difference |
|---|---|---|---|---|---|---|---|---|
| Thaps_hclust_0139 |
 |
 |
0.00014 |
0.00066 |
3 |
lowFe_KTKB_Day3 | 0.795000 | -0.075 |
| Title | Cluster Plot | Dendrogram | e-value | e-value | e-value | Condition | Condition FDR | Condition Difference |
|---|---|---|---|---|---|---|---|---|
| Thaps_hclust_0174 |
 |
 |
1.3 |
0.99 |
2.2 |
lowFe_KTKB_Day3 | 0.795000 | -0.0641 |
| Title | Cluster Plot | Dendrogram | e-value | e-value | e-value | Condition | Condition FDR | Condition Difference |
|---|---|---|---|---|---|---|---|---|
| Thaps_hclust_0067 |
 |
 |
0.0036 |
0.86 |
0.11 |
lowFe_KTKB_Day3 | 0.795000 | 0.082 |
| Title | Cluster Plot | Dendrogram | e-value | e-value | e-value | Condition | Condition FDR | Condition Difference |
|---|---|---|---|---|---|---|---|---|
| Thaps_hclust_0329 |
 |
 |
0.0000000004 |
0.00000034 |
0.000023 |
lowFe_KTKB_Day3 | 0.795000 | -0.057 |
| Title | Cluster Plot | Dendrogram | e-value | e-value | e-value | Condition | Condition FDR | Condition Difference |
|---|---|---|---|---|---|---|---|---|
| Thaps_hclust_0364 |
 |
 |
4.5 |
28 |
590 |
lowFe_KTKB_Day3 | 0.795000 | 0.0978 |
| Title | Cluster Plot | Dendrogram | e-value | e-value | e-value | Condition | Condition FDR | Condition Difference |
|---|---|---|---|---|---|---|---|---|
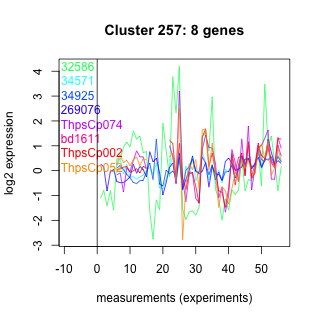
| Thaps_hclust_0257 |
 |
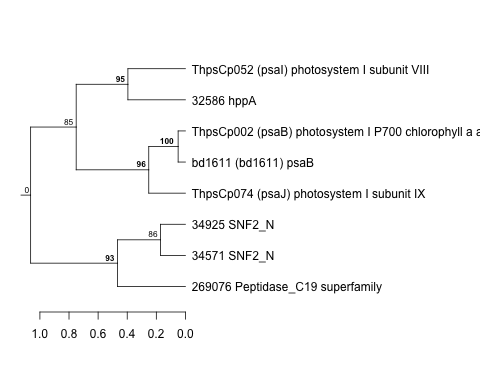 |
Not available | Not available | Not available | lowFe_KTKB_Day3 | 0.795000 | -0.11 |
| Title | Cluster Plot | Dendrogram | e-value | e-value | e-value | Condition | Condition FDR | Condition Difference |
|---|---|---|---|---|---|---|---|---|
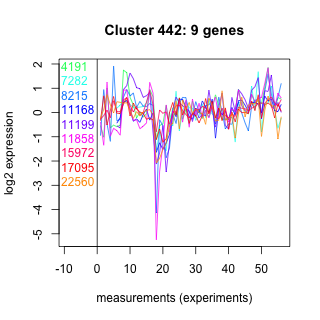
| Thaps_hclust_0442 |
 |
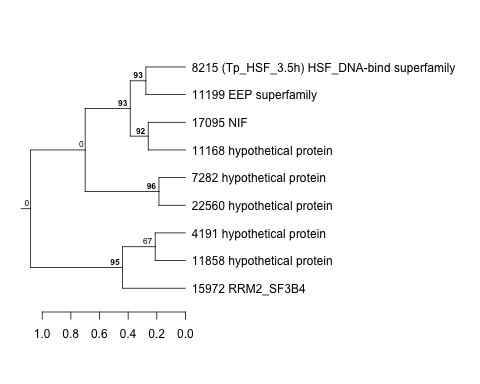 |
0.045 |
2.3 |
2.8 |
lowFe_TMEVA | 0.795000 | -0.122 |
| Thaps_hclust_0442 |
|
|
0.045 |
2.3 |
2.8 |
lowFe_KTKB_Day5 | 0.787000 | 0.0878 |
| Title | Cluster Plot | Dendrogram | e-value | e-value | e-value | Condition | Condition FDR | Condition Difference |
|---|---|---|---|---|---|---|---|---|
| Thaps_hclust_0142 |
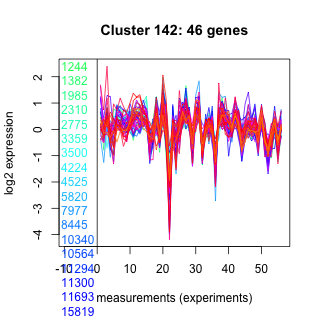 |
 |
0.000000000000013 |
0.0000000004 |
0.001 |
lowFe_TMEVA | 0.795000 | -0.093 |
| Title | Cluster Plot | Dendrogram | e-value | e-value | e-value | Condition | Condition FDR | Condition Difference |
|---|---|---|---|---|---|---|---|---|
| Thaps_hclust_0119 |
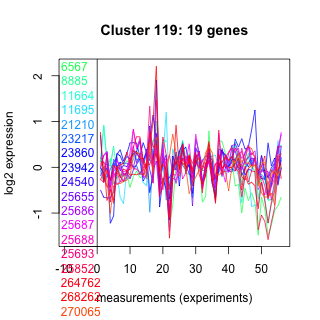 |
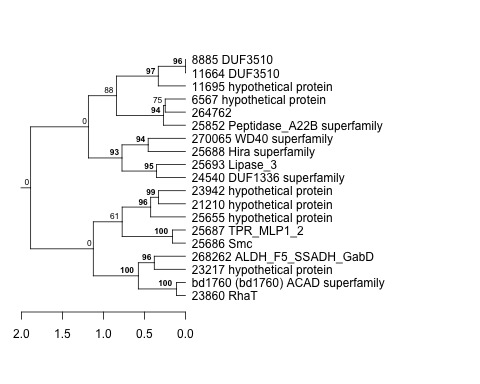 |
0.000017 |
0.0015 |
0.0058 |
co2_elevated_stat_arrays | 0.795000 | -0.076 |
| Title | Cluster Plot | Dendrogram | e-value | e-value | e-value | Condition | Condition FDR | Condition Difference |
|---|---|---|---|---|---|---|---|---|
| Thaps_hclust_0132 |
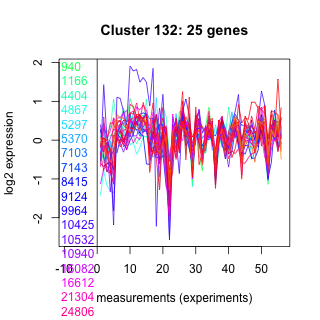 |
 |
0.00017 |
0.000096 |
26 |
lowFe_KTKB_Day3 | 0.795000 | -0.0698 |
| Title | Cluster Plot | Dendrogram | e-value | e-value | e-value | Condition | Condition FDR | Condition Difference |
|---|---|---|---|---|---|---|---|---|
| Thaps_hclust_0202 |
 |
 |
0.0064 |
0.023 |
0.32 |
lowFe_KTKB_Day3 | 0.795000 | 0.127 |
| Title | Cluster Plot | Dendrogram | e-value | e-value | e-value | Condition | Condition FDR | Condition Difference |
|---|---|---|---|---|---|---|---|---|
| Thaps_hclust_0207 |
 |
 |
0.0000000025 |
0.0000000037 |
0.1 |
highpH_TMEVA | 0.794000 | 0.0469 |
| Title | Cluster Plot | Dendrogram | e-value | e-value | e-value | Condition | Condition FDR | Condition Difference |
|---|---|---|---|---|---|---|---|---|
| Thaps_hclust_0467 |
 |
 |
0.000000000002 |
0.0000014 |
0.035 |
co2_elevated_stat_arrays | 0.794000 | 0.0733 |
| Title | Cluster Plot | Dendrogram | e-value | e-value | e-value | Condition | Condition FDR | Condition Difference |
|---|---|---|---|---|---|---|---|---|
| Thaps_hclust_0079 |
 |
 |
0.00048 |
0.000048 |
0.27 |
co2_elevated_stat_arrays | 0.794000 | -0.0734 |
| Title | Cluster Plot | Dendrogram | e-value | e-value | e-value | Condition | Condition FDR | Condition Difference |
|---|---|---|---|---|---|---|---|---|
| Thaps_hclust_0176 |
 |
 |
29 |
59 |
110 |
highpH_TMEVA | 0.794000 | 0.0659 |
| Title | Cluster Plot | Dendrogram | e-value | e-value | e-value | Condition | Condition FDR | Condition Difference |
|---|---|---|---|---|---|---|---|---|
| Thaps_hclust_0083 |
 |
 |
0.0039 |
6.3 |
14 |
exponential_vs_stationary_24highlight | 0.793000 | 0.0348 |
| Title | Cluster Plot | Dendrogram | e-value | e-value | e-value | Condition | Condition FDR | Condition Difference |
|---|---|---|---|---|---|---|---|---|
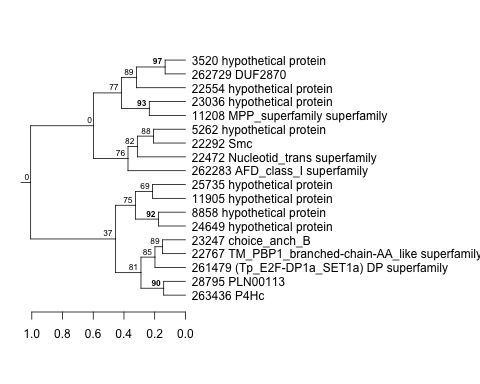
| Thaps_hclust_0421 |
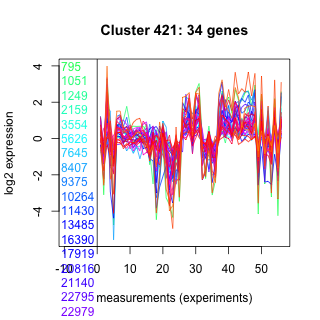 |
 |
0.0000074 |
0.00013 |
0.34 |
co2_elevated_expo_arrays | 0.793000 | 0.0777 |
| Title | Cluster Plot | Dendrogram | e-value | e-value | e-value | Condition | Condition FDR | Condition Difference |
|---|---|---|---|---|---|---|---|---|
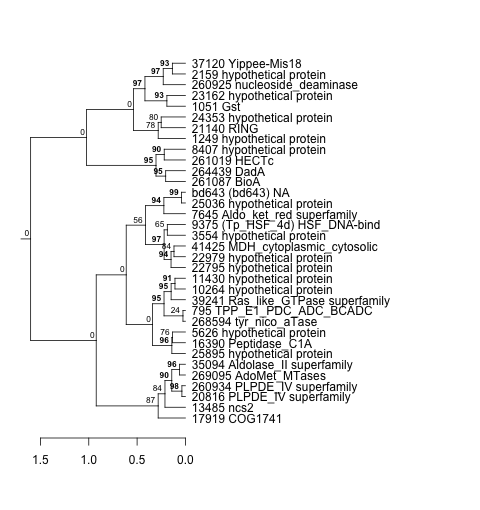
| Thaps_hclust_0008 |
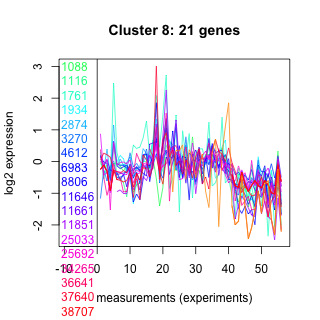 |
 |
0.000000000000034 |
0.0000000000037 |
0.0000000000018 |
highlight_arrays | 0.792000 | -0.0487 |
| Title | Cluster Plot | Dendrogram | e-value | e-value | e-value | Condition | Condition FDR | Condition Difference |
|---|---|---|---|---|---|---|---|---|
| Thaps_hclust_0002 |
 |
 |
0.00000029 |
0.000000009 |
0.000055 |
diel_exponential_vs_stationary | 0.792000 | -0.0607 |
| Title | Cluster Plot | Dendrogram | e-value | e-value | e-value | Condition | Condition FDR | Condition Difference |
|---|---|---|---|---|---|---|---|---|
| Thaps_hclust_0333 |
 |
 |
0.00062 |
4 |
17 |
lowtemp_TMEVA | 0.792000 | -0.0706 |
| Title | Cluster Plot | Dendrogram | e-value | e-value | e-value | Condition | Condition FDR | Condition Difference |
|---|---|---|---|---|---|---|---|---|
| Thaps_hclust_0369 |
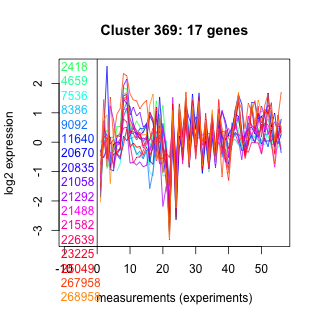 |
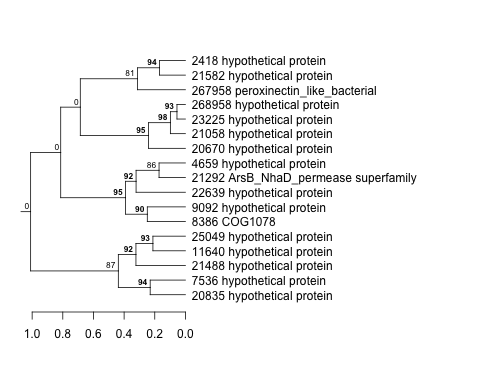 |
0.34 |
2.4 |
5 |
exponential_vs_stationary_24light | 0.791000 | 0.116 |
| Title | Cluster Plot | Dendrogram | e-value | e-value | e-value | Condition | Condition FDR | Condition Difference |
|---|---|---|---|---|---|---|---|---|
| Thaps_hclust_0379 |
 |
 |
0.00013 |
0.012 |
0.26 |
lowFe_KTKB_Day3 | 0.791000 | 0.0777 |
| Title | Cluster Plot | Dendrogram | e-value | e-value | e-value | Condition | Condition FDR | Condition Difference |
|---|---|---|---|---|---|---|---|---|
| Thaps_hclust_0194 |
 |
 |
0.27 |
0.6 |
1.5 |
highlight_arrays | 0.790000 | -0.0529 |
| Title | Cluster Plot | Dendrogram | e-value | e-value | e-value | Condition | Condition FDR | Condition Difference |
|---|---|---|---|---|---|---|---|---|
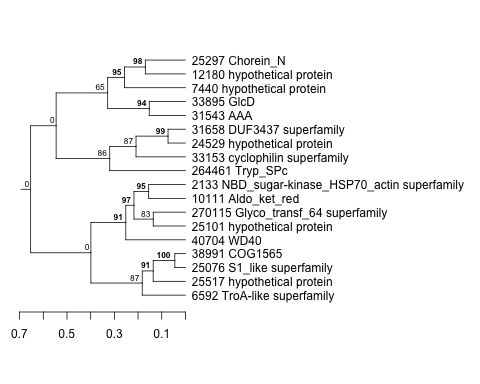
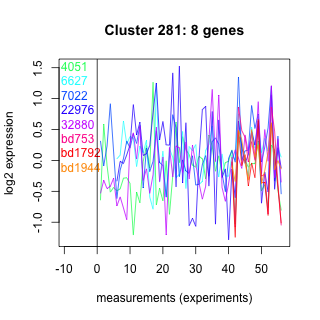
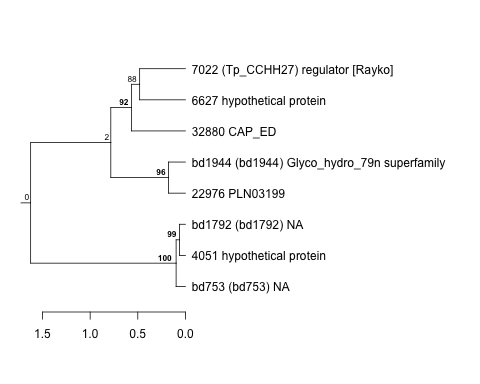
| Thaps_hclust_0281 |
 |
 |
0.0000064 |
0.00064 |
0.03 |
highlight_arrays | 0.790000 | 0.0739 |
| Title | Cluster Plot | Dendrogram | e-value | e-value | e-value | Condition | Condition FDR | Condition Difference |
|---|---|---|---|---|---|---|---|---|
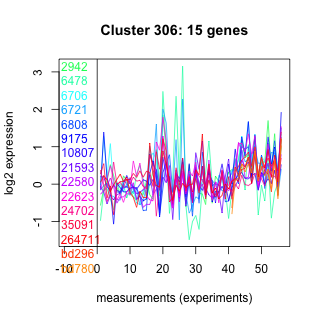
| Thaps_hclust_0306 |
 |
 |
0.001 |
0.26 |
5.3 |
highlight_arrays | 0.790000 | 0.0557 |
| Title | Cluster Plot | Dendrogram | e-value | e-value | e-value | Condition | Condition FDR | Condition Difference |
|---|---|---|---|---|---|---|---|---|
| Thaps_hclust_0457 |
 |
 |
0.0000081 |
0.1 |
0.53 |
exponential_vs_stationary_24light | 0.789000 | 0.13 |
| Title | Cluster Plot | Dendrogram | e-value | e-value | e-value | Condition | Condition FDR | Condition Difference |
|---|---|---|---|---|---|---|---|---|
| Thaps_hclust_0298 |
 |
 |
0.035 |
0.58 |
41 |
lowN_TMEVA | 0.789000 | 0.114 |
| Thaps_hclust_0298 |
|
|
0.035 |
0.58 |
41 |
exponential_vs_stationary_24light | 0.787000 | 0.144 |
| Title | Cluster Plot | Dendrogram | e-value | e-value | e-value | Condition | Condition FDR | Condition Difference |
|---|---|---|---|---|---|---|---|---|
| Thaps_hclust_0006 |
 |
 |
0.0000000000025 |
0.000000092 |
0.000086 |
lowN_TMEVA | 0.789000 | -0.0966 |
| Title | Cluster Plot | Dendrogram | e-value | e-value | e-value | Condition | Condition FDR | Condition Difference |
|---|---|---|---|---|---|---|---|---|
| Thaps_hclust_0456 |
 |
 |
0.0000000043 |
0.047 |
6.5 |
lowN_TMEVA | 0.789000 | -0.101 |
| Title | Cluster Plot | Dendrogram | e-value | e-value | e-value | Condition | Condition FDR | Condition Difference |
|---|---|---|---|---|---|---|---|---|
| Thaps_hclust_0262 |
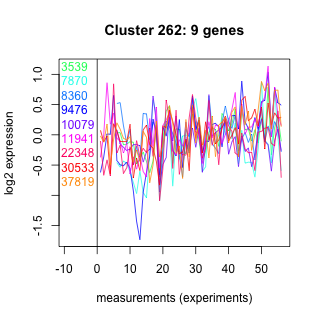 |
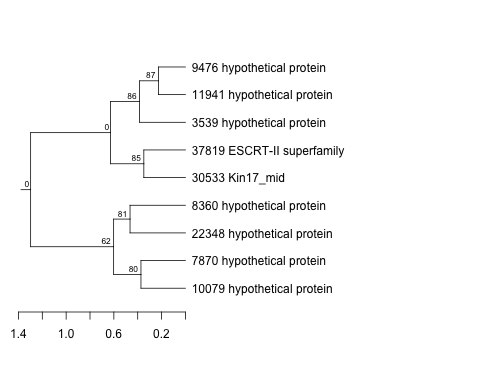 |
12 |
130 |
130 |
lowN_TMEVA | 0.789000 | 0.123 |
| Title | Cluster Plot | Dendrogram | e-value | e-value | e-value | Condition | Condition FDR | Condition Difference |
|---|---|---|---|---|---|---|---|---|
| Thaps_hclust_0314 |
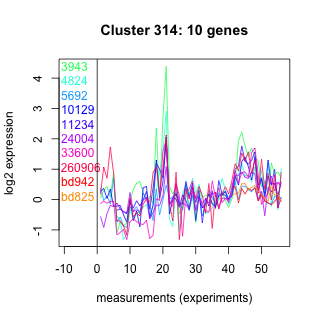 |
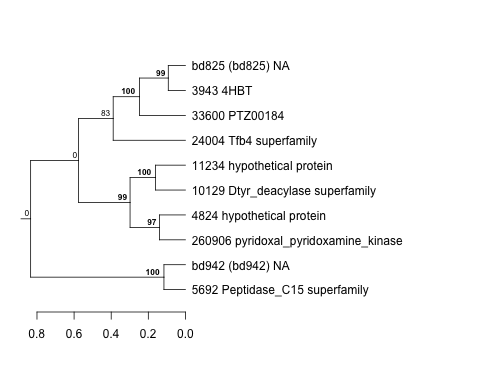 |
0.052 |
1.9 |
8.5 |
lowN_TMEVA | 0.789000 | 0.115 |
| Thaps_hclust_0314 |
|
|
0.052 |
1.9 |
8.5 |
lowFe_TMEVA | 0.788000 | 0.123 |
| Title | Cluster Plot | Dendrogram | e-value | e-value | e-value | Condition | Condition FDR | Condition Difference |
|---|---|---|---|---|---|---|---|---|
| Thaps_hclust_0452 |
 |
 |
84 |
200 |
220 |
exponential_vs_stationary_24light | 0.789000 | -0.121 |
| Title | Cluster Plot | Dendrogram | e-value | e-value | e-value | Condition | Condition FDR | Condition Difference |
|---|---|---|---|---|---|---|---|---|
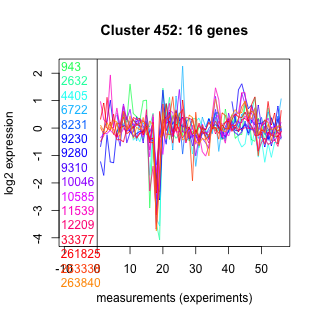
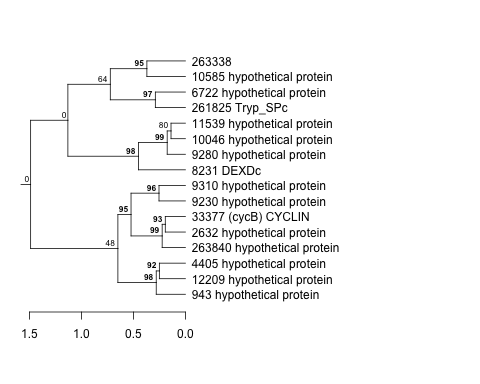
| Thaps_hclust_0445 |
 |
 |
0.000046 |
6.9 |
33 |
lowN_TMEVA | 0.789000 | -0.105 |
| Title | Cluster Plot | Dendrogram | e-value | e-value | e-value | Condition | Condition FDR | Condition Difference |
|---|---|---|---|---|---|---|---|---|
| Thaps_hclust_0338 |
 |
 |
0.0000012 |
0.0000014 |
0.000012 |
lowN_TMEVA | 0.789000 | -0.0989 |
| Title | Cluster Plot | Dendrogram | e-value | e-value | e-value | Condition | Condition FDR | Condition Difference |
|---|---|---|---|---|---|---|---|---|
| Thaps_hclust_0302 |
 |
 |
0.000000015 |
0.00000024 |
0.00000000039 |
lowN_TMEVA | 0.789000 | 0.0956 |
| Title | Cluster Plot | Dendrogram | e-value | e-value | e-value | Condition | Condition FDR | Condition Difference |
|---|---|---|---|---|---|---|---|---|
| Thaps_hclust_0405 |
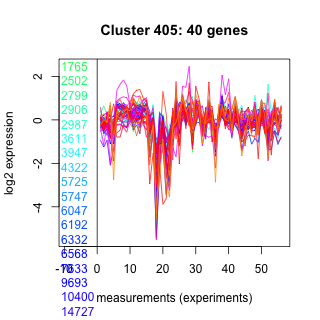 |
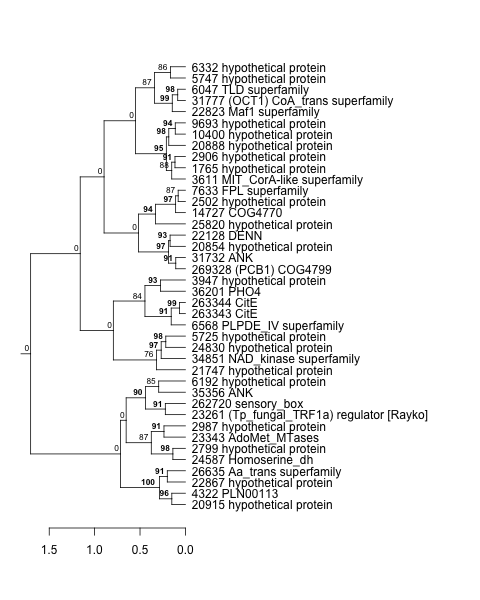 |
0.00000000036 |
0.0000000063 |
0.005 |
highlight_arrays | 0.788000 | 0.0373 |
| Title | Cluster Plot | Dendrogram | e-value | e-value | e-value | Condition | Condition FDR | Condition Difference |
|---|---|---|---|---|---|---|---|---|
| Thaps_hclust_0297 |
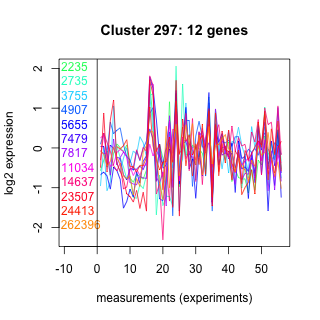 |
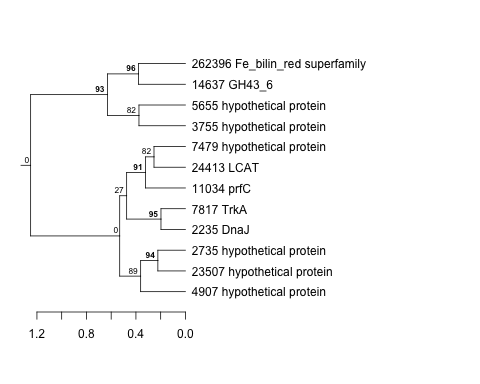 |
0.018 |
2.5 |
24 |
lowSi_TMEVA | 0.788000 | -0.274 |
| Title | Cluster Plot | Dendrogram | e-value | e-value | e-value | Condition | Condition FDR | Condition Difference |
|---|---|---|---|---|---|---|---|---|
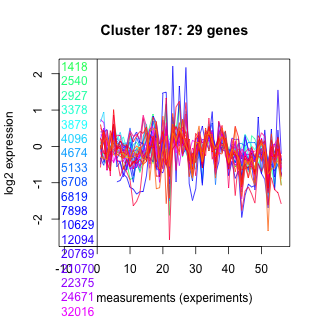
| Thaps_hclust_0187 |
 |
 |
0.000000024 |
0.034 |
0.66 |
highlight_arrays | 0.788000 | -0.0448 |
| Title | Cluster Plot | Dendrogram | e-value | e-value | e-value | Condition | Condition FDR | Condition Difference |
|---|---|---|---|---|---|---|---|---|
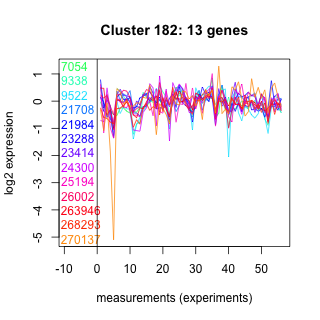
| Thaps_hclust_0182 |
 |
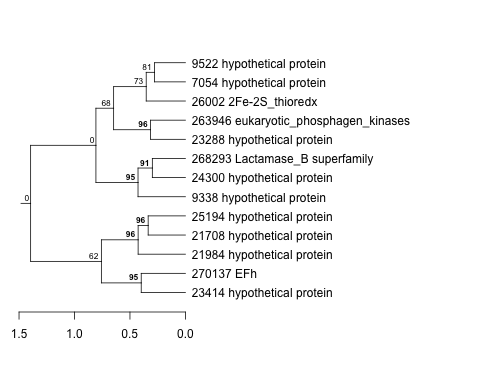 |
0.13 |
130 |
0.14 |
lowN_TMEVA | 0.788000 | -0.114 |
| Thaps_hclust_0182 |
|
|
0.13 |
130 |
0.14 |
lowFe_KTKB_Day5 | 0.787000 | 0.0746 |
| Title | Cluster Plot | Dendrogram | e-value | e-value | e-value | Condition | Condition FDR | Condition Difference |
|---|---|---|---|---|---|---|---|---|
| Thaps_hclust_0307 |
 |
 |
46 |
50 |
580 |
lowFe_KTKB_Day5 | 0.787000 | 0.0945 |
| Title | Cluster Plot | Dendrogram | e-value | e-value | e-value | Condition | Condition FDR | Condition Difference |
|---|---|---|---|---|---|---|---|---|
| Thaps_hclust_0358 |
 |
 |
0.18 |
390 |
1700 |
diel_light_vs_dark | 0.787000 | -0.0811 |
| Title | Cluster Plot | Dendrogram | e-value | e-value | e-value | Condition | Condition FDR | Condition Difference |
|---|---|---|---|---|---|---|---|---|
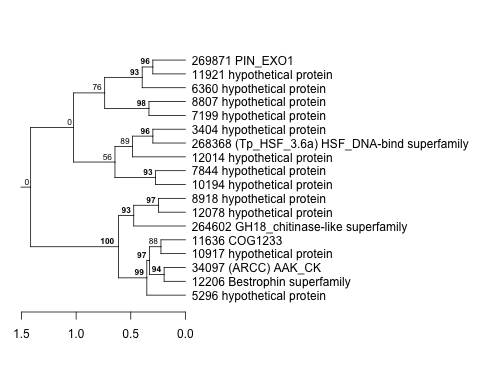
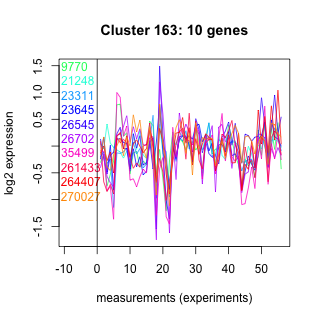
| Thaps_hclust_0163 |
 |
 |
2.5 |
63 |
210 |
diel_light_vs_dark | 0.787000 | 0.103 |
| Title | Cluster Plot | Dendrogram | e-value | e-value | e-value | Condition | Condition FDR | Condition Difference |
|---|---|---|---|---|---|---|---|---|
| Thaps_hclust_0162 |
 |
 |
0.032 |
3.2 |
58 |
lowFe_KTKB_Day5 | 0.787000 | -0.0697 |
| Title | Cluster Plot | Dendrogram | e-value | e-value | e-value | Condition | Condition FDR | Condition Difference |
|---|---|---|---|---|---|---|---|---|
| Thaps_hclust_0444 |
 |
 |
14 |
140 |
1.6 |
lowFe_KTKB_Day5 | 0.787000 | 0.0637 |
| Title | Cluster Plot | Dendrogram | e-value | e-value | e-value | Condition | Condition FDR | Condition Difference |
|---|---|---|---|---|---|---|---|---|
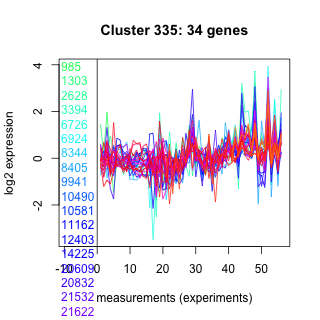
| Thaps_hclust_0335 |
 |
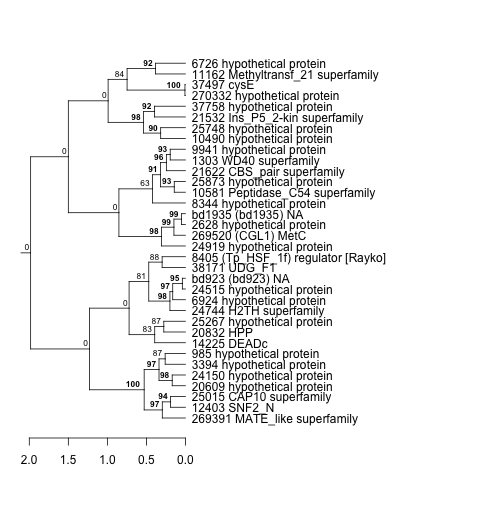 |
0.0000000032 |
0.000001 |
0.019 |
diel_light_vs_dark | 0.787000 | -0.0591 |
| Title | Cluster Plot | Dendrogram | e-value | e-value | e-value | Condition | Condition FDR | Condition Difference |
|---|---|---|---|---|---|---|---|---|
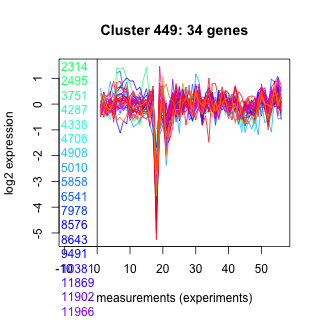
| Thaps_hclust_0449 |
 |
 |
0.0000000011 |
0.012 |
3.5 |
exponential_vs_stationary_24light | 0.787000 | 0.0992 |
| Title | Cluster Plot | Dendrogram | e-value | e-value | e-value | Condition | Condition FDR | Condition Difference |
|---|---|---|---|---|---|---|---|---|
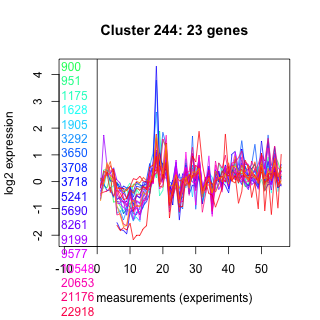
| Thaps_hclust_0244 |
 |
 |
0.000000057 |
0.0001 |
4.1 |
diel_light_vs_dark | 0.787000 | 0.0712 |
| Title | Cluster Plot | Dendrogram | e-value | e-value | e-value | Condition | Condition FDR | Condition Difference |
|---|---|---|---|---|---|---|---|---|
| Thaps_hclust_0191 |
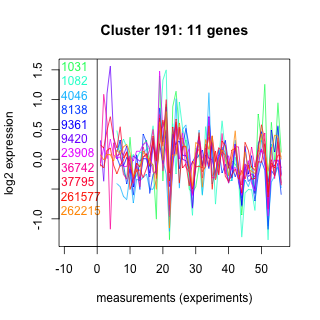 |
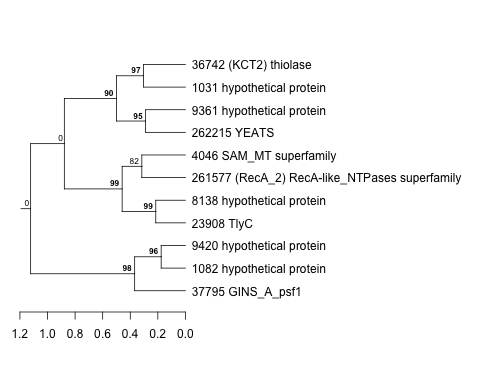 |
1.5 |
3.5 |
44 |
diel_light_vs_dark | 0.787000 | 0.101 |
| Title | Cluster Plot | Dendrogram | e-value | e-value | e-value | Condition | Condition FDR | Condition Difference |
|---|---|---|---|---|---|---|---|---|
| Thaps_hclust_0349 |
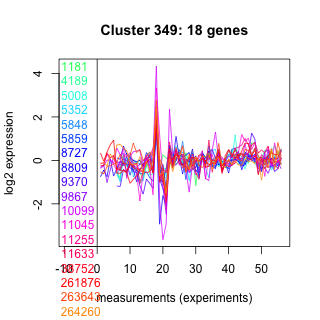 |
 |
360 |
5.4 |
67 |
diel_light_vs_dark | 0.787000 | -0.0823 |