Hierarchical Clusters
Displaying 1601 - 1700 of 7500
| Title | Cluster Plot | Dendrogram | e-value | e-value | e-value | Condition | Condition FDR | Condition Difference |
|---|---|---|---|---|---|---|---|---|
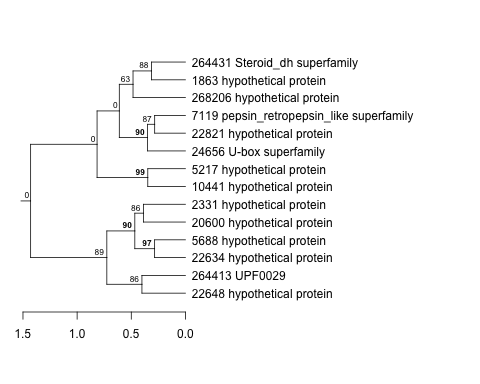
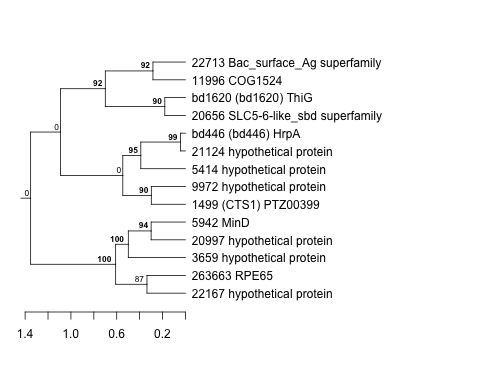
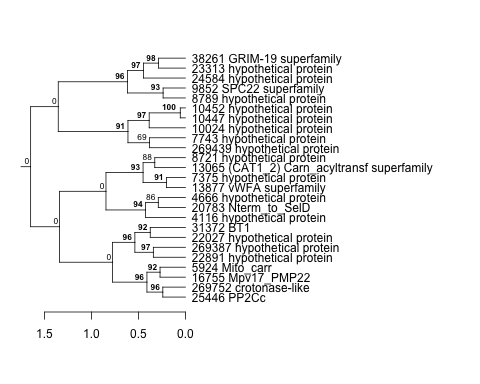
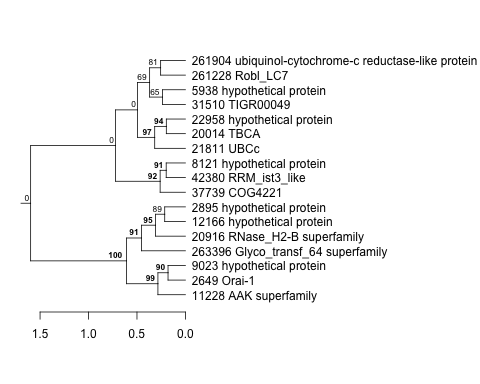
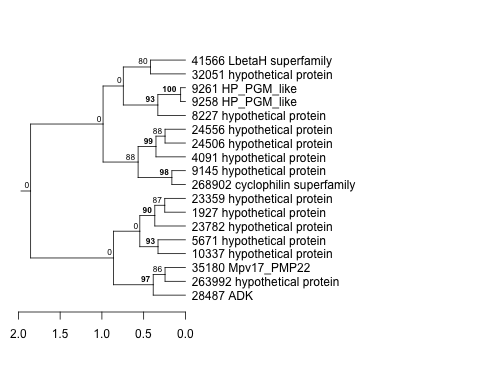
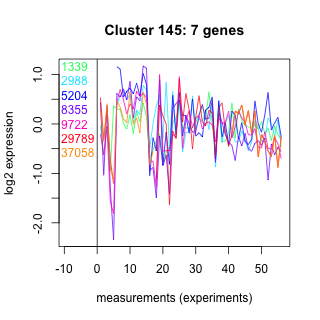
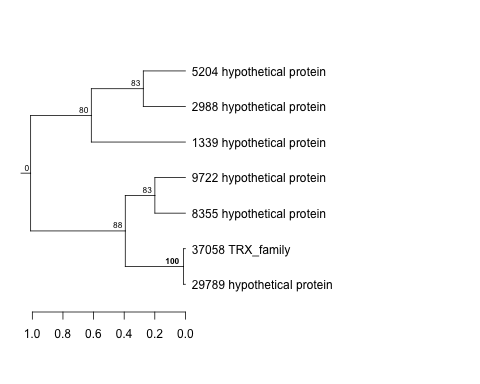
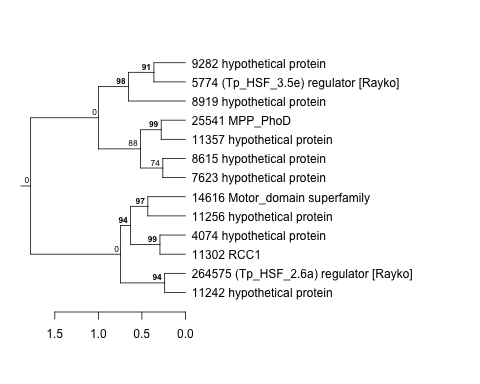
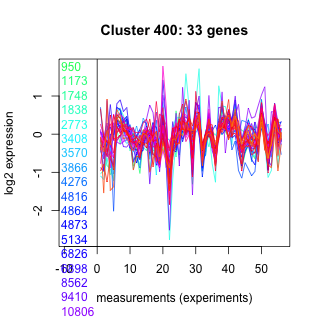
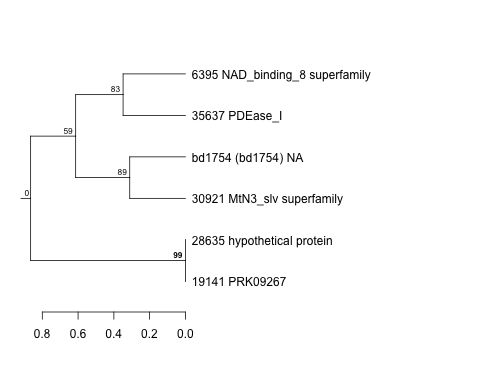
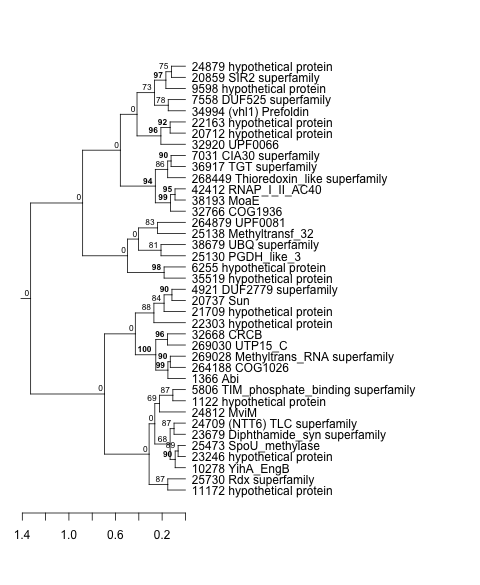
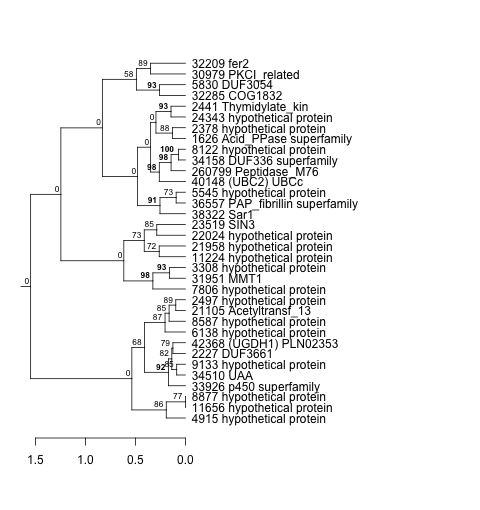
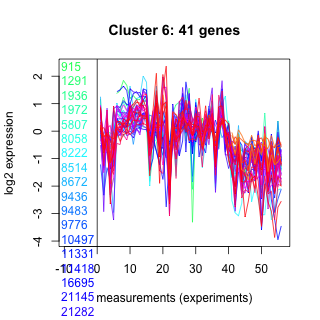
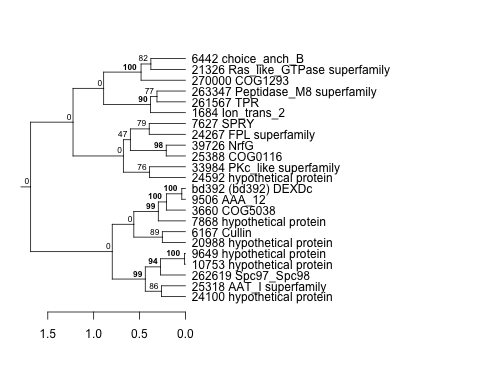
| Thaps_hclust_0154 |
 |
 |
0.00015 |
0.0049 |
0.29 |
exponential_vs_stationary_24highlight | 0.013600 | 0.241 |
| Title | Cluster Plot | Dendrogram | e-value | e-value | e-value | Condition | Condition FDR | Condition Difference |
|---|---|---|---|---|---|---|---|---|
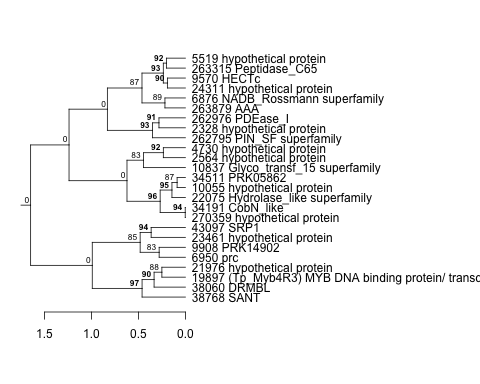
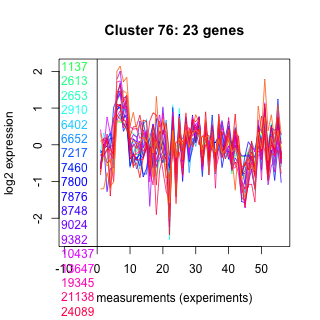
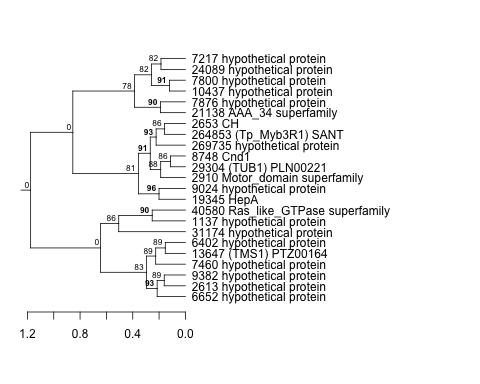
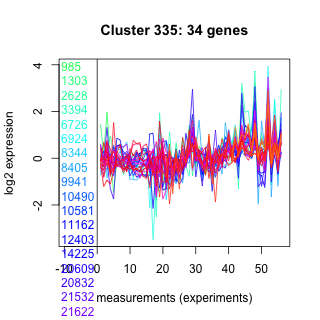
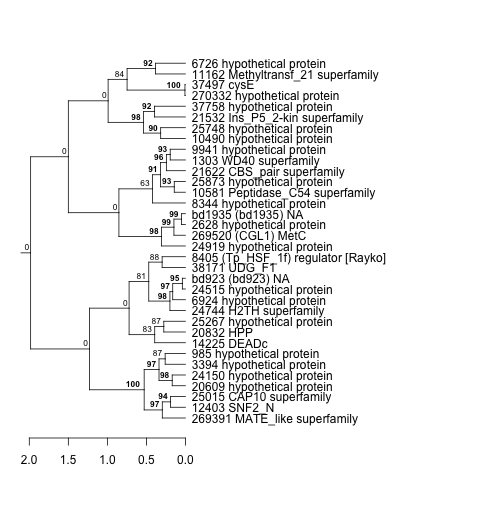
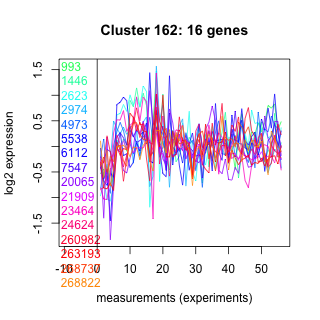
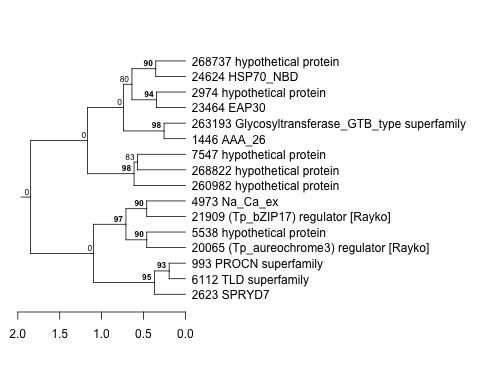
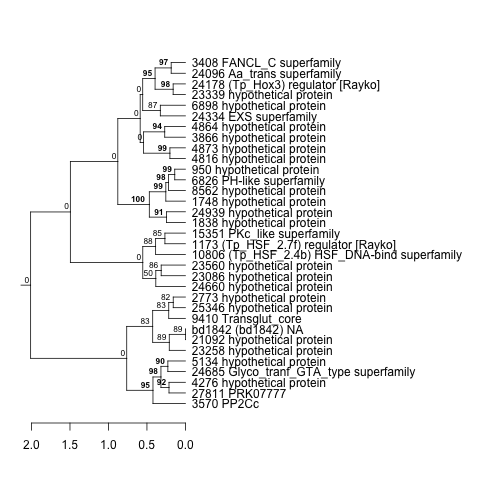
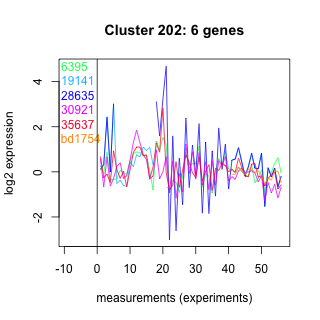
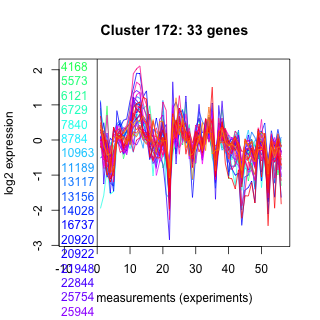
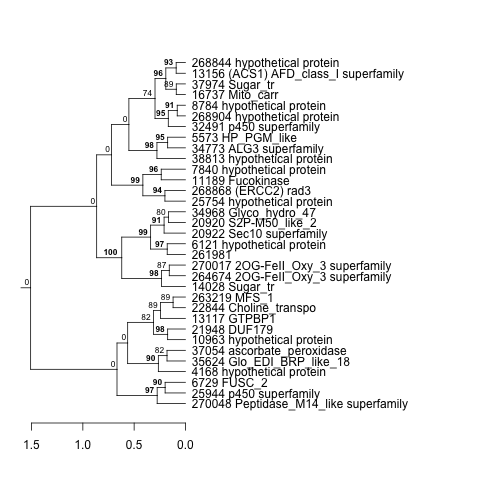
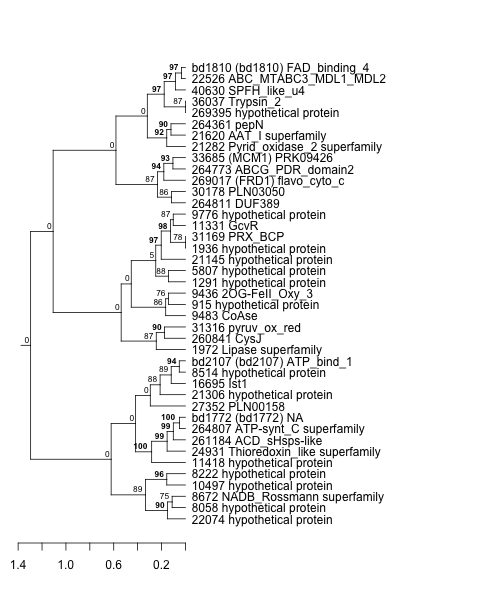
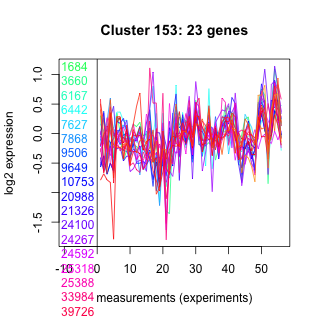
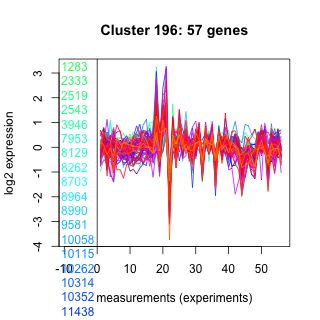
| Thaps_hclust_0144 |
 |
 |
0.000000001 |
0.0000000019 |
0.00000019 |
diel_light_vs_dark | 0.013600 | 0.319 |
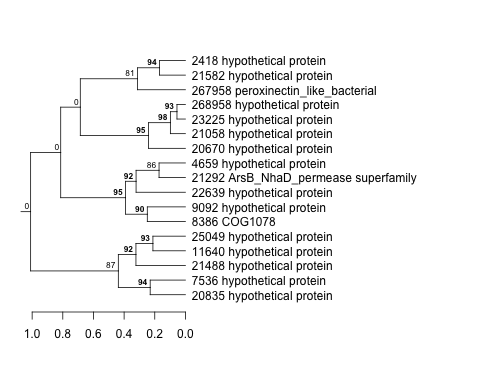
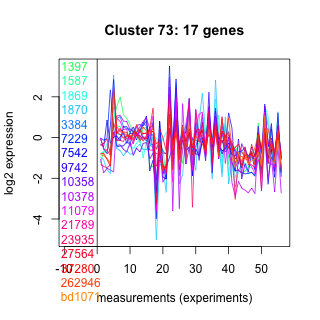
| Thaps_hclust_0144 |
|
|
0.000000001 |
0.0000000019 |
0.00000019 |
co2_elevated_stat_arrays | 0.014400 | -0.367 |
| Title | Cluster Plot | Dendrogram | e-value | e-value | e-value | Condition | Condition FDR | Condition Difference |
|---|---|---|---|---|---|---|---|---|
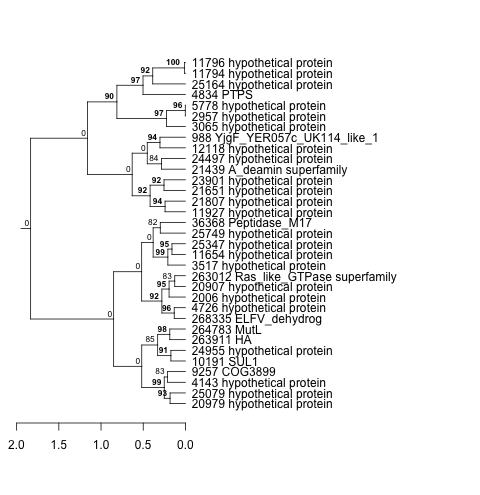
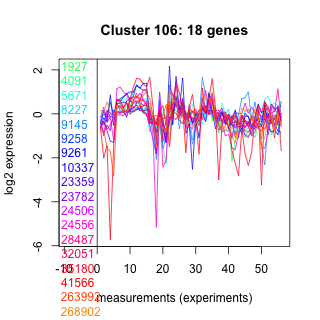
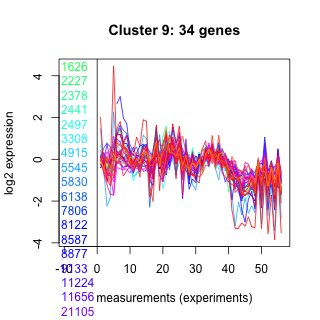
| Thaps_hclust_0058 |
 |
 |
0.000000037 |
0.000000014 |
0.00000069 |
lowN_TMEVA | 0.013600 | -0.527 |
| Title | Cluster Plot | Dendrogram | e-value | e-value | e-value | Condition | Condition FDR | Condition Difference |
|---|---|---|---|---|---|---|---|---|
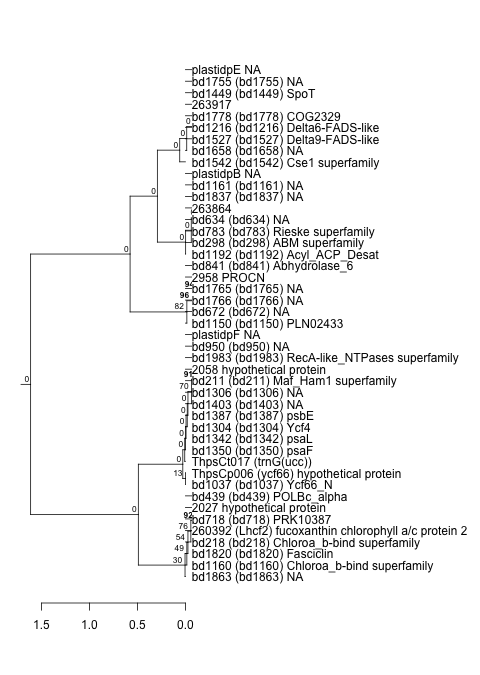
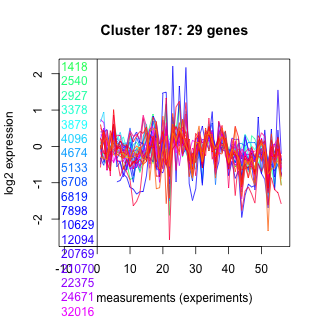
| Thaps_hclust_0187 |
 |
 |
0.000000024 |
0.034 |
0.66 |
co2_elevated_stat_arrays | 0.013700 | -0.42 |
| Title | Cluster Plot | Dendrogram | e-value | e-value | e-value | Condition | Condition FDR | Condition Difference |
|---|---|---|---|---|---|---|---|---|
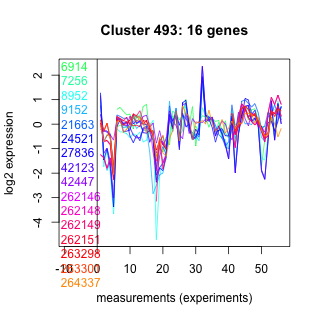
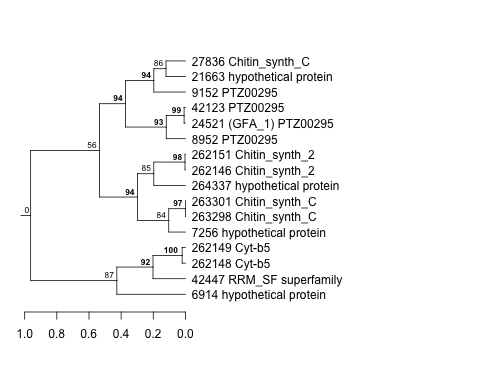
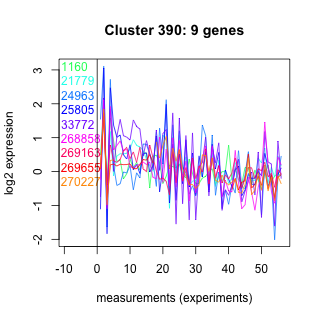
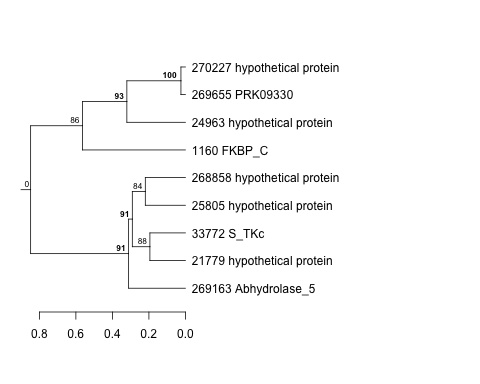
| Thaps_hclust_0493 |
 |
 |
0.00000036 |
0.0000009 |
0.000056 |
lowFe_KTKB_Day5 | 0.013700 | -0.565 |
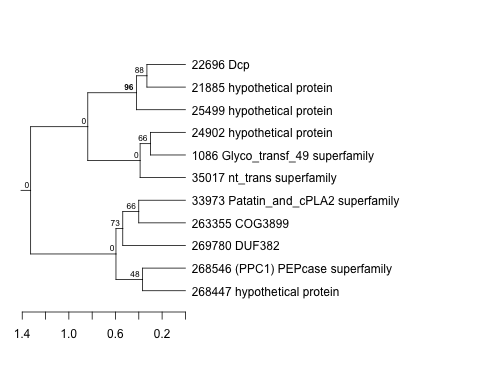
| Title | Cluster Plot | Dendrogram | e-value | e-value | e-value | Condition | Condition FDR | Condition Difference |
|---|---|---|---|---|---|---|---|---|
| Thaps_hclust_0152 |
 |
 |
0.00015 |
0.00023 |
0.031 |
BaP | 0.013800 | -0.816 |
| Thaps_hclust_0152 |
|
|
0.00015 |
0.00023 |
0.031 |
lowtemp_TMEVA | 0.017400 | -0.993 |
| Title | Cluster Plot | Dendrogram | e-value | e-value | e-value | Condition | Condition FDR | Condition Difference |
|---|---|---|---|---|---|---|---|---|
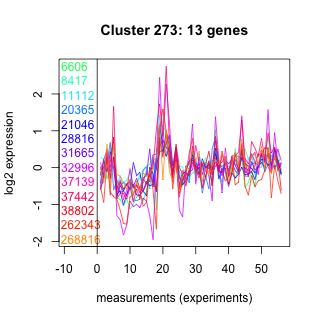
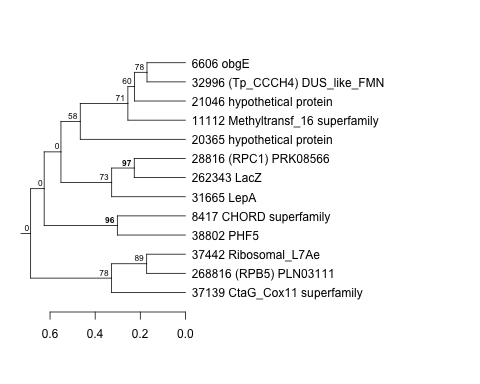
| Thaps_hclust_0273 |
 |
 |
0.052 |
0.27 |
12 |
BaP | 0.013800 | 0.658 |
| Title | Cluster Plot | Dendrogram | e-value | e-value | e-value | Condition | Condition FDR | Condition Difference |
|---|---|---|---|---|---|---|---|---|
| Thaps_hclust_0007 |
 |
 |
0.0000000001 |
0.0000000097 |
0.000027 |
lowFe_KTKB_Day3 | 0.013800 | -0.45 |
| Title | Cluster Plot | Dendrogram | e-value | e-value | e-value | Condition | Condition FDR | Condition Difference |
|---|---|---|---|---|---|---|---|---|
| Thaps_hclust_0156 |
 |
 |
0.00054 |
0.00071 |
0.0013 |
exponential_vs_stationary_24light | 0.013800 | 0.632 |
| Title | Cluster Plot | Dendrogram | e-value | e-value | e-value | Condition | Condition FDR | Condition Difference |
|---|---|---|---|---|---|---|---|---|
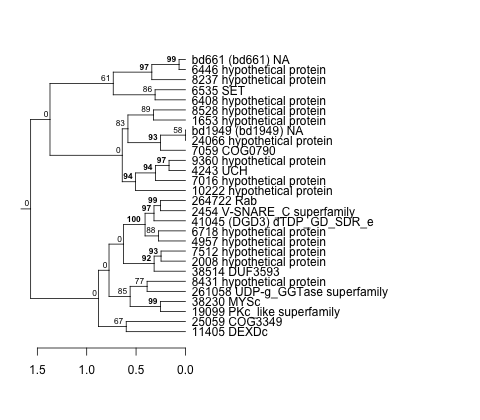
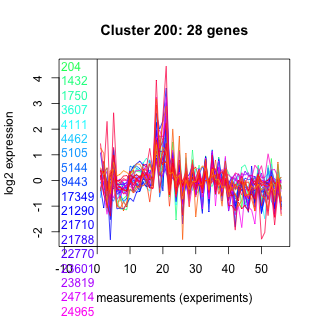
| Thaps_hclust_0200 |
 |
 |
0.0000013 |
0.00018 |
0.000045 |
exponential_vs_stationary_24highlight | 0.013800 | 0.213 |
| Title | Cluster Plot | Dendrogram | e-value | e-value | e-value | Condition | Condition FDR | Condition Difference |
|---|---|---|---|---|---|---|---|---|
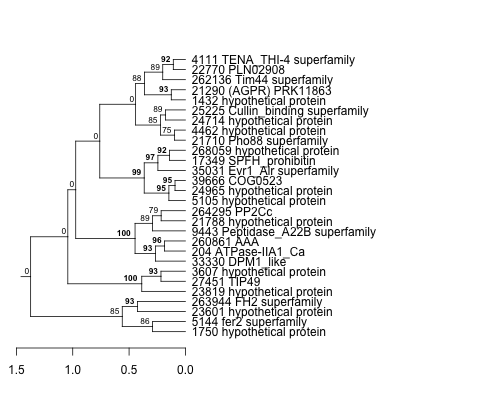
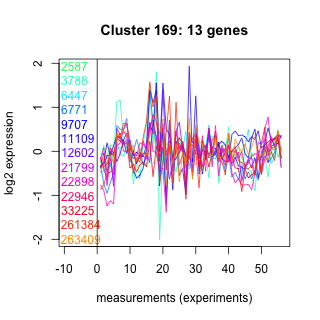
| Thaps_hclust_0169 |
 |
 |
2.2 |
23 |
3.9 |
lowFe_KTKB_Day3 | 0.013800 | 0.694 |
| Title | Cluster Plot | Dendrogram | e-value | e-value | e-value | Condition | Condition FDR | Condition Difference |
|---|---|---|---|---|---|---|---|---|
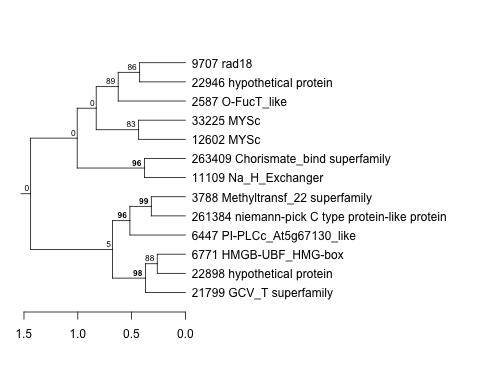
| Thaps_hclust_0101 |
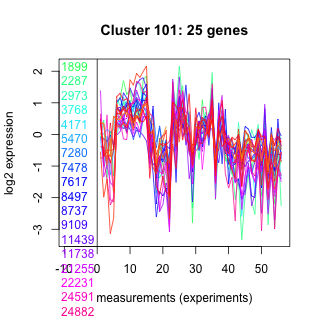 |
 |
0.000000016 |
0.0000038 |
0.014 |
diel_light_vs_dark | 0.013900 | 0.422 |
| Title | Cluster Plot | Dendrogram | e-value | e-value | e-value | Condition | Condition FDR | Condition Difference |
|---|---|---|---|---|---|---|---|---|
| Thaps_hclust_0120 |
 |
 |
0.00000098 |
0.000000076 |
0.001 |
BaP | 0.013900 | 0.493 |
| Title | Cluster Plot | Dendrogram | e-value | e-value | e-value | Condition | Condition FDR | Condition Difference |
|---|---|---|---|---|---|---|---|---|
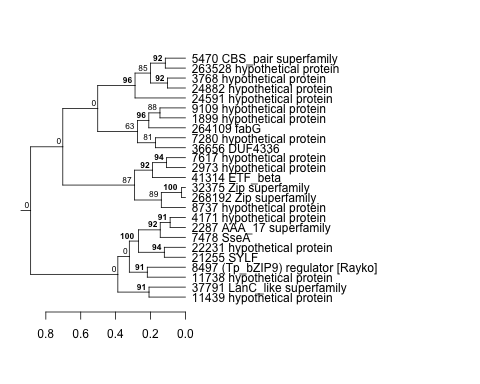
| Thaps_hclust_0133 |
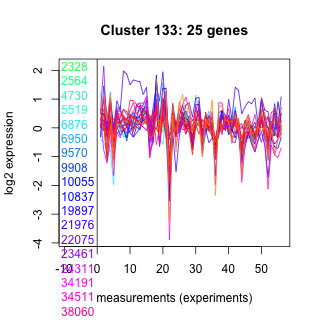 |
 |
0.95 |
2.2 |
2.4 |
diel_exponential_vs_stationary | 0.014100 | -0.375 |
| Title | Cluster Plot | Dendrogram | e-value | e-value | e-value | Condition | Condition FDR | Condition Difference |
|---|---|---|---|---|---|---|---|---|
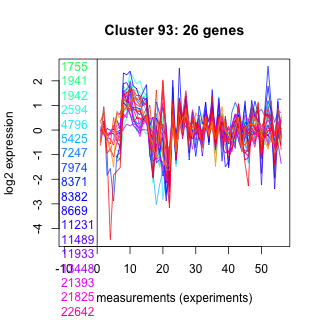
| Thaps_hclust_0093 |
 |
 |
0.0000082 |
0.022 |
0.0012 |
exponential_vs_stationary_24highlight | 0.014100 | 0.22 |
| Thaps_hclust_0093 |
|
|
0.0000082 |
0.022 |
0.0012 |
lowSi_TMEVA | 0.014200 | -0.812 |
| Title | Cluster Plot | Dendrogram | e-value | e-value | e-value | Condition | Condition FDR | Condition Difference |
|---|---|---|---|---|---|---|---|---|
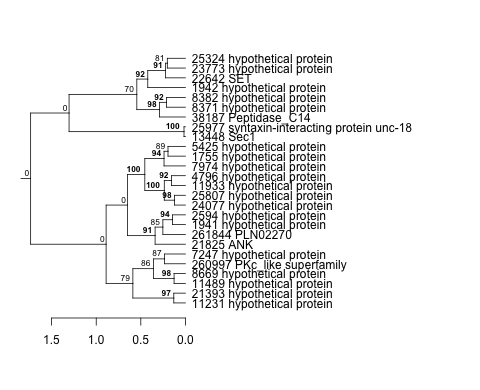
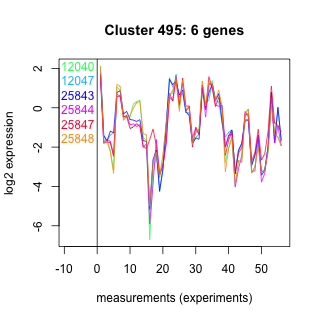
| Thaps_hclust_0495 |
 |
 |
0.0000000031 |
0.00000049 |
0.0000038 |
lowSi_TMEVA | 0.014200 | -1.75 |
| Title | Cluster Plot | Dendrogram | e-value | e-value | e-value | Condition | Condition FDR | Condition Difference |
|---|---|---|---|---|---|---|---|---|
| Thaps_hclust_0025 |
 |
 |
0.14 |
0.45 |
4.6 |
lowN_TMEVA | 0.014200 | -0.948 |
| Title | Cluster Plot | Dendrogram | e-value | e-value | e-value | Condition | Condition FDR | Condition Difference |
|---|---|---|---|---|---|---|---|---|
| Thaps_hclust_0116 |
 |
 |
0.74 |
8.1 |
4.9 |
diel_exponential_vs_stationary | 0.014600 | -0.483 |
| Title | Cluster Plot | Dendrogram | e-value | e-value | e-value | Condition | Condition FDR | Condition Difference |
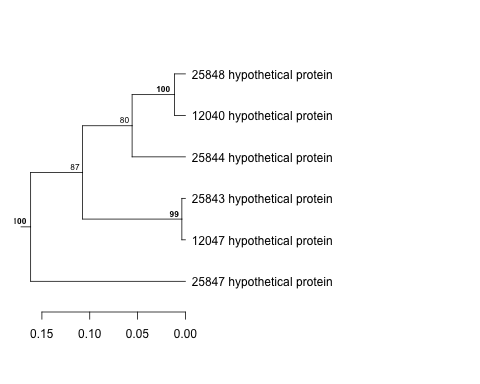
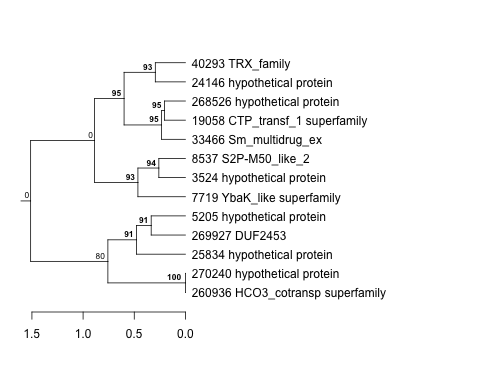
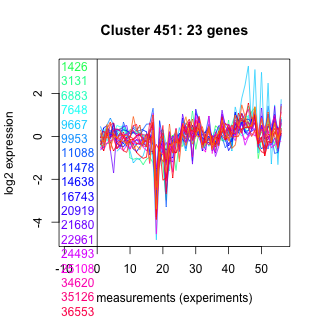
|---|---|---|---|---|---|---|---|---|
| Thaps_hclust_0451 |
 |
 |
10 |
0.0026 |
160 |
diel_exponential_vs_stationary | 0.014600 | -0.386 |
| Title | Cluster Plot | Dendrogram | e-value | e-value | e-value | Condition | Condition FDR | Condition Difference |
|---|---|---|---|---|---|---|---|---|
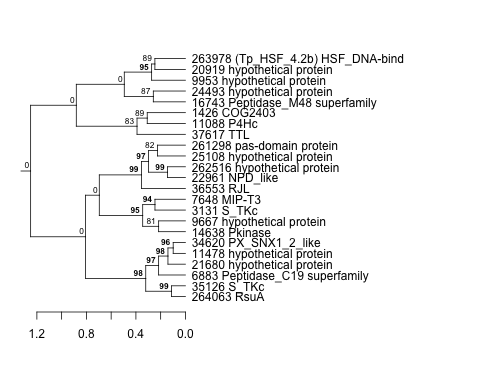
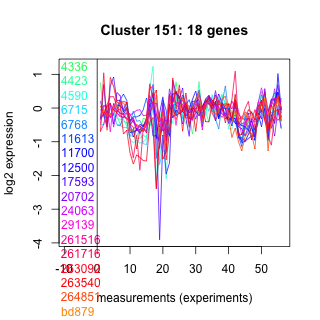
| Thaps_hclust_0151 |
 |
 |
0.015 |
0.13 |
16 |
highlight_arrays | 0.014600 | -0.388 |
| Title | Cluster Plot | Dendrogram | e-value | e-value | e-value | Condition | Condition FDR | Condition Difference |
|---|---|---|---|---|---|---|---|---|
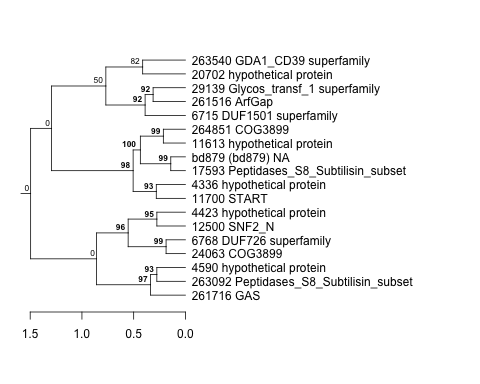
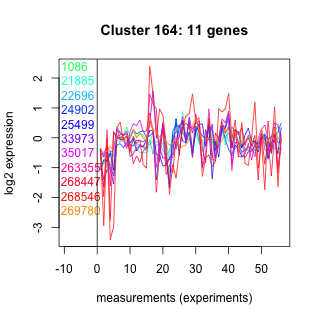
| Thaps_hclust_0164 |
 |
 |
13 |
58 |
65 |
lowSi_TMEVA | 0.014800 | -1.18 |
| Title | Cluster Plot | Dendrogram | e-value | e-value | e-value | Condition | Condition FDR | Condition Difference |
|---|---|---|---|---|---|---|---|---|
| Thaps_hclust_0470 |
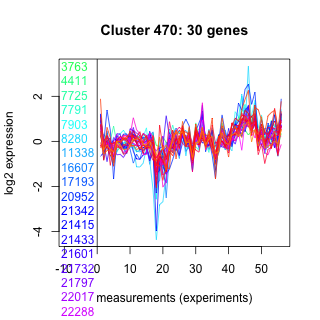 |
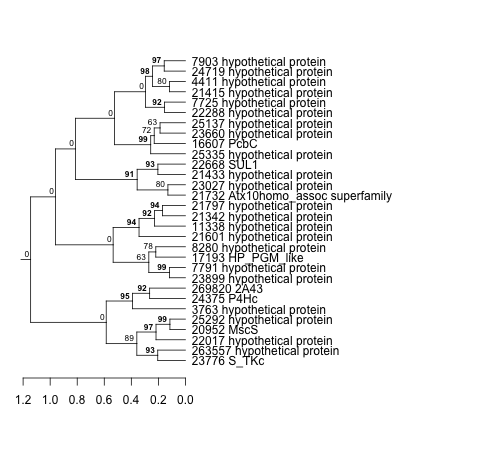 |
0.0000048 |
0.00021 |
0.086 |
lowtemp_TMEVA | 0.014800 | -0.5 |
| Title | Cluster Plot | Dendrogram | e-value | e-value | e-value | Condition | Condition FDR | Condition Difference |
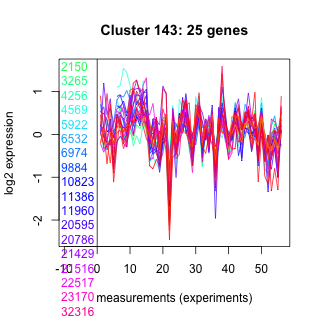
|---|---|---|---|---|---|---|---|---|
| Thaps_hclust_0143 |
 |
 |
0.018 |
0.041 |
0.67 |
highlight_arrays | 0.014800 | 0.337 |
| Title | Cluster Plot | Dendrogram | e-value | e-value | e-value | Condition | Condition FDR | Condition Difference |
|---|---|---|---|---|---|---|---|---|
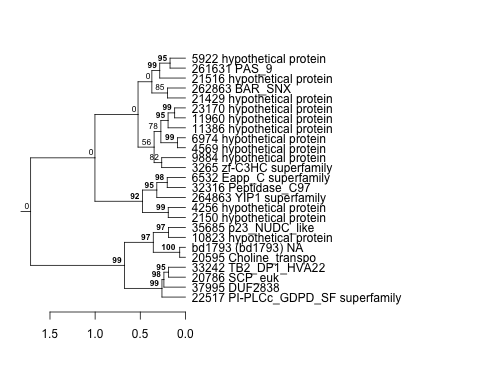
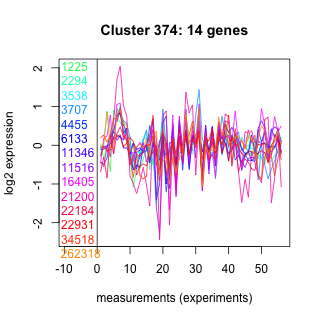
| Thaps_hclust_0374 |
 |
 |
1.4 |
19 |
50 |
diel_exponential_vs_stationary | 0.014900 | -0.502 |
| Title | Cluster Plot | Dendrogram | e-value | e-value | e-value | Condition | Condition FDR | Condition Difference |
|---|---|---|---|---|---|---|---|---|
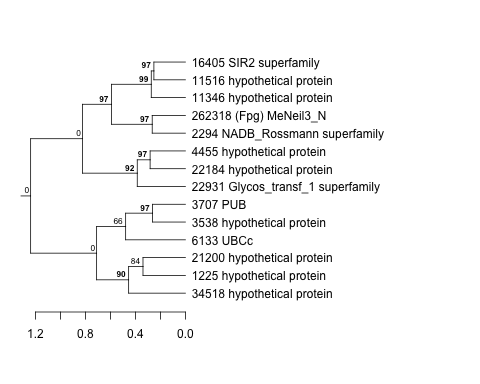
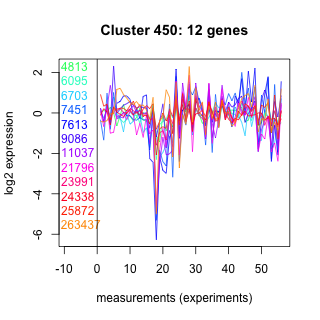
| Thaps_hclust_0450 |
 |
 |
0.00076 |
0.024 |
0.16 |
exponential_vs_stationary_24light | 0.015000 | -0.947 |
| Title | Cluster Plot | Dendrogram | e-value | e-value | e-value | Condition | Condition FDR | Condition Difference |
|---|---|---|---|---|---|---|---|---|
| Thaps_hclust_0338 |
 |
 |
0.0000012 |
0.0000014 |
0.000012 |
lowFe_KTKB_Day5 | 0.015100 | 0.362 |
| Title | Cluster Plot | Dendrogram | e-value | e-value | e-value | Condition | Condition FDR | Condition Difference |
|---|---|---|---|---|---|---|---|---|
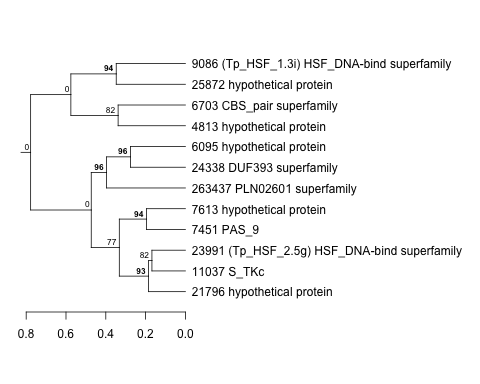
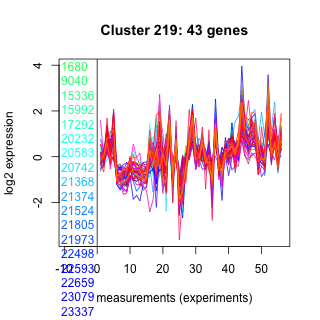
| Thaps_hclust_0219 |
 |
 |
2.8e-16 |
0.0000000055 |
0.012 |
diel_exponential_vs_stationary | 0.015100 | -0.279 |
| Title | Cluster Plot | Dendrogram | e-value | e-value | e-value | Condition | Condition FDR | Condition Difference |
|---|---|---|---|---|---|---|---|---|
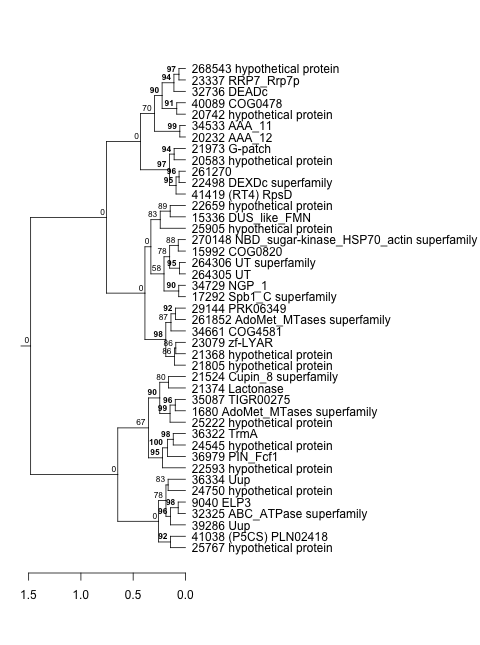
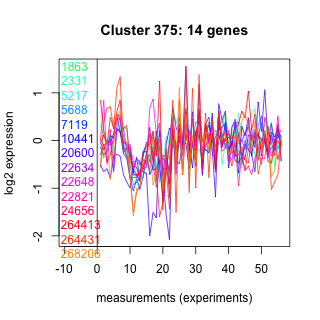
| Thaps_hclust_0375 |
 |
 |
1.8 |
2.9 |
40 |
diel_light_vs_dark | 0.015200 | 0.575 |
| Title | Cluster Plot | Dendrogram | e-value | e-value | e-value | Condition | Condition FDR | Condition Difference |
|---|---|---|---|---|---|---|---|---|
| Thaps_hclust_0029 |
 |
|
9.1e-19 |
4.9e-16 |
0.00000000044 |
lowtemp_TMEVA | 0.015200 | 0.307 |
| Title | Cluster Plot | Dendrogram | e-value | e-value | e-value | Condition | Condition FDR | Condition Difference |
|---|---|---|---|---|---|---|---|---|
| Thaps_hclust_0330 |
 |
 |
0.0000058 |
0.00000085 |
0.000041 |
lowN_TMEVA | 0.015300 | 0.599 |
| Title | Cluster Plot | Dendrogram | e-value | e-value | e-value | Condition | Condition FDR | Condition Difference |
|---|---|---|---|---|---|---|---|---|
| Thaps_hclust_0360 |
 |
 |
0.0000000013 |
0.0000000052 |
0.0000016 |
lowN_TMEVA | 0.015300 | 0.599 |
| Title | Cluster Plot | Dendrogram | e-value | e-value | e-value | Condition | Condition FDR | Condition Difference |
|---|---|---|---|---|---|---|---|---|
| Thaps_hclust_0076 |
 |
 |
0.0047 |
0.13 |
1.2 |
exponential_vs_stationary_24light | 0.015400 | 0.687 |
| Title | Cluster Plot | Dendrogram | e-value | e-value | e-value | Condition | Condition FDR | Condition Difference |
|---|---|---|---|---|---|---|---|---|
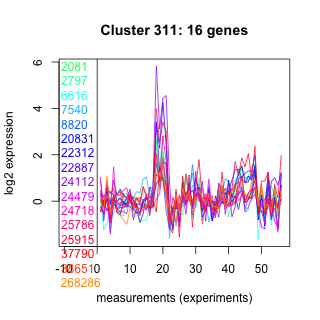
| Thaps_hclust_0311 |
 |
 |
4.1 |
0.64 |
12 |
diel_exponential_vs_stationary | 0.015400 | -0.479 |
| Title | Cluster Plot | Dendrogram | e-value | e-value | e-value | Condition | Condition FDR | Condition Difference |
|---|---|---|---|---|---|---|---|---|
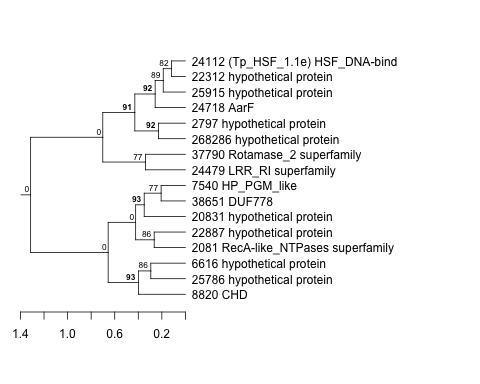
| Thaps_hclust_0476 |
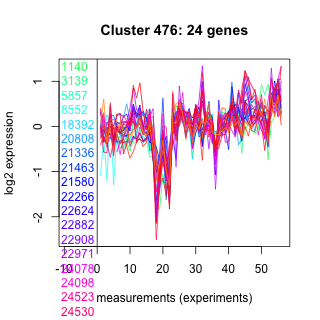 |
 |
0.0015 |
0.56 |
2.4 |
lowFe_KTKB_Day5 | 0.015400 | -0.418 |
| Title | Cluster Plot | Dendrogram | e-value | e-value | e-value | Condition | Condition FDR | Condition Difference |
|---|---|---|---|---|---|---|---|---|
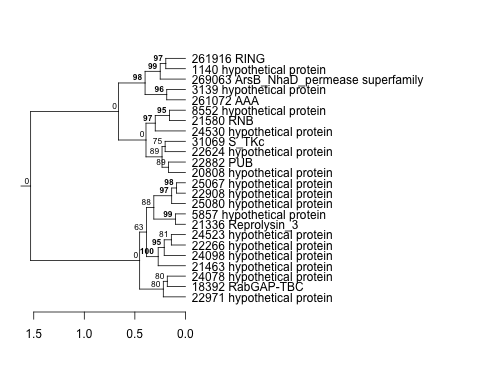
| Thaps_hclust_0068 |
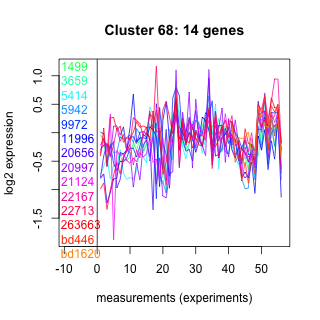 |
 |
0.34 |
36 |
100 |
highpH_TMEVA | 0.015400 | -0.461 |
| Thaps_hclust_0068 |
|
|
0.34 |
36 |
100 |
highlight_arrays | 0.018200 | -0.442 |
| Title | Cluster Plot | Dendrogram | e-value | e-value | e-value | Condition | Condition FDR | Condition Difference |
|---|---|---|---|---|---|---|---|---|
| Thaps_hclust_0209 |
 |
 |
1.2e-16 |
0.00011 |
0.000027 |
lowFe_KTKB_Day5 | 0.015400 | 0.384 |
| Thaps_hclust_0209 |
|
|
1.2e-16 |
0.00011 |
0.000027 |
lowSi_TMEVA | 0.018000 | -0.742 |
| Title | Cluster Plot | Dendrogram | e-value | e-value | e-value | Condition | Condition FDR | Condition Difference |
|---|---|---|---|---|---|---|---|---|
| Thaps_hclust_0456 |
 |
 |
0.0000000043 |
0.047 |
6.5 |
diel_exponential_vs_stationary | 0.015600 | 0.362 |
| Title | Cluster Plot | Dendrogram | e-value | e-value | e-value | Condition | Condition FDR | Condition Difference |
|---|---|---|---|---|---|---|---|---|
| Thaps_hclust_0121 |
 |
 |
0.00021 |
0.77 |
30 |
highpH_TMEVA | 0.015700 | 0.482 |
| Thaps_hclust_0121 |
|
|
0.00021 |
0.77 |
30 |
lowSi_TMEVA | 0.016100 | 1.08 |
| Title | Cluster Plot | Dendrogram | e-value | e-value | e-value | Condition | Condition FDR | Condition Difference |
|---|---|---|---|---|---|---|---|---|
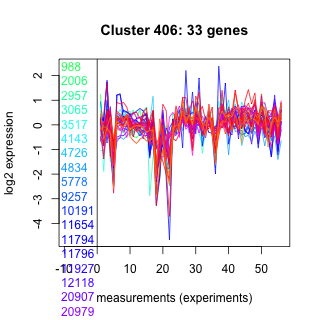
| Thaps_hclust_0406 |
 |
 |
0.000039 |
0.013 |
0.13 |
exponential_vs_stationary_24highlight | 0.015900 | -0.187 |
| Title | Cluster Plot | Dendrogram | e-value | e-value | e-value | Condition | Condition FDR | Condition Difference |
|---|---|---|---|---|---|---|---|---|
| Thaps_hclust_0109 |
 |
 |
17 |
32 |
5.5 |
lowFe_KTKB_Day3 | 0.016000 | 0.718 |
| Title | Cluster Plot | Dendrogram | e-value | e-value | e-value | Condition | Condition FDR | Condition Difference |
|---|---|---|---|---|---|---|---|---|
| Thaps_hclust_0390 |
 |
 |
0.013 |
0.066 |
0.15 |
diel_light_vs_dark | 0.016000 | 0.728 |
| Title | Cluster Plot | Dendrogram | e-value | e-value | e-value | Condition | Condition FDR | Condition Difference |
|---|---|---|---|---|---|---|---|---|
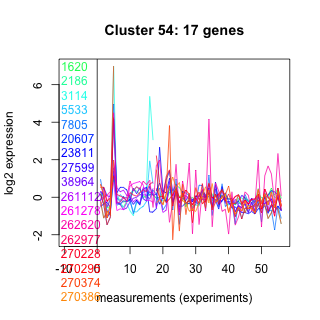
| Thaps_hclust_0054 |
 |
 |
1.6e-17 |
0.0000000000053 |
0.000000000000024 |
diel_light_vs_dark | 0.016000 | -0.509 |
| Title | Cluster Plot | Dendrogram | e-value | e-value | e-value | Condition | Condition FDR | Condition Difference |
|---|---|---|---|---|---|---|---|---|
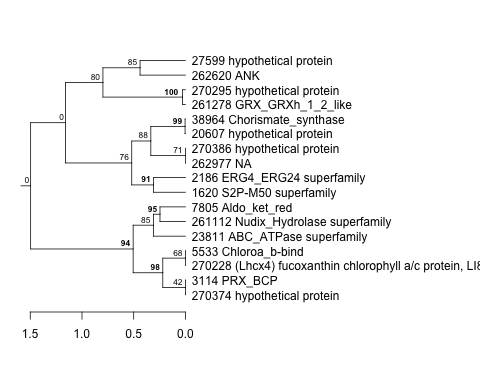
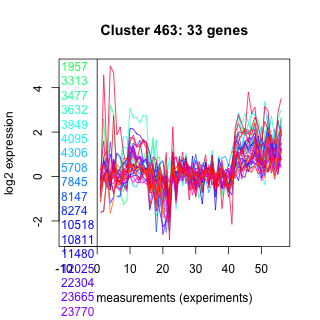
| Thaps_hclust_0463 |
 |
 |
0.0000000063 |
0.000000075 |
0.78 |
lowtemp_TMEVA | 0.016200 | 0.473 |
| Title | Cluster Plot | Dendrogram | e-value | e-value | e-value | Condition | Condition FDR | Condition Difference |
|---|---|---|---|---|---|---|---|---|
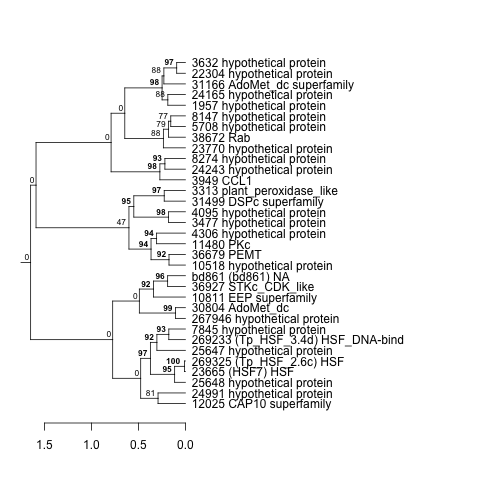
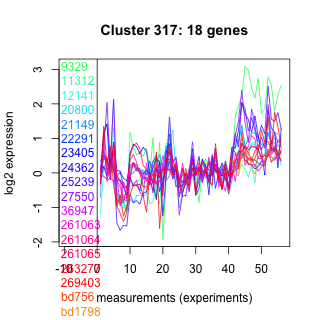
| Thaps_hclust_0317 |
 |
 |
0.000000000082 |
0.00000001 |
0.00000042 |
lowtemp_TMEVA | 0.016200 | 0.677 |
| Title | Cluster Plot | Dendrogram | e-value | e-value | e-value | Condition | Condition FDR | Condition Difference |
|---|---|---|---|---|---|---|---|---|
| Thaps_hclust_0108 |
 |
 |
0.0000001 |
0.013 |
4 |
lowtemp_TMEVA | 0.016200 | -0.494 |
| Title | Cluster Plot | Dendrogram | e-value | e-value | e-value | Condition | Condition FDR | Condition Difference |
|---|---|---|---|---|---|---|---|---|
| Thaps_hclust_0019 |
 |
 |
0.0000001 |
0.00000017 |
0.000037 |
highlight_arrays | 0.016300 | 0.344 |
| Title | Cluster Plot | Dendrogram | e-value | e-value | e-value | Condition | Condition FDR | Condition Difference |
|---|---|---|---|---|---|---|---|---|
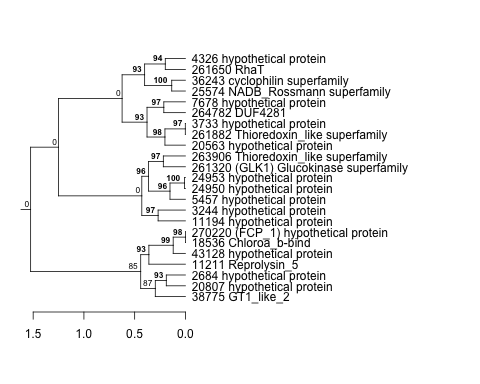
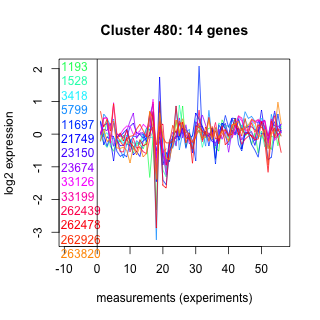
| Thaps_hclust_0480 |
 |
 |
0.18 |
1.3 |
44 |
BaP | 0.016300 | -0.596 |
| Title | Cluster Plot | Dendrogram | e-value | e-value | e-value | Condition | Condition FDR | Condition Difference |
|---|---|---|---|---|---|---|---|---|
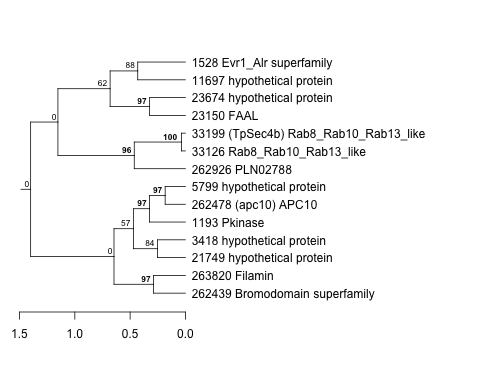
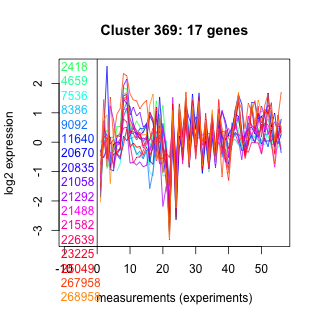
| Thaps_hclust_0369 |
 |
 |
0.34 |
2.4 |
5 |
co2_elevated_expo_arrays | 0.016400 | 0.333 |
| Title | Cluster Plot | Dendrogram | e-value | e-value | e-value | Condition | Condition FDR | Condition Difference |
|---|---|---|---|---|---|---|---|---|
| Thaps_hclust_0073 |
 |
 |
0.013 |
0.043 |
210 |
co2_elevated_expo_arrays | 0.016400 | 0.333 |
| Title | Cluster Plot | Dendrogram | e-value | e-value | e-value | Condition | Condition FDR | Condition Difference |
|---|---|---|---|---|---|---|---|---|
| Thaps_hclust_0479 |
 |
 |
0.11 |
0.2 |
1.5 |
BaP | 0.016400 | -0.537 |
| Title | Cluster Plot | Dendrogram | e-value | e-value | e-value | Condition | Condition FDR | Condition Difference |
|---|---|---|---|---|---|---|---|---|
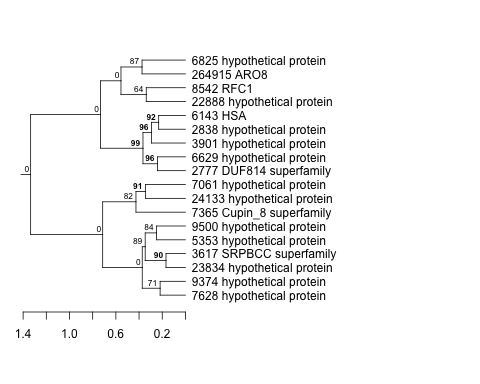
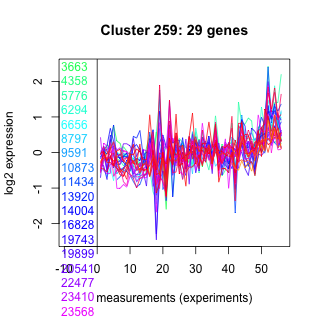
| Thaps_hclust_0259 |
 |
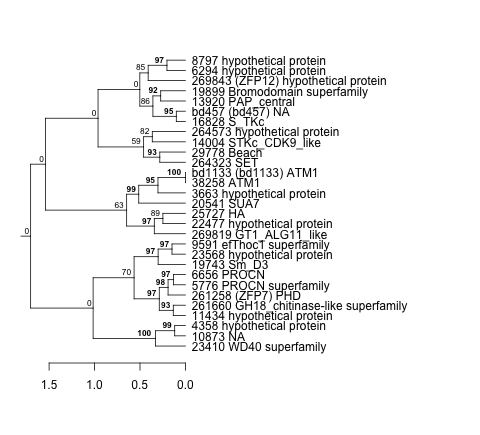 |
0.000051 |
0.026 |
17 |
BaP | 0.016400 | -0.414 |
| Title | Cluster Plot | Dendrogram | e-value | e-value | e-value | Condition | Condition FDR | Condition Difference |
|---|---|---|---|---|---|---|---|---|
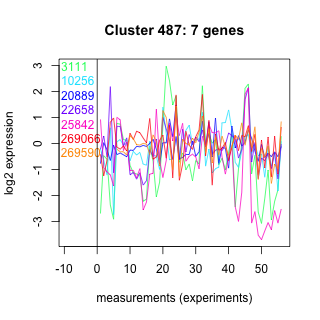
| Thaps_hclust_0487 |
 |
 |
2.2 |
14 |
320 |
lowtemp_TMEVA | 0.016500 | -1.25 |
| Title | Cluster Plot | Dendrogram | e-value | e-value | e-value | Condition | Condition FDR | Condition Difference |
|---|---|---|---|---|---|---|---|---|
| Thaps_hclust_0339 |
 |
 |
0.000016 |
0.00038 |
0.0017 |
lowFe_KTKB_Day3 | 0.016500 | -0.524 |
| Title | Cluster Plot | Dendrogram | e-value | e-value | e-value | Condition | Condition FDR | Condition Difference |
|---|---|---|---|---|---|---|---|---|
| Thaps_hclust_0408 |
 |
 |
0.3 |
4.9 |
5.3 |
BaP | 0.016600 | -0.517 |
| Title | Cluster Plot | Dendrogram | e-value | e-value | e-value | Condition | Condition FDR | Condition Difference |
|---|---|---|---|---|---|---|---|---|
| Thaps_hclust_0362 |
 |
 |
0.00003 |
0.0033 |
0.66 |
diel_light_vs_dark | 0.016600 | 0.477 |
| Title | Cluster Plot | Dendrogram | e-value | e-value | e-value | Condition | Condition FDR | Condition Difference |
|---|---|---|---|---|---|---|---|---|
| Thaps_hclust_0218 |
 |
 |
0.02 |
0.065 |
7.1 |
BaP | 0.016700 | 0.546 |
| Title | Cluster Plot | Dendrogram | e-value | e-value | e-value | Condition | Condition FDR | Condition Difference |
|---|---|---|---|---|---|---|---|---|
| Thaps_hclust_0304 |
 |
 |
0.16 |
1.3 |
16 |
lowFe_KTKB_Day5 | 0.016700 | -0.326 |
| Title | Cluster Plot | Dendrogram | e-value | e-value | e-value | Condition | Condition FDR | Condition Difference |
|---|---|---|---|---|---|---|---|---|
| Thaps_hclust_0335 |
 |
 |
0.0000000032 |
0.000001 |
0.019 |
BaP | 0.016700 | -0.373 |
| Title | Cluster Plot | Dendrogram | e-value | e-value | e-value | Condition | Condition FDR | Condition Difference |
|---|---|---|---|---|---|---|---|---|
| Thaps_hclust_0106 |
 |
 |
0.48 |
3.7 |
8.9 |
lowtemp_TMEVA | 0.016800 | -0.664 |
| Title | Cluster Plot | Dendrogram | e-value | e-value | e-value | Condition | Condition FDR | Condition Difference |
|---|---|---|---|---|---|---|---|---|
| Thaps_hclust_0104 |
 |
 |
23 |
24 |
220 |
lowtemp_TMEVA | 0.016800 | -0.941 |
| Title | Cluster Plot | Dendrogram | e-value | e-value | e-value | Condition | Condition FDR | Condition Difference |
|---|---|---|---|---|---|---|---|---|
| Thaps_hclust_0003 |
 |
 |
0.24 |
16 |
240 |
lowtemp_TMEVA | 0.016800 | -0.675 |
| Title | Cluster Plot | Dendrogram | e-value | e-value | e-value | Condition | Condition FDR | Condition Difference |
|---|---|---|---|---|---|---|---|---|
| Thaps_hclust_0431 |
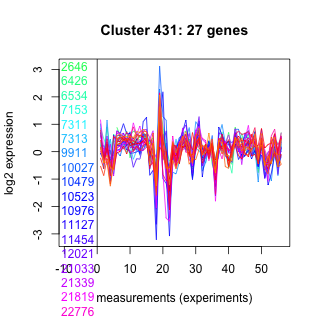 |
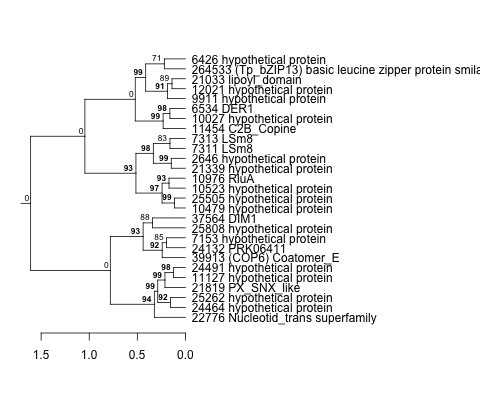 |
0.003 |
0.00095 |
0.0043 |
highlight_arrays | 0.016800 | 0.324 |
| Title | Cluster Plot | Dendrogram | e-value | e-value | e-value | Condition | Condition FDR | Condition Difference |
|---|---|---|---|---|---|---|---|---|
| Thaps_hclust_0033 |
 |
 |
0.000000000000011 |
0.0012 |
0.0073 |
lowtemp_TMEVA | 0.016800 | -0.37 |
| Thaps_hclust_0033 |
|
|
0.000000000000011 |
0.0012 |
0.0073 |
highpH_TMEVA | 0.018400 | -0.242 |
| Title | Cluster Plot | Dendrogram | e-value | e-value | e-value | Condition | Condition FDR | Condition Difference |
|---|---|---|---|---|---|---|---|---|
| Thaps_hclust_0037 |
 |
 |
0.23 |
0.79 |
340 |
co2_elevated_expo_arrays | 0.017000 | 0.28 |
| Title | Cluster Plot | Dendrogram | e-value | e-value | e-value | Condition | Condition FDR | Condition Difference |
|---|---|---|---|---|---|---|---|---|
| Thaps_hclust_0145 |
 |
 |
0.015 |
1.6 |
11 |
lowtemp_TMEVA | 0.017100 | -1.22 |
| Title | Cluster Plot | Dendrogram | e-value | e-value | e-value | Condition | Condition FDR | Condition Difference |
|---|---|---|---|---|---|---|---|---|
| Thaps_hclust_0162 |
 |
 |
0.032 |
3.2 |
58 |
highpH_TMEVA | 0.017100 | -0.424 |
| Title | Cluster Plot | Dendrogram | e-value | e-value | e-value | Condition | Condition FDR | Condition Difference |
|---|---|---|---|---|---|---|---|---|
| Thaps_hclust_0075 |
 |
 |
0.069 |
53 |
33 |
diel_light_vs_dark | 0.017100 | 0.603 |
| Title | Cluster Plot | Dendrogram | e-value | e-value | e-value | Condition | Condition FDR | Condition Difference |
|---|---|---|---|---|---|---|---|---|
| Thaps_hclust_0123 |
 |
 |
0.000073 |
0.05 |
0.076 |
highpH_TMEVA | 0.017100 | 0.293 |
| Title | Cluster Plot | Dendrogram | e-value | e-value | e-value | Condition | Condition FDR | Condition Difference |
|---|---|---|---|---|---|---|---|---|
| Thaps_hclust_0473 |
 |
 |
0.00036 |
0.0036 |
0.68 |
lowtemp_TMEVA | 0.017400 | -0.507 |
| Title | Cluster Plot | Dendrogram | e-value | e-value | e-value | Condition | Condition FDR | Condition Difference |
|---|---|---|---|---|---|---|---|---|
| Thaps_hclust_0433 |
 |
 |
14 |
54 |
440 |
lowFe_KTKB_Day5 | 0.017400 | -0.591 |
| Title | Cluster Plot | Dendrogram | e-value | e-value | e-value | Condition | Condition FDR | Condition Difference |
|---|---|---|---|---|---|---|---|---|
| Thaps_hclust_0400 |
 |
 |
Not available | Not available | Not available | lowtemp_TMEVA | 0.017400 | -0.463 |
| Title | Cluster Plot | Dendrogram | e-value | e-value | e-value | Condition | Condition FDR | Condition Difference |
|---|---|---|---|---|---|---|---|---|
| Thaps_hclust_0202 |
 |
 |
0.0064 |
0.023 |
0.32 |
lowtemp_TMEVA | 0.017400 | 1.27 |
| Title | Cluster Plot | Dendrogram | e-value | e-value | e-value | Condition | Condition FDR | Condition Difference |
|---|---|---|---|---|---|---|---|---|
| Thaps_hclust_0321 |
 |
 |
0.000000086 |
0.0000000042 |
0.0000028 |
highpH_TMEVA | 0.017400 | -0.3 |
| Title | Cluster Plot | Dendrogram | e-value | e-value | e-value | Condition | Condition FDR | Condition Difference |
|---|---|---|---|---|---|---|---|---|
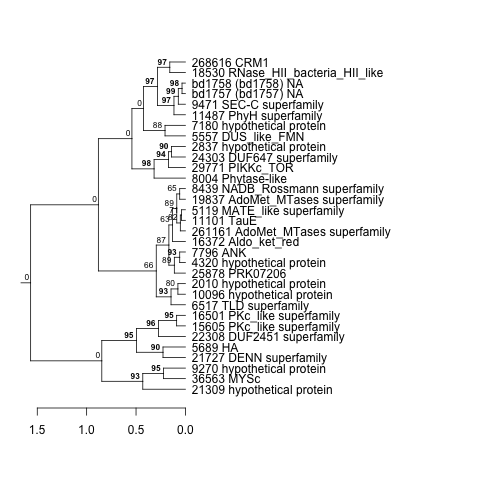
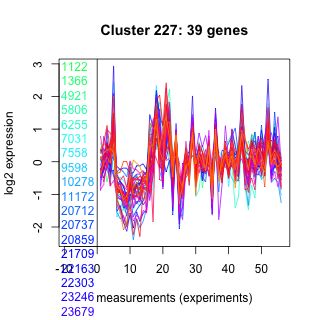
| Thaps_hclust_0227 |
 |
 |
1.2e-22 |
0.0000000098 |
0.0018 |
lowFe_KTKB_Day5 | 0.017400 | 0.319 |
| Title | Cluster Plot | Dendrogram | e-value | e-value | e-value | Condition | Condition FDR | Condition Difference |
|---|---|---|---|---|---|---|---|---|
| Thaps_hclust_0052 |
 |
 |
1.4e-22 |
3.3e-19 |
0.0000000000037 |
lowFe_KTKB_Day5 | 0.017400 | 0.307 |
| Title | Cluster Plot | Dendrogram | e-value | e-value | e-value | Condition | Condition FDR | Condition Difference |
|---|---|---|---|---|---|---|---|---|
| Thaps_hclust_0039 |
 |
 |
2.2e-16 |
0.000000000000049 |
0.00083 |
highlight_arrays | 0.017500 | -0.246 |
| Title | Cluster Plot | Dendrogram | e-value | e-value | e-value | Condition | Condition FDR | Condition Difference |
|---|---|---|---|---|---|---|---|---|
| Thaps_hclust_0084 |
 |
 |
0.0000000000035 |
0.00000025 |
0.12 |
BaP | 0.017500 | 0.443 |
| Title | Cluster Plot | Dendrogram | e-value | e-value | e-value | Condition | Condition FDR | Condition Difference |
|---|---|---|---|---|---|---|---|---|
| Thaps_hclust_0172 |
 |
 |
0.000001 |
0.000011 |
0.014 |
lowSi_TMEVA | 0.017500 | -0.71 |
| Title | Cluster Plot | Dendrogram | e-value | e-value | e-value | Condition | Condition FDR | Condition Difference |
|---|---|---|---|---|---|---|---|---|
| Thaps_hclust_0387 |
 |
 |
0.0023 |
0.003 |
0.38 |
BaP | 0.017500 | 0.462 |
| Title | Cluster Plot | Dendrogram | e-value | e-value | e-value | Condition | Condition FDR | Condition Difference |
|---|---|---|---|---|---|---|---|---|
| Thaps_hclust_0009 |
 |
 |
0.0000023 |
0.0000027 |
0.000035 |
highlight_arrays | 0.017500 | -0.286 |
| Title | Cluster Plot | Dendrogram | e-value | e-value | e-value | Condition | Condition FDR | Condition Difference |
|---|---|---|---|---|---|---|---|---|
| Thaps_hclust_0006 |
 |
 |
0.0000000000025 |
0.000000092 |
0.000086 |
diel_exponential_vs_stationary | 0.017600 | -0.277 |
| Title | Cluster Plot | Dendrogram | e-value | e-value | e-value | Condition | Condition FDR | Condition Difference |
|---|---|---|---|---|---|---|---|---|
| Thaps_hclust_0153 |
 |
 |
0.0000021 |
0.0049 |
0.015 |
co2_elevated_stat_arrays | 0.017700 | -0.461 |
| Title | Cluster Plot | Dendrogram | e-value | e-value | e-value | Condition | Condition FDR | Condition Difference |
|---|---|---|---|---|---|---|---|---|
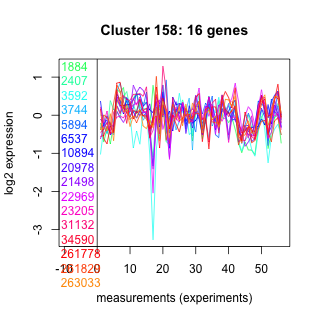
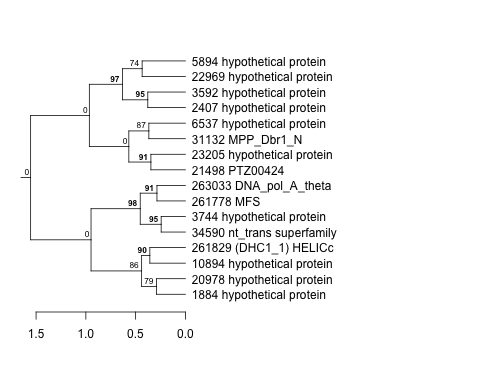
| Thaps_hclust_0196 |
 |
 |
0.0000000000000088 |
0.00000034 |
0.000017 |
diel_exponential_vs_stationary | 0.017700 | -0.235 |
| Title | Cluster Plot | Dendrogram | e-value | e-value | e-value | Condition | Condition FDR | Condition Difference |
|---|---|---|---|---|---|---|---|---|
| Thaps_hclust_0422 |
 |
 |
1.9 |
15 |
0.0027 |
diel_light_vs_dark | 0.017700 | -0.434 |
| Title | Cluster Plot | Dendrogram | e-value | e-value | e-value | Condition | Condition FDR | Condition Difference |
|---|---|---|---|---|---|---|---|---|
| Thaps_hclust_0158 |
 |
 |
0.007 |
0.55 |
1.2 |
co2_elevated_stat_arrays | 0.017700 | -0.536 |
| Title | Cluster Plot | Dendrogram | e-value | e-value | e-value | Condition | Condition FDR | Condition Difference |
|---|---|---|---|---|---|---|---|---|
| Thaps_hclust_0325 |
 |
 |
0.00000000000002 |
0.000000076 |
0.17 |
diel_exponential_vs_stationary | 0.017700 | -0.355 |
| Title | Cluster Plot | Dendrogram | e-value | e-value | e-value | Condition | Condition FDR | Condition Difference |
|---|---|---|---|---|---|---|---|---|
| Thaps_hclust_0049 |
 |
 |
0.00054 |
0.0063 |
0.03 |
co2_elevated_stat_arrays | 0.018000 | 0.42 |
| Title | Cluster Plot | Dendrogram | e-value | e-value | e-value | Condition | Condition FDR | Condition Difference |
|---|---|---|---|---|---|---|---|---|
| Thaps_hclust_0371 |
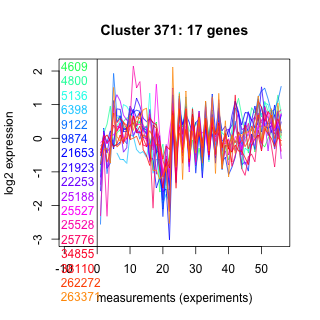 |
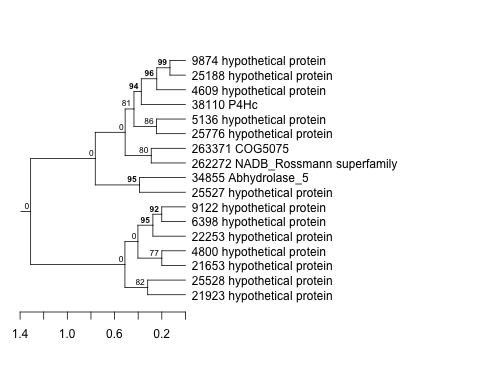 |
0.0051 |
0.11 |
1.1 |
highlight_arrays | 0.018000 | -0.404 |
| Title | Cluster Plot | Dendrogram | e-value | e-value | e-value | Condition | Condition FDR | Condition Difference |
|---|---|---|---|---|---|---|---|---|
| Thaps_hclust_0214 |
 |
 |
0.00006 |
0.0000000031 |
0.00076 |
highlight_arrays | 0.018200 | -0.23 |
| Title | Cluster Plot | Dendrogram | e-value | e-value | e-value | Condition | Condition FDR | Condition Difference |
|---|---|---|---|---|---|---|---|---|
| Thaps_hclust_0497 |
 |
 |
0.1 |
5.2 |
29 |
highlight_arrays | 0.018200 | 0.498 |
| Title | Cluster Plot | Dendrogram | e-value | e-value | e-value | Condition | Condition FDR | Condition Difference |
|---|---|---|---|---|---|---|---|---|
| Thaps_hclust_0452 |
 |
 |
84 |
200 |
220 |
highlight_arrays | 0.018200 | 0.391 |
| Title | Cluster Plot | Dendrogram | e-value | e-value | e-value | Condition | Condition FDR | Condition Difference |
|---|---|---|---|---|---|---|---|---|
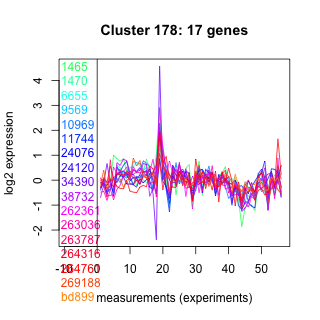
| Thaps_hclust_0178 |
 |
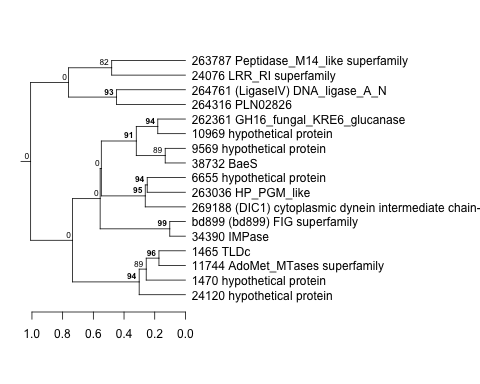 |
0.0000000019 |
0.00000047 |
0.000019 |
highlight_arrays | 0.018300 | -0.402 |
| Title | Cluster Plot | Dendrogram | e-value | e-value | e-value | Condition | Condition FDR | Condition Difference |
|---|---|---|---|---|---|---|---|---|
| Thaps_hclust_0377 |
 |
 |
0.00016 |
0.034 |
0.95 |
exponential_vs_stationary_24highlight | 0.018400 | -0.203 |