Hierarchical Clusters
Displaying 1901 - 2000 of 7500
| Title | Cluster Plot | Dendrogram | e-value | e-value | e-value | Condition | Condition FDR | Condition Difference |
|---|---|---|---|---|---|---|---|---|
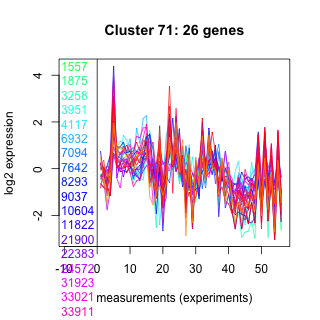
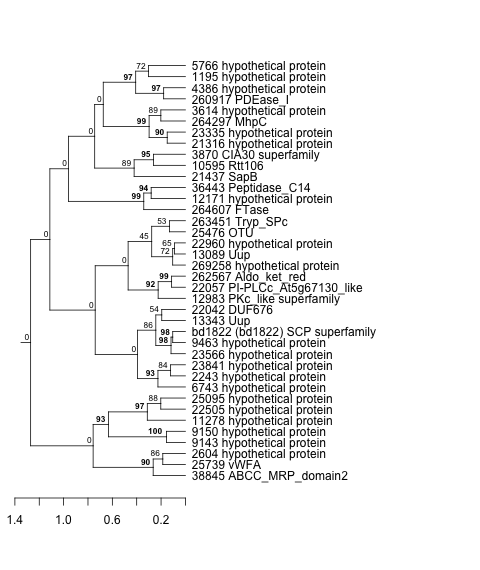
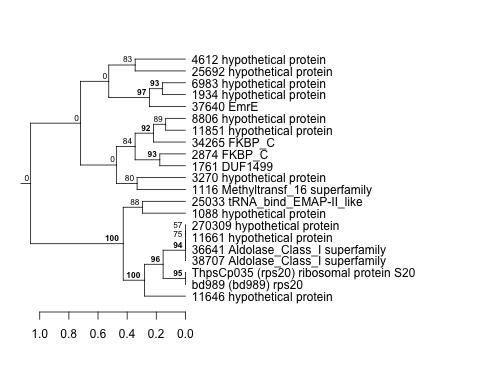
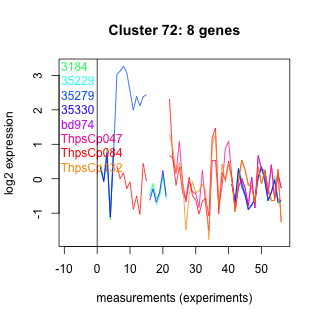
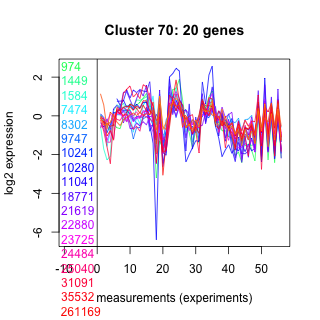
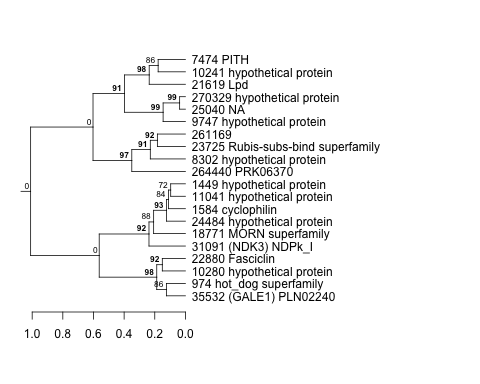
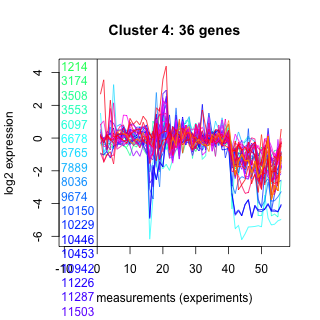
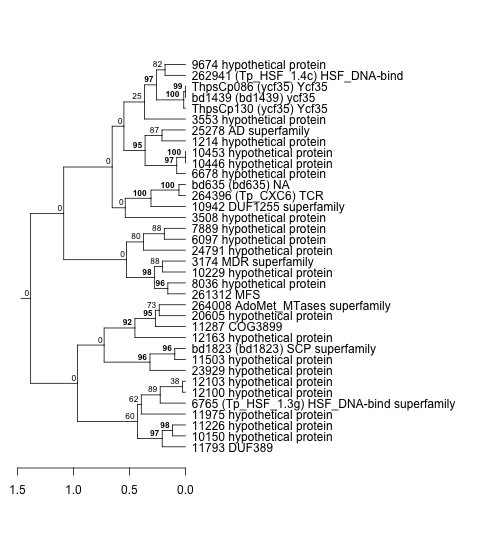
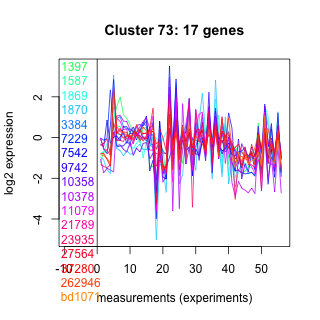
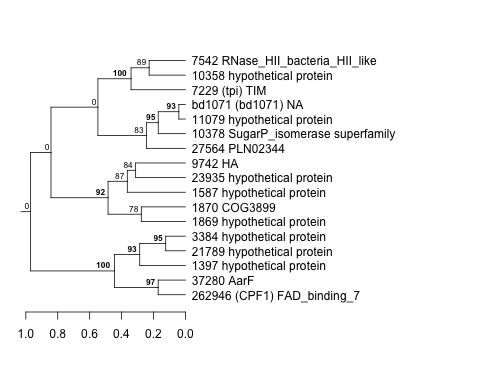
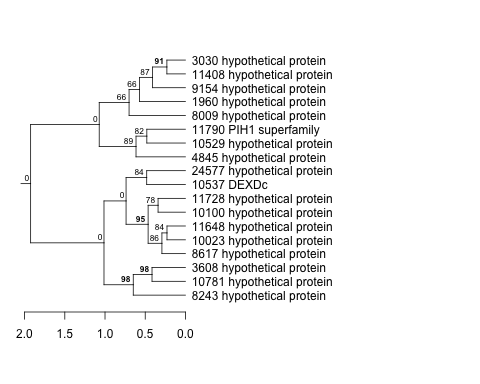
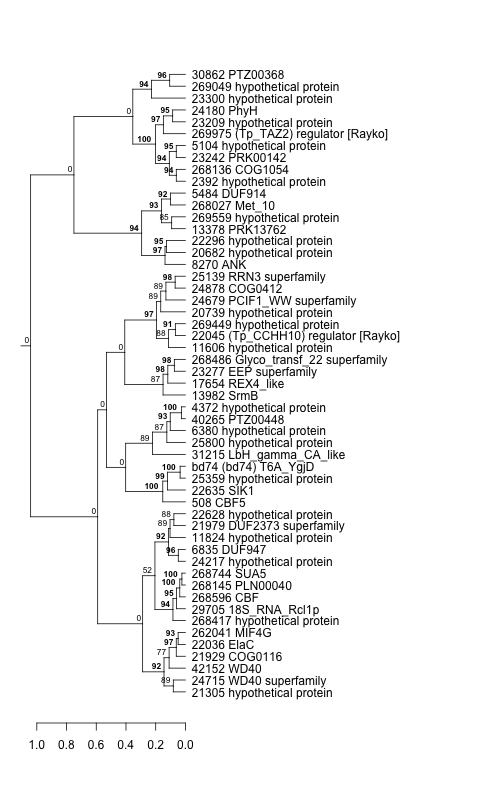
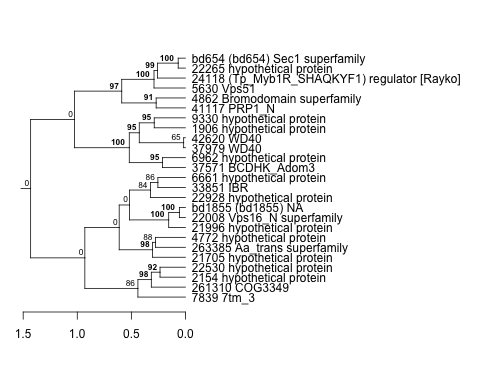
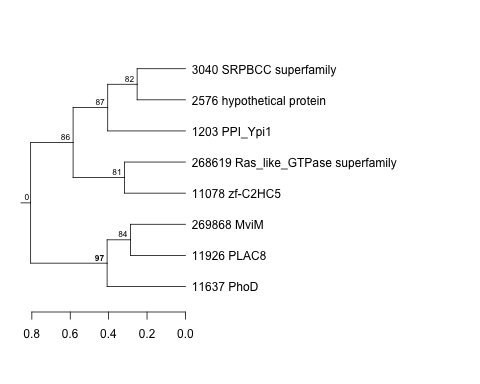
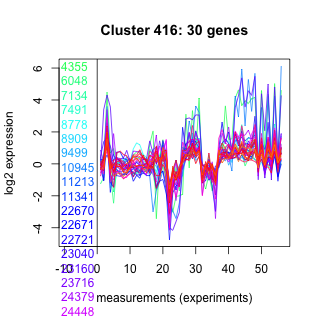
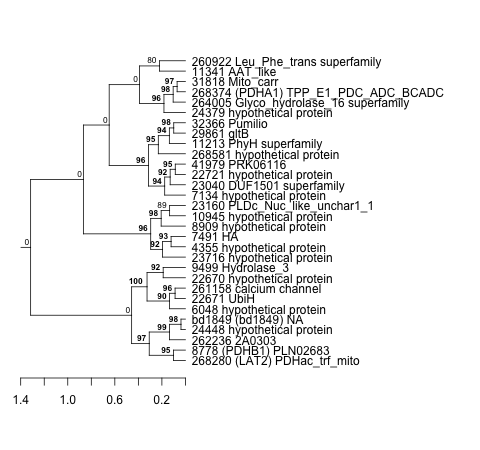
| Thaps_hclust_0071 |
 |
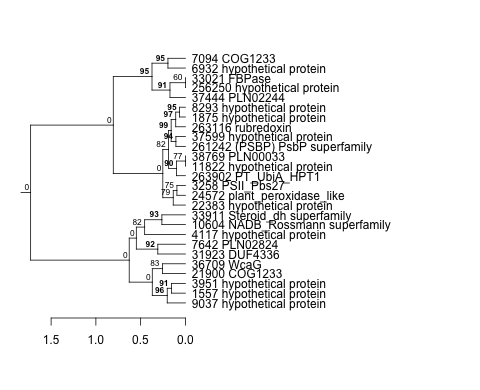 |
0.0000019 |
0.0000028 |
0.00008 |
lowN_TMEVA | 0.031600 | -0.601 |
| Thaps_hclust_0071 |
|
|
0.0000019 |
0.0000028 |
0.00008 |
BaP | 0.034800 | -0.394 |
| Title | Cluster Plot | Dendrogram | e-value | e-value | e-value | Condition | Condition FDR | Condition Difference |
|---|---|---|---|---|---|---|---|---|
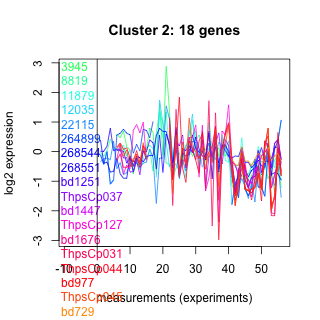
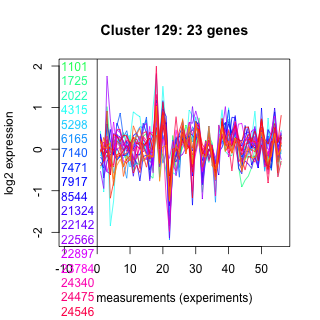
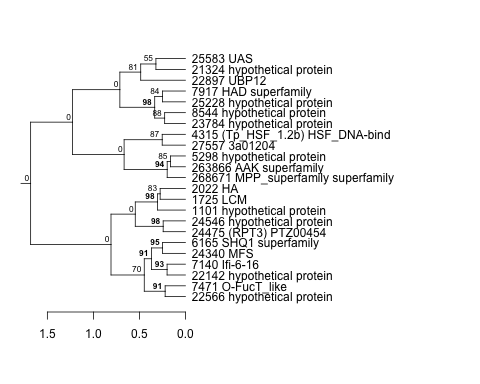
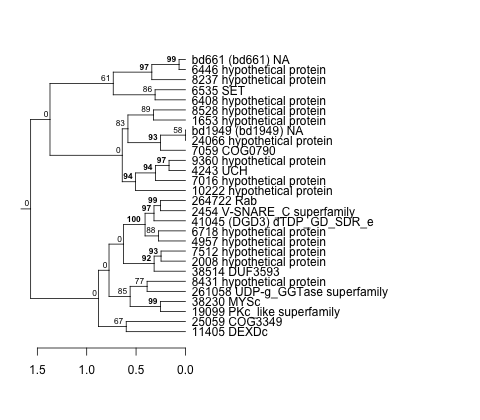
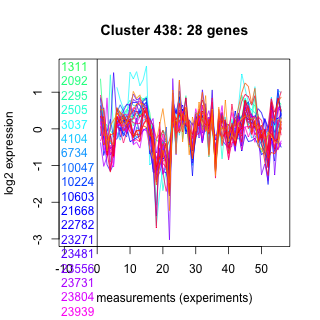
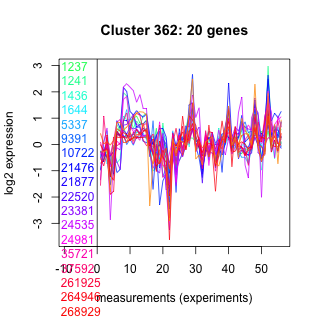
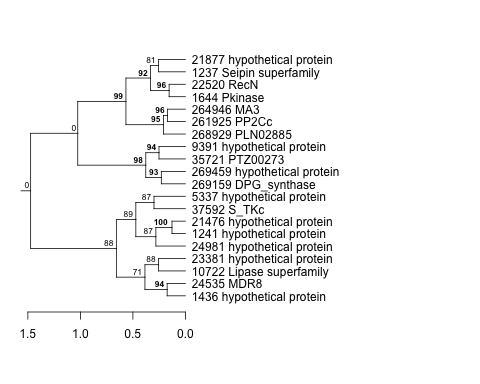
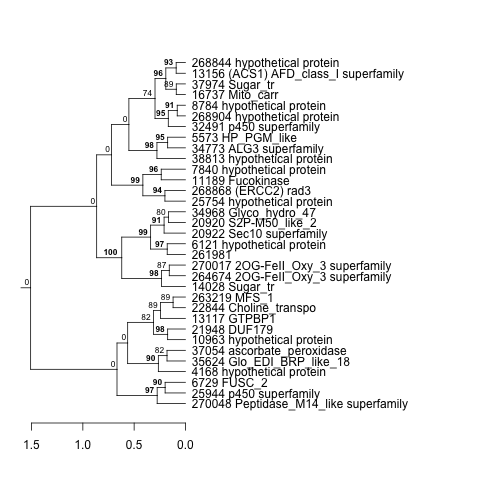
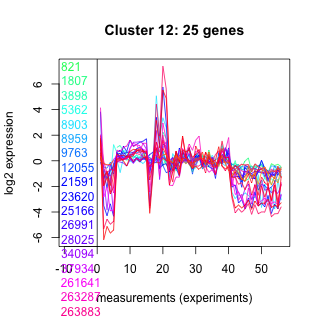
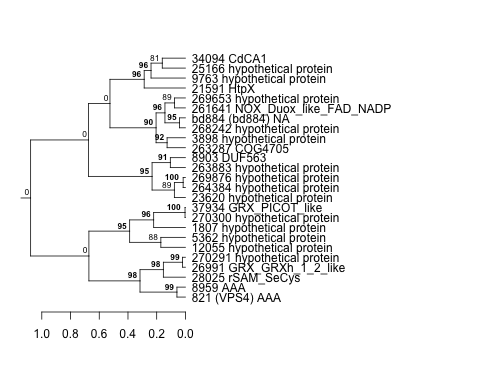
| Thaps_hclust_0002 |
 |
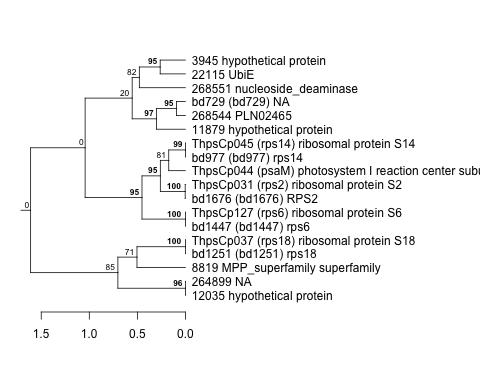 |
0.00000029 |
0.000000009 |
0.000055 |
highlight_arrays | 0.031600 | -0.348 |
| Thaps_hclust_0002 |
|
|
0.00000029 |
0.000000009 |
0.000055 |
BaP | 0.037700 | 0.47 |
| Title | Cluster Plot | Dendrogram | e-value | e-value | e-value | Condition | Condition FDR | Condition Difference |
|---|---|---|---|---|---|---|---|---|
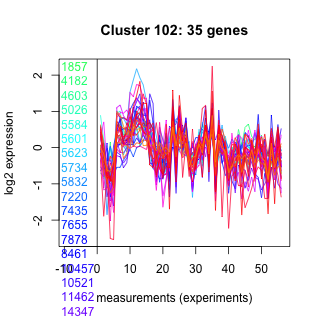
| Thaps_hclust_0102 |
 |
 |
3.2e-16 |
0.00000000002 |
0.0000006 |
diel_exponential_vs_stationary | 0.031700 | 0.273 |
| Thaps_hclust_0102 |
|
|
3.2e-16 |
0.00000000002 |
0.0000006 |
lowFe_TMEVA | 0.034000 | -0.402 |
| Title | Cluster Plot | Dendrogram | e-value | e-value | e-value | Condition | Condition FDR | Condition Difference |
|---|---|---|---|---|---|---|---|---|
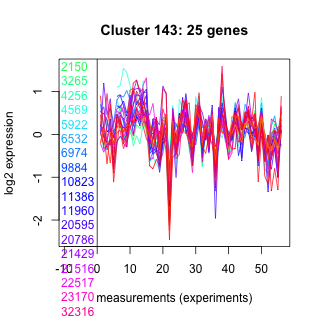
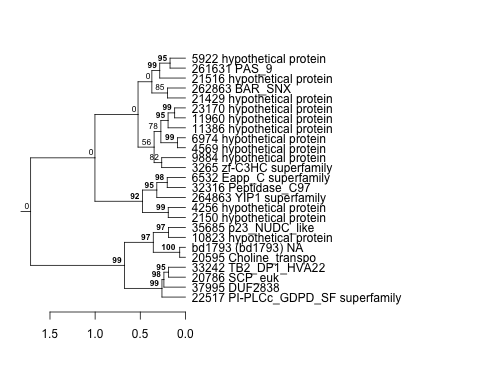
| Thaps_hclust_0143 |
 |
 |
0.018 |
0.041 |
0.67 |
diel_exponential_vs_stationary | 0.031700 | -0.32 |
| Title | Cluster Plot | Dendrogram | e-value | e-value | e-value | Condition | Condition FDR | Condition Difference |
|---|---|---|---|---|---|---|---|---|
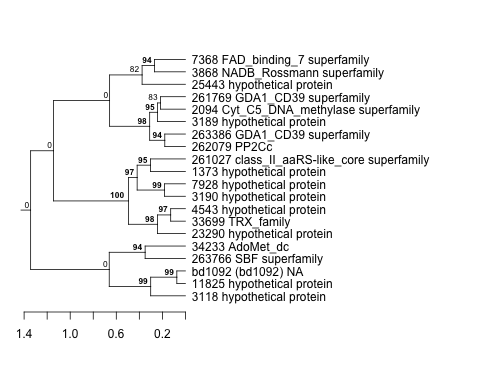
| Thaps_hclust_0304 |
 |
 |
0.16 |
1.3 |
16 |
lowtemp_TMEVA | 0.031800 | -0.393 |
| Title | Cluster Plot | Dendrogram | e-value | e-value | e-value | Condition | Condition FDR | Condition Difference |
|---|---|---|---|---|---|---|---|---|
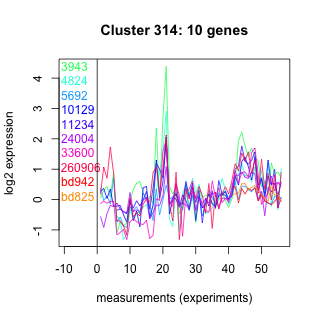
| Thaps_hclust_0314 |
 |
 |
0.052 |
1.9 |
8.5 |
highlight_arrays | 0.031900 | 0.463 |
| Title | Cluster Plot | Dendrogram | e-value | e-value | e-value | Condition | Condition FDR | Condition Difference |
|---|---|---|---|---|---|---|---|---|
| Thaps_hclust_0336 |
 |
 |
8.7e-23 |
0.00000000000015 |
0.0000000000000032 |
BaP | 0.032100 | 0.618 |
| Title | Cluster Plot | Dendrogram | e-value | e-value | e-value | Condition | Condition FDR | Condition Difference |
|---|---|---|---|---|---|---|---|---|
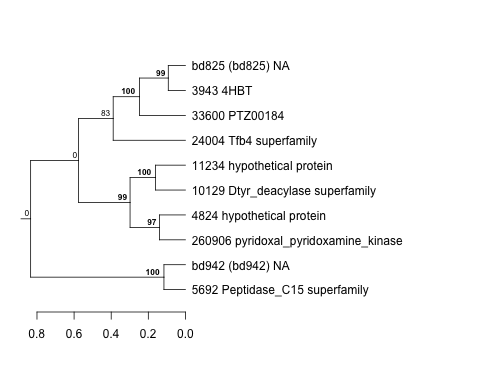
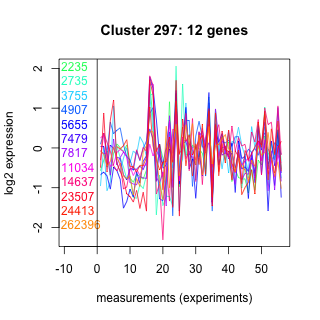
| Thaps_hclust_0297 |
 |
 |
0.018 |
2.5 |
24 |
BaP | 0.032100 | -0.595 |
| Thaps_hclust_0297 |
|
|
0.018 |
2.5 |
24 |
diel_light_vs_dark | 0.033500 | -0.539 |
| Title | Cluster Plot | Dendrogram | e-value | e-value | e-value | Condition | Condition FDR | Condition Difference |
|---|---|---|---|---|---|---|---|---|
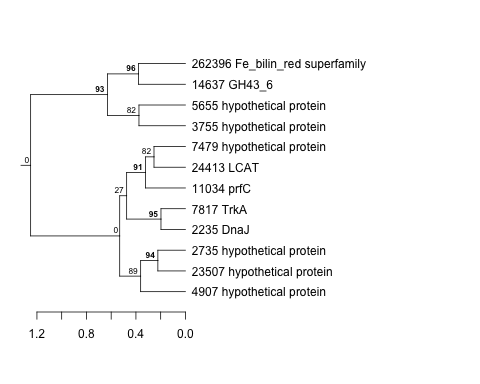
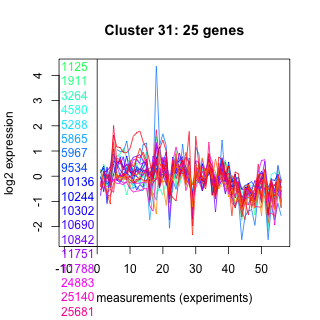
| Thaps_hclust_0031 |
 |
 |
0.00000077 |
0.000041 |
6.3 |
co2_elevated_stat_arrays | 0.032300 | -0.426 |
| Thaps_hclust_0031 |
|
|
0.00000077 |
0.000041 |
6.3 |
exponential_vs_stationary_24light | 0.034500 | 0.585 |
| Thaps_hclust_0031 |
|
|
0.00000077 |
0.000041 |
6.3 |
lowtemp_TMEVA | 0.037300 | 0.466 |
| Title | Cluster Plot | Dendrogram | e-value | e-value | e-value | Condition | Condition FDR | Condition Difference |
|---|---|---|---|---|---|---|---|---|
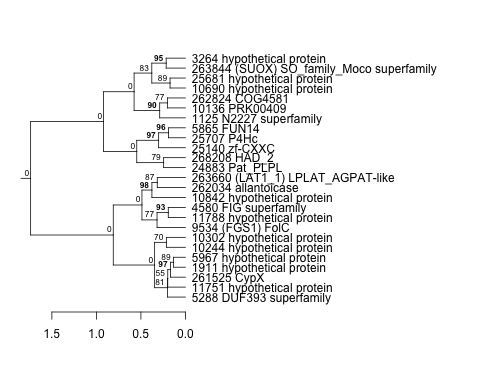
| Thaps_hclust_0311 |
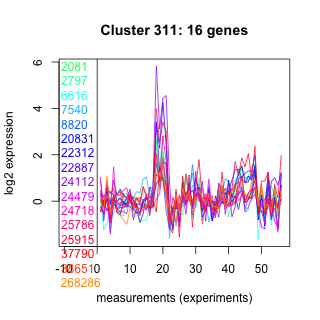 |
 |
4.1 |
0.64 |
12 |
co2_elevated_stat_arrays | 0.032300 | 0.494 |
| Title | Cluster Plot | Dendrogram | e-value | e-value | e-value | Condition | Condition FDR | Condition Difference |
|---|---|---|---|---|---|---|---|---|
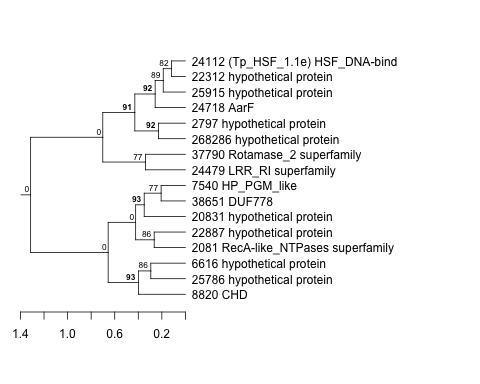
| Thaps_hclust_0379 |
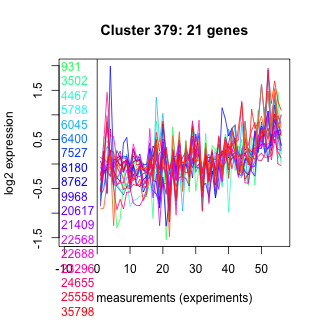 |
 |
0.00013 |
0.012 |
0.26 |
diel_light_vs_dark | 0.032800 | 0.405 |
| Title | Cluster Plot | Dendrogram | e-value | e-value | e-value | Condition | Condition FDR | Condition Difference |
|---|---|---|---|---|---|---|---|---|
| Thaps_hclust_0498 |
 |
 |
1.3 |
1.8 |
1.8 |
co2_elevated_stat_arrays | 0.033100 | 0.489 |
| Title | Cluster Plot | Dendrogram | e-value | e-value | e-value | Condition | Condition FDR | Condition Difference |
|---|---|---|---|---|---|---|---|---|
| Thaps_hclust_0020 |
 |
 |
0.004 |
0.15 |
3.3 |
lowtemp_TMEVA | 0.033100 | -0.479 |
| Title | Cluster Plot | Dendrogram | e-value | e-value | e-value | Condition | Condition FDR | Condition Difference |
|---|---|---|---|---|---|---|---|---|
| Thaps_hclust_0064 |
 |
 |
0.000000012 |
0.00000073 |
0.0000002 |
highpH_TMEVA | 0.033100 | -0.371 |
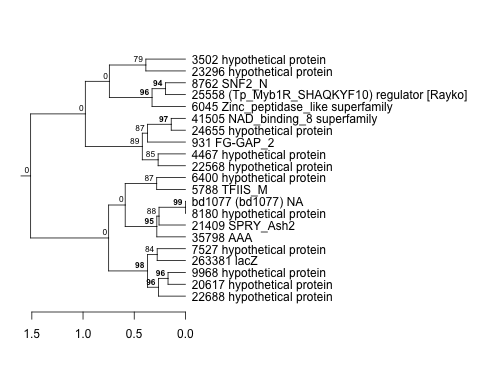
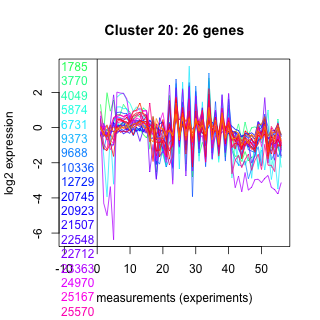
| Title | Cluster Plot | Dendrogram | e-value | e-value | e-value | Condition | Condition FDR | Condition Difference |
|---|---|---|---|---|---|---|---|---|
| Thaps_hclust_0202 |
 |
 |
0.0064 |
0.023 |
0.32 |
lowN_TMEVA | 0.033300 | 1.26 |
| Title | Cluster Plot | Dendrogram | e-value | e-value | e-value | Condition | Condition FDR | Condition Difference |
|---|---|---|---|---|---|---|---|---|
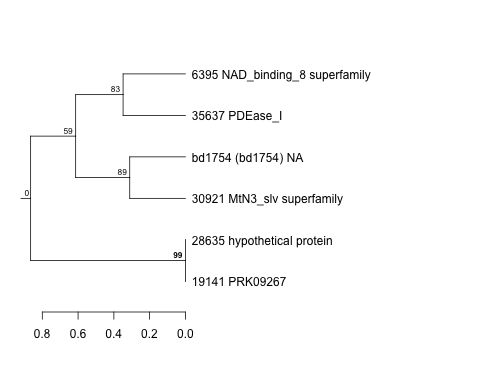
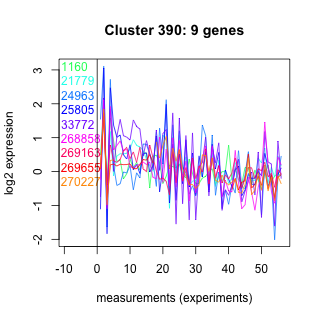
| Thaps_hclust_0390 |
 |
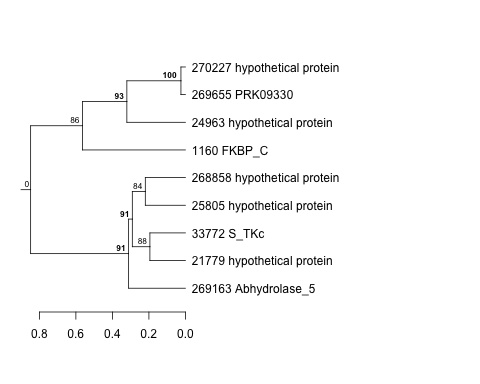 |
0.013 |
0.066 |
0.15 |
lowN_TMEVA | 0.033300 | -1 |
| Title | Cluster Plot | Dendrogram | e-value | e-value | e-value | Condition | Condition FDR | Condition Difference |
|---|---|---|---|---|---|---|---|---|
| Thaps_hclust_0037 |
 |
 |
0.23 |
0.79 |
340 |
lowtemp_TMEVA | 0.033600 | 0.476 |
| Thaps_hclust_0037 |
|
|
0.23 |
0.79 |
340 |
highpH_TMEVA | 0.036500 | -0.294 |
| Title | Cluster Plot | Dendrogram | e-value | e-value | e-value | Condition | Condition FDR | Condition Difference |
|---|---|---|---|---|---|---|---|---|
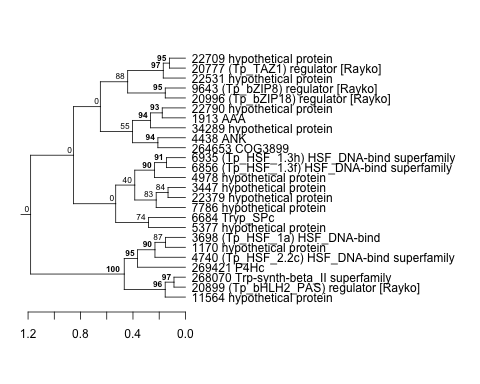
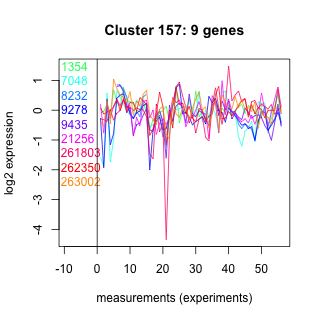
| Thaps_hclust_0157 |
 |
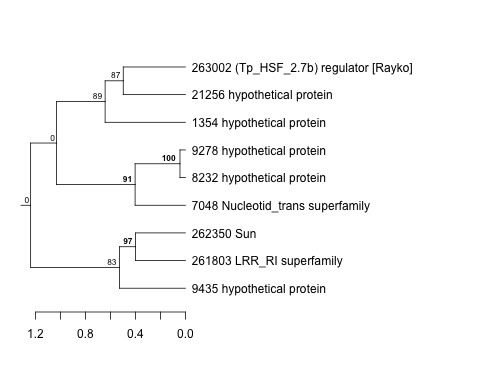 |
2 |
4.6 |
4.9 |
lowFe_TMEVA | 0.033600 | -0.801 |
| Title | Cluster Plot | Dendrogram | e-value | e-value | e-value | Condition | Condition FDR | Condition Difference |
|---|---|---|---|---|---|---|---|---|
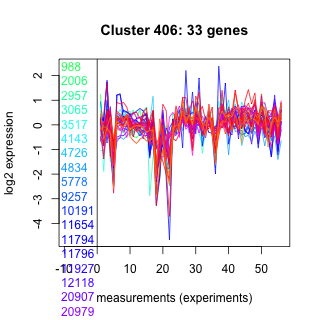
| Thaps_hclust_0406 |
 |
 |
0.000039 |
0.013 |
0.13 |
lowFe_TMEVA | 0.033800 | -0.409 |
| Title | Cluster Plot | Dendrogram | e-value | e-value | e-value | Condition | Condition FDR | Condition Difference |
|---|---|---|---|---|---|---|---|---|
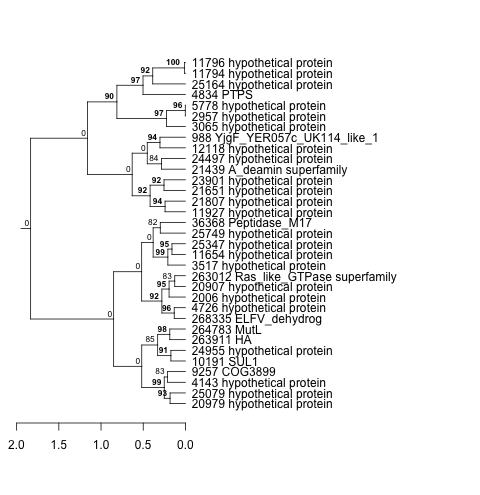
| Thaps_hclust_0495 |
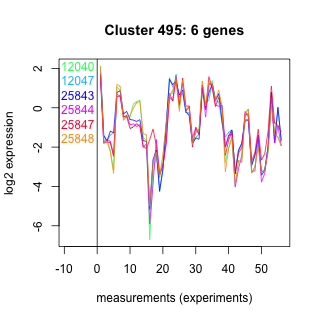 |
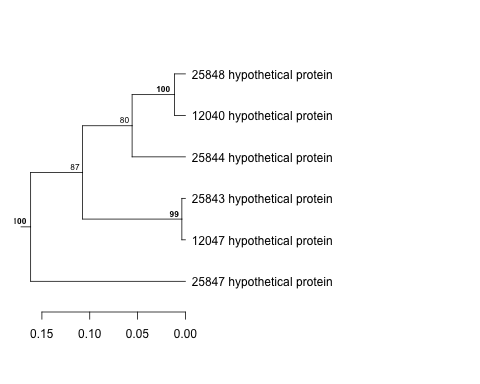 |
0.0000000031 |
0.00000049 |
0.0000038 |
exponential_vs_stationary_24highlight | 0.034100 | 0.416 |
| Title | Cluster Plot | Dendrogram | e-value | e-value | e-value | Condition | Condition FDR | Condition Difference |
|---|---|---|---|---|---|---|---|---|
| Thaps_hclust_0385 |
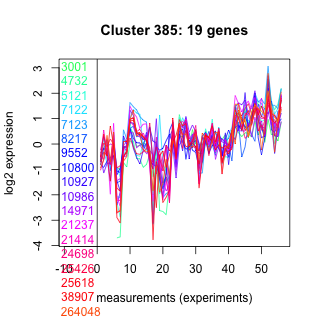 |
 |
0.000029 |
2.1 |
2.2 |
exponential_vs_stationary_24highlight | 0.034100 | -0.226 |
| Title | Cluster Plot | Dendrogram | e-value | e-value | e-value | Condition | Condition FDR | Condition Difference |
|---|---|---|---|---|---|---|---|---|
| Thaps_hclust_0382 |
 |
 |
0.0000042 |
0.012 |
0.055 |
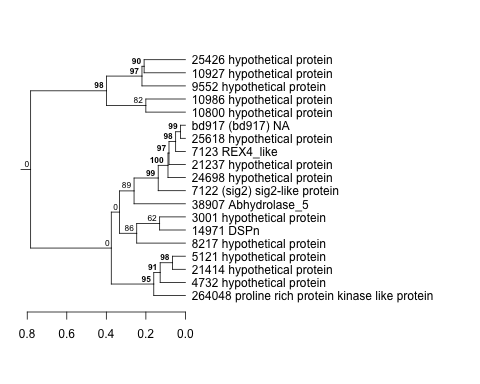
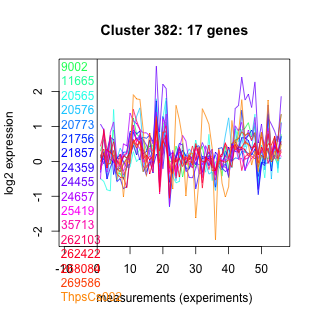
exponential_vs_stationary_24highlight | 0.034100 | -0.24 |
| Title | Cluster Plot | Dendrogram | e-value | e-value | e-value | Condition | Condition FDR | Condition Difference |
|---|---|---|---|---|---|---|---|---|
| Thaps_hclust_0472 |
 |
 |
0.00000011 |
0.000015 |
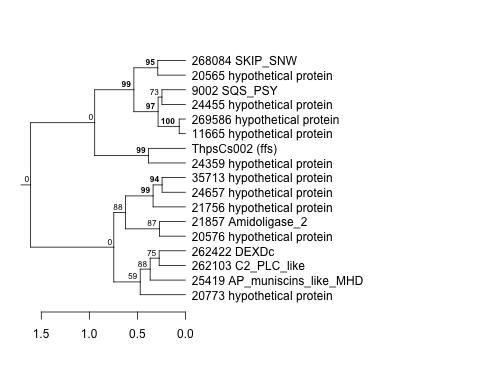
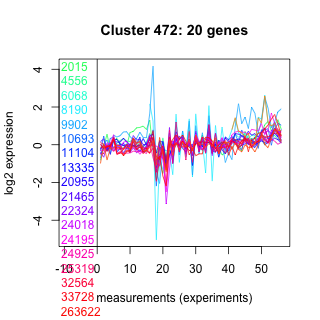
0.00015 |
lowFe_KTKB_Day5 | 0.034400 | 0.405 |
| Title | Cluster Plot | Dendrogram | e-value | e-value | e-value | Condition | Condition FDR | Condition Difference |
|---|---|---|---|---|---|---|---|---|
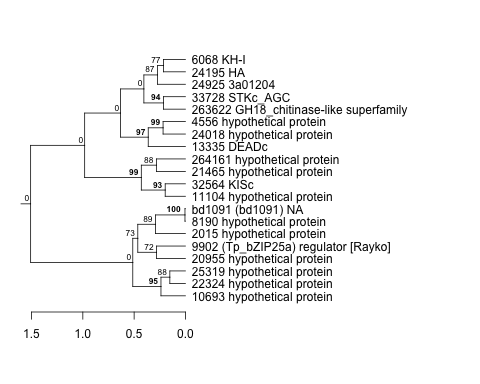
| Thaps_hclust_0291 |
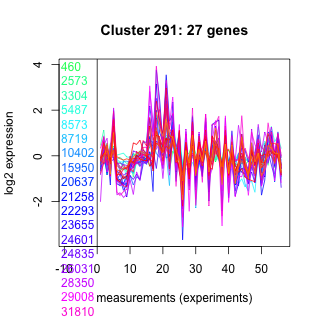 |
 |
0.000000049 |
0.000056 |
0.0000035 |
exponential_vs_stationary_24light | 0.034500 | 0.571 |
| Title | Cluster Plot | Dendrogram | e-value | e-value | e-value | Condition | Condition FDR | Condition Difference |
|---|---|---|---|---|---|---|---|---|
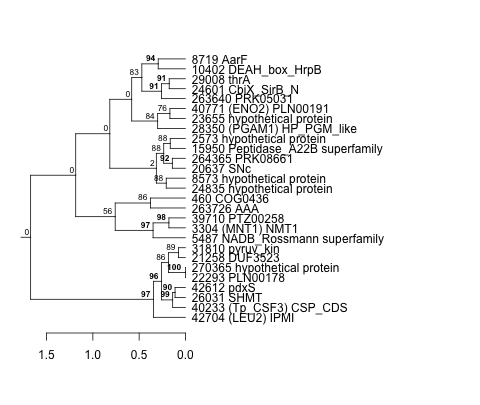
| Thaps_hclust_0176 |
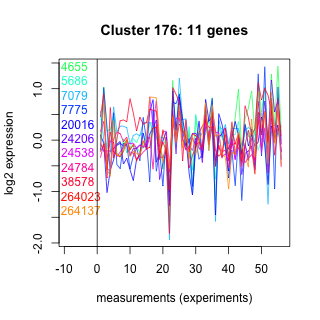 |
 |
29 |
59 |
110 |
exponential_vs_stationary_24highlight | 0.034500 | 0.31 |
| Title | Cluster Plot | Dendrogram | e-value | e-value | e-value | Condition | Condition FDR | Condition Difference |
|---|---|---|---|---|---|---|---|---|
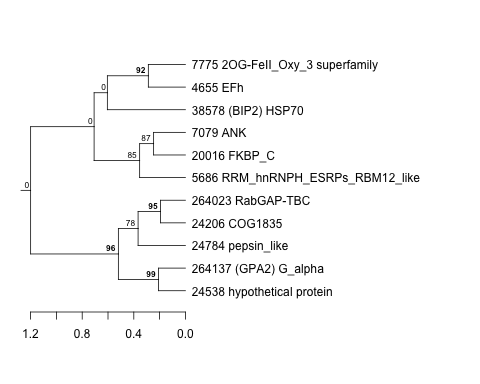
| Thaps_hclust_0100 |
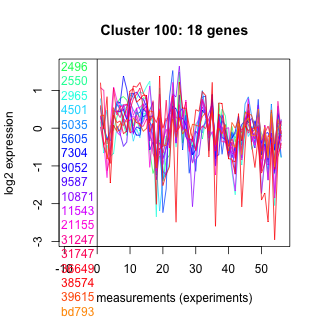 |
 |
0.00000073 |
0.000076 |
2.6 |
exponential_vs_stationary_24light | 0.034600 | 0.695 |
| Title | Cluster Plot | Dendrogram | e-value | e-value | e-value | Condition | Condition FDR | Condition Difference |
|---|---|---|---|---|---|---|---|---|
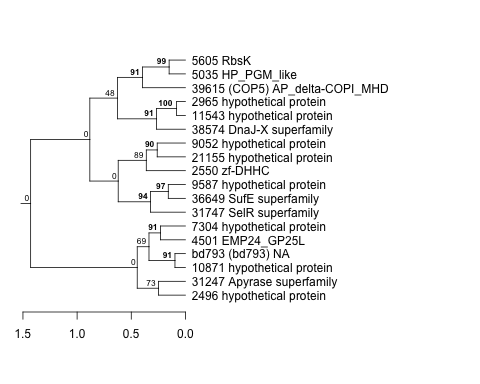
| Thaps_hclust_0133 |
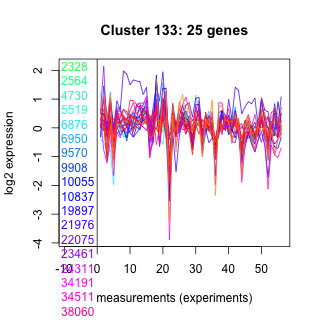 |
 |
0.95 |
2.2 |
2.4 |
lowFe_TMEVA | 0.034900 | 0.451 |
| Title | Cluster Plot | Dendrogram | e-value | e-value | e-value | Condition | Condition FDR | Condition Difference |
|---|---|---|---|---|---|---|---|---|
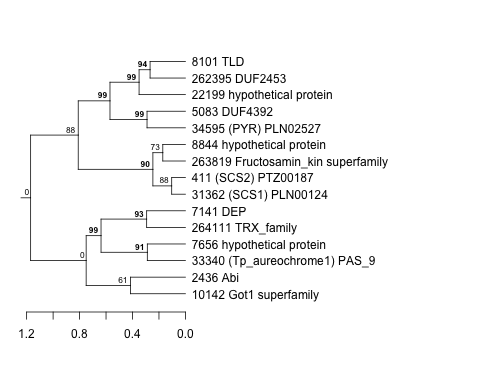
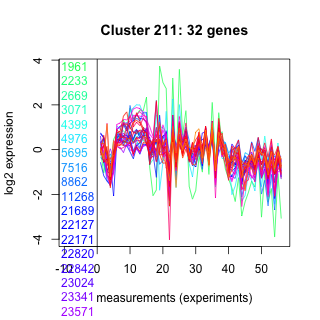
| Thaps_hclust_0221 |
 |
|
|
1e-37 |
0.0000000000012 |
exponential_vs_stationary_24highlight | 0.034900 | -0.103 |
| Title | Cluster Plot | Dendrogram | e-value | e-value | e-value | Condition | Condition FDR | Condition Difference |
|---|---|---|---|---|---|---|---|---|
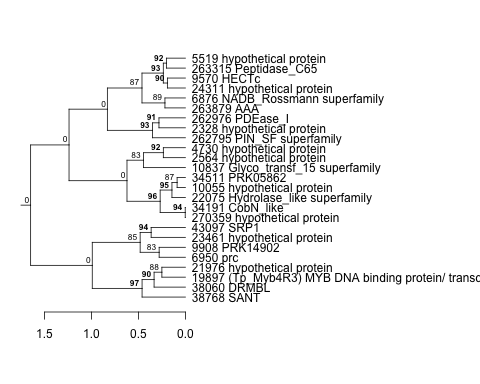
| Thaps_hclust_0089 |
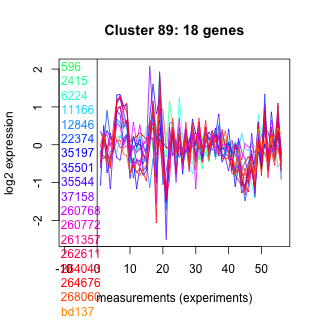 |
 |
0.000036 |
0.00054 |
0.075 |
exponential_vs_stationary_24highlight | 0.034900 | 0.233 |
| Title | Cluster Plot | Dendrogram | e-value | e-value | e-value | Condition | Condition FDR | Condition Difference |
|---|---|---|---|---|---|---|---|---|
| Thaps_hclust_0085 |
 |
 |
0.000012 |
0.0024 |
0.37 |
lowN_TMEVA | 0.035200 | -0.577 |
| Title | Cluster Plot | Dendrogram | e-value | e-value | e-value | Condition | Condition FDR | Condition Difference |
|---|---|---|---|---|---|---|---|---|
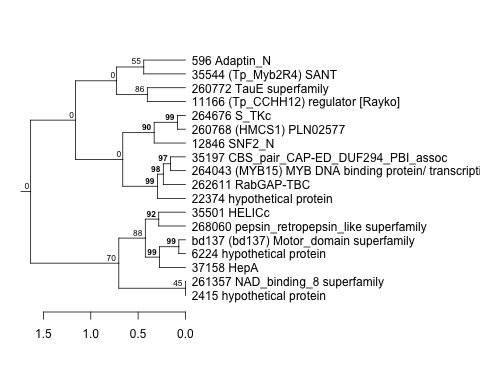
| Thaps_hclust_0481 |
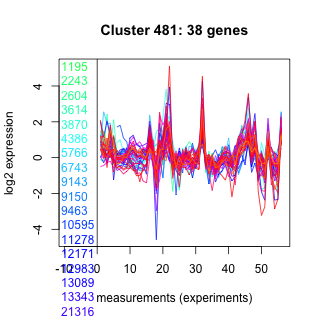 |
 |
0.000000069 |
0.00000053 |
0.000012 |
lowN_TMEVA | 0.035200 | 0.496 |
| Title | Cluster Plot | Dendrogram | e-value | e-value | e-value | Condition | Condition FDR | Condition Difference |
|---|---|---|---|---|---|---|---|---|
| Thaps_hclust_0144 |
 |
 |
0.000000001 |
0.0000000019 |
0.00000019 |
lowN_TMEVA | 0.035200 | 0.46 |
| Title | Cluster Plot | Dendrogram | e-value | e-value | e-value | Condition | Condition FDR | Condition Difference |
|---|---|---|---|---|---|---|---|---|
| Thaps_hclust_0243 |
 |
 |
0.00018 |
0.14 |
0.0019 |
highpH_TMEVA | 0.035300 | -0.345 |
| Title | Cluster Plot | Dendrogram | e-value | e-value | e-value | Condition | Condition FDR | Condition Difference |
|---|---|---|---|---|---|---|---|---|
| Thaps_hclust_0008 |
 |
 |
0.000000000000034 |
0.0000000000037 |
0.0000000000018 |
BaP | 0.035300 | 0.425 |
| Title | Cluster Plot | Dendrogram | e-value | e-value | e-value | Condition | Condition FDR | Condition Difference |
|---|---|---|---|---|---|---|---|---|
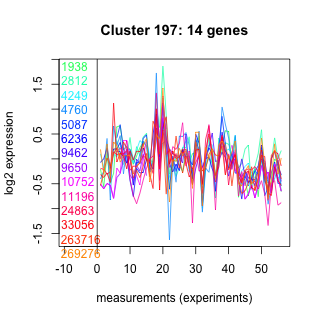
| Thaps_hclust_0197 |
 |
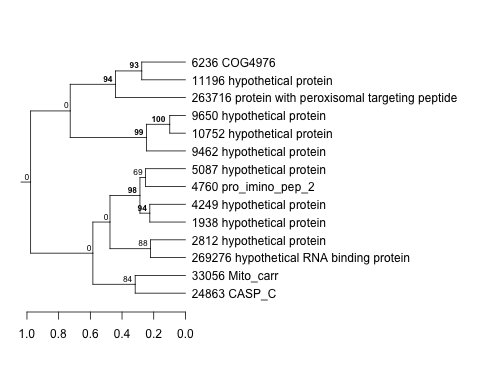 |
0.12 |
0.3 |
0.65 |
BaP | 0.035600 | 0.526 |
| Title | Cluster Plot | Dendrogram | e-value | e-value | e-value | Condition | Condition FDR | Condition Difference |
|---|---|---|---|---|---|---|---|---|
| Thaps_hclust_0072 |
 |
 |
1.2e-22 |
1.1e-16 |
0.000000000000011 |
exponential_vs_stationary_24highlight | 0.035600 | 0.354 |
| Title | Cluster Plot | Dendrogram | e-value | e-value | e-value | Condition | Condition FDR | Condition Difference |
|---|---|---|---|---|---|---|---|---|
| Thaps_hclust_0395 |
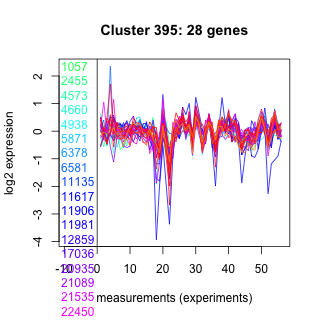 |
 |
0.0015 |
0.0018 |
0.48 |
BaP | 0.035600 | -0.375 |
| Title | Cluster Plot | Dendrogram | e-value | e-value | e-value | Condition | Condition FDR | Condition Difference |
|---|---|---|---|---|---|---|---|---|
| Thaps_hclust_0294 |
 |
 |
0.0033 |
0.13 |
0.53 |
highlight_arrays | 0.035700 | -0.325 |
| Thaps_hclust_0294 |
|
|
0.0033 |
0.13 |
0.53 |
co2_elevated_expo_arrays | 0.039700 | 0.272 |
| Title | Cluster Plot | Dendrogram | e-value | e-value | e-value | Condition | Condition FDR | Condition Difference |
|---|---|---|---|---|---|---|---|---|
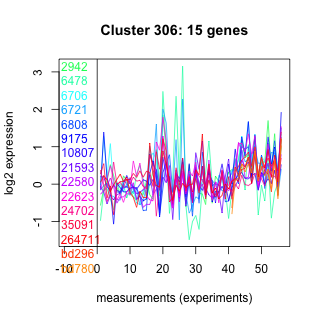
| Thaps_hclust_0306 |
 |
 |
0.001 |
0.26 |
5.3 |
diel_light_vs_dark | 0.035700 | -0.478 |
| Title | Cluster Plot | Dendrogram | e-value | e-value | e-value | Condition | Condition FDR | Condition Difference |
|---|---|---|---|---|---|---|---|---|
| Thaps_hclust_0120 |
 |
 |
0.00000098 |
0.000000076 |
0.001 |
highlight_arrays | 0.035800 | 0.306 |
| Title | Cluster Plot | Dendrogram | e-value | e-value | e-value | Condition | Condition FDR | Condition Difference |
|---|---|---|---|---|---|---|---|---|
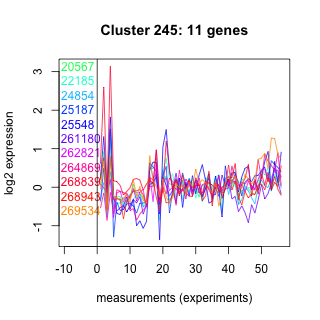
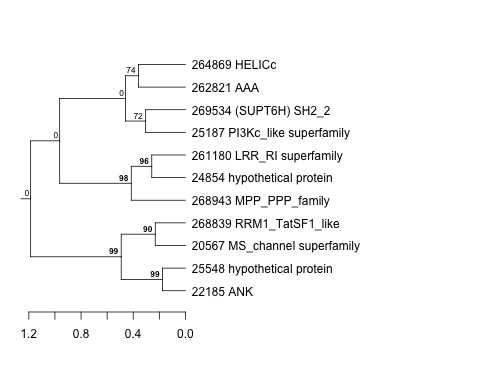
| Thaps_hclust_0245 |
 |
 |
0.52 |
100 |
150 |
lowSi_TMEVA | 0.035800 | 1.05 |
| Title | Cluster Plot | Dendrogram | e-value | e-value | e-value | Condition | Condition FDR | Condition Difference |
|---|---|---|---|---|---|---|---|---|
| Thaps_hclust_0467 |
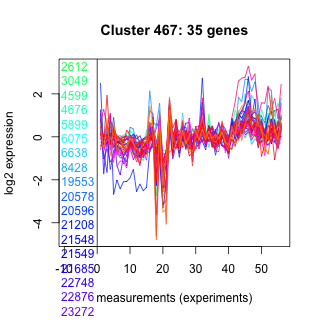 |
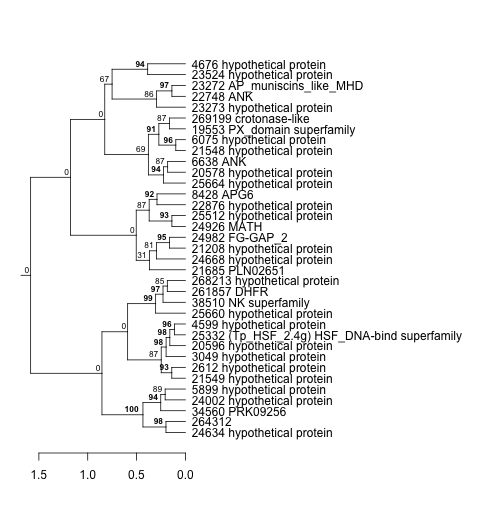 |
0.000000000002 |
0.0000014 |
0.035 |
diel_light_vs_dark | 0.035800 | -0.311 |
| Title | Cluster Plot | Dendrogram | e-value | e-value | e-value | Condition | Condition FDR | Condition Difference |
|---|---|---|---|---|---|---|---|---|
| Thaps_hclust_0462 |
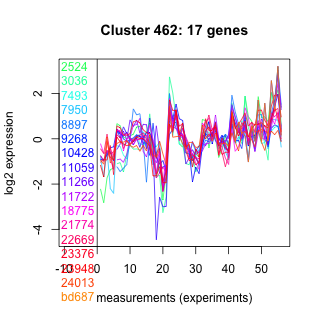 |
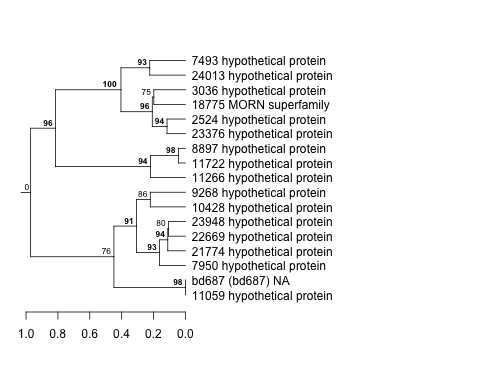 |
0.0000000094 |
0.0000011 |
0.000046 |
lowSi_TMEVA | 0.035800 | -0.871 |
| Title | Cluster Plot | Dendrogram | e-value | e-value | e-value | Condition | Condition FDR | Condition Difference |
|---|---|---|---|---|---|---|---|---|
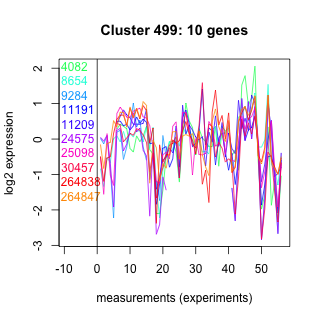
| Thaps_hclust_0499 |
 |
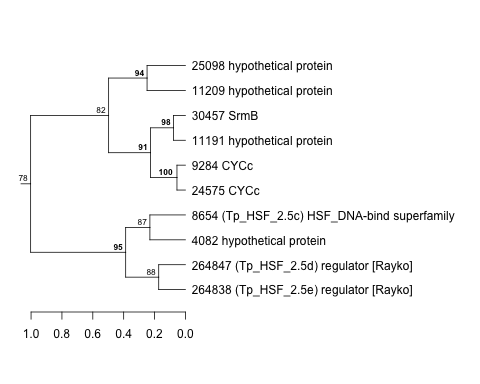 |
0.13 |
5.4 |
18 |
lowtemp_TMEVA | 0.035900 | -0.791 |
| Title | Cluster Plot | Dendrogram | e-value | e-value | e-value | Condition | Condition FDR | Condition Difference |
|---|---|---|---|---|---|---|---|---|
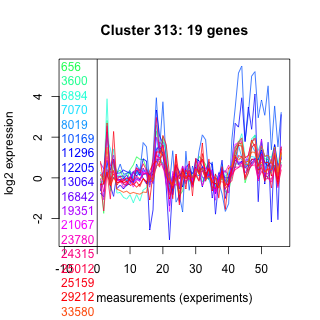
| Thaps_hclust_0313 |
 |
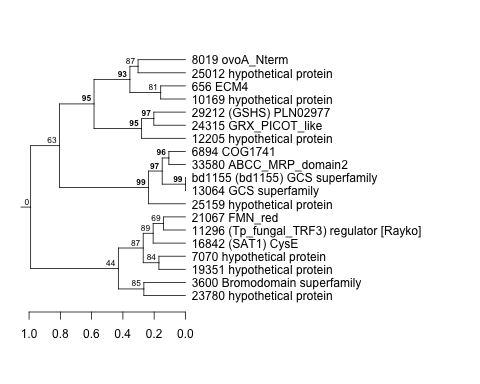 |
0.00000043 |
0.00014 |
0.00078 |
lowtemp_TMEVA | 0.035900 | 0.555 |
| Title | Cluster Plot | Dendrogram | e-value | e-value | e-value | Condition | Condition FDR | Condition Difference |
|---|---|---|---|---|---|---|---|---|
| Thaps_hclust_0419 |
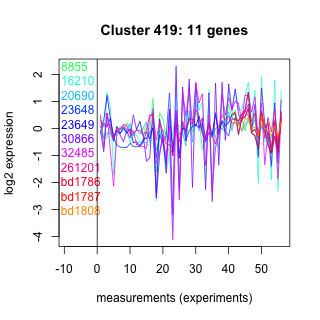 |
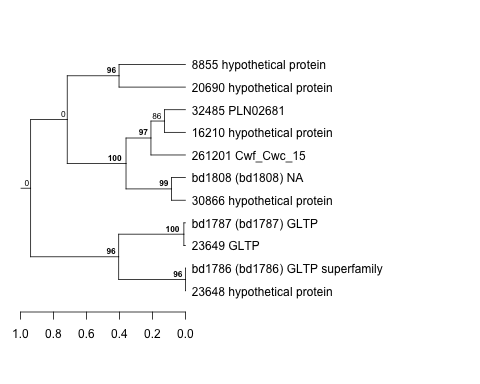 |
0.0014 |
0.00031 |
0.0014 |
lowtemp_TMEVA | 0.035900 | -0.75 |
| Title | Cluster Plot | Dendrogram | e-value | e-value | e-value | Condition | Condition FDR | Condition Difference |
|---|---|---|---|---|---|---|---|---|
| Thaps_hclust_0226 |
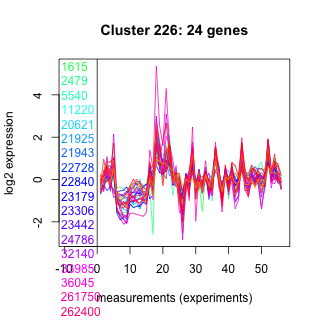 |
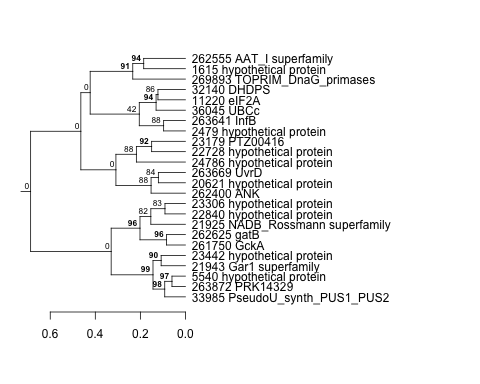 |
0.000000041 |
0.95 |
4.6 |
lowtemp_TMEVA | 0.035900 | 0.493 |
| Title | Cluster Plot | Dendrogram | e-value | e-value | e-value | Condition | Condition FDR | Condition Difference |
|---|---|---|---|---|---|---|---|---|
| Thaps_hclust_0487 |
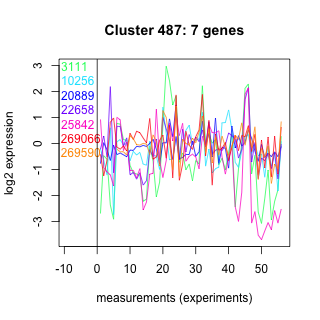 |
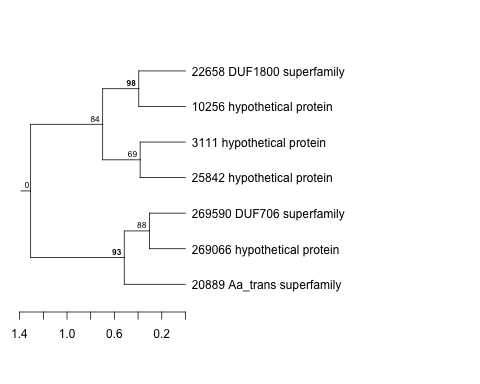 |
2.2 |
14 |
320 |
highpH_TMEVA | 0.036100 | -0.563 |
| Title | Cluster Plot | Dendrogram | e-value | e-value | e-value | Condition | Condition FDR | Condition Difference |
|---|---|---|---|---|---|---|---|---|
| Thaps_hclust_0115 |
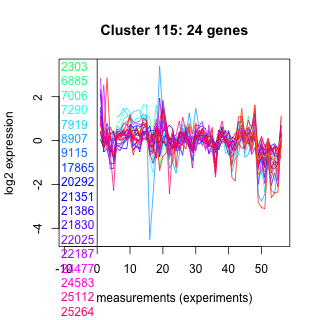 |
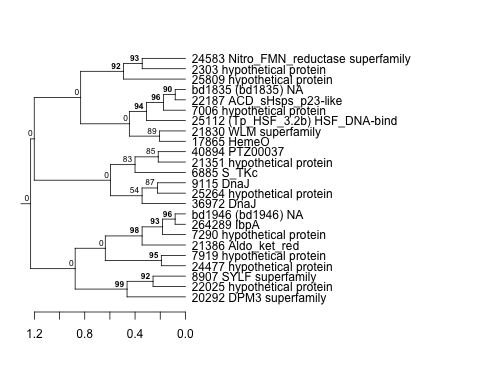 |
0.00037 |
0.044 |
0.46 |
exponential_vs_stationary_24light | 0.036300 | -0.584 |
| Title | Cluster Plot | Dendrogram | e-value | e-value | e-value | Condition | Condition FDR | Condition Difference |
|---|---|---|---|---|---|---|---|---|
| Thaps_hclust_0287 |
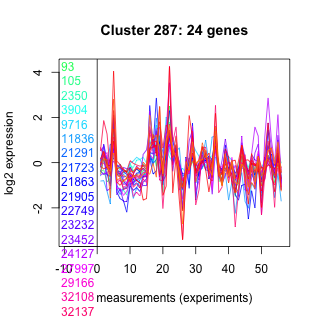 |
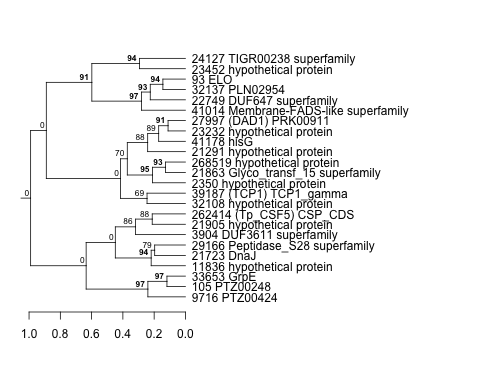 |
0.0000001 |
0.00007 |
0.003 |
BaP | 0.036300 | 0.407 |
| Thaps_hclust_0287 |
|
|
0.0000001 |
0.00007 |
0.003 |
exponential_vs_stationary_24highlight | 0.038200 | 0.194 |
| Thaps_hclust_0287 |
|
|
0.0000001 |
0.00007 |
0.003 |
highlight_arrays | 0.039300 | -0.296 |
| Title | Cluster Plot | Dendrogram | e-value | e-value | e-value | Condition | Condition FDR | Condition Difference |
|---|---|---|---|---|---|---|---|---|
| Thaps_hclust_0117 |
 |
 |
0.0000000000002 |
0.000000021 |
0.00000045 |
lowtemp_TMEVA | 0.036400 | -0.548 |
| Title | Cluster Plot | Dendrogram | e-value | e-value | e-value | Condition | Condition FDR | Condition Difference |
|---|---|---|---|---|---|---|---|---|
| Thaps_hclust_0322 |
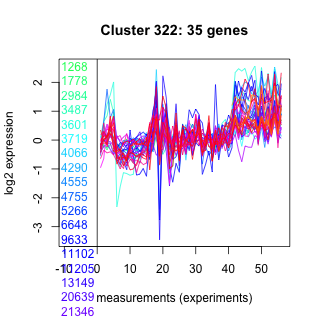 |
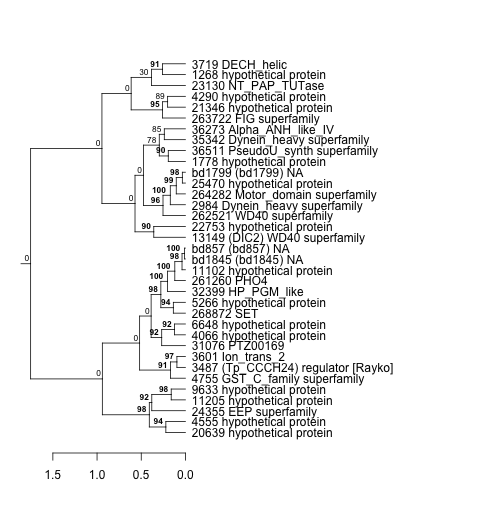 |
0.0000000021 |
0.0000000053 |
0.0051 |
highpH_TMEVA | 0.036600 | -0.256 |
| Title | Cluster Plot | Dendrogram | e-value | e-value | e-value | Condition | Condition FDR | Condition Difference |
|---|---|---|---|---|---|---|---|---|
| Thaps_hclust_0070 |
 |
 |
0.00015 |
0.0025 |
0.041 |
lowSi_TMEVA | 0.036700 | -0.797 |
| Title | Cluster Plot | Dendrogram | e-value | e-value | e-value | Condition | Condition FDR | Condition Difference |
|---|---|---|---|---|---|---|---|---|
| Thaps_hclust_0099 |
 |
 |
0.0000000000000032 |
0.000000000000013 |
0.000000000000025 |
highlight_arrays | 0.036900 | 0.656 |
| Title | Cluster Plot | Dendrogram | e-value | e-value | e-value | Condition | Condition FDR | Condition Difference |
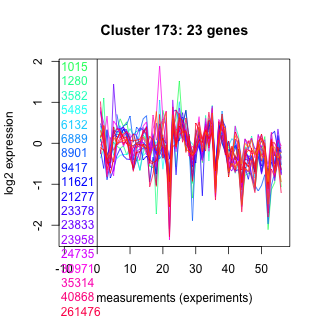
|---|---|---|---|---|---|---|---|---|
| Thaps_hclust_0173 |
 |
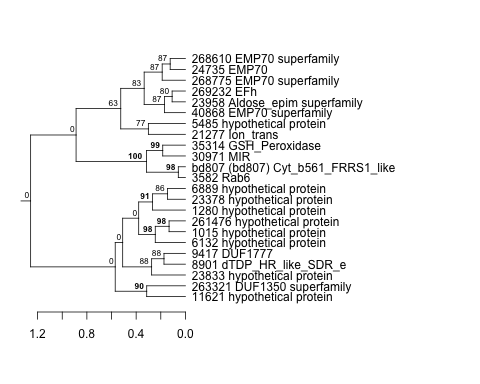 |
0.013 |
0.83 |
0.45 |
diel_light_vs_dark | 0.037100 | 0.392 |
| Title | Cluster Plot | Dendrogram | e-value | e-value | e-value | Condition | Condition FDR | Condition Difference |
|---|---|---|---|---|---|---|---|---|
| Thaps_hclust_0052 |
 |
 |
1.4e-22 |
3.3e-19 |
0.0000000000037 |
lowN_TMEVA | 0.037200 | -0.464 |
| Title | Cluster Plot | Dendrogram | e-value | e-value | e-value | Condition | Condition FDR | Condition Difference |
|---|---|---|---|---|---|---|---|---|
| Thaps_hclust_0140 |
 |
 |
0.0000000084 |
0.000091 |
0.0000072 |
highpH_TMEVA | 0.037300 | 0.311 |
| Title | Cluster Plot | Dendrogram | e-value | e-value | e-value | Condition | Condition FDR | Condition Difference |
|---|---|---|---|---|---|---|---|---|
| Thaps_hclust_0458 |
 |
 |
0.0000000041 |
0.000000022 |
0.0024 |
lowtemp_TMEVA | 0.037300 | 0.466 |
| Title | Cluster Plot | Dendrogram | e-value | e-value | e-value | Condition | Condition FDR | Condition Difference |
|---|---|---|---|---|---|---|---|---|
| Thaps_hclust_0036 |
 |
 |
0.0000003 |
0.00016 |
110 |
co2_elevated_expo_arrays | 0.037300 | 0.231 |
| Title | Cluster Plot | Dendrogram | e-value | e-value | e-value | Condition | Condition FDR | Condition Difference |
|---|---|---|---|---|---|---|---|---|
| Thaps_hclust_0116 |
 |
 |
0.74 |
8.1 |
4.9 |
co2_elevated_expo_arrays | 0.037300 | -0.304 |
| Title | Cluster Plot | Dendrogram | e-value | e-value | e-value | Condition | Condition FDR | Condition Difference |
|---|---|---|---|---|---|---|---|---|
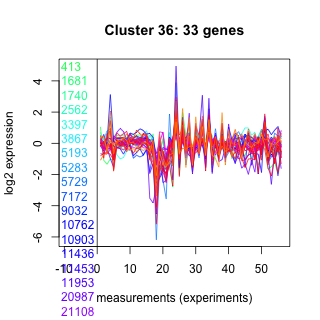
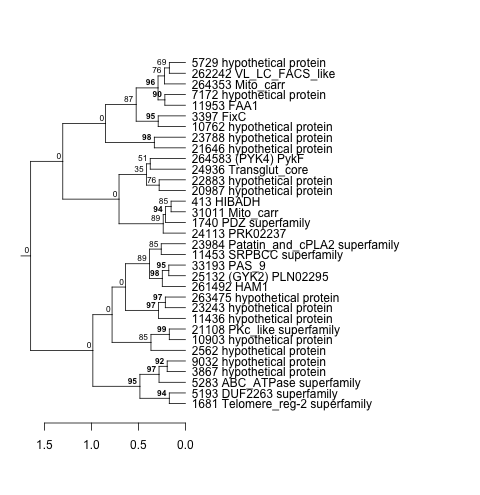
| Thaps_hclust_0412 |
 |
 |
0.39 |
17 |
2.9 |
co2_elevated_stat_arrays | 0.037800 | -0.531 |
| Title | Cluster Plot | Dendrogram | e-value | e-value | e-value | Condition | Condition FDR | Condition Difference |
|---|---|---|---|---|---|---|---|---|
| Thaps_hclust_0468 |
 |
 |
0.0023 |
0.08 |
2.3 |
co2_elevated_stat_arrays | 0.037800 | 0.381 |
| Title | Cluster Plot | Dendrogram | e-value | e-value | e-value | Condition | Condition FDR | Condition Difference |
|---|---|---|---|---|---|---|---|---|
| Thaps_hclust_0004 |
 |
 |
0.000000074 |
0.0000031 |
0.0000044 |
BaP | 0.038000 | 0.326 |
| Title | Cluster Plot | Dendrogram | e-value | e-value | e-value | Condition | Condition FDR | Condition Difference |
|---|---|---|---|---|---|---|---|---|
| Thaps_hclust_0129 |
 |
 |
0.015 |
0.29 |
1 |
BaP | 0.038000 | 0.42 |
| Title | Cluster Plot | Dendrogram | e-value | e-value | e-value | Condition | Condition FDR | Condition Difference |
|---|---|---|---|---|---|---|---|---|
| Thaps_hclust_0073 |
 |
 |
0.013 |
0.043 |
210 |
lowN_TMEVA | 0.038000 | -0.701 |
| Title | Cluster Plot | Dendrogram | e-value | e-value | e-value | Condition | Condition FDR | Condition Difference |
|---|---|---|---|---|---|---|---|---|
| Thaps_hclust_0156 |
 |
 |
0.00054 |
0.00071 |
0.0013 |
highlight_arrays | 0.038100 | -0.277 |
| Title | Cluster Plot | Dendrogram | e-value | e-value | e-value | Condition | Condition FDR | Condition Difference |
|---|---|---|---|---|---|---|---|---|
| Thaps_hclust_0438 |
 |
 |
0.0024 |
1.5 |
3.6 |
highlight_arrays | 0.038100 | 0.277 |
| Title | Cluster Plot | Dendrogram | e-value | e-value | e-value | Condition | Condition FDR | Condition Difference |
|---|---|---|---|---|---|---|---|---|
| Thaps_hclust_0092 |
 |
|
1.3e-37 |
4.2e-20 |
0.0000000000000013 |
lowtemp_TMEVA | 0.038100 | -0.246 |
| Title | Cluster Plot | Dendrogram | e-value | e-value | e-value | Condition | Condition FDR | Condition Difference |
|---|---|---|---|---|---|---|---|---|
| Thaps_hclust_0376 |
 |
 |
0.42 |
3.3 |
2.4 |
highlight_arrays | 0.038100 | 0.446 |
| Thaps_hclust_0376 |
|
|
0.42 |
3.3 |
2.4 |
highpH_TMEVA | 0.038400 | -0.456 |
| Title | Cluster Plot | Dendrogram | e-value | e-value | e-value | Condition | Condition FDR | Condition Difference |
|---|---|---|---|---|---|---|---|---|
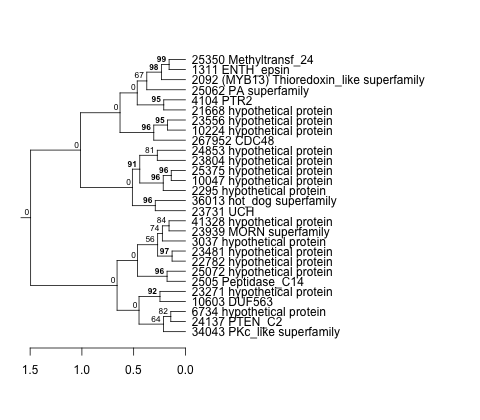
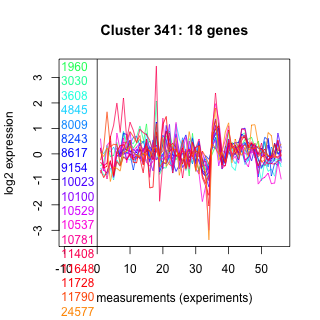
| Thaps_hclust_0341 |
 |
 |
74 |
110 |
130 |
highlight_arrays | 0.038100 | 0.334 |
| Title | Cluster Plot | Dendrogram | e-value | e-value | e-value | Condition | Condition FDR | Condition Difference |
|---|---|---|---|---|---|---|---|---|
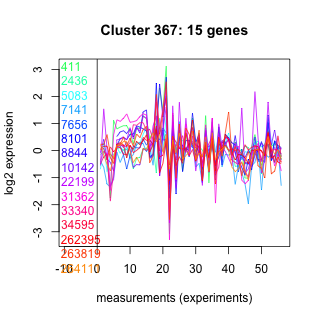
| Thaps_hclust_0362 |
 |
 |
0.00003 |
0.0033 |
0.66 |
lowtemp_TMEVA | 0.038200 | -0.535 |
| Title | Cluster Plot | Dendrogram | e-value | e-value | e-value | Condition | Condition FDR | Condition Difference |
|---|---|---|---|---|---|---|---|---|
| Thaps_hclust_0367 |
 |
 |
0.027 |
0.079 |
0.86 |
diel_exponential_vs_stationary | 0.038300 | -0.418 |
| Title | Cluster Plot | Dendrogram | e-value | e-value | e-value | Condition | Condition FDR | Condition Difference |
|---|---|---|---|---|---|---|---|---|
| Thaps_hclust_0211 |
 |
 |
0.000000055 |
0.00014 |
0.026 |
BaP | 0.038400 | 0.335 |
| Title | Cluster Plot | Dendrogram | e-value | e-value | e-value | Condition | Condition FDR | Condition Difference |
|---|---|---|---|---|---|---|---|---|
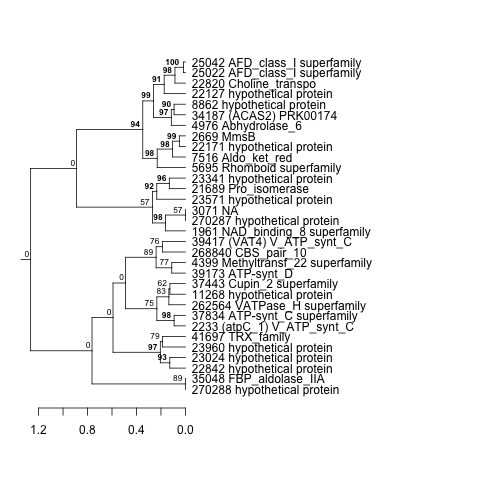
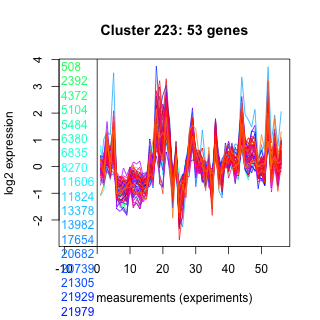
| Thaps_hclust_0223 |
 |
 |
1.70006e-41 |
0.000000000000099 |
0.0011 |
highlight_arrays | 0.038400 | 0.205 |
| Title | Cluster Plot | Dendrogram | e-value | e-value | e-value | Condition | Condition FDR | Condition Difference |
|---|---|---|---|---|---|---|---|---|
| Thaps_hclust_0463 |
 |
 |
0.0000000063 |
0.000000075 |
0.78 |
lowFe_TMEVA | 0.038500 | 0.401 |
| Title | Cluster Plot | Dendrogram | e-value | e-value | e-value | Condition | Condition FDR | Condition Difference |
|---|---|---|---|---|---|---|---|---|
| Thaps_hclust_0409 |
 |
 |
0.0000000066 |
0.0028 |
0.21 |
co2_elevated_stat_arrays | 0.038600 | -0.413 |
| Title | Cluster Plot | Dendrogram | e-value | e-value | e-value | Condition | Condition FDR | Condition Difference |
|---|---|---|---|---|---|---|---|---|
| Thaps_hclust_0074 |
 |
 |
77 |
130 |
300 |
diel_exponential_vs_stationary | 0.038700 | 0.501 |
| Title | Cluster Plot | Dendrogram | e-value | e-value | e-value | Condition | Condition FDR | Condition Difference |
|---|---|---|---|---|---|---|---|---|
| Thaps_hclust_0356 |
 |
 |
2.1 |
41 |
71 |
highpH_TMEVA | 0.038800 | 0.518 |
| Title | Cluster Plot | Dendrogram | e-value | e-value | e-value | Condition | Condition FDR | Condition Difference |
|---|---|---|---|---|---|---|---|---|
| Thaps_hclust_0172 |
 |
 |
0.000001 |
0.000011 |
0.014 |
diel_light_vs_dark | 0.038900 | 0.306 |
| Title | Cluster Plot | Dendrogram | e-value | e-value | e-value | Condition | Condition FDR | Condition Difference |
|---|---|---|---|---|---|---|---|---|
| Thaps_hclust_0030 |
 |
 |
0.000056 |
0.048 |
0.088 |
highpH_TMEVA | 0.038900 | -0.303 |
| Title | Cluster Plot | Dendrogram | e-value | e-value | e-value | Condition | Condition FDR | Condition Difference |
|---|---|---|---|---|---|---|---|---|
| Thaps_hclust_0397 |
 |
 |
0.00003 |
0.00016 |
0.0062 |
lowtemp_TMEVA | 0.039000 | -0.378 |
| Title | Cluster Plot | Dendrogram | e-value | e-value | e-value | Condition | Condition FDR | Condition Difference |
|---|---|---|---|---|---|---|---|---|
| Thaps_hclust_0110 |
 |
 |
0.64 |
35 |
160 |
co2_elevated_stat_arrays | 0.039400 | 0.636 |
| Title | Cluster Plot | Dendrogram | e-value | e-value | e-value | Condition | Condition FDR | Condition Difference |
|---|---|---|---|---|---|---|---|---|
| Thaps_hclust_0011 |
 |
 |
0.000023 |
10 |
1.3 |
lowFe_TMEVA | 0.040000 | -0.543 |
| Title | Cluster Plot | Dendrogram | e-value | e-value | e-value | Condition | Condition FDR | Condition Difference |
|---|---|---|---|---|---|---|---|---|
| Thaps_hclust_0162 |
 |
 |
0.032 |
3.2 |
58 |
lowFe_TMEVA | 0.040100 | -0.573 |
| Title | Cluster Plot | Dendrogram | e-value | e-value | e-value | Condition | Condition FDR | Condition Difference |
|---|---|---|---|---|---|---|---|---|
| Thaps_hclust_0416 |
 |
 |
0.00000015 |
0.00000035 |
0.7 |
diel_light_vs_dark | 0.040100 | 0.326 |
| Title | Cluster Plot | Dendrogram | e-value | e-value | e-value | Condition | Condition FDR | Condition Difference |
|---|---|---|---|---|---|---|---|---|
| Thaps_hclust_0012 |
 |
 |
0.000000000019 |
0.0000000000016 |
0.0000013 |
diel_exponential_vs_stationary | 0.040200 | -0.308 |
| Title | Cluster Plot | Dendrogram | e-value | e-value | e-value | Condition | Condition FDR | Condition Difference |
|---|---|---|---|---|---|---|---|---|
| Thaps_hclust_0491 |
 |
 |
0.35 |
17 |
52 |
exponential_vs_stationary_24highlight | 0.040300 | -0.28 |
| Title | Cluster Plot | Dendrogram | e-value | e-value | e-value | Condition | Condition FDR | Condition Difference |
|---|---|---|---|---|---|---|---|---|
| Thaps_hclust_0152 |
 |
 |
0.00015 |
0.00023 |
0.031 |
exponential_vs_stationary_24highlight | 0.040300 | -0.318 |
| Title | Cluster Plot | Dendrogram | e-value | e-value | e-value | Condition | Condition FDR | Condition Difference |
|---|---|---|---|---|---|---|---|---|
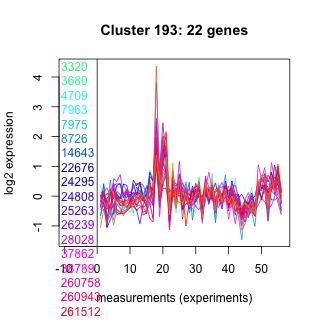
| Thaps_hclust_0193 |
 |
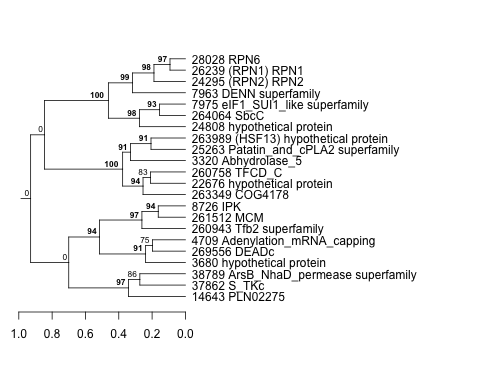 |
0.00027 |
0.013 |
6.2 |
exponential_vs_stationary_24highlight | 0.040300 | 0.201 |