Hierarchical Clusters
Displaying 1301 - 1400 of 7500
| Title | Cluster Plot | Dendrogram | e-value | e-value | e-value | Condition | Condition FDR | Condition Difference |
|---|---|---|---|---|---|---|---|---|
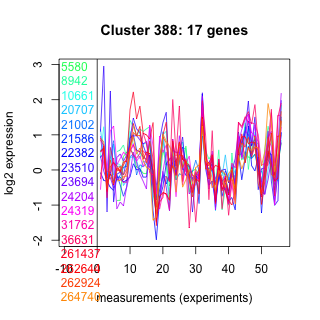
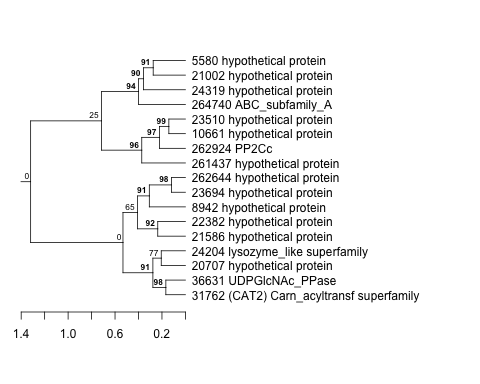
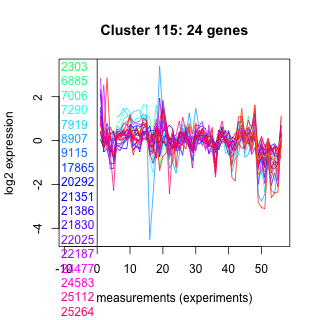
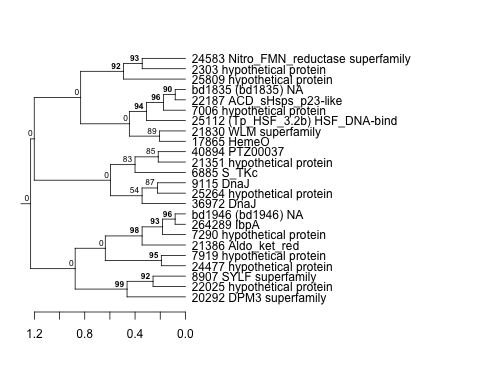
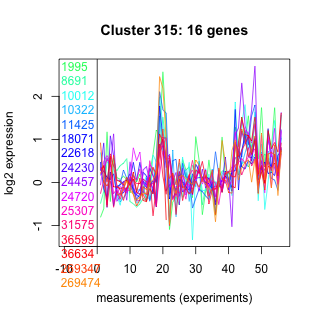
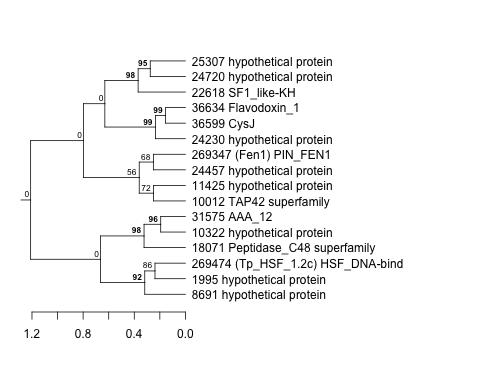
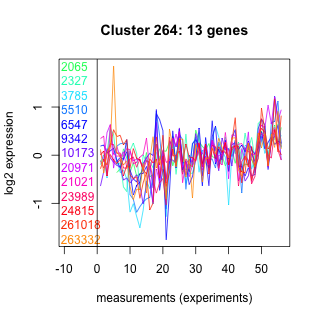
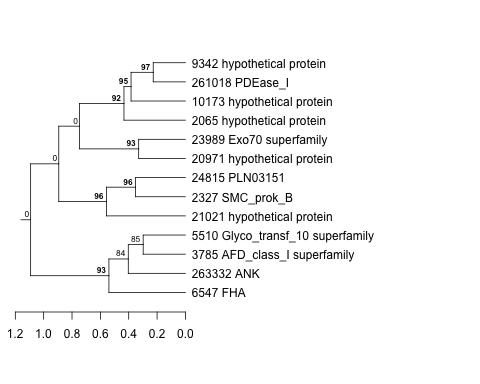
| Thaps_hclust_0284 |
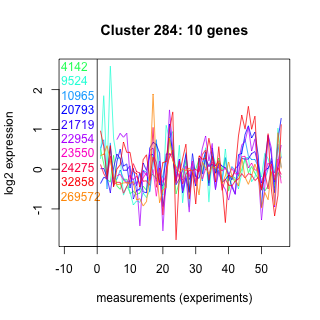 |
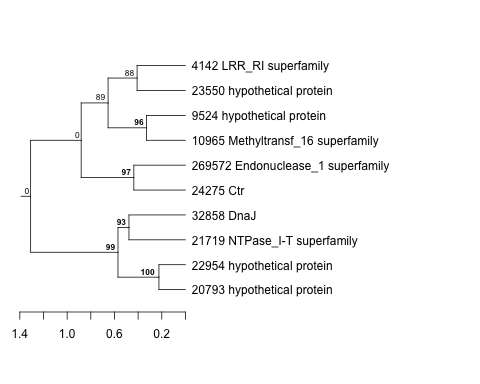 |
0.0011 |
0.067 |
0.038 |
highpH_TMEVA | 0.176000 | 0.295 |
| Title | Cluster Plot | Dendrogram | e-value | e-value | e-value | Condition | Condition FDR | Condition Difference |
|---|---|---|---|---|---|---|---|---|
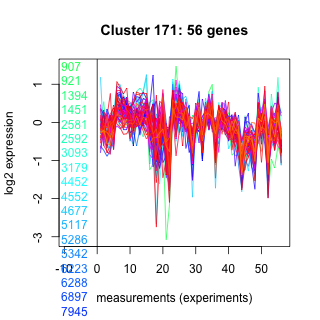
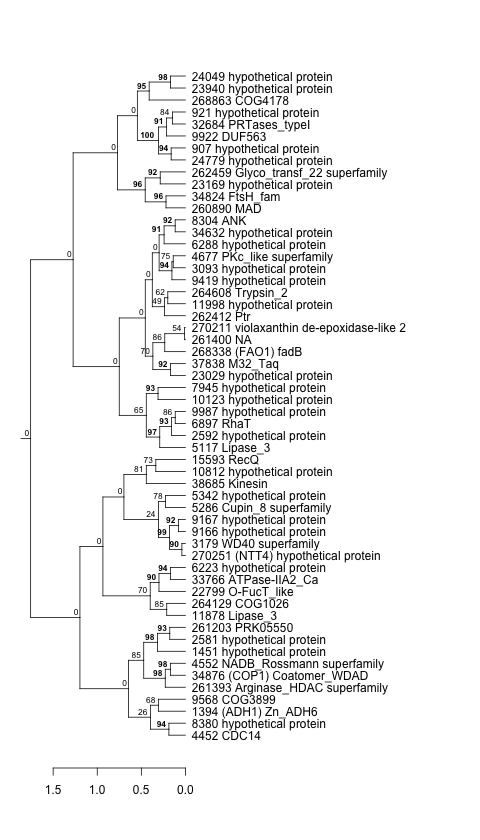
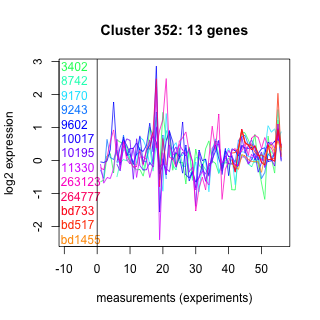
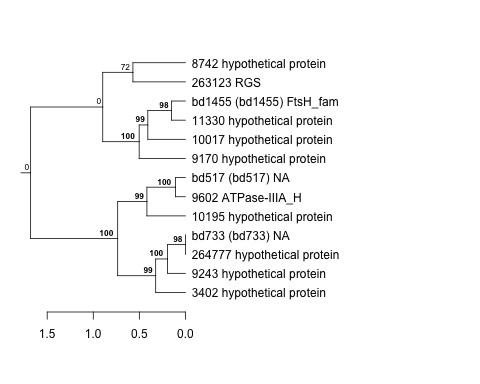
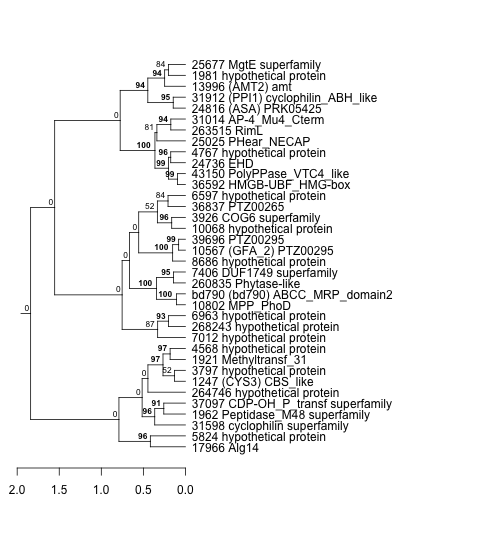
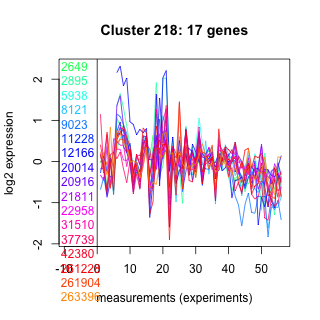
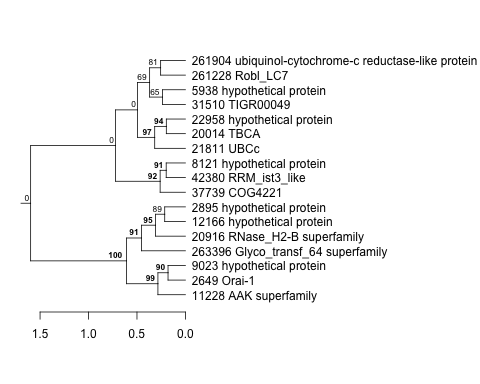
| Thaps_hclust_0206 |
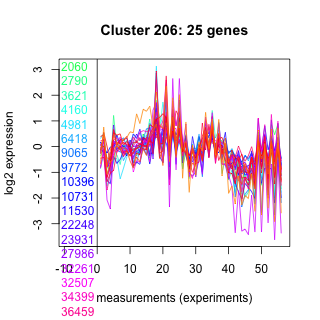 |
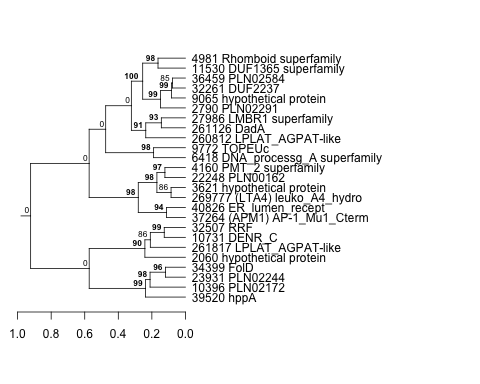 |
0.00000000000075 |
0.0000028 |
3.5 |
lowFe_KTKB_Day5 | 0.090100 | 0.295 |
| Thaps_hclust_0206 |
|
|
0.00000000000075 |
0.0000028 |
3.5 |
lowFe_KTKB_Day3 | 0.172000 | 0.28 |
| Title | Cluster Plot | Dendrogram | e-value | e-value | e-value | Condition | Condition FDR | Condition Difference |
|---|---|---|---|---|---|---|---|---|
| Thaps_hclust_0061 |
 |
 |
0.000000062 |
0.00063 |
0.032 |
diel_exponential_vs_stationary | 0.187000 | 0.295 |
| Title | Cluster Plot | Dendrogram | e-value | e-value | e-value | Condition | Condition FDR | Condition Difference |
|---|---|---|---|---|---|---|---|---|
| Thaps_hclust_0278 |
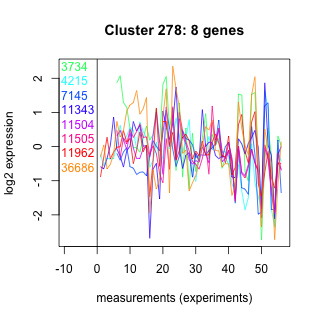 |
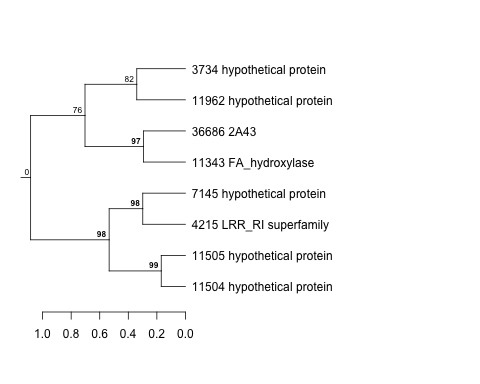 |
0.093 |
0.57 |
39 |
exponential_vs_stationary_24highlight | 0.075600 | 0.295 |
| Title | Cluster Plot | Dendrogram | e-value | e-value | e-value | Condition | Condition FDR | Condition Difference |
|---|---|---|---|---|---|---|---|---|
| Thaps_hclust_0443 |
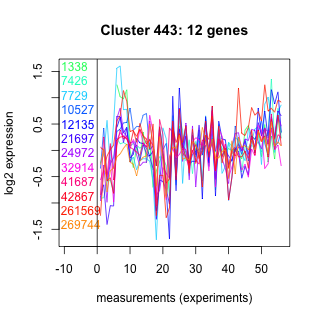 |
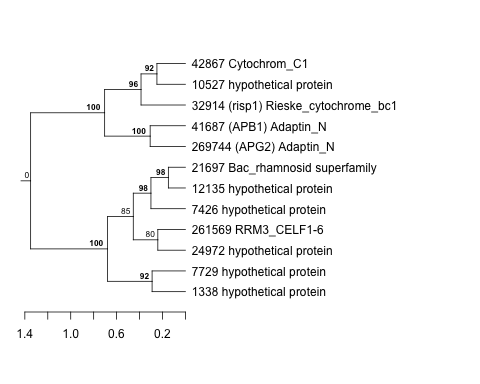 |
0.96 |
9.8 |
42 |
exponential_vs_stationary_24light | 0.482000 | 0.295 |
| Title | Cluster Plot | Dendrogram | e-value | e-value | e-value | Condition | Condition FDR | Condition Difference |
|---|---|---|---|---|---|---|---|---|
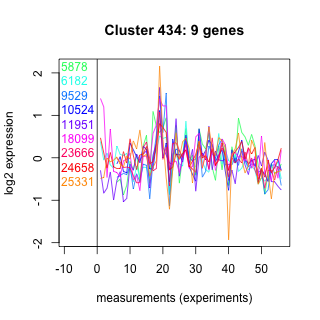
| Thaps_hclust_0434 |
 |
 |
0.011 |
17 |
57 |
highpH_TMEVA | 0.183000 | 0.295 |
| Title | Cluster Plot | Dendrogram | e-value | e-value | e-value | Condition | Condition FDR | Condition Difference |
|---|---|---|---|---|---|---|---|---|
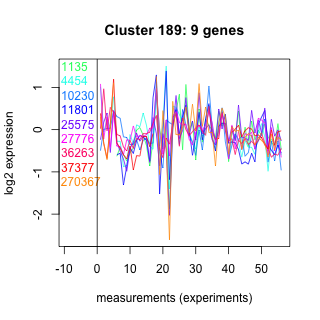
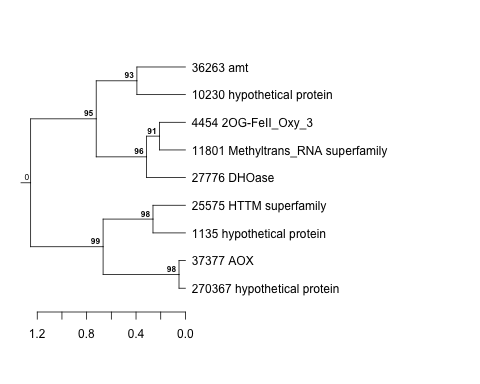
| Thaps_hclust_0189 |
 |
 |
0.0012 |
0.00048 |
0.015 |
highpH_TMEVA | 0.182000 | 0.295 |
| Thaps_hclust_0189 |
|
|
0.0012 |
0.00048 |
0.015 |
exponential_vs_stationary_24light | 0.562000 | 0.282 |
| Title | Cluster Plot | Dendrogram | e-value | e-value | e-value | Condition | Condition FDR | Condition Difference |
|---|---|---|---|---|---|---|---|---|
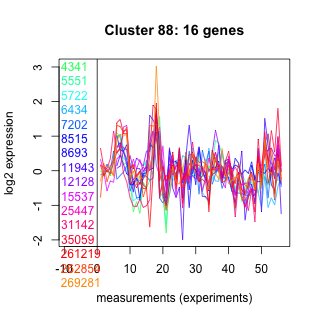
| Thaps_hclust_0088 |
 |
 |
0.036 |
27 |
18 |
co2_elevated_expo_arrays | 0.047900 | 0.295 |
| Title | Cluster Plot | Dendrogram | e-value | e-value | e-value | Condition | Condition FDR | Condition Difference |
|---|---|---|---|---|---|---|---|---|
| Thaps_hclust_0087 |
 |
 |
0.00000000000011 |
0.000026 |
0.028 |
co2_elevated_expo_arrays | 0.006820 | 0.295 |
| Thaps_hclust_0087 |
|
|
0.00000000000011 |
0.000026 |
0.028 |
lowFe_TMEVA | 0.218000 | 0.289 |
| Title | Cluster Plot | Dendrogram | e-value | e-value | e-value | Condition | Condition FDR | Condition Difference |
|---|---|---|---|---|---|---|---|---|
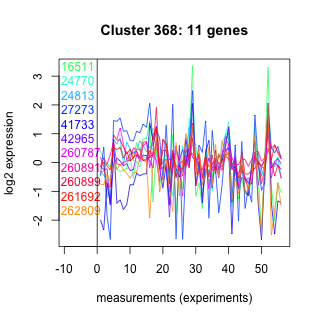
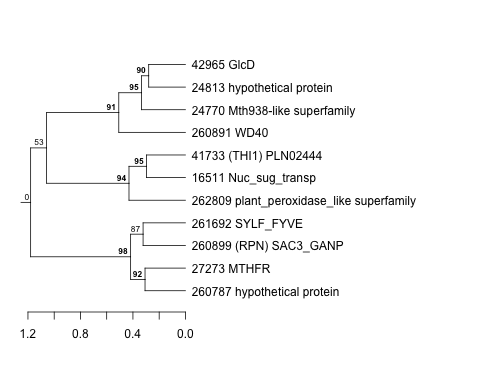
| Thaps_hclust_0368 |
 |
 |
0.0078 |
2.5 |
3.1 |
lowFe_KTKB_Day5 | 0.274000 | 0.295 |
| Title | Cluster Plot | Dendrogram | e-value | e-value | e-value | Condition | Condition FDR | Condition Difference |
|---|---|---|---|---|---|---|---|---|
| Thaps_hclust_0085 |
 |
 |
0.000012 |
0.0024 |
0.37 |
lowFe_KTKB_Day5 | 0.090100 | 0.294 |
| Thaps_hclust_0085 |
|
|
0.000012 |
0.0024 |
0.37 |
diel_exponential_vs_stationary | 0.059600 | 0.283 |
| Title | Cluster Plot | Dendrogram | e-value | e-value | e-value | Condition | Condition FDR | Condition Difference |
|---|---|---|---|---|---|---|---|---|
| Thaps_hclust_0444 |
 |
 |
14 |
140 |
1.6 |
highlight_arrays | 0.060700 | 0.294 |
| Title | Cluster Plot | Dendrogram | e-value | e-value | e-value | Condition | Condition FDR | Condition Difference |
|---|---|---|---|---|---|---|---|---|
| Thaps_hclust_0333 |
 |
 |
0.00062 |
4 |
17 |
lowN_TMEVA | 0.351000 | 0.294 |
| Thaps_hclust_0333 |
|
|
0.00062 |
4 |
17 |
lowFe_KTKB_Day5 | 0.095200 | 0.294 |
| Title | Cluster Plot | Dendrogram | e-value | e-value | e-value | Condition | Condition FDR | Condition Difference |
|---|---|---|---|---|---|---|---|---|
| Thaps_hclust_0103 |
 |
 |
3.4 |
4.8 |
21 |
lowtemp_TMEVA | 0.330000 | 0.294 |
| Title | Cluster Plot | Dendrogram | e-value | e-value | e-value | Condition | Condition FDR | Condition Difference |
|---|---|---|---|---|---|---|---|---|
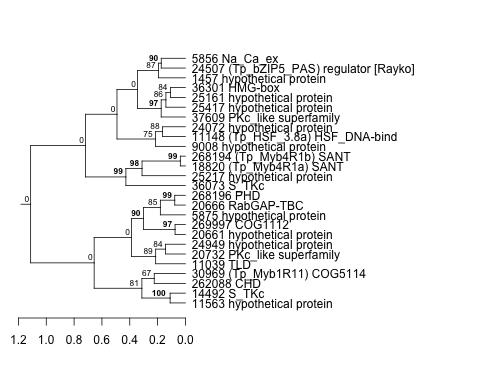
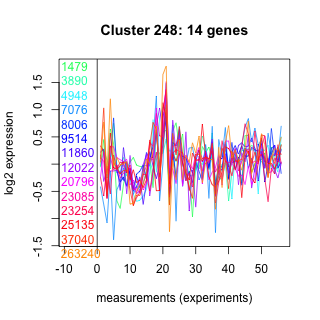
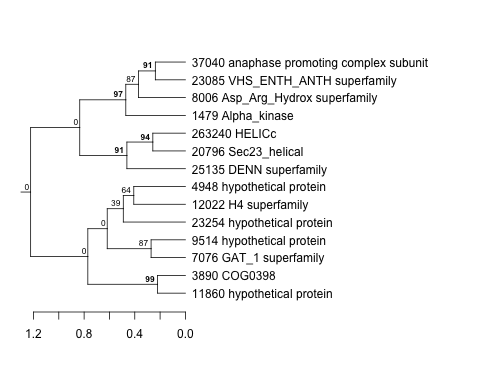
| Thaps_hclust_0248 |
 |
 |
0.000037 |
0.000078 |
39 |
diel_light_vs_dark | 0.237000 | 0.294 |
| Title | Cluster Plot | Dendrogram | e-value | e-value | e-value | Condition | Condition FDR | Condition Difference |
|---|---|---|---|---|---|---|---|---|
| Thaps_hclust_0014 |
 |
 |
Not available | Not available | Not available | co2_elevated_expo_arrays | 0.001390 | 0.294 |
| Title | Cluster Plot | Dendrogram | e-value | e-value | e-value | Condition | Condition FDR | Condition Difference |
|---|---|---|---|---|---|---|---|---|
| Thaps_hclust_0123 |
 |
 |
0.000073 |
0.05 |
0.076 |
highpH_TMEVA | 0.017100 | 0.293 |
| Title | Cluster Plot | Dendrogram | e-value | e-value | e-value | Condition | Condition FDR | Condition Difference |
|---|---|---|---|---|---|---|---|---|
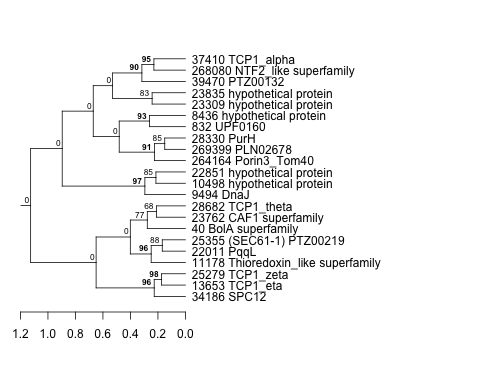
| Thaps_hclust_0050 |
 |
 |
0.0000000011 |
0.0000042 |
0.00021 |
lowtemp_TMEVA | 0.222000 | 0.293 |
| Title | Cluster Plot | Dendrogram | e-value | e-value | e-value | Condition | Condition FDR | Condition Difference |
|---|---|---|---|---|---|---|---|---|
| Thaps_hclust_0330 |
 |
 |
0.0000058 |
0.00000085 |
0.000041 |
lowFe_TMEVA | 0.216000 | 0.293 |
| Title | Cluster Plot | Dendrogram | e-value | e-value | e-value | Condition | Condition FDR | Condition Difference |
|---|---|---|---|---|---|---|---|---|
| Thaps_hclust_0142 |
 |
 |
0.000000000000013 |
0.0000000004 |
0.001 |
highlight_arrays | 0.002540 | 0.293 |
| Thaps_hclust_0142 |
|
|
0.000000000000013 |
0.0000000004 |
0.001 |
highpH_TMEVA | 0.005560 | 0.291 |
| Title | Cluster Plot | Dendrogram | e-value | e-value | e-value | Condition | Condition FDR | Condition Difference |
|---|---|---|---|---|---|---|---|---|
| Thaps_hclust_0466 |
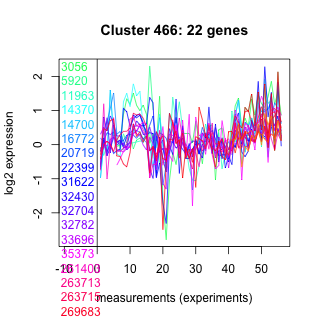 |
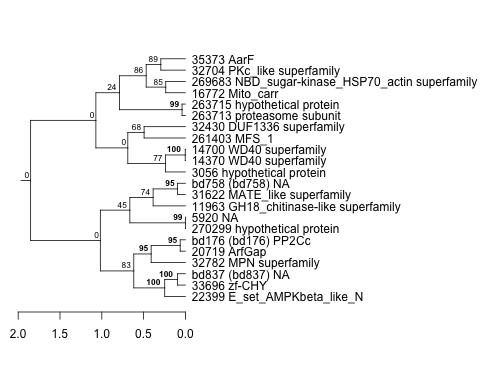 |
0.0000055 |
0.000014 |
0.0017 |
diel_exponential_vs_stationary | 0.071100 | 0.292 |
| Title | Cluster Plot | Dendrogram | e-value | e-value | e-value | Condition | Condition FDR | Condition Difference |
|---|---|---|---|---|---|---|---|---|
| Thaps_hclust_0017 |
 |
 |
4.6e-24 |
0.00000000000046 |
0.000000000000098 |
co2_elevated_stat_arrays | 0.064400 | 0.292 |
| Title | Cluster Plot | Dendrogram | e-value | e-value | e-value | Condition | Condition FDR | Condition Difference |
|---|---|---|---|---|---|---|---|---|
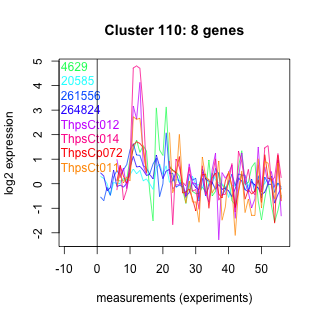
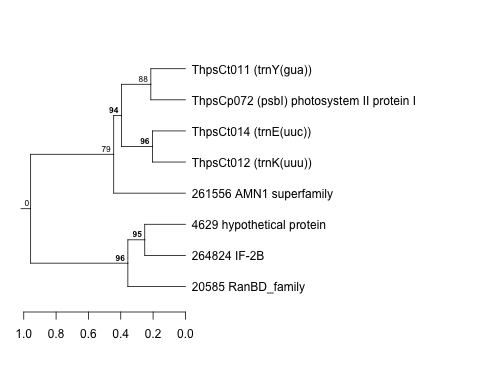
| Thaps_hclust_0110 |
 |
 |
0.64 |
35 |
160 |
lowtemp_TMEVA | 0.445000 | 0.292 |
| Title | Cluster Plot | Dendrogram | e-value | e-value | e-value | Condition | Condition FDR | Condition Difference |
|---|---|---|---|---|---|---|---|---|
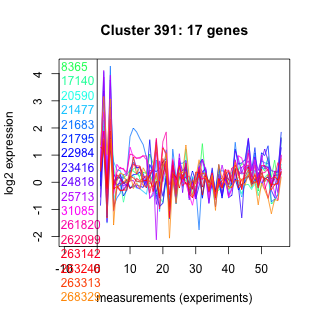
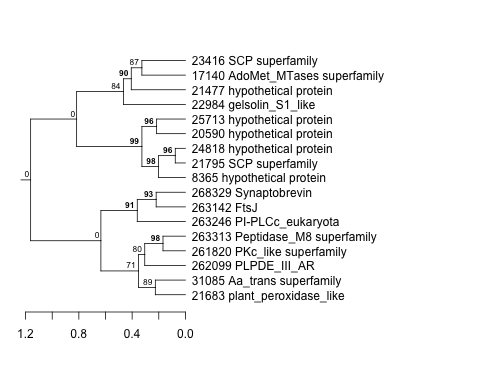
| Thaps_hclust_0391 |
 |
 |
1.9 |
34 |
32 |
BaP | 0.227000 | 0.292 |
| Title | Cluster Plot | Dendrogram | e-value | e-value | e-value | Condition | Condition FDR | Condition Difference |
|---|---|---|---|---|---|---|---|---|
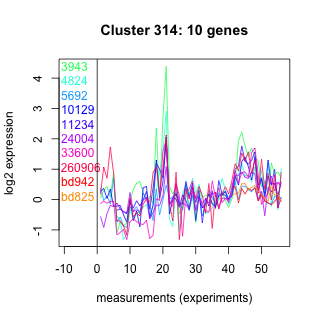
| Thaps_hclust_0314 |
 |
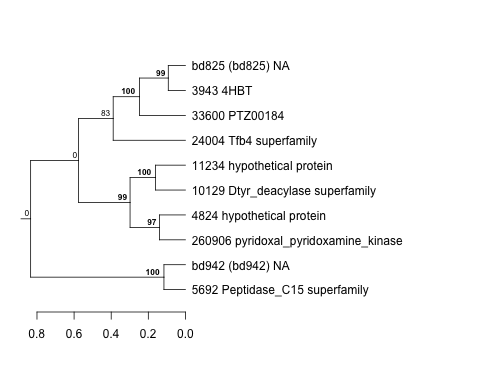 |
0.052 |
1.9 |
8.5 |
lowSi_TMEVA | 0.758000 | 0.292 |
| Title | Cluster Plot | Dendrogram | e-value | e-value | e-value | Condition | Condition FDR | Condition Difference |
|---|---|---|---|---|---|---|---|---|
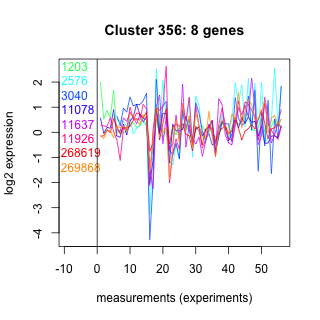
| Thaps_hclust_0356 |
 |
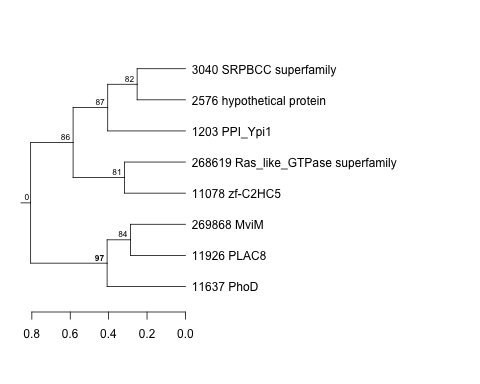 |
2.1 |
41 |
71 |
lowN_TMEVA | 0.524000 | 0.291 |
| Thaps_hclust_0356 |
|
|
2.1 |
41 |
71 |
lowSi_TMEVA | 0.806000 | 0.277 |
| Title | Cluster Plot | Dendrogram | e-value | e-value | e-value | Condition | Condition FDR | Condition Difference |
|---|---|---|---|---|---|---|---|---|
| Thaps_hclust_0111 |
 |
 |
0.00032 |
0.0074 |
0.8 |
lowtemp_TMEVA | 0.317000 | 0.291 |
| Title | Cluster Plot | Dendrogram | e-value | e-value | e-value | Condition | Condition FDR | Condition Difference |
|---|---|---|---|---|---|---|---|---|
| Thaps_hclust_0181 |
 |
 |
0.000000035 |
0.14 |
0.84 |
diel_exponential_vs_stationary | 0.128000 | 0.291 |
| Title | Cluster Plot | Dendrogram | e-value | e-value | e-value | Condition | Condition FDR | Condition Difference |
|---|---|---|---|---|---|---|---|---|
| Thaps_hclust_0388 |
 |
 |
0.0000000024 |
23 |
380 |
lowSi_TMEVA | 0.723000 | 0.291 |
| Title | Cluster Plot | Dendrogram | e-value | e-value | e-value | Condition | Condition FDR | Condition Difference |
|---|---|---|---|---|---|---|---|---|
| Thaps_hclust_0351 |
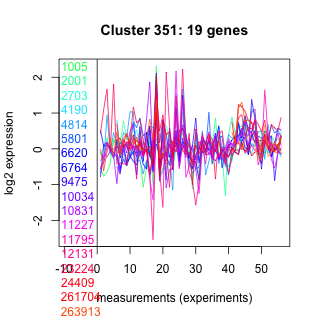 |
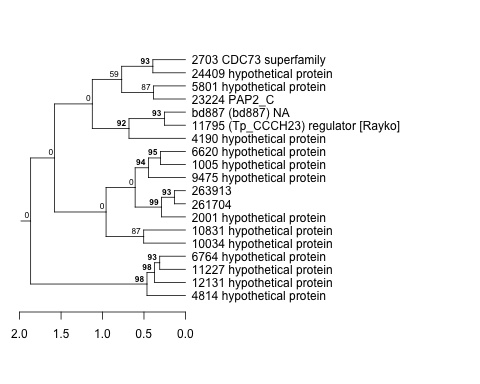 |
0.033 |
0.06 |
50 |
diel_exponential_vs_stationary | 0.101000 | 0.291 |
| Title | Cluster Plot | Dendrogram | e-value | e-value | e-value | Condition | Condition FDR | Condition Difference |
|---|---|---|---|---|---|---|---|---|
| Thaps_hclust_0083 |
 |
 |
0.0039 |
6.3 |
14 |
lowFe_TMEVA | 0.316000 | 0.291 |
| Title | Cluster Plot | Dendrogram | e-value | e-value | e-value | Condition | Condition FDR | Condition Difference |
|---|---|---|---|---|---|---|---|---|
| Thaps_hclust_0007 |
 |
 |
0.0000000001 |
0.0000000097 |
0.000027 |
exponential_vs_stationary_24highlight | 0.000526 | 0.291 |
| Title | Cluster Plot | Dendrogram | e-value | e-value | e-value | Condition | Condition FDR | Condition Difference |
|---|---|---|---|---|---|---|---|---|
| Thaps_hclust_0320 |
 |
 |
0.0000055 |
0.32 |
8.8 |
lowtemp_TMEVA | 0.130000 | 0.291 |
| Title | Cluster Plot | Dendrogram | e-value | e-value | e-value | Condition | Condition FDR | Condition Difference |
|---|---|---|---|---|---|---|---|---|
| Thaps_hclust_0387 |
 |
 |
0.0023 |
0.003 |
0.38 |
lowSi_TMEVA | 0.702000 | 0.29 |
| Title | Cluster Plot | Dendrogram | e-value | e-value | e-value | Condition | Condition FDR | Condition Difference |
|---|---|---|---|---|---|---|---|---|
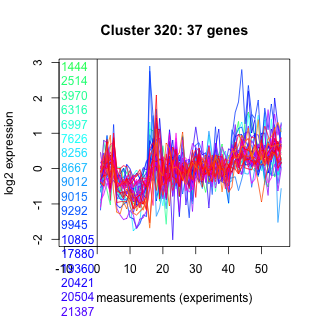
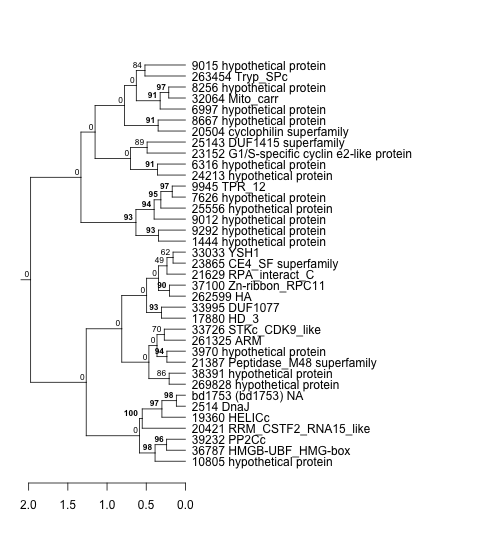
| Thaps_hclust_0332 |
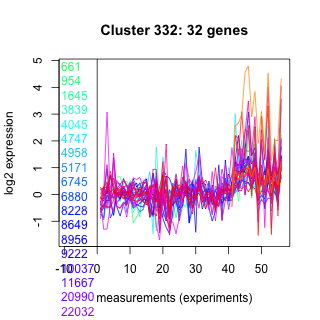 |
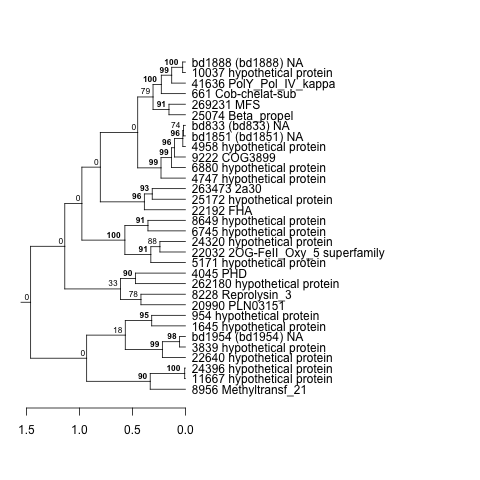 |
0.000000055 |
0.0000013 |
0.0037 |
highlight_arrays | 0.019300 | 0.289 |
| Title | Cluster Plot | Dendrogram | e-value | e-value | e-value | Condition | Condition FDR | Condition Difference |
|---|---|---|---|---|---|---|---|---|
| Thaps_hclust_0303 |
 |
 |
0.00096 |
0.0021 |
0.0014 |
co2_elevated_expo_arrays | 0.009180 | 0.288 |
| Title | Cluster Plot | Dendrogram | e-value | e-value | e-value | Condition | Condition FDR | Condition Difference |
|---|---|---|---|---|---|---|---|---|
| Thaps_hclust_0324 |
 |
 |
0.0023 |
2.4 |
5.1 |
lowSi_TMEVA | 0.723000 | 0.288 |
| Title | Cluster Plot | Dendrogram | e-value | e-value | e-value | Condition | Condition FDR | Condition Difference |
|---|---|---|---|---|---|---|---|---|
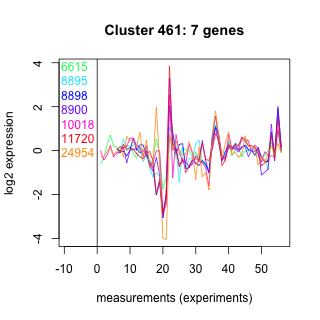
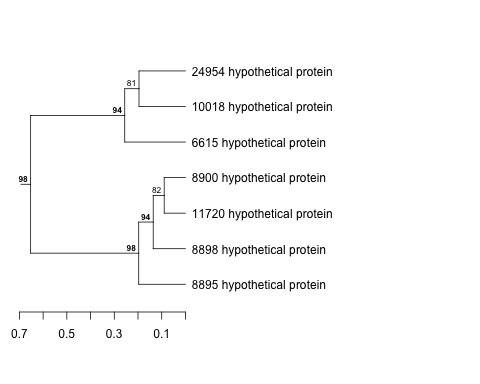
| Thaps_hclust_0461 |
 |
 |
0.00000000082 |
0.01 |
0.079 |
diel_exponential_vs_stationary | 0.350000 | 0.288 |
| Title | Cluster Plot | Dendrogram | e-value | e-value | e-value | Condition | Condition FDR | Condition Difference |
|---|---|---|---|---|---|---|---|---|
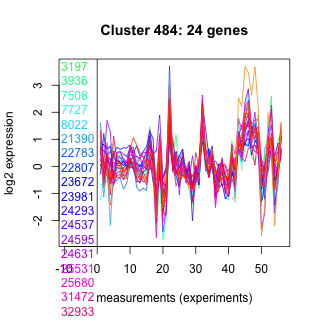
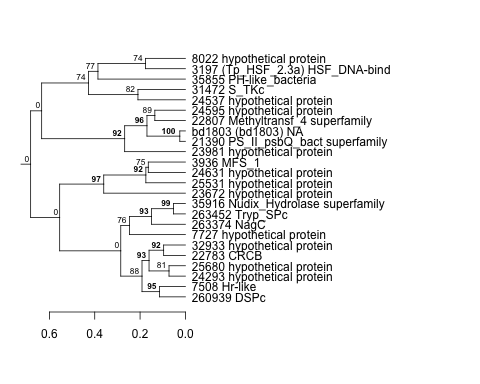
| Thaps_hclust_0484 |
 |
 |
0.024 |
0.26 |
5.1 |
exponential_vs_stationary_24light | 0.353000 | 0.288 |
| Title | Cluster Plot | Dendrogram | e-value | e-value | e-value | Condition | Condition FDR | Condition Difference |
|---|---|---|---|---|---|---|---|---|
| Thaps_hclust_0115 |
 |
 |
0.00037 |
0.044 |
0.46 |
BaP | 0.137000 | 0.288 |
| Title | Cluster Plot | Dendrogram | e-value | e-value | e-value | Condition | Condition FDR | Condition Difference |
|---|---|---|---|---|---|---|---|---|
| Thaps_hclust_0171 |
 |
 |
0.0000000000052 |
0.000000000056 |
0.000000000083 |
exponential_vs_stationary_24highlight | 0.000526 | 0.287 |
| Title | Cluster Plot | Dendrogram | e-value | e-value | e-value | Condition | Condition FDR | Condition Difference |
|---|---|---|---|---|---|---|---|---|
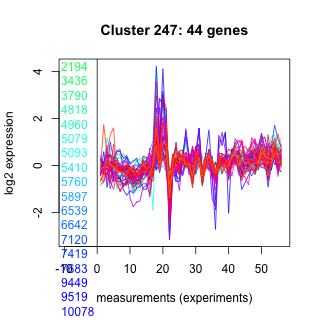
| Thaps_hclust_0247 |
 |
 |
8.7e-16 |
0.00000000045 |
0.0000019 |
diel_light_vs_dark | 0.028000 | 0.287 |
| Title | Cluster Plot | Dendrogram | e-value | e-value | e-value | Condition | Condition FDR | Condition Difference |
|---|---|---|---|---|---|---|---|---|
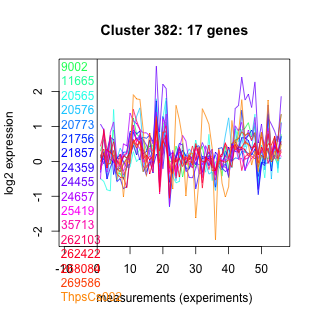
| Thaps_hclust_0382 |
 |
 |
0.0000042 |
0.012 |
0.055 |
lowFe_KTKB_Day3 | 0.276000 | 0.286 |
| Title | Cluster Plot | Dendrogram | e-value | e-value | e-value | Condition | Condition FDR | Condition Difference |
|---|---|---|---|---|---|---|---|---|
| Thaps_hclust_0244 |
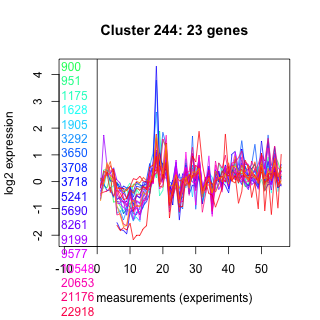 |
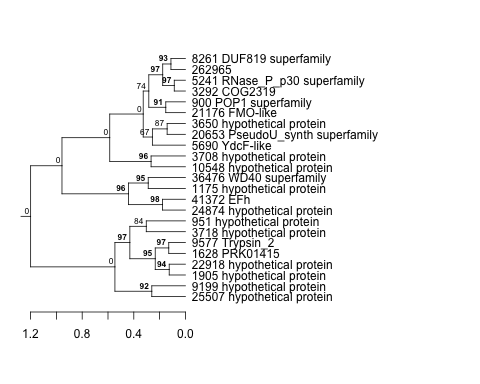 |
0.000000057 |
0.0001 |
4.1 |
lowN_TMEVA | 0.382000 | 0.286 |
| Thaps_hclust_0244 |
|
|
0.000000057 |
0.0001 |
4.1 |
lowFe_KTKB_Day5 | 0.125000 | 0.284 |
| Title | Cluster Plot | Dendrogram | e-value | e-value | e-value | Condition | Condition FDR | Condition Difference |
|---|---|---|---|---|---|---|---|---|
| Thaps_hclust_0390 |
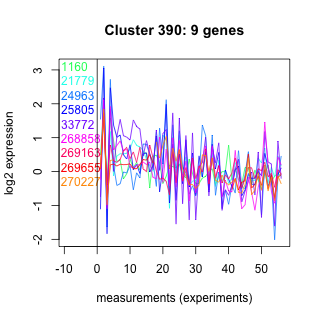 |
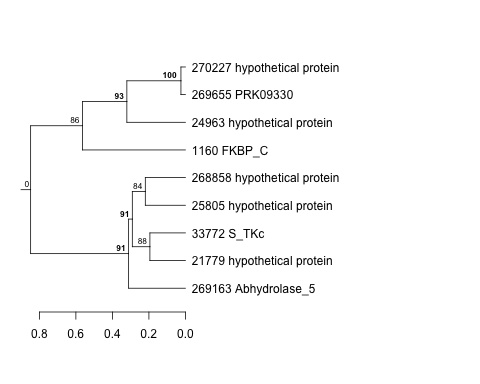 |
0.013 |
0.066 |
0.15 |
lowFe_KTKB_Day3 | 0.446000 | 0.286 |
| Thaps_hclust_0390 |
|
|
0.013 |
0.066 |
0.15 |
co2_elevated_expo_arrays | 0.211000 | 0.275 |
| Title | Cluster Plot | Dendrogram | e-value | e-value | e-value | Condition | Condition FDR | Condition Difference |
|---|---|---|---|---|---|---|---|---|
| Thaps_hclust_0315 |
 |
 |
0.01 |
0.93 |
0.53 |
highlight_arrays | 0.098100 | 0.286 |
| Title | Cluster Plot | Dendrogram | e-value | e-value | e-value | Condition | Condition FDR | Condition Difference |
|---|---|---|---|---|---|---|---|---|
| Thaps_hclust_0352 |
 |
 |
8.7 |
78 |
79 |
lowFe_KTKB_Day5 | 0.260000 | 0.286 |
| Title | Cluster Plot | Dendrogram | e-value | e-value | e-value | Condition | Condition FDR | Condition Difference |
|---|---|---|---|---|---|---|---|---|
| Thaps_hclust_0436 |
 |
 |
0.067 |
0.93 |
0.55 |
lowFe_KTKB_Day5 | 0.231000 | 0.285 |
| Title | Cluster Plot | Dendrogram | e-value | e-value | e-value | Condition | Condition FDR | Condition Difference |
|---|---|---|---|---|---|---|---|---|
| Thaps_hclust_0035 |
 |
 |
0.00023 |
0.0000098 |
0.064 |
highpH_TMEVA | 0.097700 | 0.285 |
| Title | Cluster Plot | Dendrogram | e-value | e-value | e-value | Condition | Condition FDR | Condition Difference |
|---|---|---|---|---|---|---|---|---|
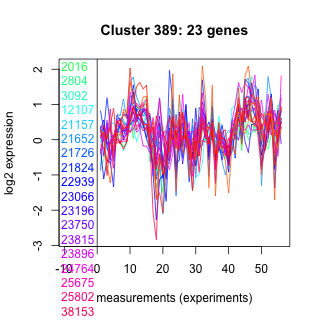
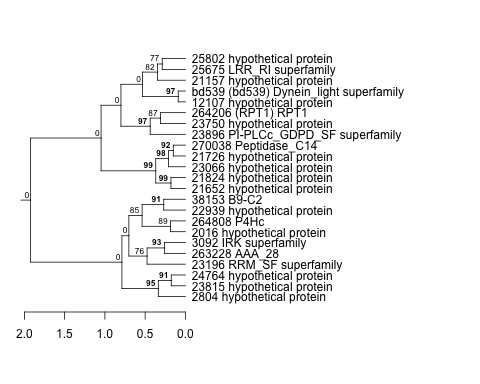
| Thaps_hclust_0389 |
 |
 |
0.00000008 |
0.00077 |
340 |
highlight_arrays | 0.050500 | 0.285 |
| Title | Cluster Plot | Dendrogram | e-value | e-value | e-value | Condition | Condition FDR | Condition Difference |
|---|---|---|---|---|---|---|---|---|
| Thaps_hclust_0380 |
 |
 |
1.1 |
5 |
8.7 |
highpH_TMEVA | 0.108000 | 0.285 |
| Title | Cluster Plot | Dendrogram | e-value | e-value | e-value | Condition | Condition FDR | Condition Difference |
|---|---|---|---|---|---|---|---|---|
| Thaps_hclust_0175 |
 |
 |
0.00000000000027 |
0.0000042 |
0.58 |
diel_exponential_vs_stationary | 0.019100 | 0.285 |
| Title | Cluster Plot | Dendrogram | e-value | e-value | e-value | Condition | Condition FDR | Condition Difference |
|---|---|---|---|---|---|---|---|---|
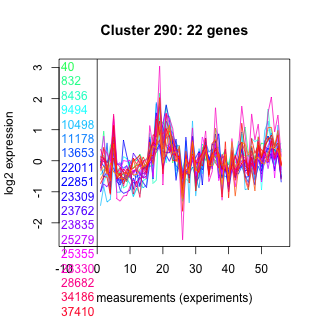
| Thaps_hclust_0149 |
 |
 |
0.00000027 |
0.46 |
3 |
lowtemp_TMEVA | 0.263000 | 0.285 |
| Title | Cluster Plot | Dendrogram | e-value | e-value | e-value | Condition | Condition FDR | Condition Difference |
|---|---|---|---|---|---|---|---|---|
| Thaps_hclust_0042 |
 |
 |
0.26 |
5.9 |
0.46 |
lowN_TMEVA | 0.469000 | 0.284 |
| Title | Cluster Plot | Dendrogram | e-value | e-value | e-value | Condition | Condition FDR | Condition Difference |
|---|---|---|---|---|---|---|---|---|
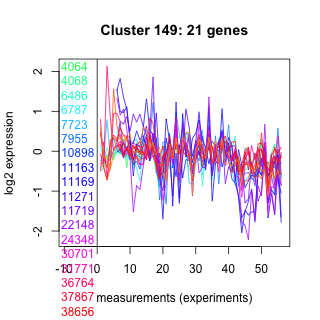
| Thaps_hclust_0290 |
 |
 |
3e-16 |
0.014 |
0.072 |
diel_light_vs_dark | 0.142000 | 0.284 |
| Thaps_hclust_0290 |
|
|
3e-16 |
0.014 |
0.072 |
co2_elevated_stat_arrays | 0.200000 | 0.279 |
| Title | Cluster Plot | Dendrogram | e-value | e-value | e-value | Condition | Condition FDR | Condition Difference |
|---|---|---|---|---|---|---|---|---|
| Thaps_hclust_0203 |
 |
 |
0.00051 |
1.2 |
1.3 |
lowtemp_TMEVA | 0.297000 | 0.284 |
| Title | Cluster Plot | Dendrogram | e-value | e-value | e-value | Condition | Condition FDR | Condition Difference |
|---|---|---|---|---|---|---|---|---|
| Thaps_hclust_0311 |
 |
 |
4.1 |
0.64 |
12 |
lowN_TMEVA | 0.469000 | 0.284 |
| Title | Cluster Plot | Dendrogram | e-value | e-value | e-value | Condition | Condition FDR | Condition Difference |
|---|---|---|---|---|---|---|---|---|
| Thaps_hclust_0191 |
 |
 |
1.5 |
3.5 |
44 |
lowSi_TMEVA | 0.765000 | 0.284 |
| Title | Cluster Plot | Dendrogram | e-value | e-value | e-value | Condition | Condition FDR | Condition Difference |
|---|---|---|---|---|---|---|---|---|
| Thaps_hclust_0478 |
 |
 |
0.1 |
0.0096 |
3.5 |
diel_light_vs_dark | 0.288000 | 0.283 |
| Title | Cluster Plot | Dendrogram | e-value | e-value | e-value | Condition | Condition FDR | Condition Difference |
|---|---|---|---|---|---|---|---|---|
| Thaps_hclust_0141 |
 |
 |
0.000021 |
0.0007 |
0.0051 |
lowN_TMEVA | 0.349000 | 0.283 |
| Title | Cluster Plot | Dendrogram | e-value | e-value | e-value | Condition | Condition FDR | Condition Difference |
|---|---|---|---|---|---|---|---|---|
| Thaps_hclust_0251 |
 |
 |
0.027 |
0.025 |
9.3 |
exponential_vs_stationary_24light | 0.388000 | 0.282 |
| Title | Cluster Plot | Dendrogram | e-value | e-value | e-value | Condition | Condition FDR | Condition Difference |
|---|---|---|---|---|---|---|---|---|
| Thaps_hclust_0091 |
 |
 |
0.00000061 |
0.00022 |
0.44 |
lowFe_KTKB_Day5 | 0.179000 | 0.282 |
| Title | Cluster Plot | Dendrogram | e-value | e-value | e-value | Condition | Condition FDR | Condition Difference |
|---|---|---|---|---|---|---|---|---|
| Thaps_hclust_0190 |
 |
 |
0.0000025 |
0.00027 |
0.93 |
lowFe_KTKB_Day3 | 0.284000 | 0.282 |
| Title | Cluster Plot | Dendrogram | e-value | e-value | e-value | Condition | Condition FDR | Condition Difference |
|---|---|---|---|---|---|---|---|---|
| Thaps_hclust_0180 |
 |
 |
1.5 |
1.7 |
12 |
diel_light_vs_dark | 0.370000 | 0.281 |
| Title | Cluster Plot | Dendrogram | e-value | e-value | e-value | Condition | Condition FDR | Condition Difference |
|---|---|---|---|---|---|---|---|---|
| Thaps_hclust_0037 |
 |
 |
0.23 |
0.79 |
340 |
co2_elevated_expo_arrays | 0.017000 | 0.28 |
| Title | Cluster Plot | Dendrogram | e-value | e-value | e-value | Condition | Condition FDR | Condition Difference |
|---|---|---|---|---|---|---|---|---|
| Thaps_hclust_0051 |
 |
 |
0.012 |
0.033 |
0.41 |
lowFe_KTKB_Day5 | 0.286000 | 0.279 |
| Title | Cluster Plot | Dendrogram | e-value | e-value | e-value | Condition | Condition FDR | Condition Difference |
|---|---|---|---|---|---|---|---|---|
| Thaps_hclust_0172 |
 |
 |
0.000001 |
0.000011 |
0.014 |
exponential_vs_stationary_24highlight | 0.000926 | 0.278 |
| Title | Cluster Plot | Dendrogram | e-value | e-value | e-value | Condition | Condition FDR | Condition Difference |
|---|---|---|---|---|---|---|---|---|
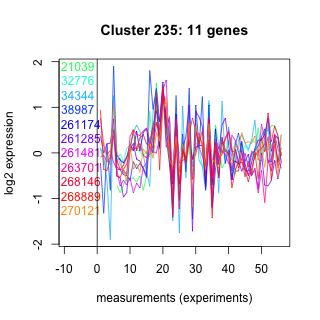
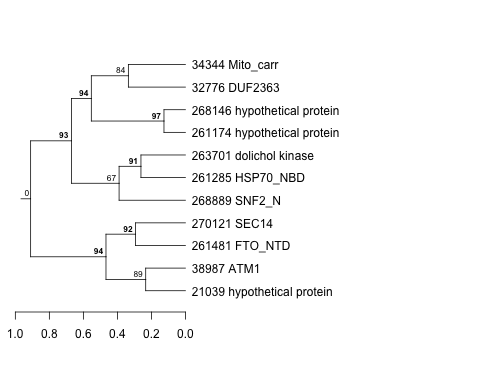
| Thaps_hclust_0235 |
 |
 |
0.47 |
5.6 |
74 |
lowFe_KTKB_Day3 | 0.405000 | 0.278 |
| Title | Cluster Plot | Dendrogram | e-value | e-value | e-value | Condition | Condition FDR | Condition Difference |
|---|---|---|---|---|---|---|---|---|
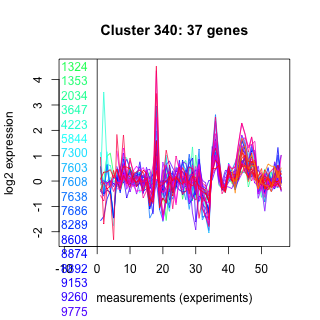
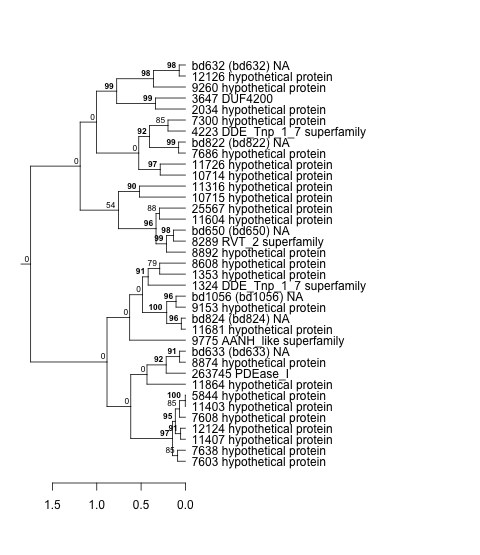
| Thaps_hclust_0340 |
 |
 |
0.00000000039 |
0.0000000031 |
0.0000002 |
co2_elevated_stat_arrays | 0.125000 | 0.278 |
| Title | Cluster Plot | Dendrogram | e-value | e-value | e-value | Condition | Condition FDR | Condition Difference |
|---|---|---|---|---|---|---|---|---|
| Thaps_hclust_0348 |
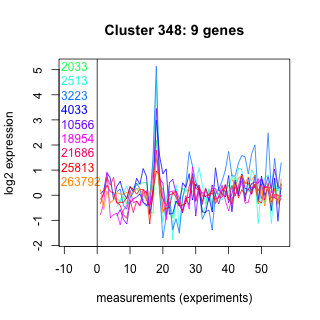 |
 |
8.7 |
34 |
60 |
highlight_arrays | 0.239000 | 0.278 |
| Title | Cluster Plot | Dendrogram | e-value | e-value | e-value | Condition | Condition FDR | Condition Difference |
|---|---|---|---|---|---|---|---|---|
| Thaps_hclust_0305 |
 |
 |
0.66 |
3.2 |
6.5 |
co2_elevated_expo_arrays | 0.021800 | 0.278 |
| Title | Cluster Plot | Dendrogram | e-value | e-value | e-value | Condition | Condition FDR | Condition Difference |
|---|---|---|---|---|---|---|---|---|
| Thaps_hclust_0185 |
 |
 |
0.000039 |
1.8 |
5.8 |
highpH_TMEVA | 0.116000 | 0.278 |
| Title | Cluster Plot | Dendrogram | e-value | e-value | e-value | Condition | Condition FDR | Condition Difference |
|---|---|---|---|---|---|---|---|---|
| Thaps_hclust_0264 |
 |
 |
0.0079 |
0.24 |
5.8 |
lowtemp_TMEVA | 0.380000 | 0.277 |
| Title | Cluster Plot | Dendrogram | e-value | e-value | e-value | Condition | Condition FDR | Condition Difference |
|---|---|---|---|---|---|---|---|---|
| Thaps_hclust_0144 |
 |
 |
0.000000001 |
0.0000000019 |
0.00000019 |
highpH_TMEVA | 0.010500 | 0.277 |
| Title | Cluster Plot | Dendrogram | e-value | e-value | e-value | Condition | Condition FDR | Condition Difference |
|---|---|---|---|---|---|---|---|---|
| Thaps_hclust_0218 |
 |
 |
0.02 |
0.065 |
7.1 |
highlight_arrays | 0.103000 | 0.277 |
| Title | Cluster Plot | Dendrogram | e-value | e-value | e-value | Condition | Condition FDR | Condition Difference |
|---|---|---|---|---|---|---|---|---|
| Thaps_hclust_0326 |
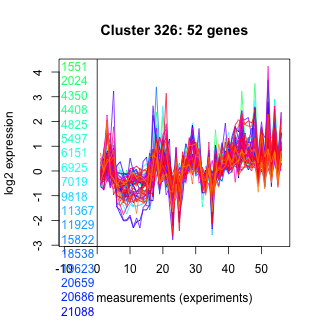 |
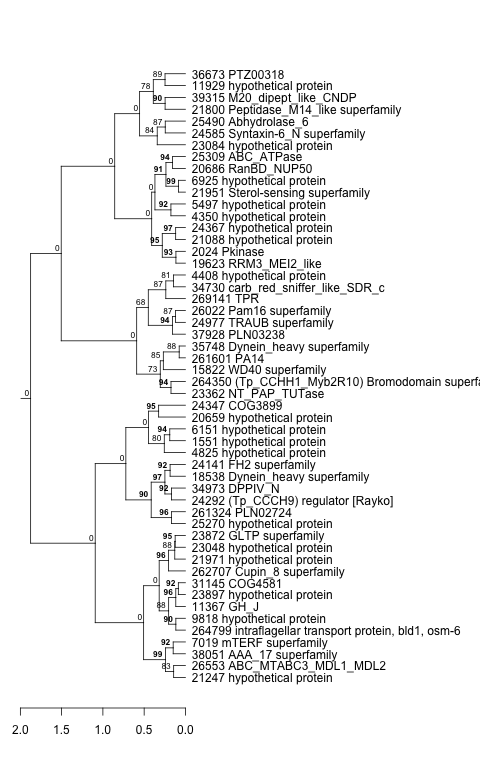 |
0.000000000000042 |
0.00000000011 |
0.00000051 |
co2_elevated_stat_arrays | 0.075700 | 0.277 |
| Title | Cluster Plot | Dendrogram | e-value | e-value | e-value | Condition | Condition FDR | Condition Difference |
|---|---|---|---|---|---|---|---|---|
| Thaps_hclust_0438 |
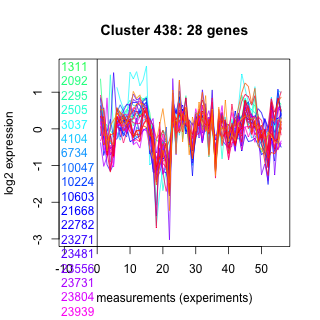 |
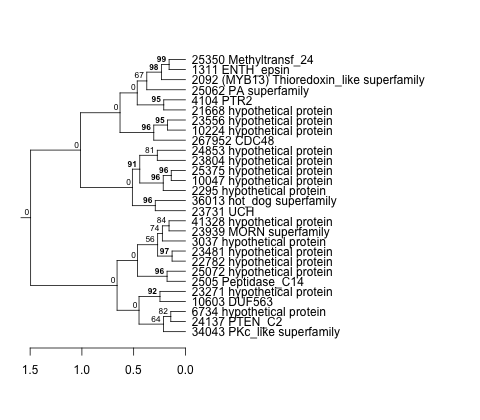 |
0.0024 |
1.5 |
3.6 |
highlight_arrays | 0.038100 | 0.277 |
| Title | Cluster Plot | Dendrogram | e-value | e-value | e-value | Condition | Condition FDR | Condition Difference |
|---|---|---|---|---|---|---|---|---|
| Thaps_hclust_0104 |
 |
 |
23 |
24 |
220 |
highpH_TMEVA | 0.204000 | 0.276 |
| Title | Cluster Plot | Dendrogram | e-value | e-value | e-value | Condition | Condition FDR | Condition Difference |
|---|---|---|---|---|---|---|---|---|
| Thaps_hclust_0283 |
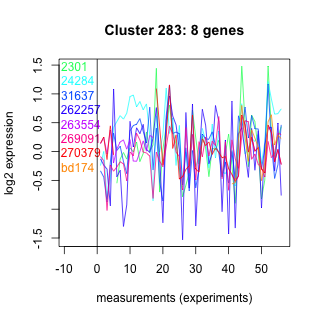 |
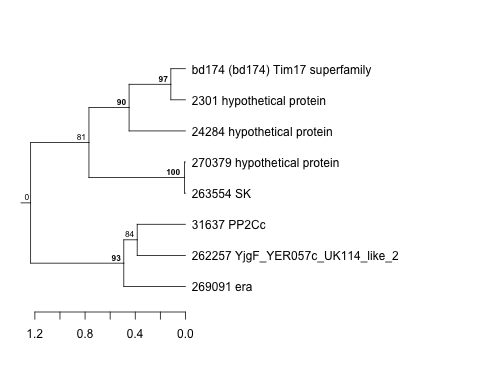 |
0.0022 |
0.0079 |
0.019 |
diel_light_vs_dark | 0.441000 | 0.276 |
| Thaps_hclust_0283 |
|
|
0.0022 |
0.0079 |
0.019 |
diel_exponential_vs_stationary | 0.351000 | 0.275 |
| Title | Cluster Plot | Dendrogram | e-value | e-value | e-value | Condition | Condition FDR | Condition Difference |
|---|---|---|---|---|---|---|---|---|
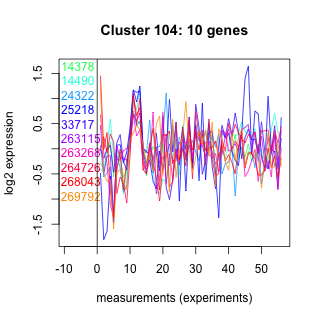
| Thaps_hclust_0253 |
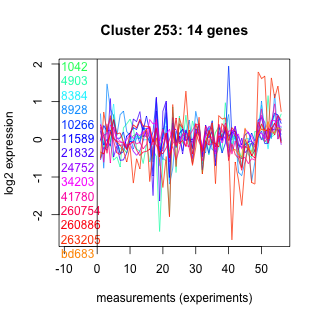 |
 |
1.5 |
61 |
370 |
diel_light_vs_dark | 0.278000 | 0.275 |
| Title | Cluster Plot | Dendrogram | e-value | e-value | e-value | Condition | Condition FDR | Condition Difference |
|---|---|---|---|---|---|---|---|---|
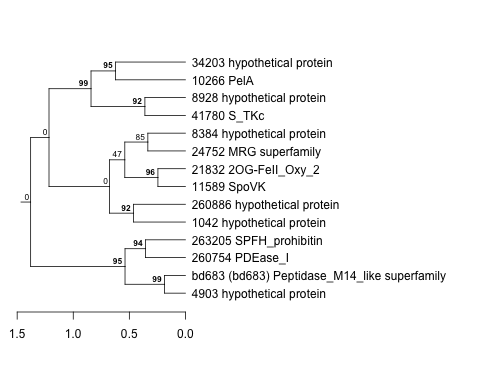
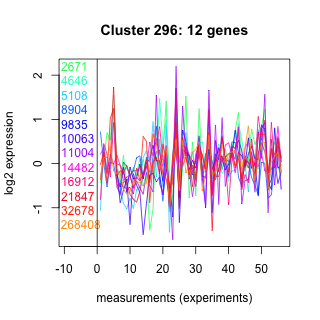
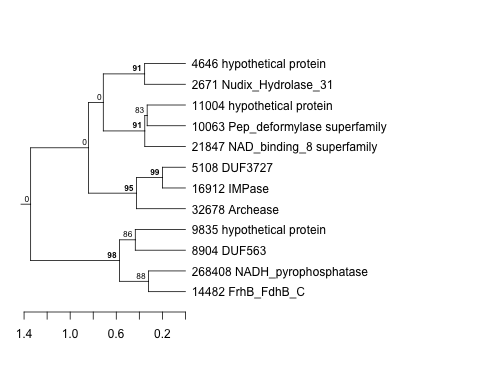
| Thaps_hclust_0296 |
 |
 |
0.17 |
1.8 |
0.83 |
co2_elevated_expo_arrays | 0.129000 | 0.275 |
| Title | Cluster Plot | Dendrogram | e-value | e-value | e-value | Condition | Condition FDR | Condition Difference |
|---|---|---|---|---|---|---|---|---|
| Thaps_hclust_0075 |
 |
 |
0.069 |
53 |
33 |
co2_elevated_expo_arrays | 0.129000 | 0.275 |
| Title | Cluster Plot | Dendrogram | e-value | e-value | e-value | Condition | Condition FDR | Condition Difference |
|---|---|---|---|---|---|---|---|---|
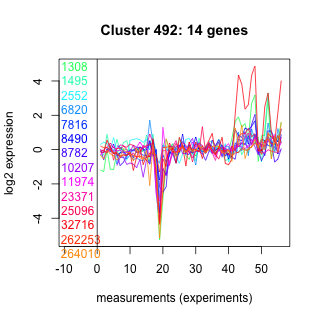
| Thaps_hclust_0492 |
 |
 |
0.29 |
0.47 |
23 |
lowFe_KTKB_Day5 | 0.260000 | 0.275 |
| Title | Cluster Plot | Dendrogram | e-value | e-value | e-value | Condition | Condition FDR | Condition Difference |
|---|---|---|---|---|---|---|---|---|
| Thaps_hclust_0018 |
 |
 |
0.065 |
0.38 |
0.16 |
lowFe_KTKB_Day5 | 0.208000 | 0.274 |
| Title | Cluster Plot | Dendrogram | e-value | e-value | e-value | Condition | Condition FDR | Condition Difference |
|---|---|---|---|---|---|---|---|---|
| Thaps_hclust_0381 |
 |
 |
0.0001 |
0.0035 |
0.061 |
co2_elevated_stat_arrays | 0.169000 | 0.274 |
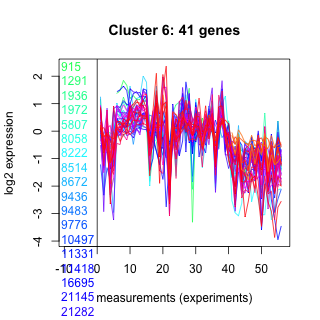
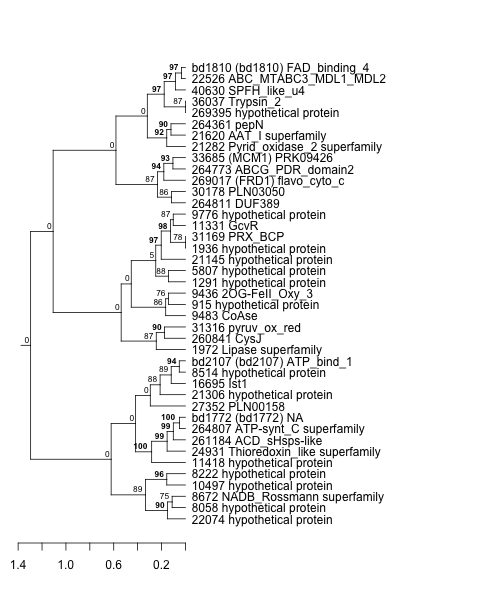
| Title | Cluster Plot | Dendrogram | e-value | e-value | e-value | Condition | Condition FDR | Condition Difference |
|---|---|---|---|---|---|---|---|---|
| Thaps_hclust_0482 |
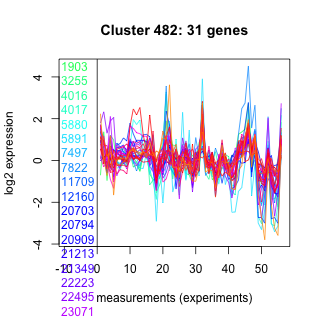 |
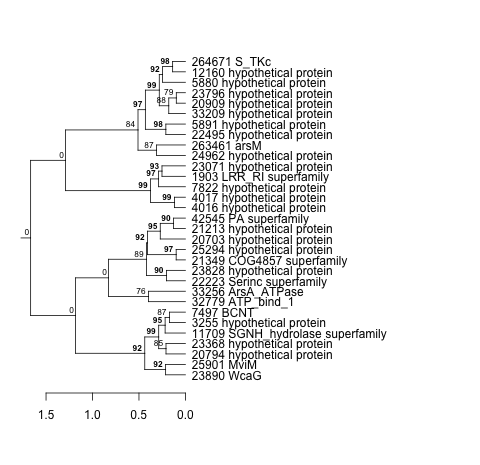 |
0.29 |
0.69 |
2.1 |
lowFe_KTKB_Day3 | 0.141000 | 0.274 |
| Title | Cluster Plot | Dendrogram | e-value | e-value | e-value | Condition | Condition FDR | Condition Difference |
|---|---|---|---|---|---|---|---|---|
| Thaps_hclust_0006 |
 |
 |
0.0000000000025 |
0.000000092 |
0.000086 |
diel_light_vs_dark | 0.043600 | 0.274 |
| Title | Cluster Plot | Dendrogram | e-value | e-value | e-value | Condition | Condition FDR | Condition Difference |
|---|---|---|---|---|---|---|---|---|
| Thaps_hclust_0102 |
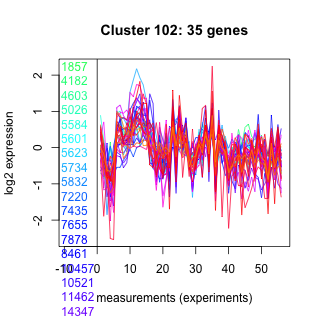 |
 |
3.2e-16 |
0.00000000002 |
0.0000006 |
diel_exponential_vs_stationary | 0.031700 | 0.273 |
| Title | Cluster Plot | Dendrogram | e-value | e-value | e-value | Condition | Condition FDR | Condition Difference |
|---|---|---|---|---|---|---|---|---|
| Thaps_hclust_0268 |
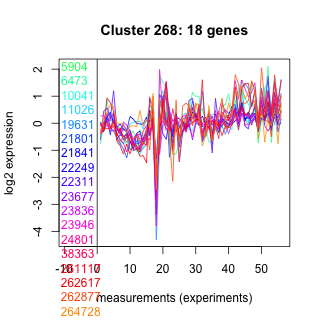 |
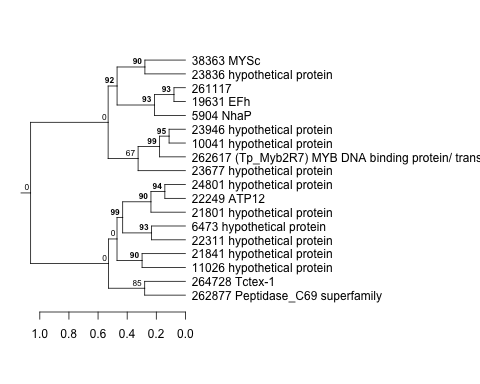 |
0.17 |
14 |
60 |
lowN_TMEVA | 0.459000 | 0.273 |