Hierarchical Clusters
Displaying 6601 - 6700 of 7500
| Title | Cluster Plot | Dendrogram | e-value | e-value | e-value | Condition | Condition FDR | Condition Difference |
|---|---|---|---|---|---|---|---|---|
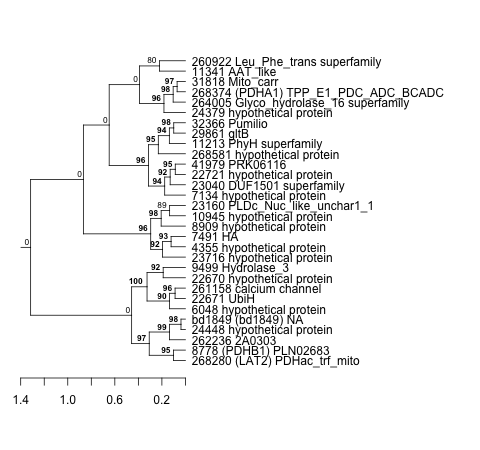
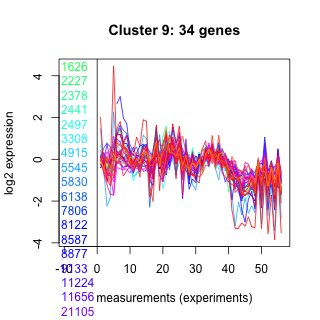
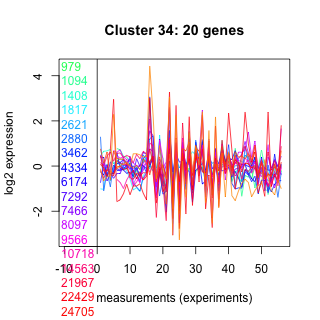
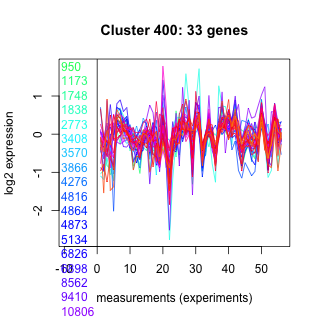
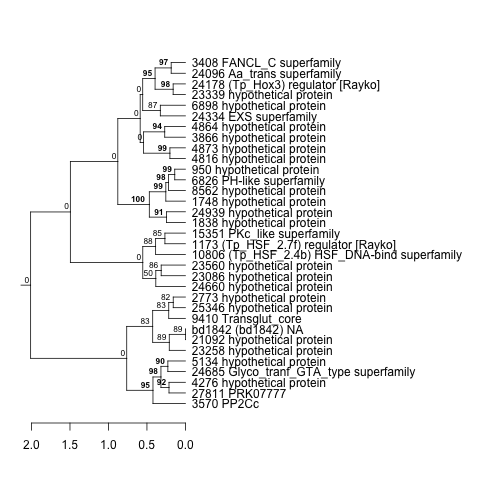
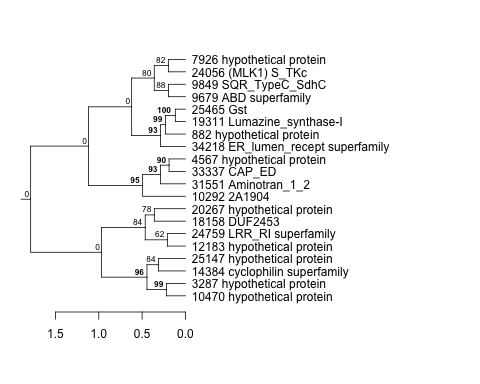
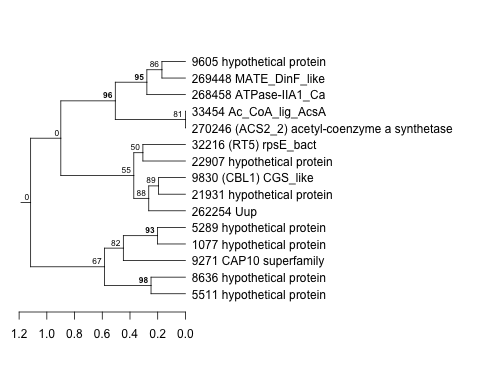
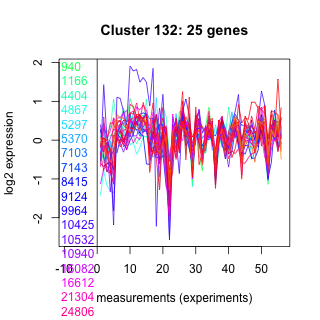
| Thaps_hclust_0116 |
 |
 |
0.74 |
8.1 |
4.9 |
diel_exponential_vs_stationary | 0.014600 | -0.483 |
| Thaps_hclust_0116 |
|
|
0.74 |
8.1 |
4.9 |
exponential_vs_stationary_24highlight | 0.000526 | -0.484 |
| Title | Cluster Plot | Dendrogram | e-value | e-value | e-value | Condition | Condition FDR | Condition Difference |
|---|---|---|---|---|---|---|---|---|
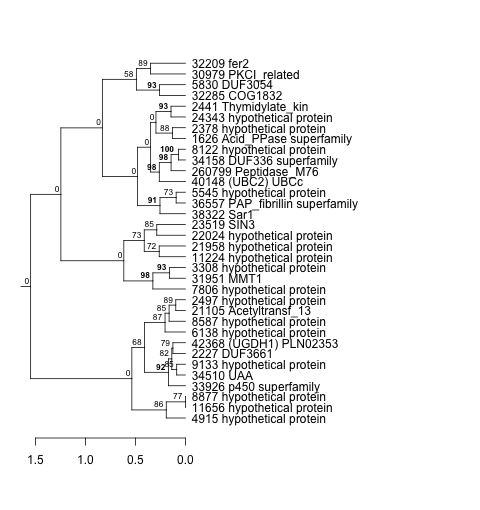
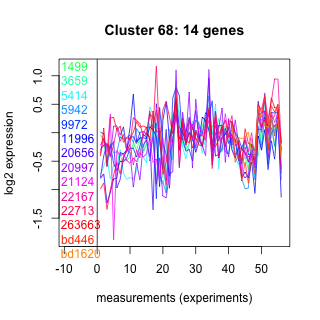
| Thaps_hclust_0033 |
 |
 |
0.000000000000011 |
0.0012 |
0.0073 |
BaP | 0.000370 | -0.483 |
| Title | Cluster Plot | Dendrogram | e-value | e-value | e-value | Condition | Condition FDR | Condition Difference |
|---|---|---|---|---|---|---|---|---|
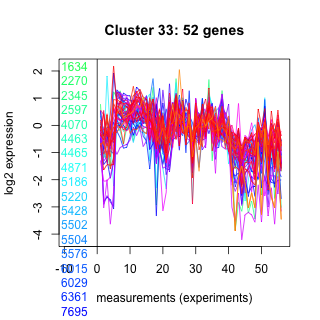
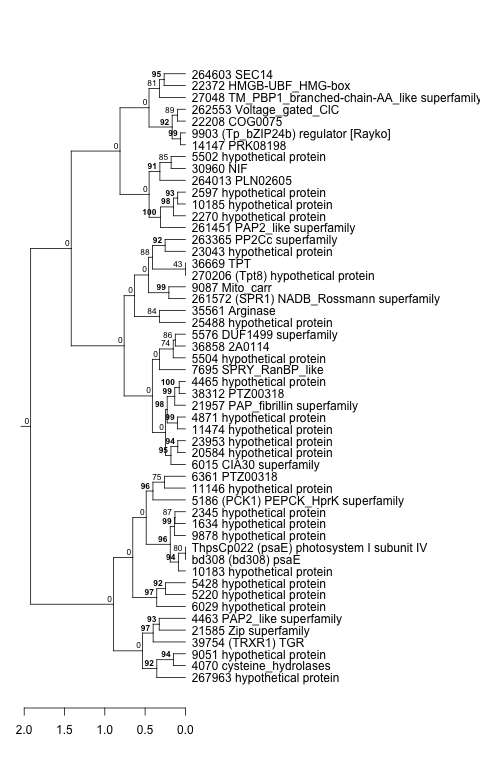
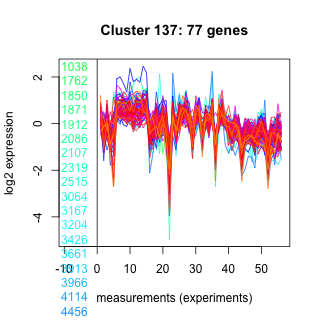
| Thaps_hclust_0137 |
 |
|
2.3e-18 |
0.00000000000062 |
0.000025 |
lowtemp_TMEVA | 0.000735 | -0.484 |
| Title | Cluster Plot | Dendrogram | e-value | e-value | e-value | Condition | Condition FDR | Condition Difference |
|---|---|---|---|---|---|---|---|---|
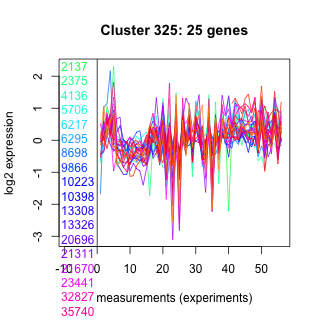
| Thaps_hclust_0325 |
 |
 |
0.00000000000002 |
0.000000076 |
0.17 |
exponential_vs_stationary_24light | 0.086100 | -0.485 |
| Title | Cluster Plot | Dendrogram | e-value | e-value | e-value | Condition | Condition FDR | Condition Difference |
|---|---|---|---|---|---|---|---|---|
| Thaps_hclust_0338 |
 |
 |
0.0000012 |
0.0000014 |
0.000012 |
lowFe_TMEVA | 0.009170 | -0.485 |
| Title | Cluster Plot | Dendrogram | e-value | e-value | e-value | Condition | Condition FDR | Condition Difference |
|---|---|---|---|---|---|---|---|---|
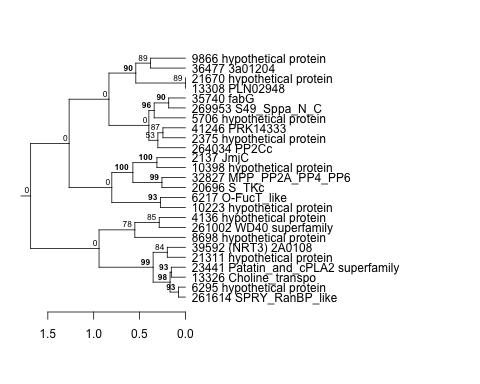
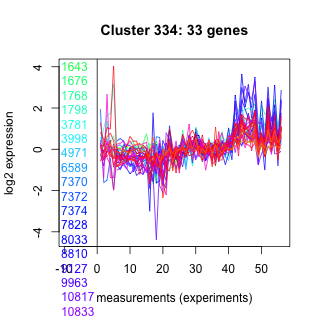
| Thaps_hclust_0334 |
 |
 |
0.51 |
0.00047 |
0.25 |
lowFe_KTKB_Day5 | 0.002440 | -0.486 |
| Title | Cluster Plot | Dendrogram | e-value | e-value | e-value | Condition | Condition FDR | Condition Difference |
|---|---|---|---|---|---|---|---|---|
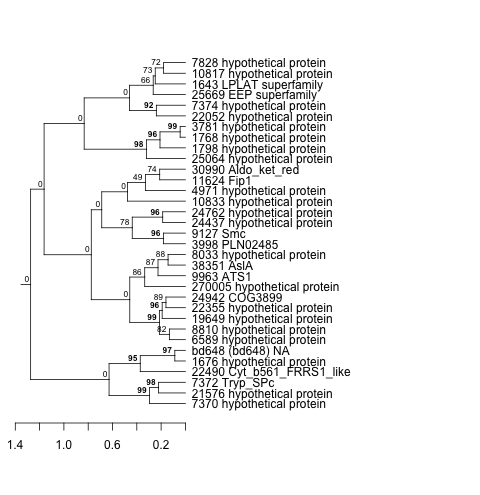
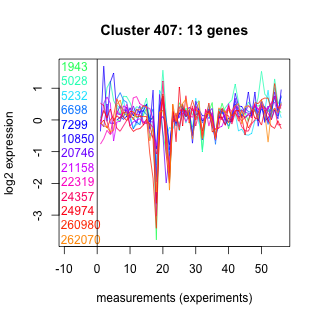
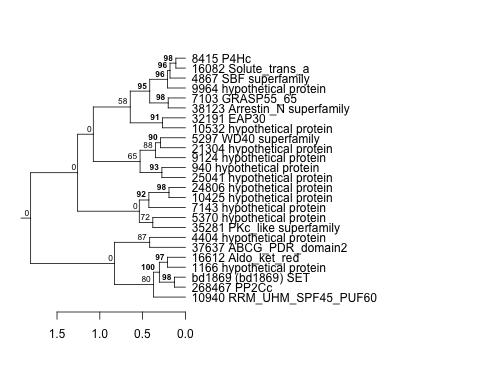
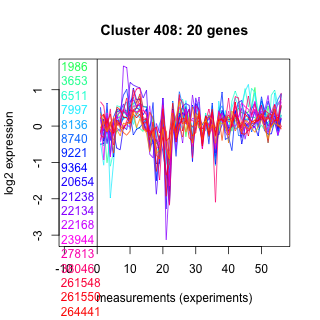
| Thaps_hclust_0407 |
 |
 |
25 |
77 |
290 |
BaP | 0.055800 | -0.487 |
| Title | Cluster Plot | Dendrogram | e-value | e-value | e-value | Condition | Condition FDR | Condition Difference |
|---|---|---|---|---|---|---|---|---|
| Thaps_hclust_0468 |
 |
 |
0.0023 |
0.08 |
2.3 |
exponential_vs_stationary_24light | 0.062000 | -0.487 |
| Title | Cluster Plot | Dendrogram | e-value | e-value | e-value | Condition | Condition FDR | Condition Difference |
|---|---|---|---|---|---|---|---|---|
| Thaps_hclust_0054 |
 |
 |
1.6e-17 |
0.0000000000053 |
0.000000000000024 |
lowSi_TMEVA | 0.372000 | -0.487 |
| Thaps_hclust_0054 |
|
|
1.6e-17 |
0.0000000000053 |
0.000000000000024 |
diel_light_vs_dark | 0.016000 | -0.509 |
| Title | Cluster Plot | Dendrogram | e-value | e-value | e-value | Condition | Condition FDR | Condition Difference |
|---|---|---|---|---|---|---|---|---|
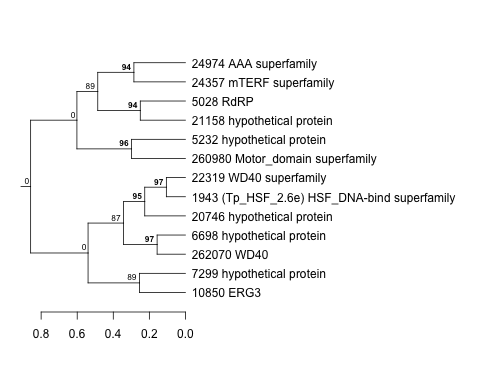
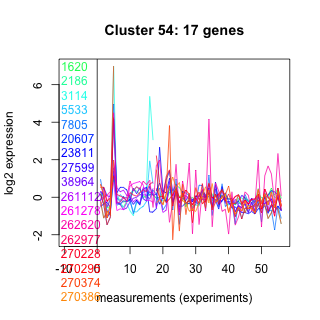
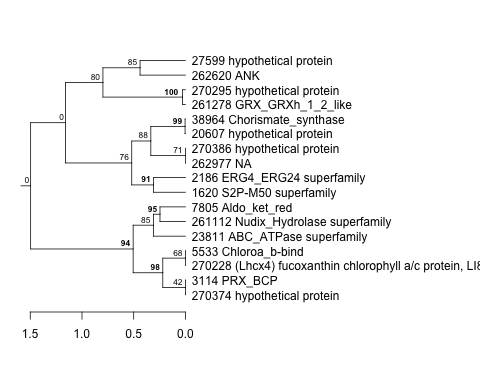
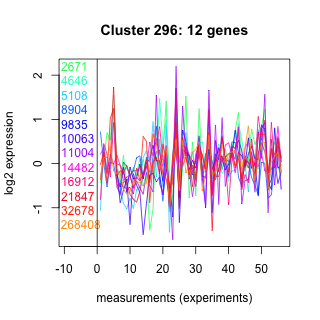
| Thaps_hclust_0296 |
 |
 |
0.17 |
1.8 |
0.83 |
co2_elevated_stat_arrays | 0.062000 | -0.487 |
| Title | Cluster Plot | Dendrogram | e-value | e-value | e-value | Condition | Condition FDR | Condition Difference |
|---|---|---|---|---|---|---|---|---|
| Thaps_hclust_0020 |
 |
 |
0.004 |
0.15 |
3.3 |
lowSi_TMEVA | 0.259000 | -0.488 |
| Title | Cluster Plot | Dendrogram | e-value | e-value | e-value | Condition | Condition FDR | Condition Difference |
|---|---|---|---|---|---|---|---|---|
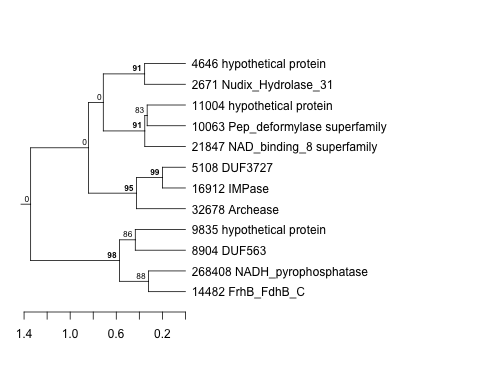
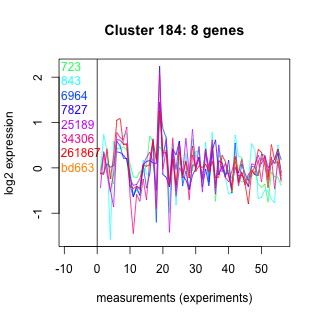
| Thaps_hclust_0184 |
 |
 |
80 |
320 |
240 |
lowSi_TMEVA | 0.500000 | -0.488 |
| Title | Cluster Plot | Dendrogram | e-value | e-value | e-value | Condition | Condition FDR | Condition Difference |
|---|---|---|---|---|---|---|---|---|
| Thaps_hclust_0038 |
 |
 |
0.0016 |
0.024 |
17 |
diel_light_vs_dark | 0.071000 | -0.488 |
| Title | Cluster Plot | Dendrogram | e-value | e-value | e-value | Condition | Condition FDR | Condition Difference |
|---|---|---|---|---|---|---|---|---|
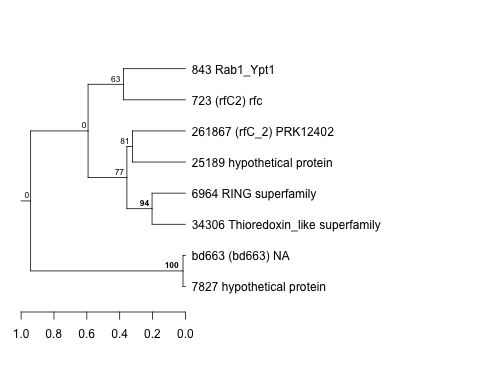
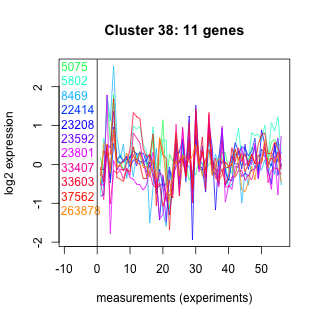
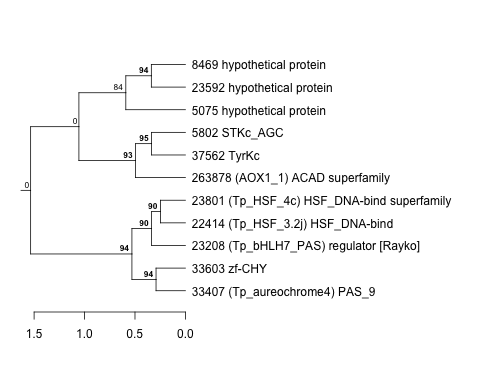
| Thaps_hclust_0416 |
 |
 |
0.00000015 |
0.00000035 |
0.7 |
exponential_vs_stationary_24highlight | 0.000526 | -0.488 |
| Title | Cluster Plot | Dendrogram | e-value | e-value | e-value | Condition | Condition FDR | Condition Difference |
|---|---|---|---|---|---|---|---|---|
| Thaps_hclust_0009 |
 |
 |
0.0000023 |
0.0000027 |
0.000035 |
lowFe_KTKB_Day3 | 0.003620 | -0.489 |
| Title | Cluster Plot | Dendrogram | e-value | e-value | e-value | Condition | Condition FDR | Condition Difference |
|---|---|---|---|---|---|---|---|---|
| Thaps_hclust_0068 |
 |
 |
0.34 |
36 |
100 |
lowtemp_TMEVA | 0.110000 | -0.489 |
| Title | Cluster Plot | Dendrogram | e-value | e-value | e-value | Condition | Condition FDR | Condition Difference |
|---|---|---|---|---|---|---|---|---|
| Thaps_hclust_0213 |
 |
 |
0.0000045 |
0.075 |
0.54 |
diel_exponential_vs_stationary | 0.000602 | -0.489 |
| Thaps_hclust_0213 |
|
|
0.0000045 |
0.075 |
0.54 |
co2_elevated_stat_arrays | 0.000658 | -0.49 |
| Title | Cluster Plot | Dendrogram | e-value | e-value | e-value | Condition | Condition FDR | Condition Difference |
|---|---|---|---|---|---|---|---|---|
| Thaps_hclust_0487 |
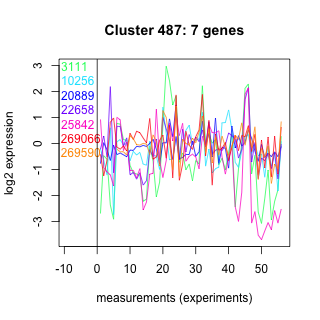 |
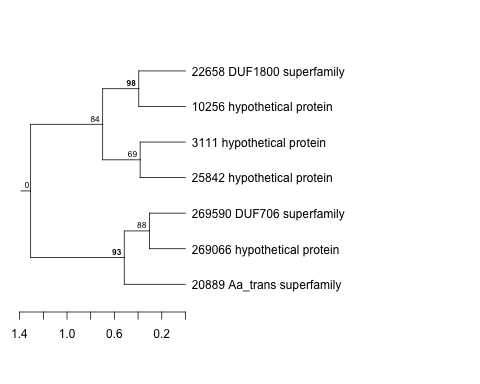 |
2.2 |
14 |
320 |
lowFe_TMEVA | 0.251000 | -0.49 |
| Title | Cluster Plot | Dendrogram | e-value | e-value | e-value | Condition | Condition FDR | Condition Difference |
|---|---|---|---|---|---|---|---|---|
| Thaps_hclust_0397 |
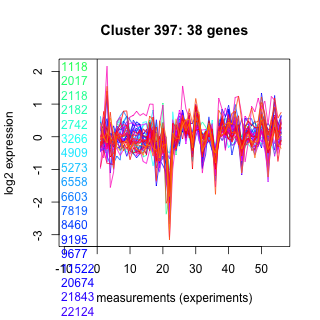 |
 |
0.00003 |
0.00016 |
0.0062 |
diel_exponential_vs_stationary | 0.000602 | -0.49 |
| Title | Cluster Plot | Dendrogram | e-value | e-value | e-value | Condition | Condition FDR | Condition Difference |
|---|---|---|---|---|---|---|---|---|
| Thaps_hclust_0370 |
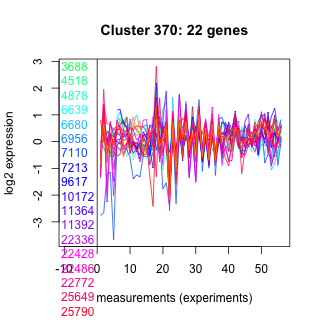 |
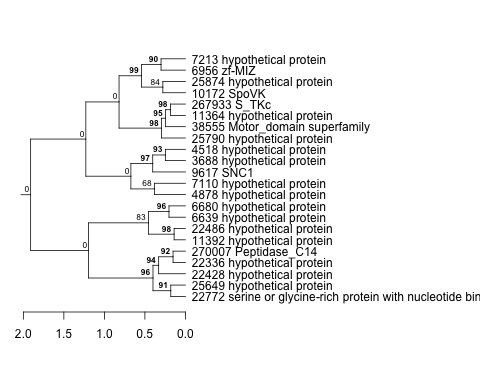 |
0.55 |
1 |
7 |
lowtemp_TMEVA | 0.041600 | -0.49 |
| Title | Cluster Plot | Dendrogram | e-value | e-value | e-value | Condition | Condition FDR | Condition Difference |
|---|---|---|---|---|---|---|---|---|
| Thaps_hclust_0280 |
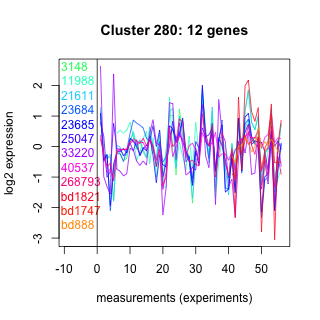 |
 |
0.75 |
0.64 |
81 |
lowtemp_TMEVA | 0.145000 | -0.49 |
| Title | Cluster Plot | Dendrogram | e-value | e-value | e-value | Condition | Condition FDR | Condition Difference |
|---|---|---|---|---|---|---|---|---|
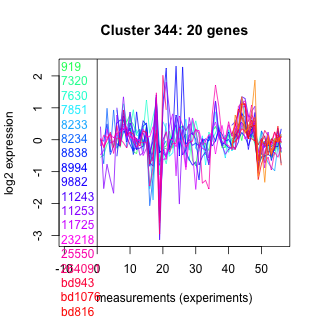
| Thaps_hclust_0344 |
 |
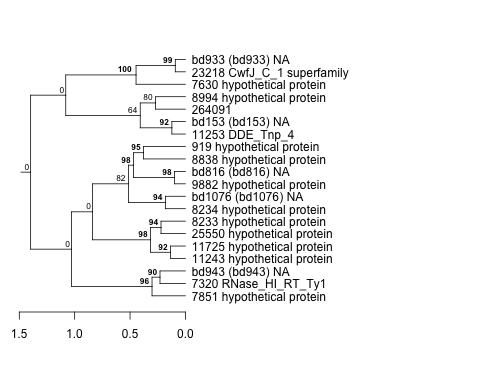 |
7.9 |
94 |
120 |
lowFe_KTKB_Day5 | 0.008180 | -0.49 |
| Title | Cluster Plot | Dendrogram | e-value | e-value | e-value | Condition | Condition FDR | Condition Difference |
|---|---|---|---|---|---|---|---|---|
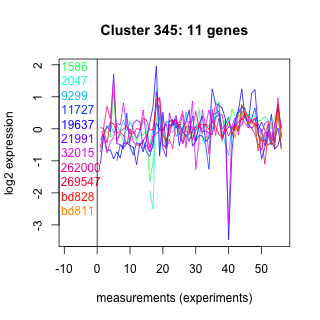
| Thaps_hclust_0345 |
 |
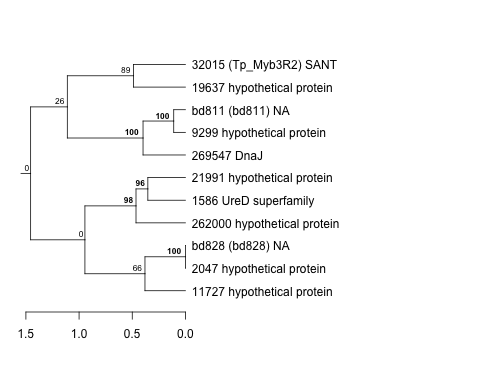 |
1.1 |
7 |
2.7 |
lowFe_KTKB_Day5 | 0.071600 | -0.491 |
| Title | Cluster Plot | Dendrogram | e-value | e-value | e-value | Condition | Condition FDR | Condition Difference |
|---|---|---|---|---|---|---|---|---|
| Thaps_hclust_0244 |
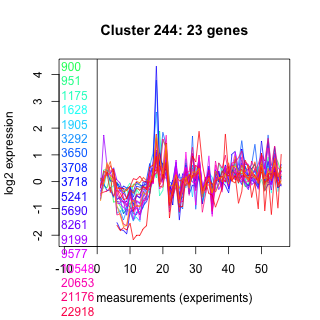 |
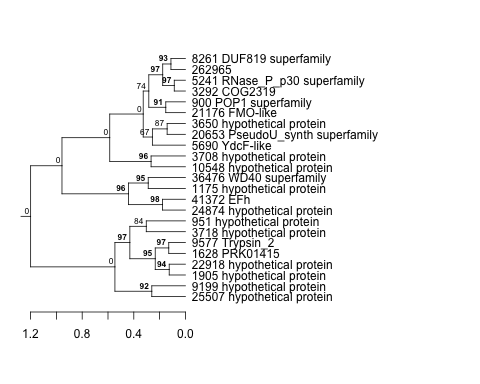 |
0.000000057 |
0.0001 |
4.1 |
exponential_vs_stationary_24light | 0.089400 | -0.492 |
| Title | Cluster Plot | Dendrogram | e-value | e-value | e-value | Condition | Condition FDR | Condition Difference |
|---|---|---|---|---|---|---|---|---|
| Thaps_hclust_0382 |
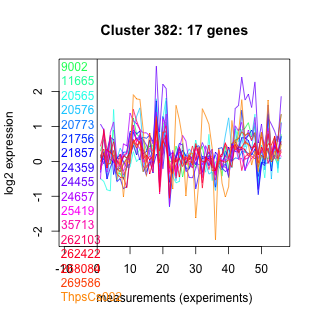 |
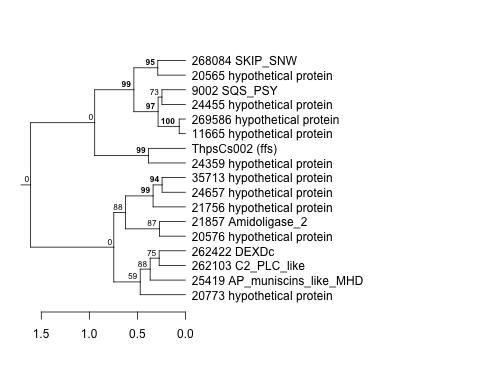 |
0.0000042 |
0.012 |
0.055 |
exponential_vs_stationary_24light | 0.138000 | -0.492 |
| Title | Cluster Plot | Dendrogram | e-value | e-value | e-value | Condition | Condition FDR | Condition Difference |
|---|---|---|---|---|---|---|---|---|
| Thaps_hclust_0496 |
 |
 |
0.00082 |
0.0031 |
0.43 |
lowFe_KTKB_Day5 | 0.004170 | -0.493 |
| Title | Cluster Plot | Dendrogram | e-value | e-value | e-value | Condition | Condition FDR | Condition Difference |
|---|---|---|---|---|---|---|---|---|
| Thaps_hclust_0162 |
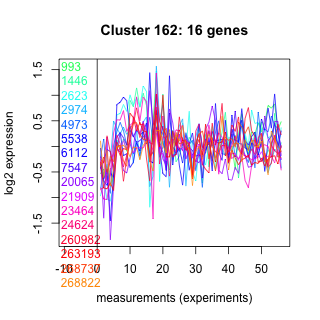 |
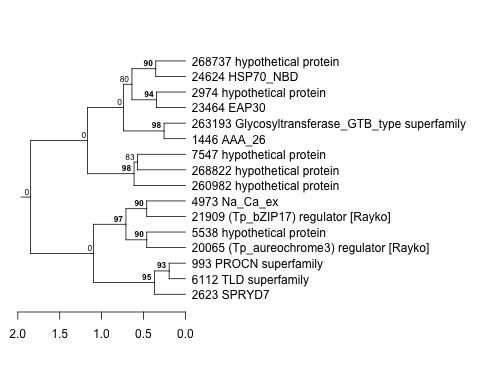 |
0.032 |
3.2 |
58 |
lowN_TMEVA | 0.176000 | -0.493 |
| Title | Cluster Plot | Dendrogram | e-value | e-value | e-value | Condition | Condition FDR | Condition Difference |
|---|---|---|---|---|---|---|---|---|
| Thaps_hclust_0108 |
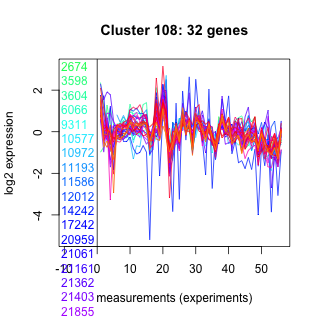 |
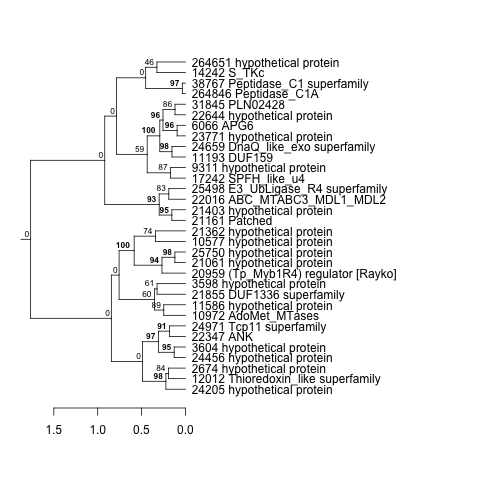 |
0.0000001 |
0.013 |
4 |
lowtemp_TMEVA | 0.016200 | -0.494 |
| Thaps_hclust_0108 |
|
|
0.0000001 |
0.013 |
4 |
diel_exponential_vs_stationary | 0.000602 | -0.501 |
| Title | Cluster Plot | Dendrogram | e-value | e-value | e-value | Condition | Condition FDR | Condition Difference |
|---|---|---|---|---|---|---|---|---|
| Thaps_hclust_0097 |
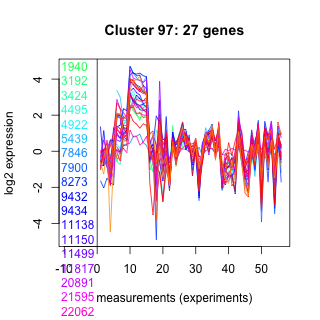 |
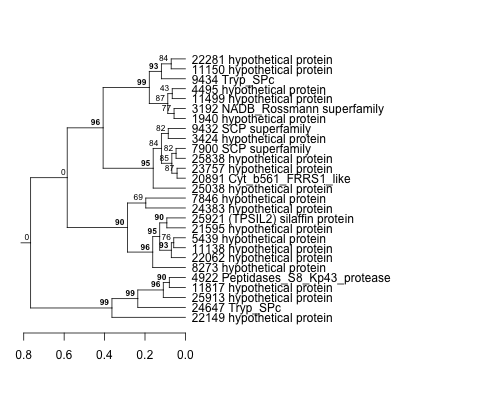 |
0.02 |
1.4 |
3.4 |
highpH_TMEVA | 0.000725 | -0.494 |
| Title | Cluster Plot | Dendrogram | e-value | e-value | e-value | Condition | Condition FDR | Condition Difference |
|---|---|---|---|---|---|---|---|---|
| Thaps_hclust_0026 |
 |
 |
0.0021 |
0.16 |
0.32 |
highlight_arrays | 0.019700 | -0.494 |
| Thaps_hclust_0026 |
|
|
0.0021 |
0.16 |
0.32 |
diel_light_vs_dark | 0.064300 | -0.499 |
| Title | Cluster Plot | Dendrogram | e-value | e-value | e-value | Condition | Condition FDR | Condition Difference |
|---|---|---|---|---|---|---|---|---|
| Thaps_hclust_0034 |
 |
 |
0.000015 |
0.000083 |
0.63 |
BaP | 0.020700 | -0.495 |
| Title | Cluster Plot | Dendrogram | e-value | e-value | e-value | Condition | Condition FDR | Condition Difference |
|---|---|---|---|---|---|---|---|---|
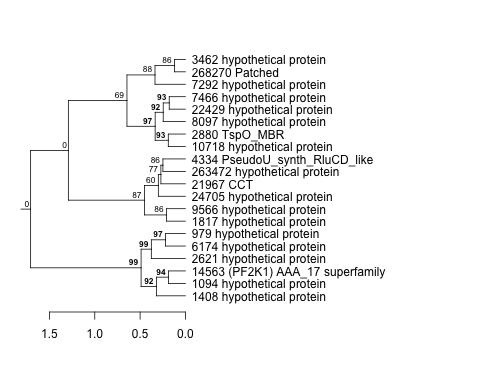
| Thaps_hclust_0146 |
 |
 |
0.00000000081 |
0.000016 |
0.0025 |
lowtemp_TMEVA | 0.020400 | -0.495 |
| Title | Cluster Plot | Dendrogram | e-value | e-value | e-value | Condition | Condition FDR | Condition Difference |
|---|---|---|---|---|---|---|---|---|
| Thaps_hclust_0482 |
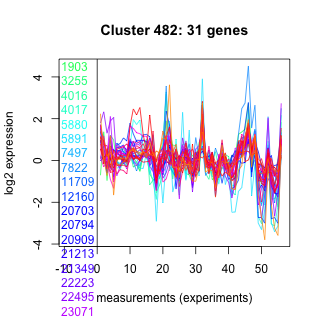 |
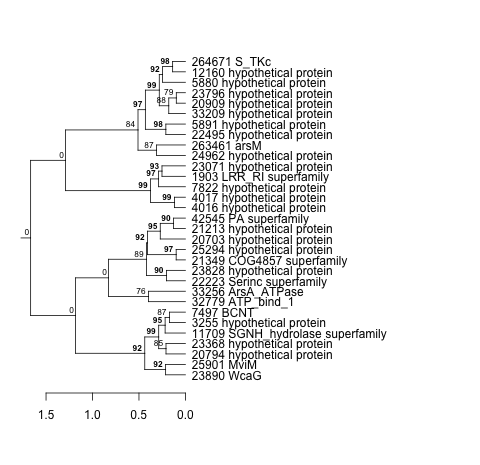 |
0.29 |
0.69 |
2.1 |
exponential_vs_stationary_24highlight | 0.000526 | -0.495 |
| Title | Cluster Plot | Dendrogram | e-value | e-value | e-value | Condition | Condition FDR | Condition Difference |
|---|---|---|---|---|---|---|---|---|
| Thaps_hclust_0425 |
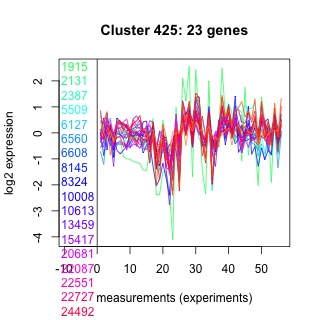 |
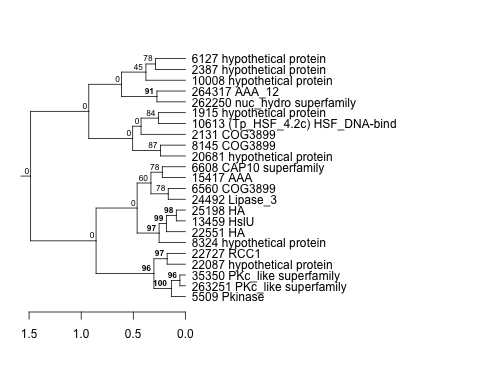 |
0.017 |
1.1 |
140 |
diel_light_vs_dark | 0.005770 | -0.496 |
| Title | Cluster Plot | Dendrogram | e-value | e-value | e-value | Condition | Condition FDR | Condition Difference |
|---|---|---|---|---|---|---|---|---|
| Thaps_hclust_0080 |
 |
 |
0.000037 |
0.000075 |
0.96 |
highpH_TMEVA | 0.001370 | -0.496 |
| Title | Cluster Plot | Dendrogram | e-value | e-value | e-value | Condition | Condition FDR | Condition Difference |
|---|---|---|---|---|---|---|---|---|
| Thaps_hclust_0279 |
 |
 |
2.7 |
22 |
38 |
BaP | 0.081600 | -0.497 |
| Title | Cluster Plot | Dendrogram | e-value | e-value | e-value | Condition | Condition FDR | Condition Difference |
|---|---|---|---|---|---|---|---|---|
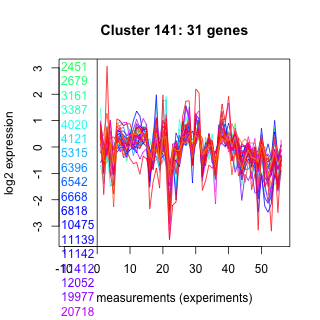
| Thaps_hclust_0141 |
 |
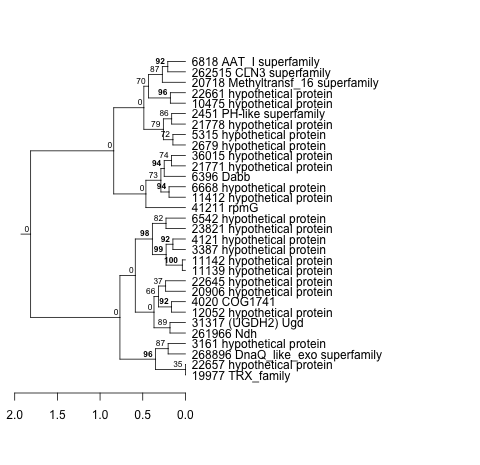 |
0.000021 |
0.0007 |
0.0051 |
exponential_vs_stationary_24light | 0.051800 | -0.497 |
| Title | Cluster Plot | Dendrogram | e-value | e-value | e-value | Condition | Condition FDR | Condition Difference |
|---|---|---|---|---|---|---|---|---|
| Thaps_hclust_0144 |
 |
 |
0.000000001 |
0.0000000019 |
0.00000019 |
exponential_vs_stationary_24light | 0.021700 | -0.498 |
| Thaps_hclust_0144 |
|
|
0.000000001 |
0.0000000019 |
0.00000019 |
BaP | 0.000709 | -0.508 |
| Title | Cluster Plot | Dendrogram | e-value | e-value | e-value | Condition | Condition FDR | Condition Difference |
|---|---|---|---|---|---|---|---|---|
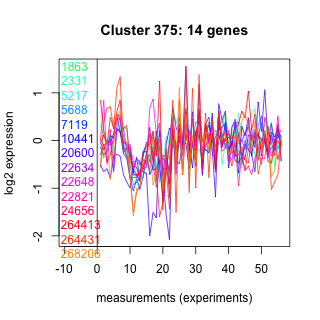
| Thaps_hclust_0375 |
 |
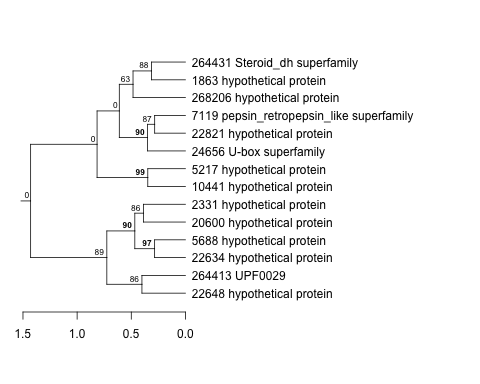 |
1.8 |
2.9 |
40 |
BaP | 0.044400 | -0.499 |
| Title | Cluster Plot | Dendrogram | e-value | e-value | e-value | Condition | Condition FDR | Condition Difference |
|---|---|---|---|---|---|---|---|---|
| Thaps_hclust_0186 |
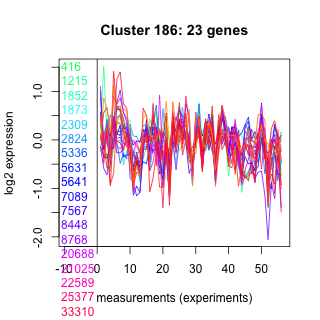 |
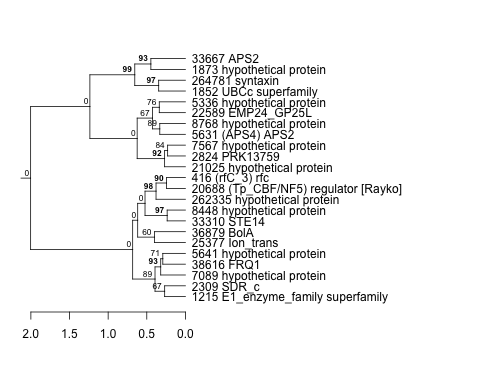 |
0.0000000043 |
0.006 |
0.0000084 |
co2_elevated_stat_arrays | 0.009910 | -0.499 |
| Title | Cluster Plot | Dendrogram | e-value | e-value | e-value | Condition | Condition FDR | Condition Difference |
|---|---|---|---|---|---|---|---|---|
| Thaps_hclust_0470 |
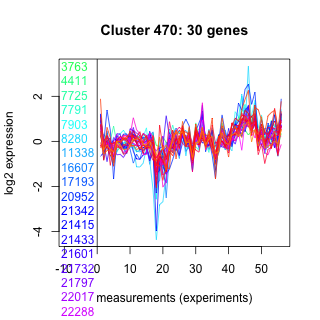 |
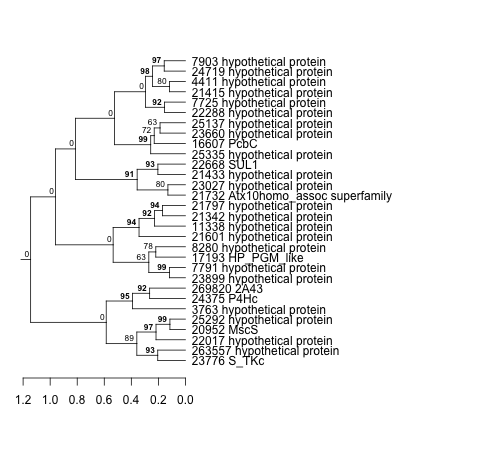 |
0.0000048 |
0.00021 |
0.086 |
lowtemp_TMEVA | 0.014800 | -0.5 |
| Title | Cluster Plot | Dendrogram | e-value | e-value | e-value | Condition | Condition FDR | Condition Difference |
|---|---|---|---|---|---|---|---|---|
| Thaps_hclust_0400 |
 |
 |
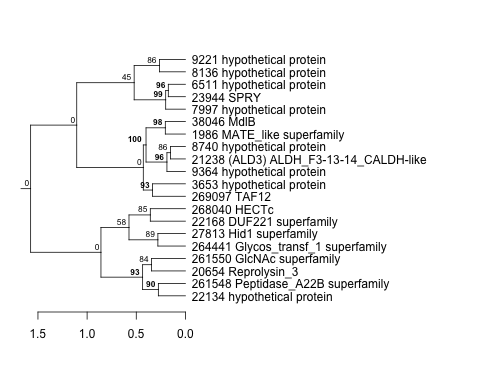
Not available | Not available | Not available | lowFe_TMEVA | 0.006030 | -0.5 |
| Title | Cluster Plot | Dendrogram | e-value | e-value | e-value | Condition | Condition FDR | Condition Difference |
|---|---|---|---|---|---|---|---|---|
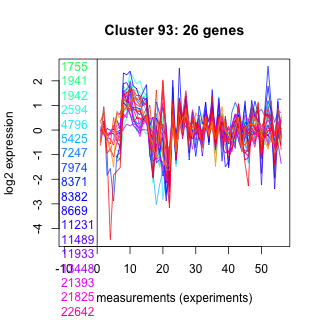
| Thaps_hclust_0093 |
 |
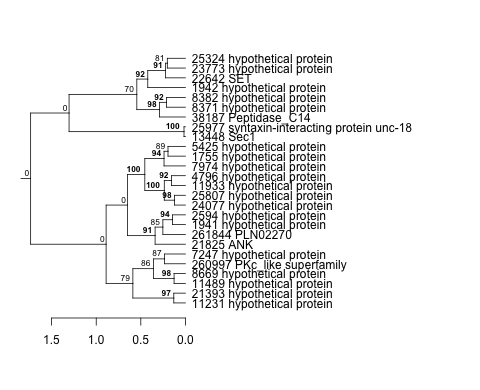 |
0.0000082 |
0.022 |
0.0012 |
lowN_TMEVA | 0.077300 | -0.5 |
| Title | Cluster Plot | Dendrogram | e-value | e-value | e-value | Condition | Condition FDR | Condition Difference |
|---|---|---|---|---|---|---|---|---|
| Thaps_hclust_0152 |
 |
 |
0.00015 |
0.00023 |
0.031 |
diel_light_vs_dark | 0.100000 | -0.5 |
| Title | Cluster Plot | Dendrogram | e-value | e-value | e-value | Condition | Condition FDR | Condition Difference |
|---|---|---|---|---|---|---|---|---|
| Thaps_hclust_0172 |
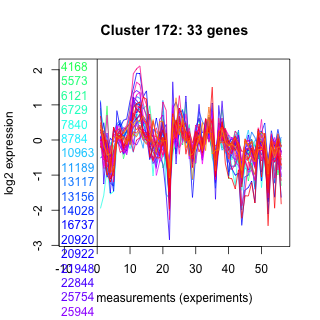 |
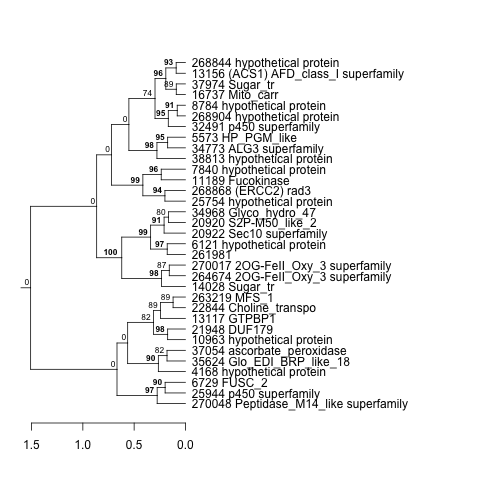 |
0.000001 |
0.000011 |
0.014 |
lowtemp_TMEVA | 0.013400 | -0.5 |
| Thaps_hclust_0172 |
|
|
0.000001 |
0.000011 |
0.014 |
co2_elevated_stat_arrays | 0.000658 | -0.521 |
| Title | Cluster Plot | Dendrogram | e-value | e-value | e-value | Condition | Condition FDR | Condition Difference |
|---|---|---|---|---|---|---|---|---|
| Thaps_hclust_0029 |
 |
|
9.1e-19 |
4.9e-16 |
0.00000000044 |
lowFe_TMEVA | 0.001040 | -0.5 |
| Title | Cluster Plot | Dendrogram | e-value | e-value | e-value | Condition | Condition FDR | Condition Difference |
|---|---|---|---|---|---|---|---|---|
| Thaps_hclust_0356 |
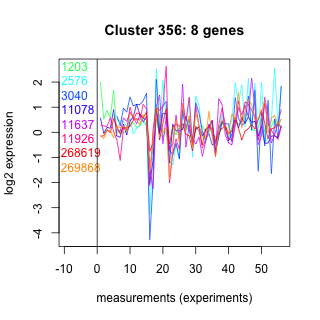 |
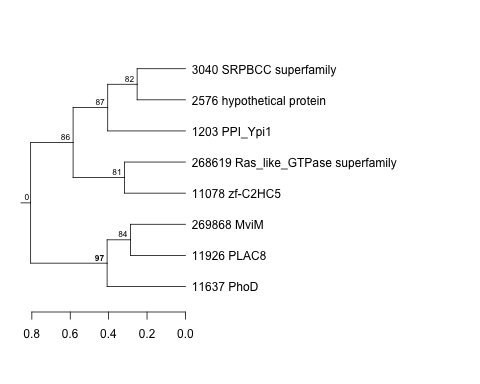 |
2.1 |
41 |
71 |
exponential_vs_stationary_24light | 0.291000 | -0.5 |
| Title | Cluster Plot | Dendrogram | e-value | e-value | e-value | Condition | Condition FDR | Condition Difference |
|---|---|---|---|---|---|---|---|---|
| Thaps_hclust_0145 |
 |
 |
0.015 |
1.6 |
11 |
lowFe_KTKB_Day5 | 0.150000 | -0.5 |
| Title | Cluster Plot | Dendrogram | e-value | e-value | e-value | Condition | Condition FDR | Condition Difference |
|---|---|---|---|---|---|---|---|---|
| Thaps_hclust_0484 |
 |
 |
0.024 |
0.26 |
5.1 |
co2_elevated_expo_arrays | 0.001390 | -0.501 |
| Title | Cluster Plot | Dendrogram | e-value | e-value | e-value | Condition | Condition FDR | Condition Difference |
|---|---|---|---|---|---|---|---|---|
| Thaps_hclust_0100 |
 |
 |
0.00000073 |
0.000076 |
2.6 |
lowSi_TMEVA | 0.332000 | -0.502 |
| Title | Cluster Plot | Dendrogram | e-value | e-value | e-value | Condition | Condition FDR | Condition Difference |
|---|---|---|---|---|---|---|---|---|
| Thaps_hclust_0362 |
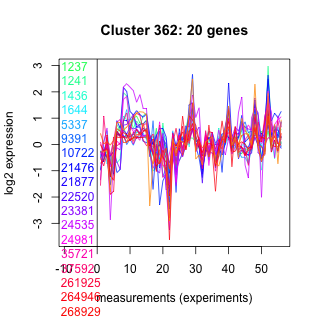 |
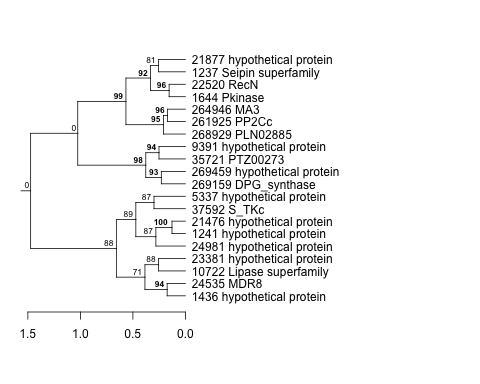 |
0.00003 |
0.0033 |
0.66 |
highpH_TMEVA | 0.003090 | -0.502 |
| Title | Cluster Plot | Dendrogram | e-value | e-value | e-value | Condition | Condition FDR | Condition Difference |
|---|---|---|---|---|---|---|---|---|
| Thaps_hclust_0374 |
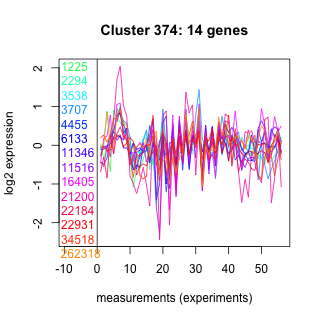 |
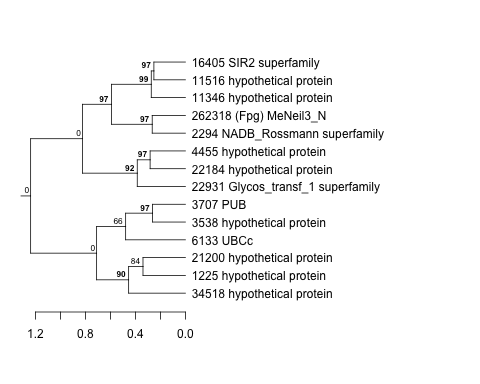 |
1.4 |
19 |
50 |
diel_exponential_vs_stationary | 0.014900 | -0.502 |
| Title | Cluster Plot | Dendrogram | e-value | e-value | e-value | Condition | Condition FDR | Condition Difference |
|---|---|---|---|---|---|---|---|---|
| Thaps_hclust_0023 |
 |
 |
0.000000000039 |
0.0000072 |
0.002 |
diel_light_vs_dark | 0.000485 | -0.503 |
| Title | Cluster Plot | Dendrogram | e-value | e-value | e-value | Condition | Condition FDR | Condition Difference |
|---|---|---|---|---|---|---|---|---|
| Thaps_hclust_0412 |
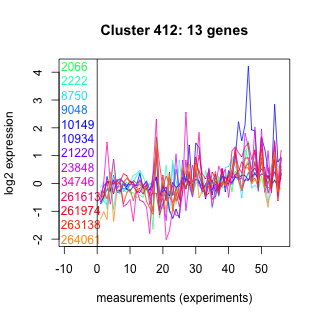 |
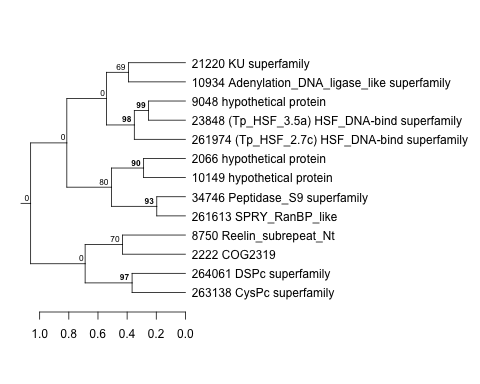 |
0.39 |
17 |
2.9 |
lowFe_KTKB_Day3 | 0.081500 | -0.505 |
| Title | Cluster Plot | Dendrogram | e-value | e-value | e-value | Condition | Condition FDR | Condition Difference |
|---|---|---|---|---|---|---|---|---|
| Thaps_hclust_0196 |
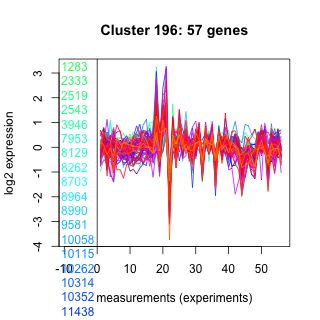 |
 |
0.0000000000000088 |
0.00000034 |
0.000017 |
co2_elevated_stat_arrays | 0.000658 | -0.505 |
| Title | Cluster Plot | Dendrogram | e-value | e-value | e-value | Condition | Condition FDR | Condition Difference |
|---|---|---|---|---|---|---|---|---|
| Thaps_hclust_0036 |
 |
 |
0.0000003 |
0.00016 |
110 |
lowtemp_TMEVA | 0.010800 | -0.505 |
| Title | Cluster Plot | Dendrogram | e-value | e-value | e-value | Condition | Condition FDR | Condition Difference |
|---|---|---|---|---|---|---|---|---|
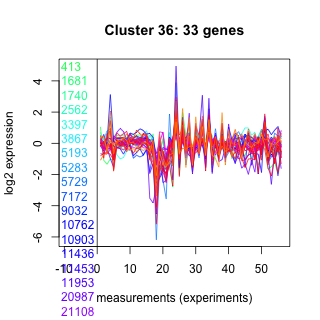
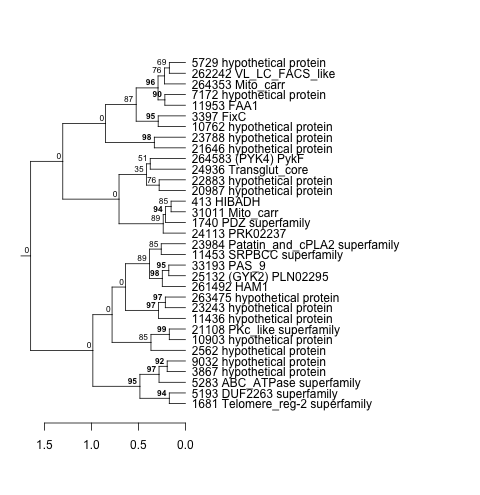
| Thaps_hclust_0256 |
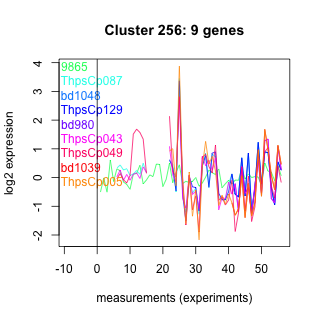 |
 |
0.0000000000016 |
0.0000000000033 |
0.0000000000017 |
highpH_TMEVA | 0.031100 | -0.505 |
| Thaps_hclust_0256 |
|
|
0.0000000000016 |
0.0000000000033 |
0.0000000000017 |
lowN_TMEVA | 0.261000 | -0.508 |
| Title | Cluster Plot | Dendrogram | e-value | e-value | e-value | Condition | Condition FDR | Condition Difference |
|---|---|---|---|---|---|---|---|---|
| Thaps_hclust_0013 |
 |
 |
0.000000021 |
0.00018 |
0.025 |
lowN_TMEVA | 0.053900 | -0.505 |
| Title | Cluster Plot | Dendrogram | e-value | e-value | e-value | Condition | Condition FDR | Condition Difference |
|---|---|---|---|---|---|---|---|---|
| Thaps_hclust_0432 |
 |
 |
0.011 |
0.06 |
2.4 |
lowFe_KTKB_Day3 | 0.023300 | -0.505 |
| Title | Cluster Plot | Dendrogram | e-value | e-value | e-value | Condition | Condition FDR | Condition Difference |
|---|---|---|---|---|---|---|---|---|
| Thaps_hclust_0278 |
 |
 |
0.093 |
0.57 |
39 |
highpH_TMEVA | 0.044600 | -0.505 |
| Title | Cluster Plot | Dendrogram | e-value | e-value | e-value | Condition | Condition FDR | Condition Difference |
|---|---|---|---|---|---|---|---|---|
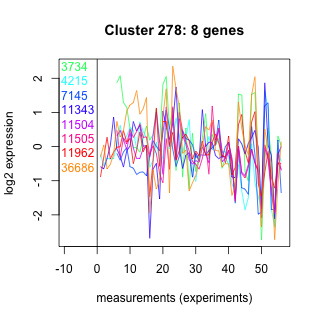
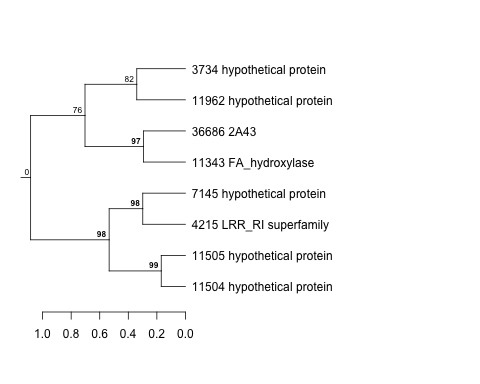
| Thaps_hclust_0481 |
 |
 |
0.000000069 |
0.00000053 |
0.000012 |
exponential_vs_stationary_24highlight | 0.000526 | -0.506 |
| Title | Cluster Plot | Dendrogram | e-value | e-value | e-value | Condition | Condition FDR | Condition Difference |
|---|---|---|---|---|---|---|---|---|
| Thaps_hclust_0086 |
 |
 |
0.0000000068 |
0.01 |
0.0037 |
highpH_TMEVA | 0.000725 | -0.507 |
| Title | Cluster Plot | Dendrogram | e-value | e-value | e-value | Condition | Condition FDR | Condition Difference |
|---|---|---|---|---|---|---|---|---|
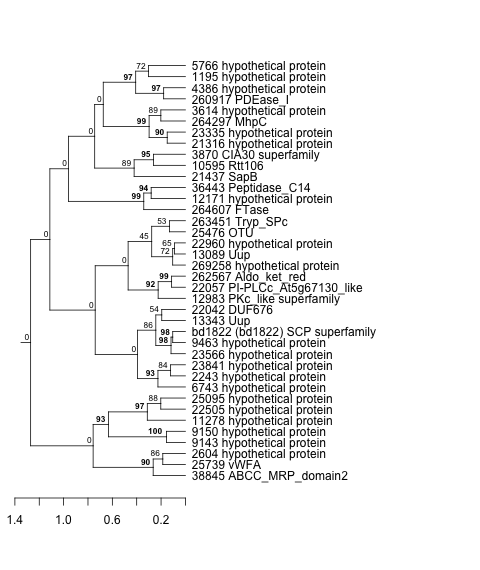
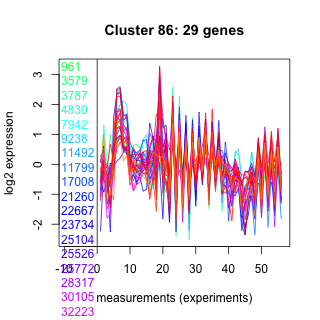
| Thaps_hclust_0133 |
 |
 |
0.95 |
2.2 |
2.4 |
lowtemp_TMEVA | 0.024200 | -0.507 |
| Thaps_hclust_0133 |
|
|
0.95 |
2.2 |
2.4 |
co2_elevated_stat_arrays | 0.002130 | -0.517 |
| Title | Cluster Plot | Dendrogram | e-value | e-value | e-value | Condition | Condition FDR | Condition Difference |
|---|---|---|---|---|---|---|---|---|
| Thaps_hclust_0473 |
 |
 |
0.00036 |
0.0036 |
0.68 |
lowtemp_TMEVA | 0.017400 | -0.507 |
| Title | Cluster Plot | Dendrogram | e-value | e-value | e-value | Condition | Condition FDR | Condition Difference |
|---|---|---|---|---|---|---|---|---|
| Thaps_hclust_0465 |
 |
 |
0.011 |
0.053 |
0.75 |
lowtemp_TMEVA | 0.013400 | -0.508 |
| Title | Cluster Plot | Dendrogram | e-value | e-value | e-value | Condition | Condition FDR | Condition Difference |
|---|---|---|---|---|---|---|---|---|
| Thaps_hclust_0378 |
 |
 |
0.0003 |
210 |
10 |
highlight_arrays | 0.007890 | -0.508 |
| Title | Cluster Plot | Dendrogram | e-value | e-value | e-value | Condition | Condition FDR | Condition Difference |
|---|---|---|---|---|---|---|---|---|
| Thaps_hclust_0164 |
 |
 |
13 |
58 |
65 |
lowN_TMEVA | 0.219000 | -0.509 |
| Title | Cluster Plot | Dendrogram | e-value | e-value | e-value | Condition | Condition FDR | Condition Difference |
|---|---|---|---|---|---|---|---|---|
| Thaps_hclust_0177 |
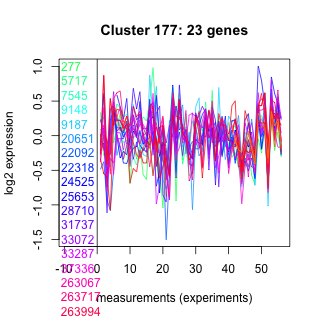 |
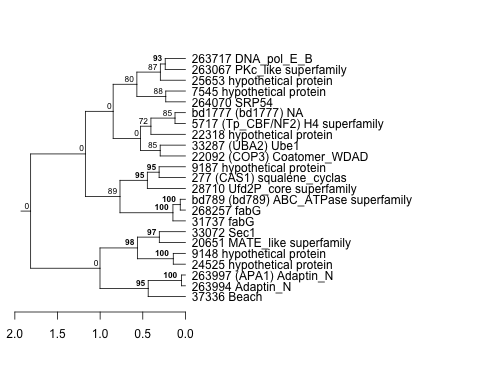 |
0.0000000012 |
0.0000078 |
0.00084 |
lowN_TMEVA | 0.090400 | -0.509 |
| Title | Cluster Plot | Dendrogram | e-value | e-value | e-value | Condition | Condition FDR | Condition Difference |
|---|---|---|---|---|---|---|---|---|
| Thaps_hclust_0343 |
 |
 |
9.7e-16 |
0.000000023 |
0.0000000024 |
lowFe_KTKB_Day3 | 0.004290 | -0.509 |
| Title | Cluster Plot | Dendrogram | e-value | e-value | e-value | Condition | Condition FDR | Condition Difference |
|---|---|---|---|---|---|---|---|---|
| Thaps_hclust_0065 |
 |
 |
1.5e-32 |
2.5e-32 |
9.9e-33 |
lowFe_KTKB_Day5 | 0.001320 | -0.51 |
| Thaps_hclust_0065 |
|
|
1.5e-32 |
2.5e-32 |
9.9e-33 |
highpH_TMEVA | 0.000725 | -0.512 |
| Title | Cluster Plot | Dendrogram | e-value | e-value | e-value | Condition | Condition FDR | Condition Difference |
|---|---|---|---|---|---|---|---|---|
| Thaps_hclust_0423 |
 |
 |
0.00046 |
0.13 |
9.2 |
BaP | 0.019800 | -0.51 |
| Title | Cluster Plot | Dendrogram | e-value | e-value | e-value | Condition | Condition FDR | Condition Difference |
|---|---|---|---|---|---|---|---|---|
| Thaps_hclust_0402 |
 |
 |
0.0022 |
5.7 |
0.07 |
lowFe_KTKB_Day3 | 0.020500 | -0.51 |
| Title | Cluster Plot | Dendrogram | e-value | e-value | e-value | Condition | Condition FDR | Condition Difference |
|---|---|---|---|---|---|---|---|---|
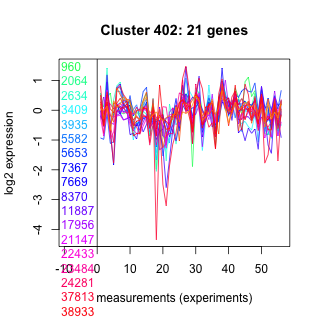
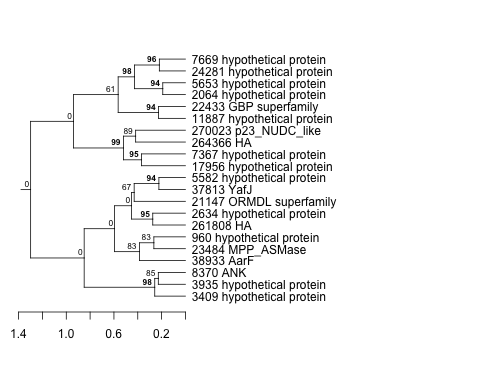
| Thaps_hclust_0192 |
 |
 |
0.000012 |
0.017 |
1.3 |
co2_elevated_stat_arrays | 0.025000 | -0.511 |
| Title | Cluster Plot | Dendrogram | e-value | e-value | e-value | Condition | Condition FDR | Condition Difference |
|---|---|---|---|---|---|---|---|---|
| Thaps_hclust_0220 |
 |
|
|
2.4e-19 |
3.2e-19 |
diel_light_vs_dark | 0.000485 | -0.512 |
| Title | Cluster Plot | Dendrogram | e-value | e-value | e-value | Condition | Condition FDR | Condition Difference |
|---|---|---|---|---|---|---|---|---|
| Thaps_hclust_0082 |
 |
|
8.89825e-43 |
2e-27 |
1.3e-16 |
lowN_TMEVA | 0.001190 | -0.512 |
| Title | Cluster Plot | Dendrogram | e-value | e-value | e-value | Condition | Condition FDR | Condition Difference |
|---|---|---|---|---|---|---|---|---|
| Thaps_hclust_0062 |
 |
 |
0.000000026 |
0.000000021 |
0.000000000021 |
highlight_arrays | 0.074100 | -0.513 |
| Title | Cluster Plot | Dendrogram | e-value | e-value | e-value | Condition | Condition FDR | Condition Difference |
|---|---|---|---|---|---|---|---|---|
| Thaps_hclust_0288 |
 |
 |
0.032 |
0.0067 |
0.047 |
highlight_arrays | 0.002840 | -0.513 |
| Title | Cluster Plot | Dendrogram | e-value | e-value | e-value | Condition | Condition FDR | Condition Difference |
|---|---|---|---|---|---|---|---|---|
| Thaps_hclust_0088 |
 |
 |
0.036 |
27 |
18 |
highlight_arrays | 0.003170 | -0.513 |
| Title | Cluster Plot | Dendrogram | e-value | e-value | e-value | Condition | Condition FDR | Condition Difference |
|---|---|---|---|---|---|---|---|---|
| Thaps_hclust_0228 |
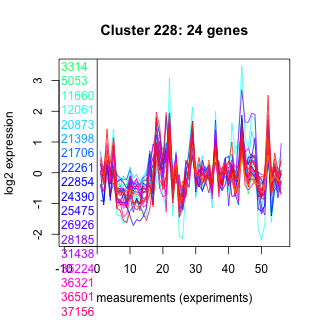 |
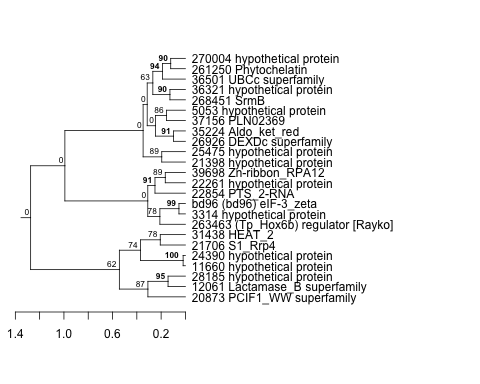 |
0.00000000000028 |
0.0027 |
0.016 |
exponential_vs_stationary_24light | 0.074400 | -0.513 |
| Title | Cluster Plot | Dendrogram | e-value | e-value | e-value | Condition | Condition FDR | Condition Difference |
|---|---|---|---|---|---|---|---|---|
| Thaps_hclust_0067 |
 |
 |
0.0036 |
0.86 |
0.11 |
highlight_arrays | 0.002540 | -0.514 |
| Title | Cluster Plot | Dendrogram | e-value | e-value | e-value | Condition | Condition FDR | Condition Difference |
|---|---|---|---|---|---|---|---|---|
| Thaps_hclust_0132 |
 |
 |
0.00017 |
0.000096 |
26 |
co2_elevated_stat_arrays | 0.002130 | -0.514 |
| Title | Cluster Plot | Dendrogram | e-value | e-value | e-value | Condition | Condition FDR | Condition Difference |
|---|---|---|---|---|---|---|---|---|
| Thaps_hclust_0154 |
 |
 |
0.00015 |
0.0049 |
0.29 |
lowN_TMEVA | 0.097600 | -0.514 |
| Title | Cluster Plot | Dendrogram | e-value | e-value | e-value | Condition | Condition FDR | Condition Difference |
|---|---|---|---|---|---|---|---|---|
| Thaps_hclust_0075 |
 |
 |
0.069 |
53 |
33 |
highpH_TMEVA | 0.012200 | -0.516 |
| Title | Cluster Plot | Dendrogram | e-value | e-value | e-value | Condition | Condition FDR | Condition Difference |
|---|---|---|---|---|---|---|---|---|
| Thaps_hclust_0079 |
 |
 |
0.00048 |
0.000048 |
0.27 |
lowSi_TMEVA | 0.259000 | -0.516 |
| Title | Cluster Plot | Dendrogram | e-value | e-value | e-value | Condition | Condition FDR | Condition Difference |
|---|---|---|---|---|---|---|---|---|
| Thaps_hclust_0408 |
 |
 |
0.3 |
4.9 |
5.3 |
BaP | 0.016600 | -0.517 |
| Title | Cluster Plot | Dendrogram | e-value | e-value | e-value | Condition | Condition FDR | Condition Difference |
|---|---|---|---|---|---|---|---|---|
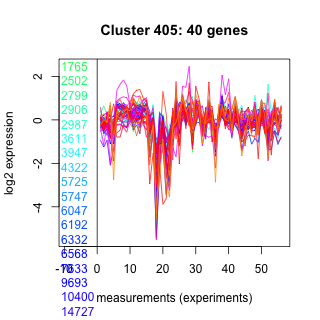
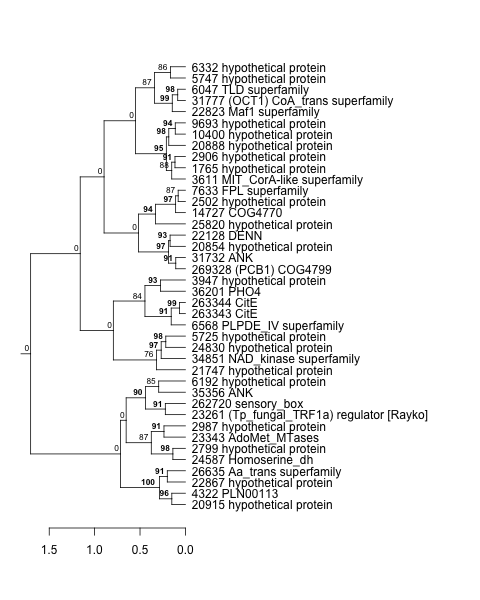
| Thaps_hclust_0405 |
 |
 |
0.00000000036 |
0.0000000063 |
0.005 |
lowFe_KTKB_Day3 | 0.000862 | -0.518 |
| Title | Cluster Plot | Dendrogram | e-value | e-value | e-value | Condition | Condition FDR | Condition Difference |
|---|---|---|---|---|---|---|---|---|
| Thaps_hclust_0117 |
 |
 |
0.0000000000002 |
0.000000021 |
0.00000045 |
diel_light_vs_dark | 0.007840 | -0.519 |
| Title | Cluster Plot | Dendrogram | e-value | e-value | e-value | Condition | Condition FDR | Condition Difference |
|---|---|---|---|---|---|---|---|---|
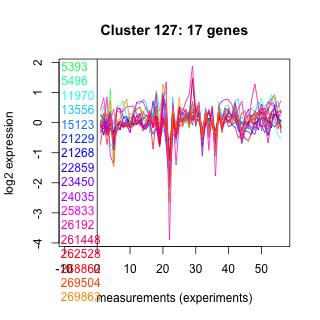
| Thaps_hclust_0127 |
 |
 |
2.6 |
32 |
48 |
diel_exponential_vs_stationary | 0.006030 | -0.519 |
| Title | Cluster Plot | Dendrogram | e-value | e-value | e-value | Condition | Condition FDR | Condition Difference |
|---|---|---|---|---|---|---|---|---|
| Thaps_hclust_0015 |
 |
|
2.5e-25 |
7.4e-21 |
0.0000000011 |
BaP | 0.000370 | -0.519 |
| Title | Cluster Plot | Dendrogram | e-value | e-value | e-value | Condition | Condition FDR | Condition Difference |
|---|---|---|---|---|---|---|---|---|
| Thaps_hclust_0491 |
 |
 |
0.35 |
17 |
52 |
lowFe_KTKB_Day5 | 0.052900 | -0.52 |